Analysis of Falling Object Impact and Fishing Net Drag for Subsea Integrated Fiberglass Protective Structures
Guang Yang1, Haidian Zhang2, Kang Wang2, Fei Wu1, Chao Wang1, Yan Qu2*, Diyi Chen2
1CNOOC Energy Development of Equipment Technology Co.Ltd., Tianjin, China
*Correspondence to: Yan Qu, Professor, School of Marine Science and Engineering, Guangzhou International Campus, South China University of Technology, Guangzhou, 511442, Guangdong, China; E-mail: quyan@scut.edu.cn
Abstract
Objective: This study aims to improve the safety of subsea oil and gas production facilities by designing an integrated fiberglass protective structure. Glass fiber-reinforced materials, noted for their lightweight, high strength, and corrosion resistance, are evaluated for subsea protection applications. The focus is on assessing the structural stability and impact resistance under falling object impacts and fishing net drags.
Methods: A fiberglass protective structure was designed based on the layout and protection needs of subsea oil and gas facilities. Finite element numerical calculations (ABAQUS) analyzed the structure's performance under impact scenarios. Key parameters like deformation and stress responses were evaluated to ensure the design meets safety criteria.
Results: Simulations showed the fiberglass structure performed well under tested conditions. A falling object impact of 0.24s resulted in a maximum deformation of 1,187.6mm and a stress of 172.3MPa. At 0.31s, the highest stress was 228.2MPa, with a deformation of 1,031.9mm. Under a 50kN drag load, directional load impacts on structural integrity were negligible, indicating robust performance.
Conclusion: The fiberglass protective structure offers excellent stability and impact resistance, effectively protecting subsea facilities. Numerical simulations confirm that the structure meets design requirements, with controlled deformation and stress levels under impact and drag loads, highlighting the potential of fiberglass for offshore applications.
Keywords: fiberglass protective structure, integrated design, falling object impact, fishing net drag, structural safety
1 INTRODUCTION
Subsea oil and gas production facilities are crucial in marine energy development, with their safety directly impacting energy stability and marine environmental protection. The deep-sea environment is complex, exposing facilities to seawater corrosion, current impacts, and external threats such as falling objects, fishing nets (Figure 1), anchor dragging (Figure 2) sand slope accumulation[1].
|
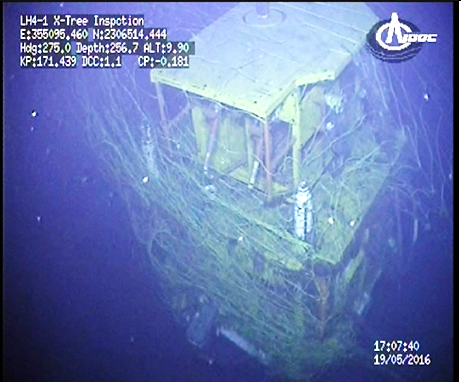
Figure 1. The Christmas Tree is Entangled in Trawl Nets.
|
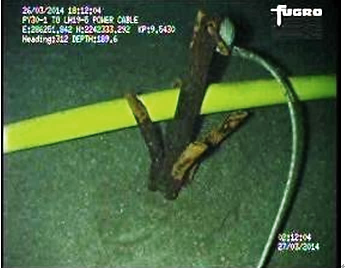
Figure 2. The Umbilical Cable is Damaged by a Falling Anchor.
The design and material selection of external protective structures for subsea equipment are critical. Composite structures are increasingly replacing traditional steel due to their lightweight, high strength, hydrolysis resistance, corrosion resistance, and cost-effectiveness[2,3]. Fiberglass, with its excellent mechanical properties and corrosion resistance, is particularly suitable for these applications[4,5].
Several scholars have extensively researched protective structures for subsea oil and gas facilities[6-8]. For instance, José-Trujillo et al.[9] studied the impact of seawater aging on the mechanical properties of composites with various fiber and matrix types. Rafiq et al.[10] explored the effect of nanoclay on the impact response of glass fiber-reinforced epoxy (GFRE) composites through experiments and simulations. Muzayadah et al.[11] analyzed the effects of seawater and freshwater immersion on the mechanical properties of vinyl ester carbon composites using the VARI method. Additionally, Chen et al.[12] compared durability and mechanical property degradation of large glass fiber structures under different resins, while Chen et al.[13] examined the ultimate bearing capacity of glass fiber-reinforced panels under in-plane loads. However, most existing research focuses on single loads, with limited studies on the performance of glass fiber protective structures under multiple load conditions.
This study employs finite element numerical simulations to analyze the mechanical response of the designed integrated fiberglass protective structure under falling object impact and fishing net towing loads. The results show that the structure meets the required strength and stiffness criteria based on stress distribution and deformation analysis.
This research provides technical support for designing integrated fiberglass protective structures for subsea oil and gas production facilities, offering systematic solutions to enhance their safety. The findings will improve the protective performance of subsea equipment, minimize the impact of accidents, and ensure the safety and stability of oil and gas production operations.
1.1 Subsea Integrated Fiberglass Protective Structure
The primary purpose of the integrated fiberglass protective structure is to protect against impacts from falling objects and fishing net drag. A three-dimensional diagram of the structure as applied on the seabed is shown in Figure 3. The subsea protective structure consists of an integrated model with a large frame and a small frame. In compliance with the requirements of subsea oil and gas production equipment, two holes were cut in each of the three sides of the large frame's fiberboard, and six small holes were cut in the upper fiberboard of the large frame. The thickness of the fiberglass plate on the large frame is 50mm. The small frame has two large holes in the top fiberglass plate, which has a thickness of 20mm.
|
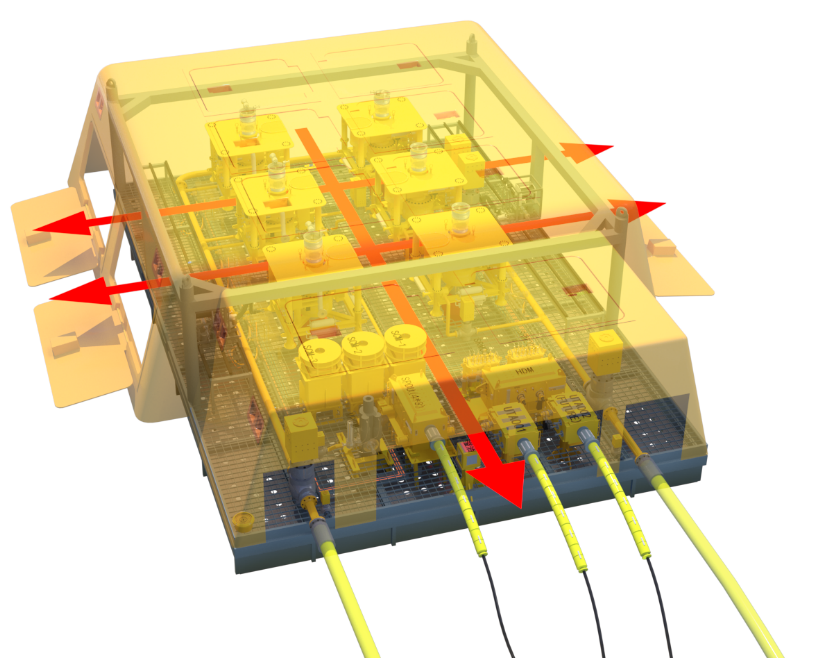
Figure 3. Sub-sea Manifold Layout and Integrated Fiberglass Protective Structure.
2 METHODS AND MATERIALS
The numerical simulation of falling object impacts is a complex process, involving both material nonlinearity and state nonlinearity. ABAQUS software, with its robust capabilities for nonlinear analysis, was employed in this study to establish a model of an subsea fiberglass protection cover. The simulation examines the overall impact resistance under anchor drop impacts and trawl net drag conditions.
The failure criteria used in the calculation process are mainly the Larc05 failure criteria, which include three failure modes: matrix cracking, fiber compression failure, and fiber tension failure.
Matrix Cracking damage:
|
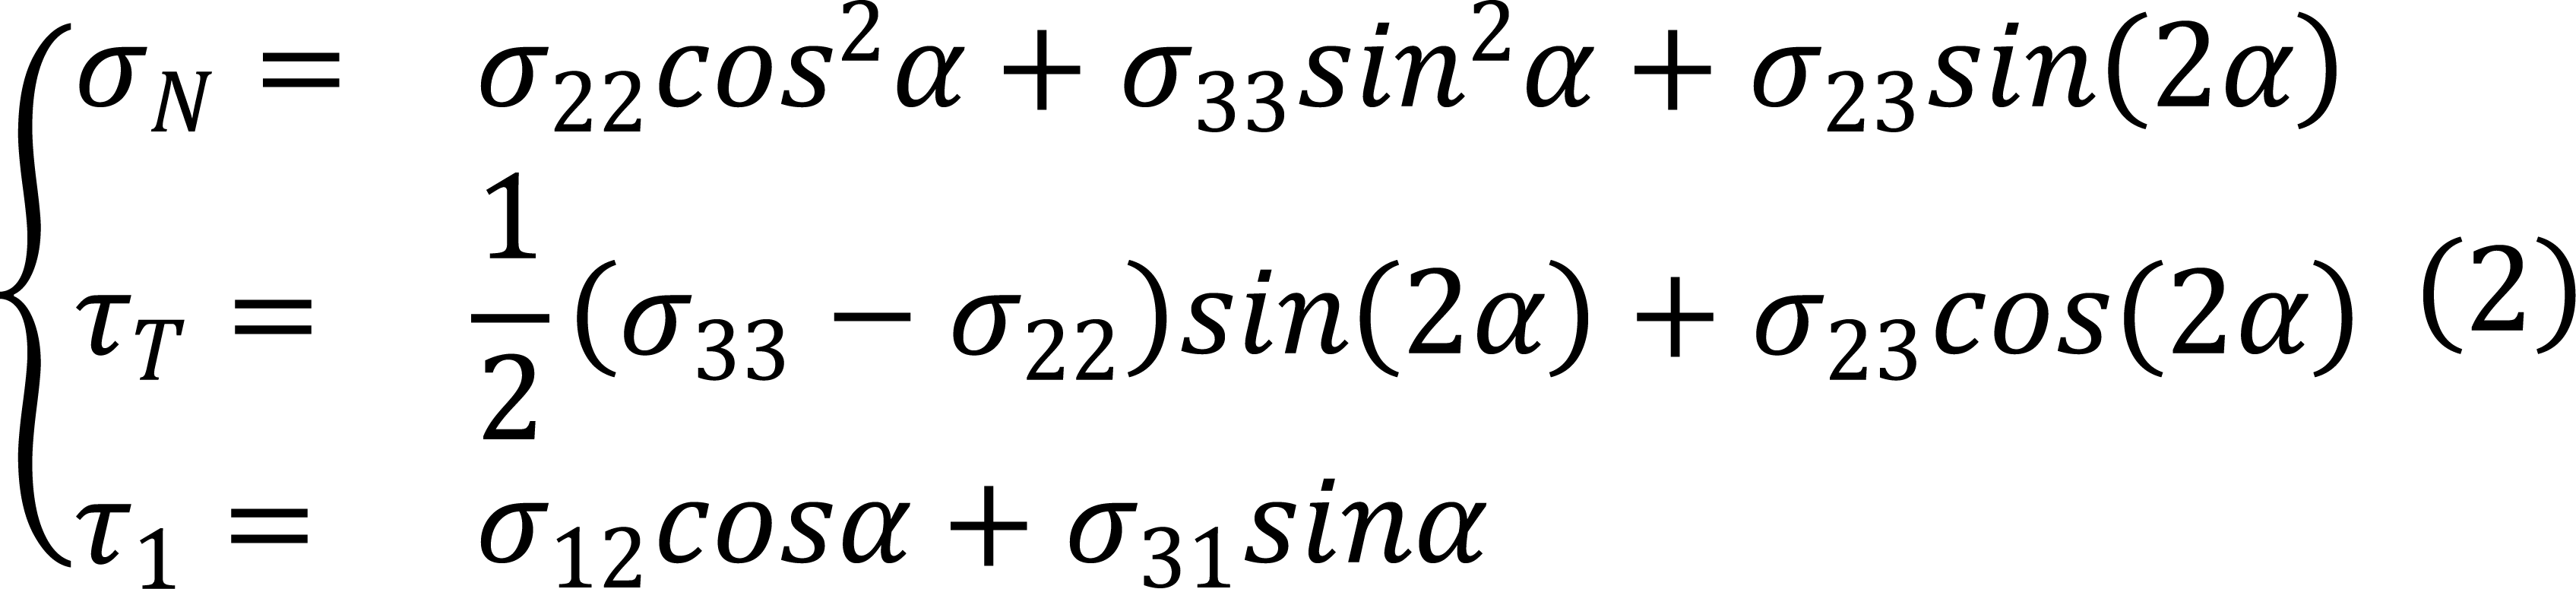
In the formula, τT, τL and σN, are the transverse shear component, longitudinal shear component, and normal transverse tension on the fracture surface, respectively, obtained from Equation (2) through the fracture angle α, taking default value 53°.
|
ηT and ηL are the longitudinal and transverse friction coefficients, which can be calculated from the Equations (3) and (4).
|
|
Fiber tension occurs when σ11≥0:
|
Fiber Compression damage:
|
Fiber Kinking damage occurs when ![]() , and Fiber Splitting damage occurs when
, and Fiber Splitting damage occurs when ![]() , The stress components on the dislocation surface obtained by coordinate transformation of
, The stress components on the dislocation surface obtained by coordinate transformation of ![]() ,
, ![]() and
and ![]() in the formula can be obtained from Equation (7), and the buckling band angle ψ in Equation (8) ranges from 0~180° to maximize the fiber buckling failure index.
in the formula can be obtained from Equation (7), and the buckling band angle ψ in Equation (8) ranges from 0~180° to maximize the fiber buckling failure index.
|
|
According to the Larc05 criterion, when the values from Equations (1), (5) and (6) are less than 1, it indicates that the material has not sustained any damage. When these formula values equal 1, it signifies the initiation of damage in the material.
The horizontal frame, fixture structure, and fixture connection structure are steel structures with a yield strength of 355MPa, elastic modulus of 206,000MPa, Poisson's ratio of 0.3, density of 7.85E-9t/mm3. The relevant material parameters of glass fiber-reinforced plastic are shown in Table 1.
Table 1. Elastic Properties of the Materials
Used for |
Density (T/mm3) |
Elastic modulus (MPa) |
Poisson's ratio |
Tensile strength |
Frame |
1.7E-9 |
17,000 |
0.1 |
500 |
The SI unit system, with millimeters for length, seconds for time, and newtons for force, as well as the relevant derived units, is used for all aspects of the structural design and analysis. Therefore, the unit of stress will be MPa.
2.2 Calculation Load Determination
According to the DNV standards[14], the trawling speed for fishing is specified as 2.8m/s. The maximum trawling speed for offshore fishing vessels in China is 2.5m/s, with multi-plate designs predominantly used for trawl doors. The formula for calculating the maximum horizontal trawling force, Fp is provided by DNV[14].
|
In the equation, Fp: Maximum horizontal force exerted by the trawling equipment, CF: Empirical coefficient, typically taken as 1.28, V: Trawling speed; mt: Mass of the trawl door;
![]() [N/m]:Towing cable strength (where d is the water depth, in meters). For multi-plate trawl doors, the maximum vertical force acting in the downward direction is given by:
[N/m]:Towing cable strength (where d is the water depth, in meters). For multi-plate trawl doors, the maximum vertical force acting in the downward direction is given by:
|
![]() : Dimensionless height, typically taken as 0.27;
: Dimensionless height, typically taken as 0.27;
Fz: Maximum vertical force.
For determining the maximum velocity of anchor drop, DNV[14] provides the following formula when the water depth is not considered:
|
Where: A is the projected area (m²), ρa is the mass of the anchor (kg), is the density of seawater (kg/m³), Cd is the drag coefficient, typically taken as 1.13[15], V is the anchor's volume (m³).
When considering the water depth, the formula for the maximum velocity of anchor drop is:
|
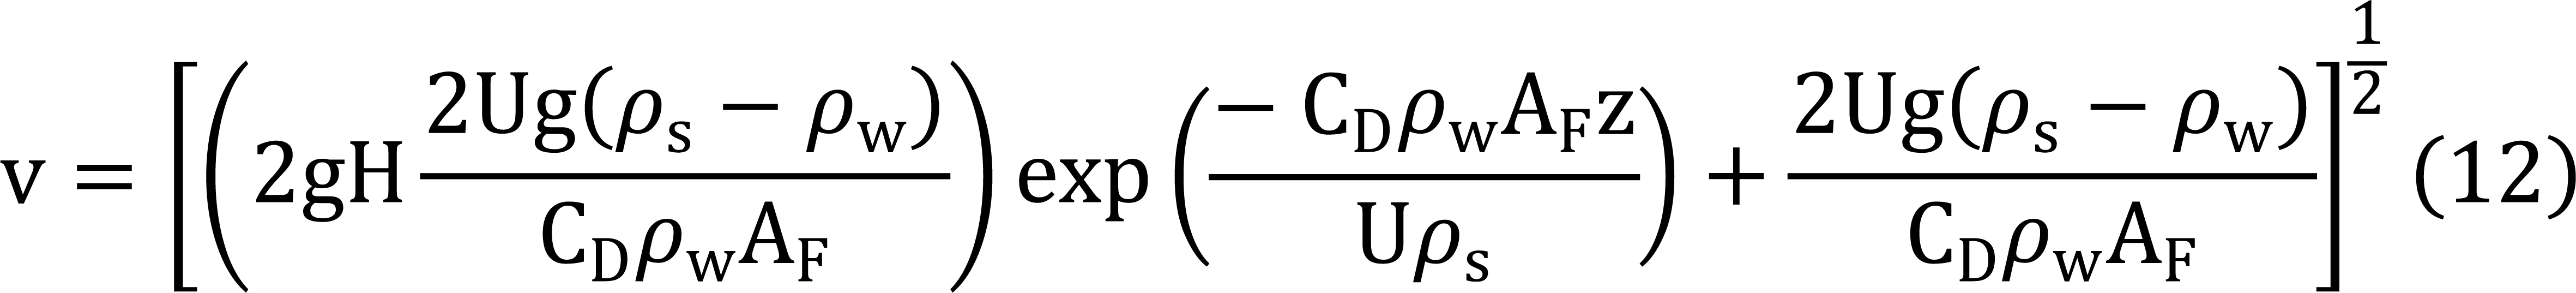
Where: U is the volume of the anchor (m³), ρs is the density of the anchor (kg/m³), ρw is the density of seawater (kg/m³), Z is the depth at which the anchor enters the water (m), CD is the drag coefficient (dimensionless), typically taken as 0.7 (for conservative estimation), AF=L*B is the frontal area of the anchor (m²), V is the velocity of the anchor when it has fallen to a depth of z (m/s), g is the gravitational acceleration (m/s²), H is the height above the sea surface at which the anchor freely falls (m).
2.3 Drop Object Condition and Drag Condition
Numerical modeling of the subsea fiberglass protective structure was performed using ABAQUS finite element software, based on the design drawings. A three-dimensional Cartesian coordinate system, following the right-hand rule, was employed, with the global coordinate system shown in Figure 4. The X-direction represents the longitudinal direction, the Y-direction the transverse direction, and the +Z-direction the upward direction.
The larger frame's hatch, columns, and beams are modeled with beam elements, while the remaining parts are modeled using shell elements. The element size for discretization is approximately 200mm by 200mm. The larger frame has a thickness of 50mm, and the smaller frame’s thickness is 20mm. The cross-section of the larger frame’s hatch is 250mm by 90mm, and the columns and beams of the smaller frame have a cross-section of 200mm by 200mm. The finite element model is shown in different colors in Figure 5.
|
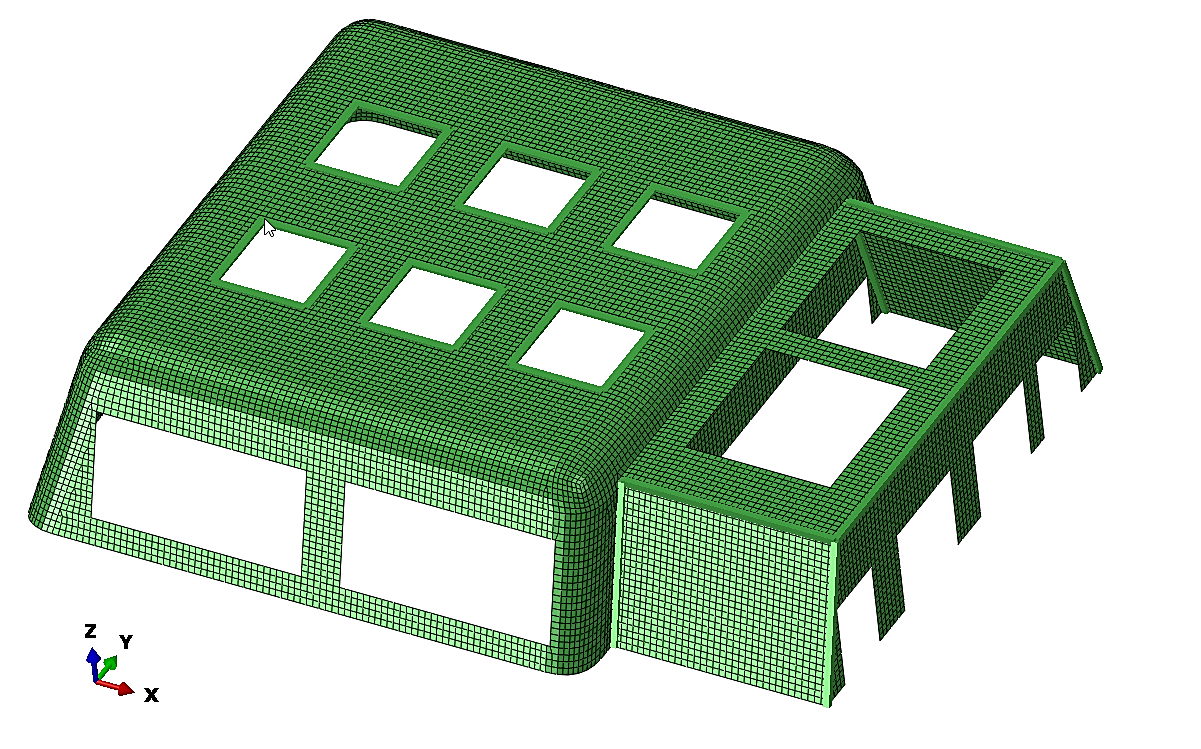
Figure 4. Fiberglass Protective Structure FE Model.
|
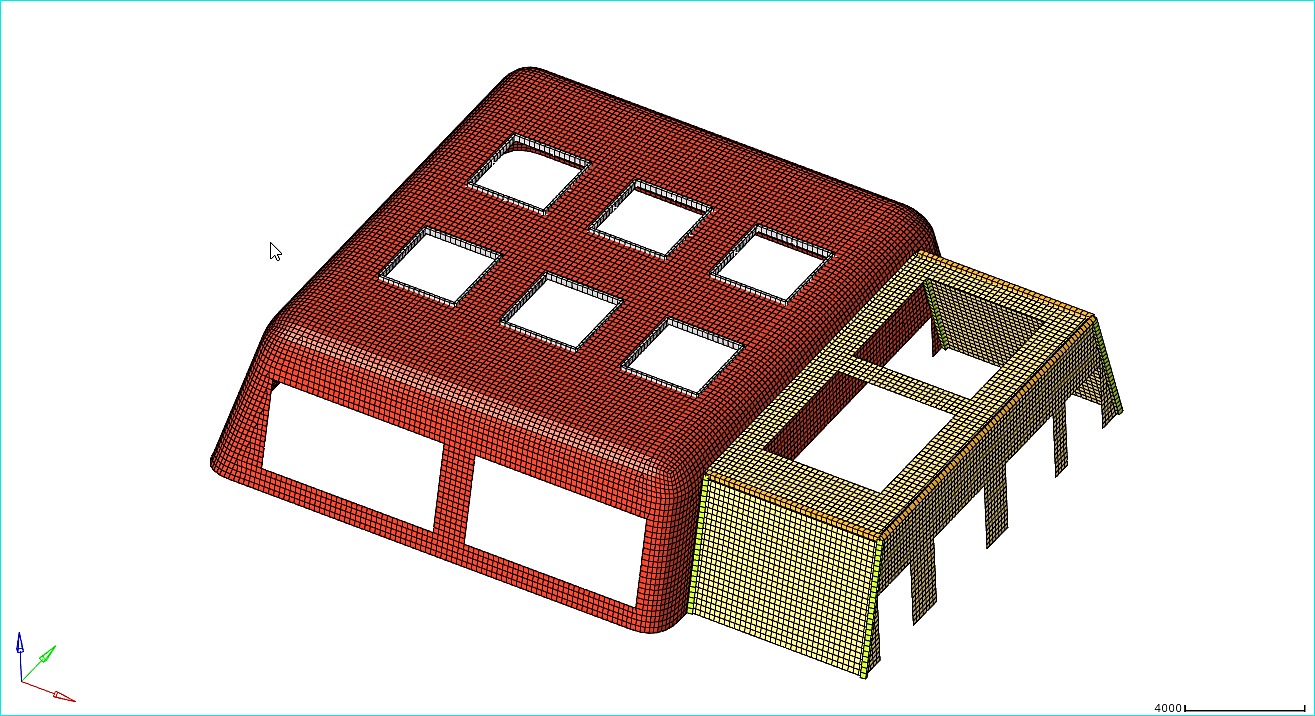
Figure 5. Frame, FE Model.
This study examines two primary load cases: drop object impact and fishing net drag. In the drop object impact condition, the effect of gravity must be accounted for. In the fishing net drag condition, gravity is included in the analysis for a conservative design approach. Three translational degrees of freedom at the bottom nodes of the frame are constrained for both load cases. The boundary conditions for the two load cases are shown in Figure 6.
|
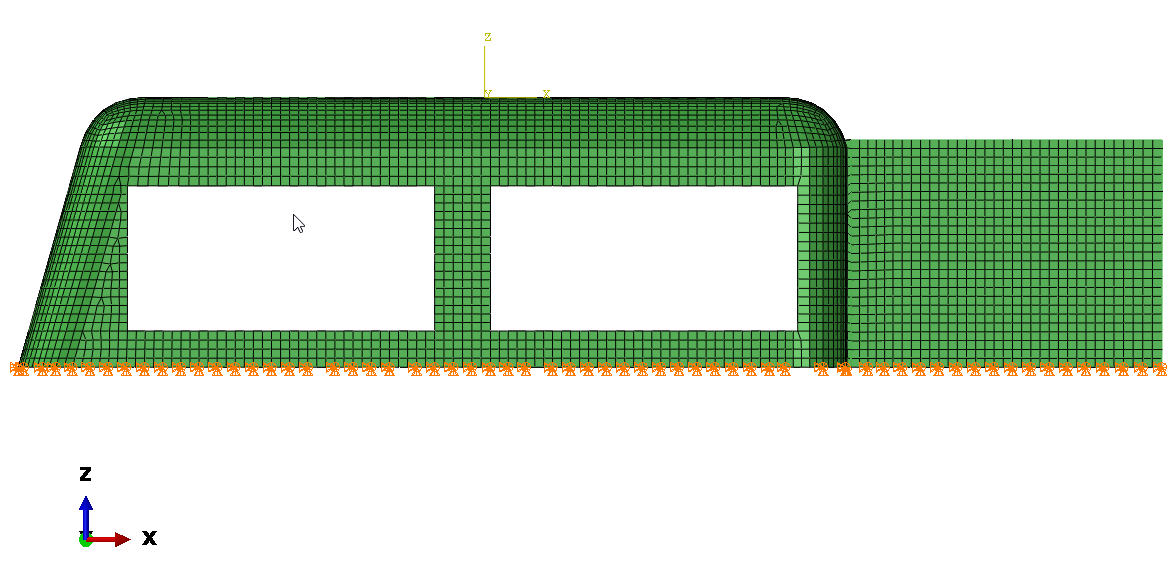
Figure 6. Basic Boundary Constraints for Two Load Cases.
A 20-ton anchor is used as the drop object. Based on the specifications of GB/T 546-2016 for Hall anchors, the diameter of the 20-ton anchor is 1,331mm. Therefore, a cylinder with a diameter of 1,331mm and a height of 1,832mm is used to represent the drop object. The velocity of the drop object is 8,000mm/s in the negative Z-direction. A contact interaction is defined between the drop object and the top surface of the frame. The analysis time is 0.5s. The defined drop object is shown in Figure 7, and the contact position between the drop object and the fiberglass protective structure is shown in Figure 8.
|
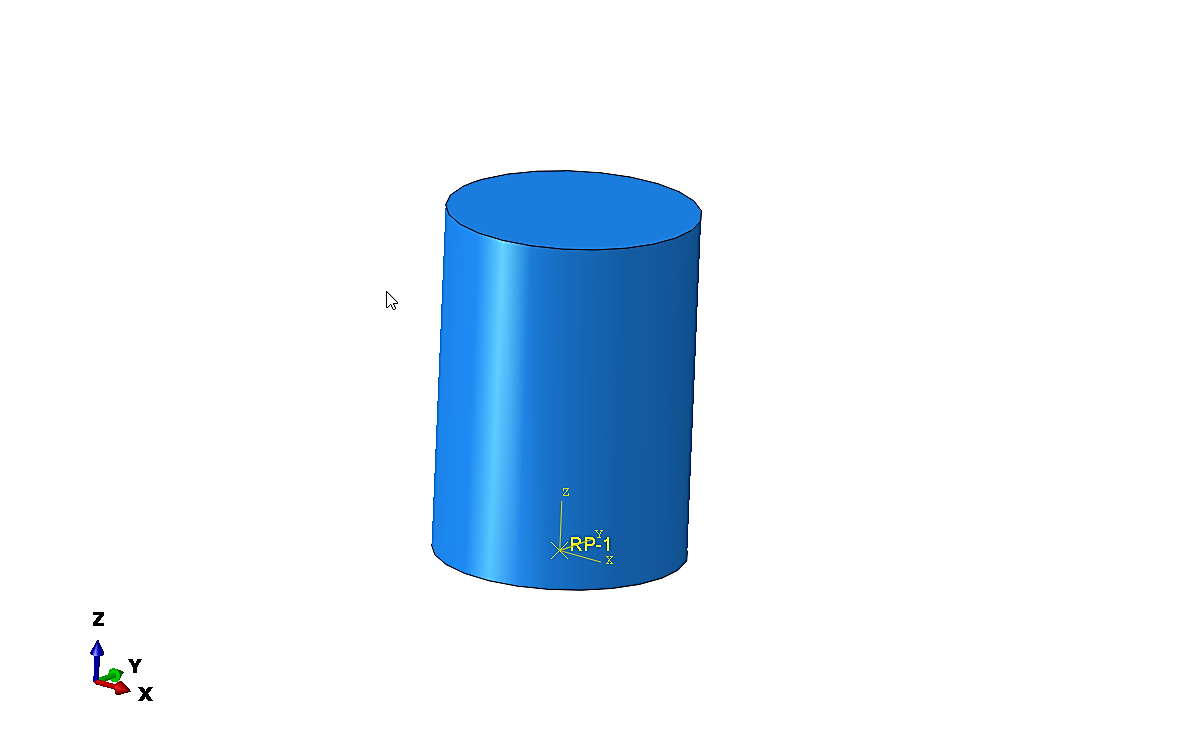
Figure 7. Drop Object Plot.
|
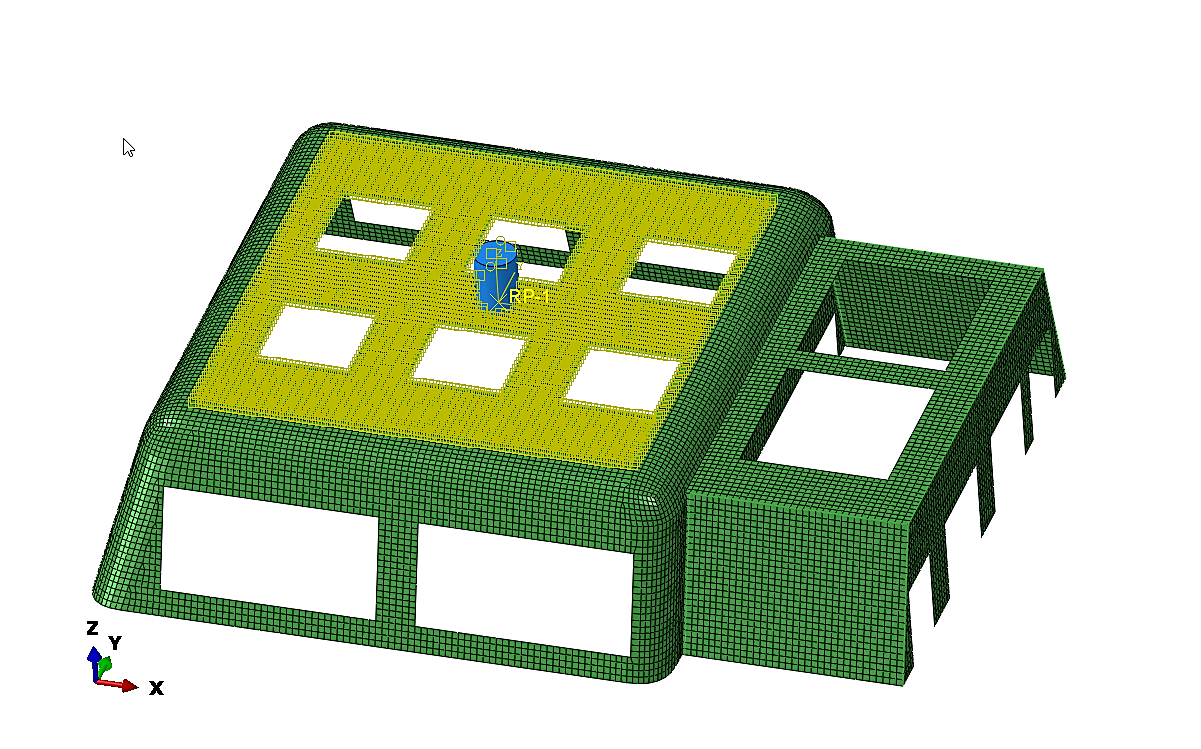
Figure 8. Contact Plot.
The drag force is 50kN in the horizontal direction. The following four directions were selected for analysis under the drag condition. One direction is the positive X-axis acting on the large frame, as shown in Figure 9. Another direction is the negative X-axis acting on the smaller frame, as shown in Figure 10. The remaining two directions are the positive and negative Y-axes acting on the large frame, as shown in Figures 11 and 12, respectively.
|
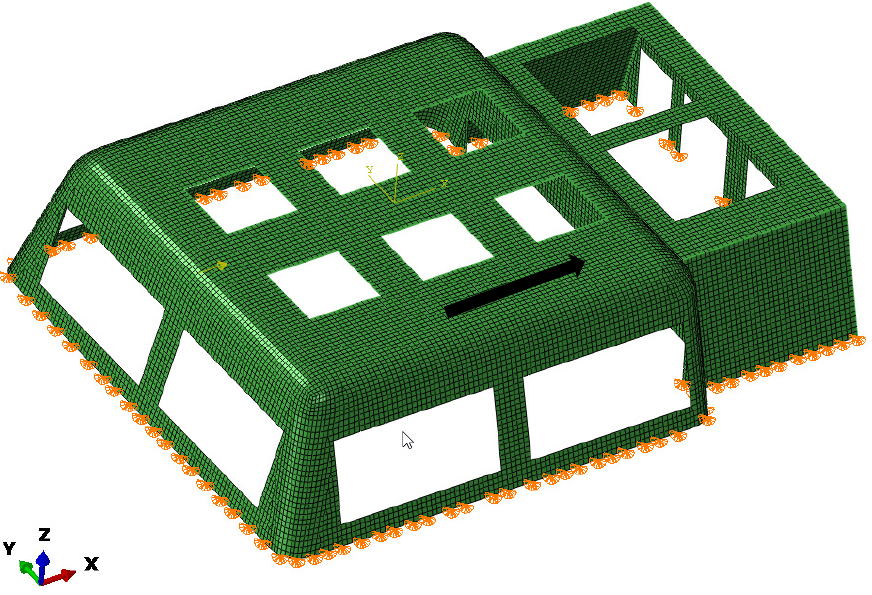
Figure 9. Drag Force in Positive X Direction.
|

Figure 10. Drag Force in Negative X Direction.
|

Figure 11. Drag Force in Positive Y Direction.
|
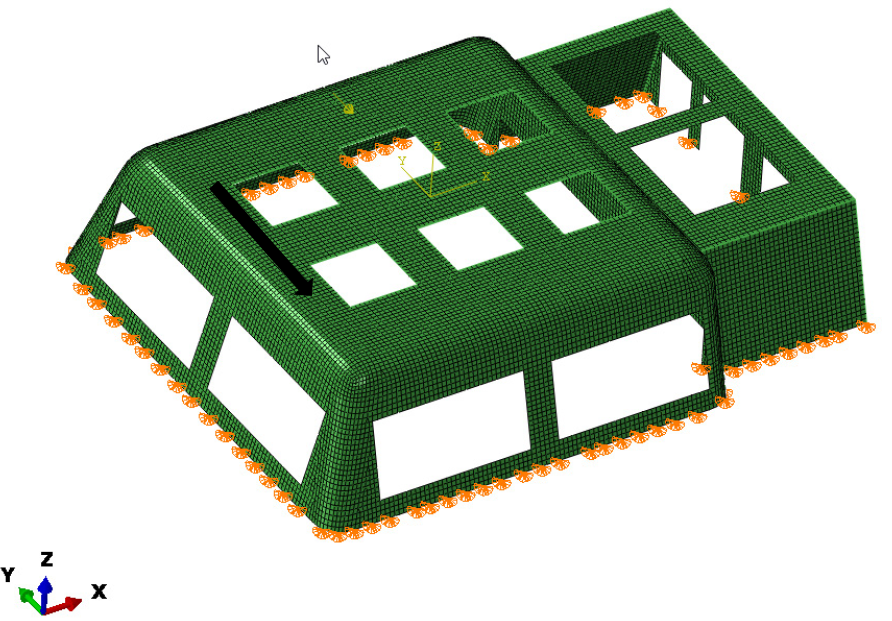
Figure 12. Drag Force in Negative Y Direction.
For strength analysis, the nominal equivalent (Von Mises) stresses of fiberglass protective structure should be within the allowable values defined as follows.
|
Where Ft are tensile stresses; F.S.=2.0 factor of safety. According to the above formula analysis, the allowable equivalent (Von Mises) stresses of the glass fiber protective structure in all the above load cases is 250MPa.
3 RESULTS
3.1 Calculation Results of Drop Object Condition
Through numerical simulations and analysis of the drop object conditions, the displacement-time and velocity-time curves were obtained, as shown in Figures 13 and 14. The displacement-time curve (Figure 13) reveals a smooth, parabolic trajectory, indicating the progressive deformation of the fiberglass protective structure during impact. Maximum displacement occurs at approximately 0.24s representing the point of full compression, before the structure begins its elastic recovery. The maximum recorded displacement is less than 1.2m, remaining well within the design tolerances of the protective structure.
The velocity-time curve (Figure 14) reflects the dynamic behavior of the drop object during the impact event. Initially, the velocity decreases steadily as energy is absorbed by the structure, reaching a minimum near the point of maximum compression (0.24s). This is followed by an increase in velocity during the rebound phase, as the structure recovers elastically. The smooth nature of both curves indicates stable interaction without abrupt fluctuations, demonstrating that the fiberglass protective structure effectively absorbs and dissipates impact energy, ensuring its structural integrity under the simulated conditions.
Based on the aforementioned research, the displacement and stress distribution of the fiberglass protective structures were analyzed over various impact time intervals. At an impact time of 0.24s, the displacement and stress distribution of the fiberglass protective structure are illustrated in Figures 15 and 16.
|
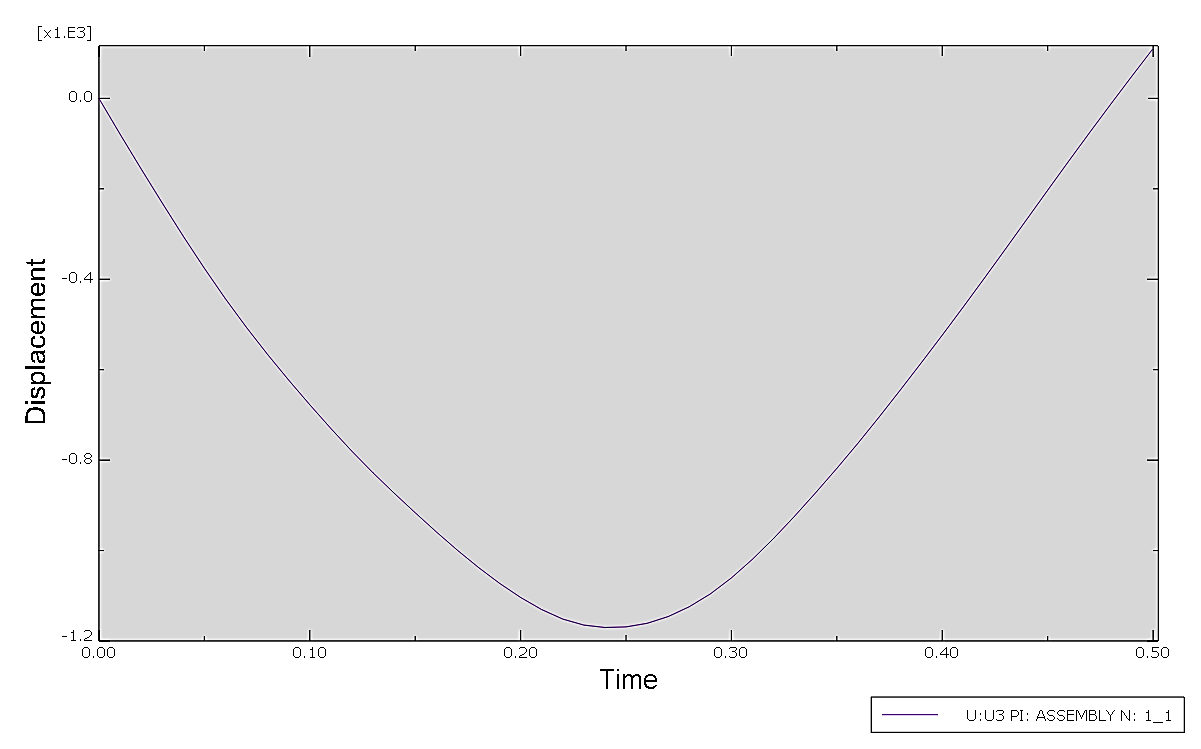
Figure 13. Displacement-time Curve of the Drop Object.
|
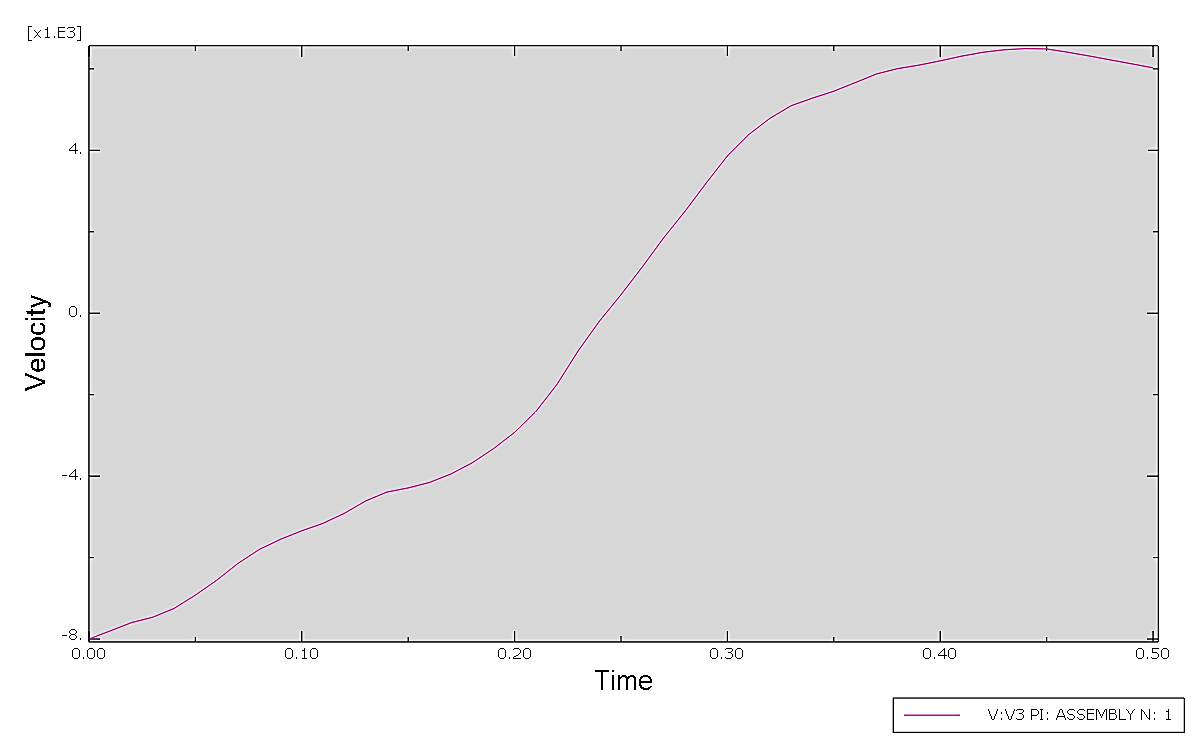
Figure 14. Velocity-time Curve of the Drop Object.
|
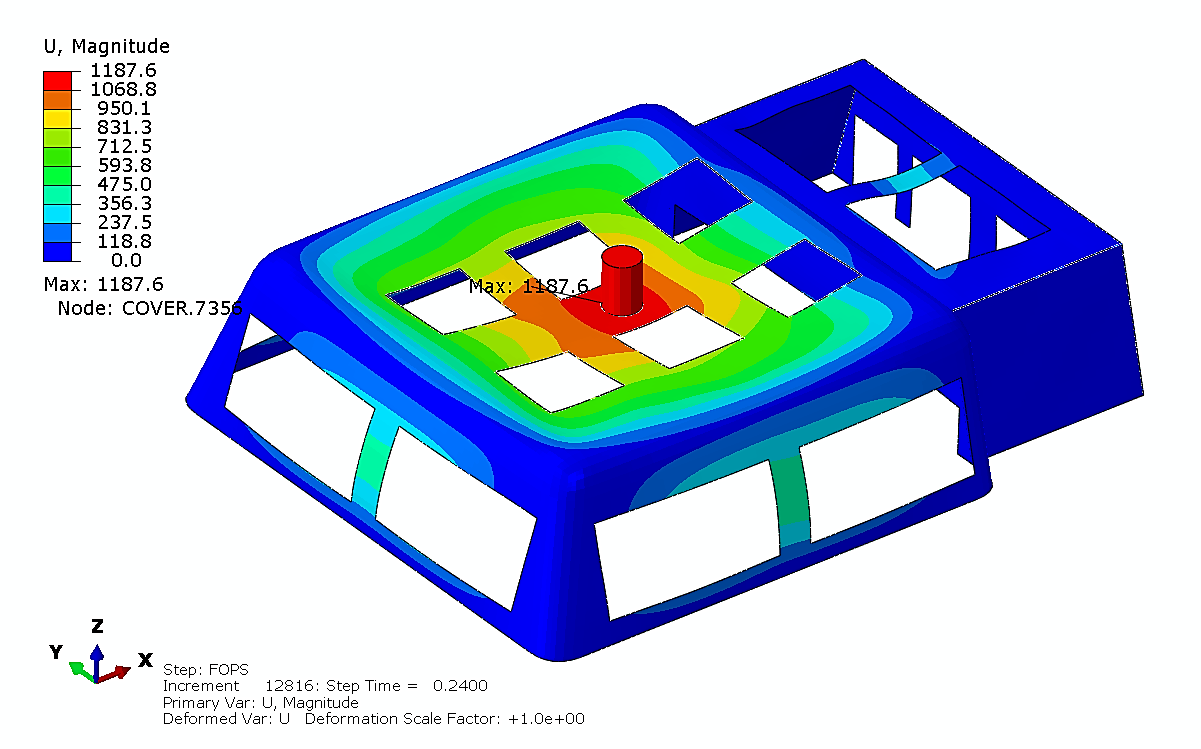
Figure 15. Displacement Plot, 0.24s.
|
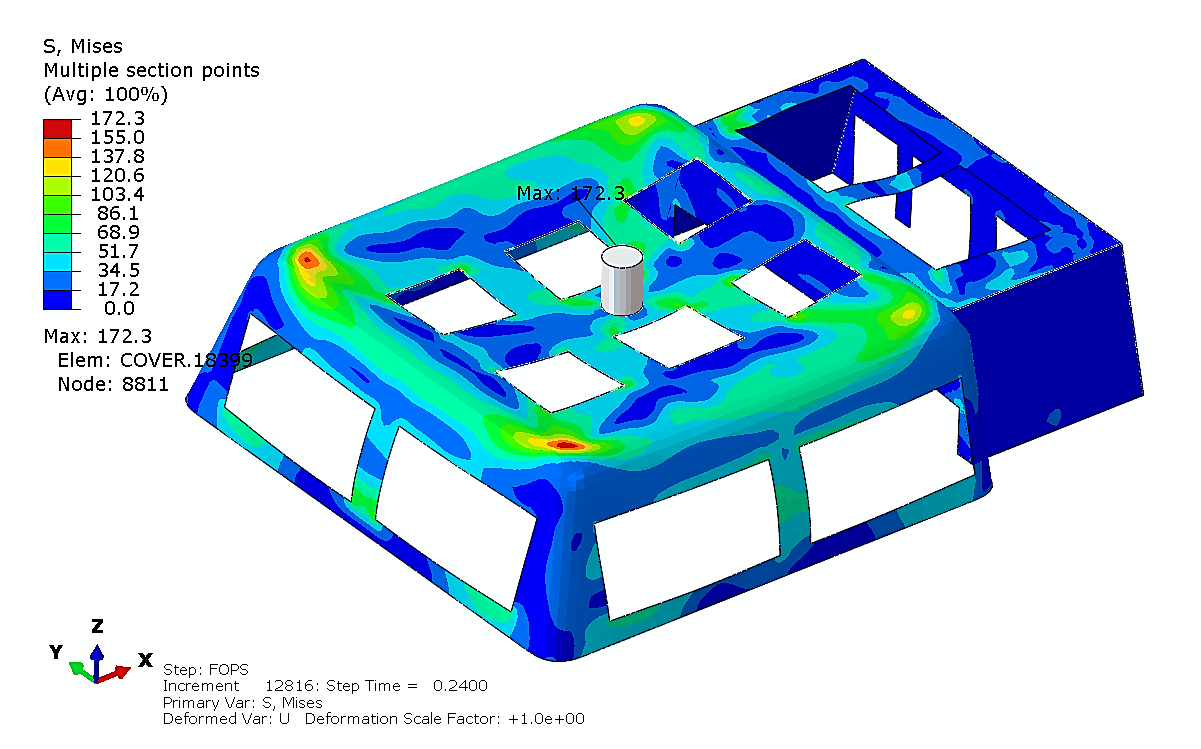
Figure 16. Stress Plot, 0.24s.
|
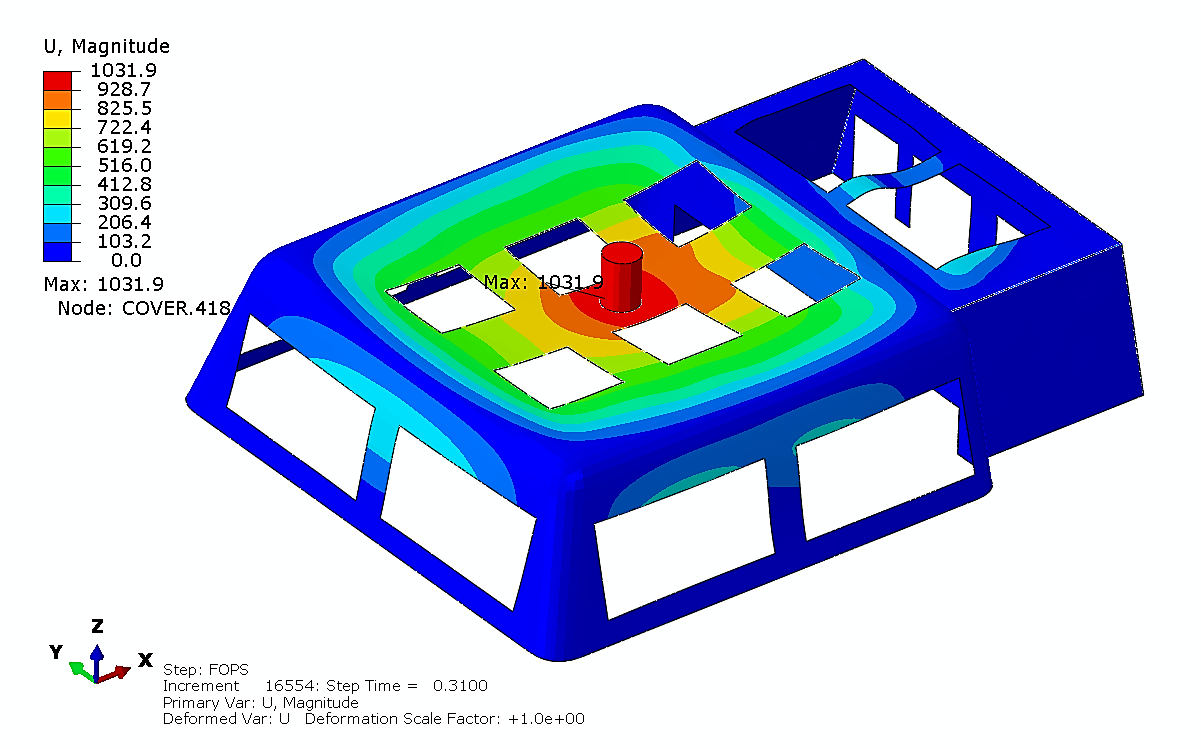
Figure 17. Displacement Plot, 0.31s.
|
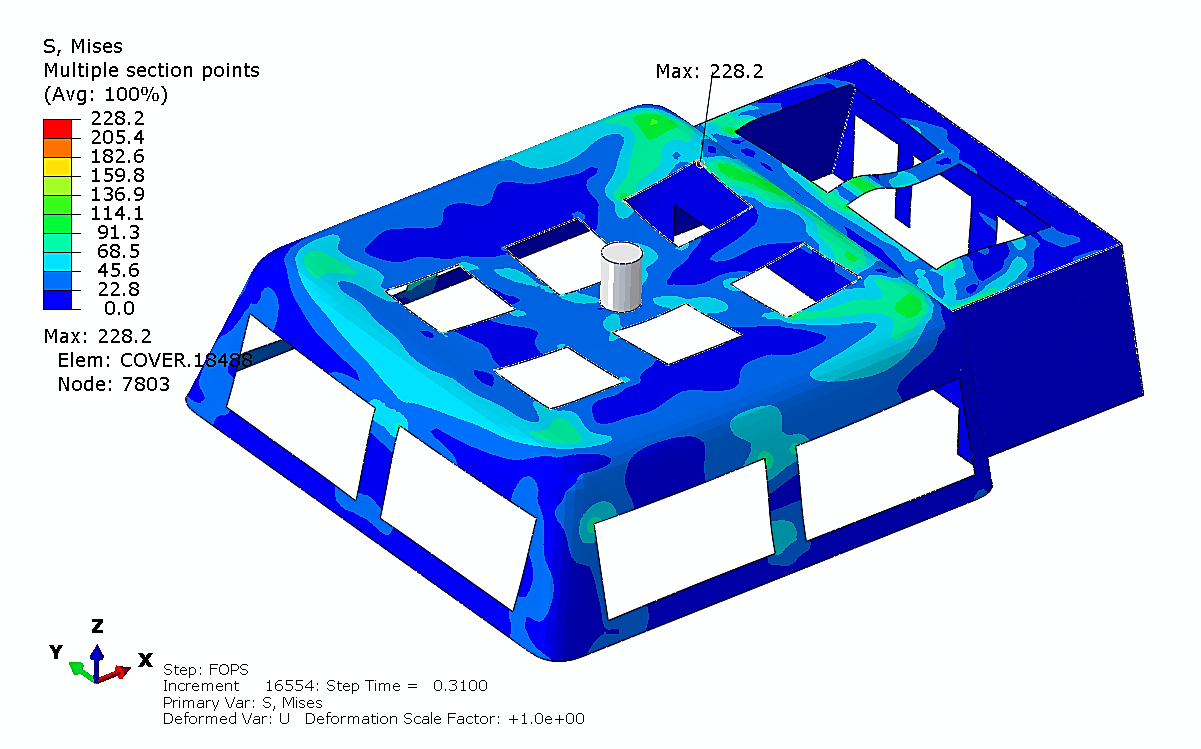
Figure 18. Stress Plot, 0.31s.
At this moment, the deformation of the protective structure reaches its maximum. At an impact time of 0.31s, the displacement and stress distribution of the fiberglass protective structure are illustrated in Figures 17 and 18. At this stage, the stress on the protective structure reaches its peak. The maximum von Mises stress is 228MPa, which is below the 250MPa threshold. Therefore, the structural design meets the drop object requirement.
3.2 Calculation Results of Drag Condition
Under the dragging condition, considering the self-weight of the integrated fiberglass protective structure, the overall deformation is negligible when subjected to a 50kN drag load in various directions. This minimal deformation confirms the structural rigidity of the fiberglass design, indicating its ability to resist significant displacement under such loading scenarios and ensuring that deformation has no notable effect on the structure’s overall performance.
This section focuses on analyzing the stress distribution within the fiberglass protective structure under the specified dragging conditions. By evaluating the stress response to drag loads applied in multiple directions, the analysis aims to identify critical stress regions and verify whether the structure remains within acceptable design limits. These findings validate the structure's ability to withstand external dragging forces while maintaining its integrity, ensuring its reliability and effectiveness in subsea applications.
|
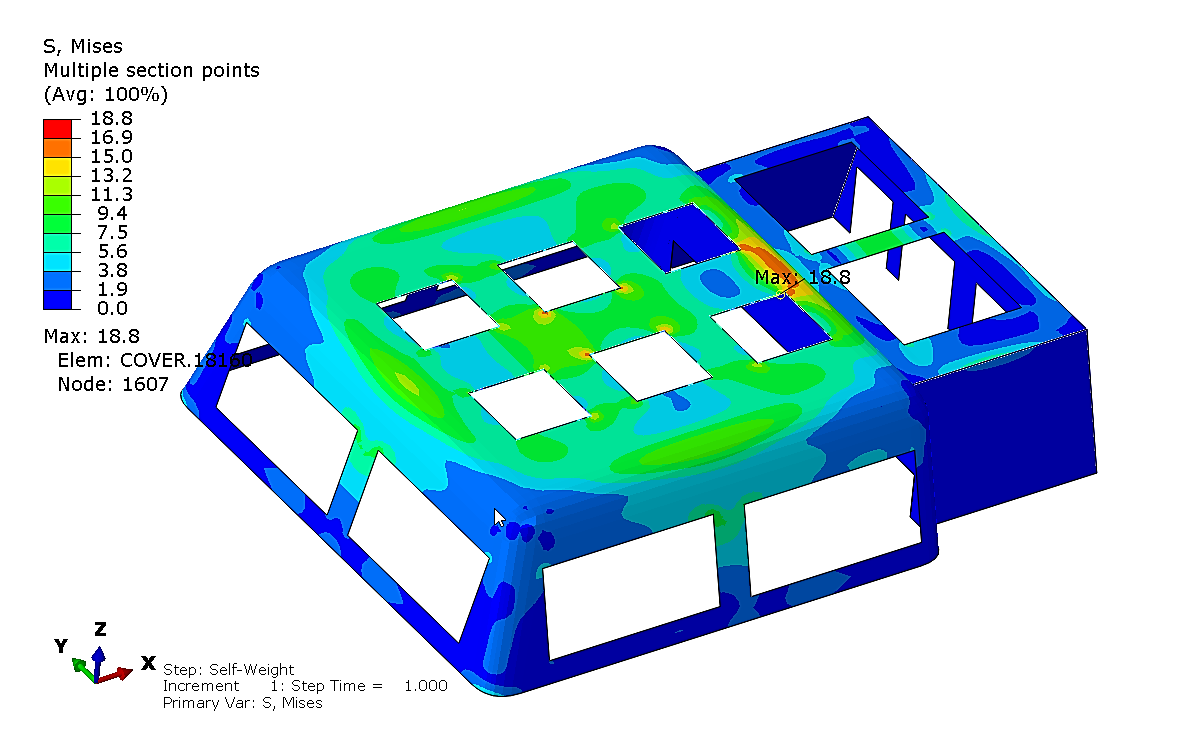
Figure 19. Self-weight.
The stress distribution of the fiberglass protective structure under its own gravity is illustrated in Figure 19. The stress distributions under a 50kN drag force, considering its own gravity, are illustrated as follows: positive X direction in Figure 20, negative X direction in Figure 21, positive Y direction in Figure 22, and negative Y direction in Figure 23 The maximum von Mises stress is less than 20MPa, indicating that the structural design satisfies the drag load requirements.
|
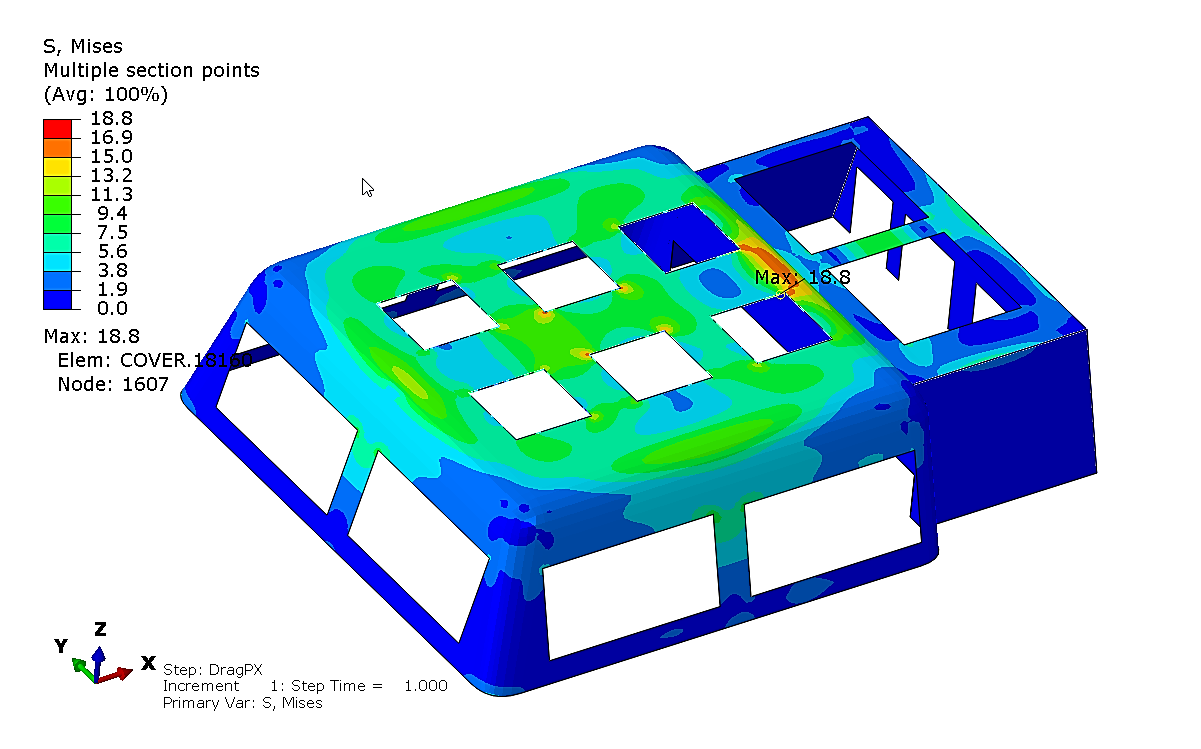
Figure 20. Self-weight Plus Positive X 50kN Drag Force.
|
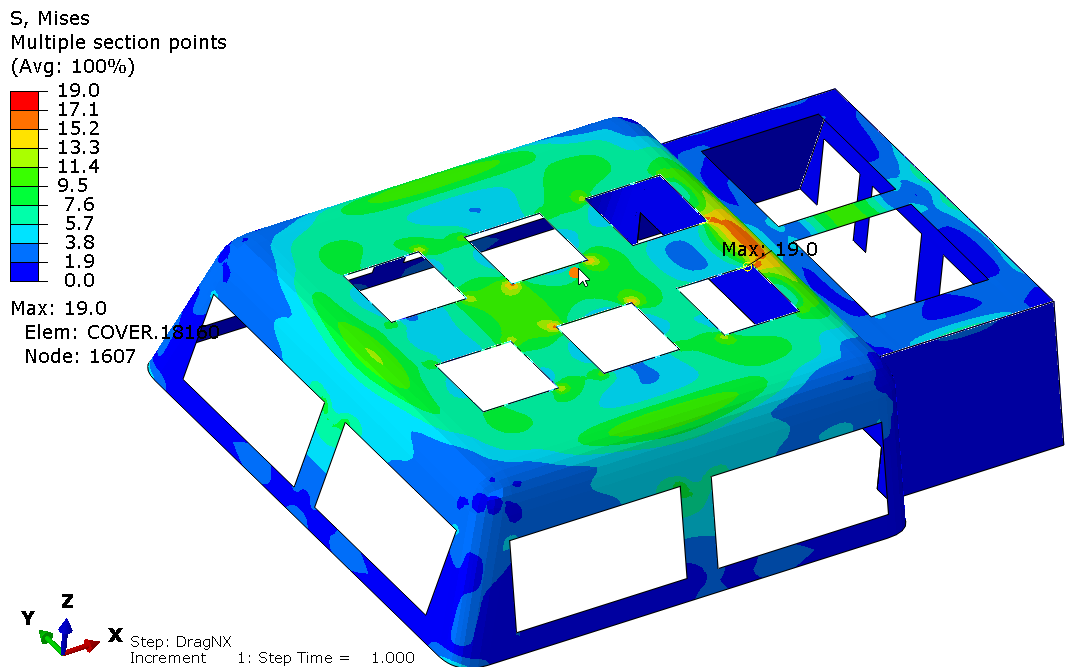
Figure 21. Self-weight Plus Negative X 50kN Drag Force.
|

Figure 22. Self-weight Plus Positive Y 50kN Drag Force.
|
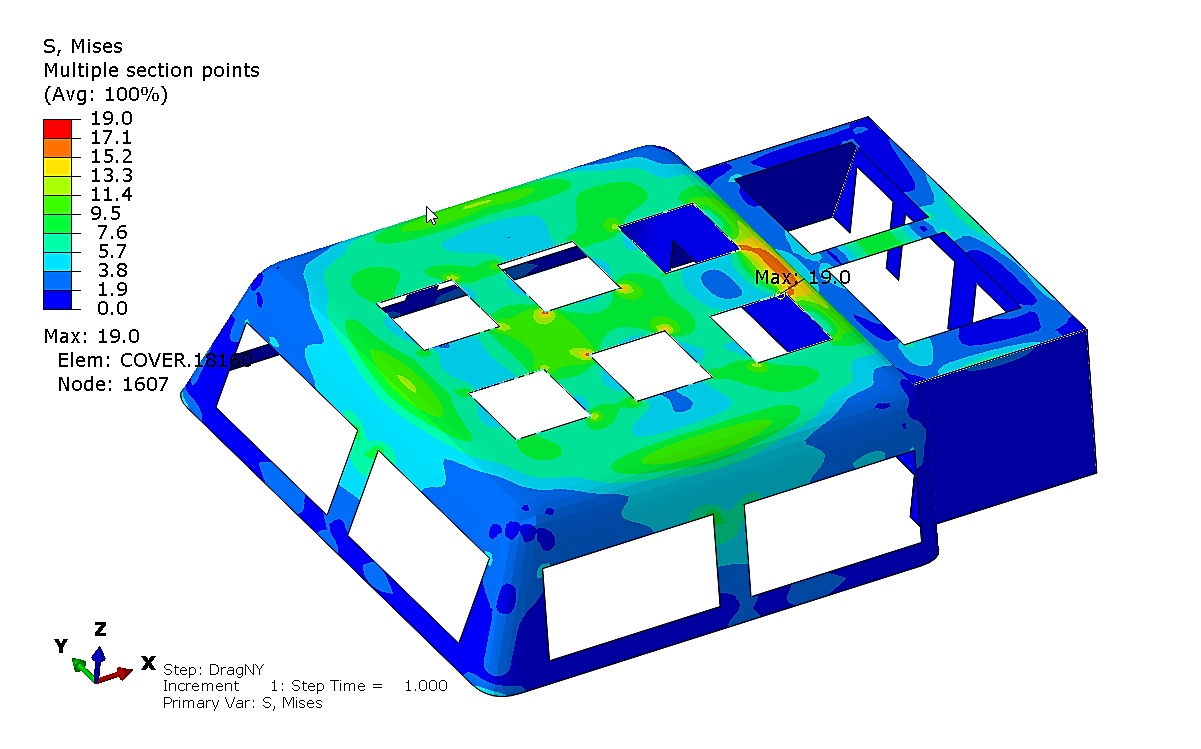
Figure 23. Self-weight Plus Negative Y 50kN Drag Force.
4 CONCLUSION
This article examines the load-bearing characteristics of an integrated fiberglass protective structure, designed to protect subsea oil and gas production facilities, using numerical calculations. The focus is on its ability to resist falling object impacts and fishing net drag. Numerical calculations demonstrate that the strength and deformation of the fiberglass protective structure meet the design requirements. The key findings from the calculations are summarized below:
1. During a falling object impact lasting 0.24s, the fiberglass protective structure experiences its maximum deformation of 1,187.6mm, with a structural stress of only 172.3MPa.
2. At an impact time of 0.31s, the falling object reaches its highest acceleration, resulting in a maximum structural stress of 228.2MPa, with a corresponding deformation of 1,031.9mm.
3. Under a 50kN dragging load, accounting for the self-weight of the structure, the impact of the dragging loads in various directions on the bearing characteristics of the fiberglass protective structure is negligible.
Acknowledgments
This research was supported by the Ministry of Industry and Information Technology's 1500-meter subsea Christmas tree and control system development project, as well as the Postdoctoral Research Project Funding (x2hy-L2230610). We sincerely appreciate their contributions to the scientific research that forms the foundation of this paper.
Conflicts of Interest
The authors declared no conflict of interest.
Data Availability
All data generated or analyzed during this study are included in this published article and its supplementary information files.
Copyright and Permissions
Copyright © 2025 The Author(s). Published by Innovation Forever Publishing Group Limited. This open-access article is licensed under a Creative Commons Attribution 4.0 International License (https://creativecommons.org/licenses/by/4.0), which permits unrestricted use, sharing, adaptation, distribution, and reproduction in any medium, provided the original work is properly cited.
Author Contribution
Yan Qu was responsible for determining the technical route of the overall analysis, including the review. Guang Y, Wang K, Fei W, and Chao W focused on the structural design, analyzing the working conditions, and implementing the design. The data collection and research methodology were handled by Zhang H, Diyi C, and Wang K. The final draft of the paper was approved by all authors after they had evaluated the findings.
Abbreviation List
GFRE, glass fiber reinforced epoxy
GFRP, Glass fiber reinforced polymer
GF, Glass fiber
References
[1] Wang Z, Chen D, Lin S et al. Engineering applications of fiberglass protective covers for oil and gas production facilities in submerged sand slope areas. Appl Ocean Res, 2024; 150: 104100.
[2] Chen D, Yan R, Lu X. Mechanical properties analysis of the naval ship similar model with an integrated sandwich composite superstructure. Ocean Eng, 2021; 232: 109101.
[3] Chen D, Lu X, Qu Y et al. Study on the influence factors of the bearing characteristics of the ship with an integrated glass fiber sandwich composite superstructure. Ocean Eng, 2024; 299: 116933.
[4] Mahato KK, Dutta K, Ray BC. Emerging advancement of fiber-reinforced polymer composites in structural applications. New Mater Civil Eng, 2020: 221-271.
[5] Rubino F, Nisticò A, Tucci F et al. Marine application of fiber reinforced composites: a review. J Mar Sci Eng, 2020; 8: 26.
[6] Li Z, Xie R, Wu Y et al. Progress and prospect of CNOOC's oil and gas well drilling and completion technologies. Nat Gas Ind B, 2022; 9: 209-217.
[7] Zulkifli MZ. Dropped Object Protection Modelling for Subsea Equipment, IRC, 2016.
[8] Tauqeer MA. Geometry Optimization of Glass Reinforced Plastic (GRP) Subsea Protection Covers[master’s thesis]. Norway, IA: University of Stavanger; 2016.
[9] José-Trujillo E, Rubio-González C, Rodríguez-González J. Seawater ageing effect on the mechanical properties of composites with different fiber and matrix types. J Compos Mater, 2019; 53: 3229-3241.
[10] Rafiq A, Merah N, Boukhili R et al. Impact resistance of hybrid glass fiber reinforced epoxy/nanoclay composite. Polym Test, 2017; 57: 1-11.
[11] Muzayadah NL, Nurtiasto TS, Abdurrahman K et al. Investigation of the Mechanical Properties of Vinyl ester Carbon Composites Through Immersion in Seawater and Freshwater Using the VARI (Vacuum Assisted Resin Infusion) Method. Jurnal Teknologi Dirgantara, 2022; 20: 9-24.
[12] Chen D, Lu X, Wang Z et al. Durability test study of laminated specimens for large glass fiber protective structures in seawater. J Sea Res, 2024; 201: 102521.
[13] Chen D, Yan R, Lu X et al. Progressive failure and ultimate strength analysis of sandwich composite hat-stringer-stiffened panels under transverse in-plane loading. J Mech Mater Struct, 2021; 16: 1-21.
[14] Veritas N. Interference between trawl gear and pipelines. Det Norske Veritas: Berum, Norway, 1997.
[15] Hou F, Chen Y, Yan Y et al. Structural response and damage assessment method for subsea pipe-in-pipe subjected to anchor impact. Mar Struct, 2025; 99: 103714.


