Underwater Image Stitching Method Based on AUV-guided Light Source Optimization
Ruonan Deng1,2,3, Wei Qu1,2,3*, Chengjun Qiu1,2,3, Jiuqiang Luo3, Jiaqi Gao1, Yuxuan Wu1, Jiaqi Yan1
1College of Mechanical, Naval Architecture & Ocean Engineering, Beibu Gulf University, Qinzhou, Guangdong Province, China
2Guangxi Key Laboratory of Ocean Engineering Equipment and Technology, Qinzhou, Guangdong Province, China
3Key Laboratory of Beibu Gulf Offshore Engineering Equipment and Technology (Beibu Gulf University),
Education Department of Guangxi Zhuang Autonomous Region, Qinzhou, Guangdong Province, China
*Correspondence to: Wei Qu, PhD, College of Mechanical, Naval Architecture & Ocean Engineering, Beibu Gulf University, Qinzhou 535011, China; Email: quwei@bbgu.edu.cn
Abstract
Background: Image stitching is the procedure of combining two or more pictures having the same feature point location information into a panoramic image, which is useful in target discovery, seabed research, and military applications. Most of existing underwater picture stitching technology makes use of well-lit photos, however natural light gradually diminishes during propagation of underwater autonomous submersibles plunge further into the sea. When the image focuses on the regions of lighting concentration and the larger dark, image details are lost and feature points are not matched, the perspective transformation matrix obtained does not reflect the mapping relationship of the entire image, resulting in a poor stitching effect and making it difficult to meet practical application requirements.
Objective: This study aims to obtain underwater images with a good enhancement effect and improve feature point matching image.
Methods: An adaptive image enhancement method based on adaptive light source optimization is proposed in this paper, underwater photos are preprocessed to enhance images for the feature registration.
Results: The experimental consequence indicate that the improvement algorithm can improve picture standard with better detail performance and color recovery by preprocessing submerged photographs.
Conclusion: It is accomplished that high exactness for images stitching by adding the feature points of the enhanced image for feature alignment.
Keywords: image stitching, light source optimization, underwater image enhancement, feature matching
1 INTRODUCTION
Panorama is a seamless wide-view image created by stitching together many narrow-view photos of overlapping sections in the same scene. When the image is stitched, a source image is chosen as the reference image, the adjacent image is converted to match the reference image's coordinate system, and the single response between the adjoining images is calculated using the transformation matrix to create the panoramic image. Image stitching has emerged as an active research field in image processing in recent years, playing an essential role in computer vision and computer graphics applications. It is widely used in Picture rendering, medical imaging, image stabilization, 2D and 3D image mapping, satellite imaging, soil moisture balance evaluation, disaster prevention and control, and other applications. Furthermore, Image stitching supports hyperspectral remote sensing technology for autonomous undersea vehicles (AUV).
Image stitching technology is currently widely employed for underwater exploration, and it has been used for navigation, localisation of locations of interest, as well as detection of temporal changes in conjunction with the usage of AUV or remotely operated vehicles (ROV). Because of the limits of the maritime environment, pictures are invariably vulnerable to different interference factors during transmission, making target recognition extremely difficult. Underwater environmental conditions are harsh, such as particle suspension caused by scattering, etc., marine flora and fauna activities, light absorption, refraction, and remote operation difficulties, etc., resulting in image acquisition platform instability, challenges to the scene near and far, and changes in relative velocity.
It is necessary to consider the constraints that must be satisfied when estimating the target position at different levels in order to ensure the acquisition of high quality image data in real time and in a stable manner. In order to improve image quality and stitching success, this paper uses AUV-guided light source optimization methods to pre-process underwater images to improve image quality and stitching success. The major contributions are summarized below.
● An enhancement algorithm based on light source optimization guided filtering is proposed in order to obtain underwater images with a good enhancement effect.
● An improved feature point matching image stitching method is developed in order to raise the numeral of image matching pairs and accomplish. High image stitching exactness.
2 MATERIALS AND METHODS
2.1 Related Work
Low-illumination image enhancement algorithms primarily improve an image's overall contrast and brightness by increasing the brightness of the image's dark region and suppressing the grayscale value of the image's overly bright region[1]. Low-illumination image enhancement algorithms have been evolving for a long time as a classic problem in the field of digital image processing. Retinal theory, grayscale transformation, and other techniques are commonly used to improve low-illumination color images.
Retinex theory is a traditional way of optical image enhancing microscopy. Multi-scale retinex (MSR)[2] and multi-scale retinex color restoration (MSRCR)[3] are representative retinal algorithms; however, these algorithms are prone to color distortion and over-enhancement. Hao et al.[4] proposed a low-light enhancement model based on a simplified Retinex model. A fast edge-preserving filter is introduced to estimate the illumination mapping, resulting in an intermediate enhanced image. Building on this foundation, a fusion-based low-light enhancement model is proposed, which effectively illuminates the image and suppresses imaging noise. The model performs well in various lighting conditions and avoids overor under-enhancement, enabling seamless fusion of the original image with the intermediate enhanced image. Galdran[5] suggested a Retinex-based light map estimation technique. First, the initial photogram image is estimated by calculating the maximum value of channels R, G, and B; the initial image is then refined by anisotropic filtering; the illumination map image is then processed with an adaptive gamma function; and finally, the reflection image is calculated using the retinal model and de-sharpened to improve detail.
The gamma correction function is a typical grayscale transformation technique. The implementation is straightforward, but it generally necessitates manual parameter adjustment based on the features of low-illumination pictures, and the images cannot be adaptively improved. Bai et al.[6] introduced a new method that consists of four stages: pixel intensity center regionalization, histogram global equalization, histogram local equalization, and multi-scale fusion. The method utilizes the pixel intensity center regionalization strategy to concentrate the image histogram onto the entire image. By performing global equalization of the histogram, color correction is performed based on the features of each channel. To improve image contrast, we utilized double interval histogram local equalization based on peak mean for each channel. Additionally, we performed dual image multi-scale fusion, color correction, and contrast enhancement using contrast, saliency, and exposure weights.
Intelligent algorithms have rapidly evolved and been used to picture augmentation in recent years. Cristin et al.[7] suggested an adaptive picture enhancement technique based on visual saliency and introduced the cuckoo search algorithm and dual gamma correction function in (HSI) color space. This approach increases the overall brightness of the image by determining the ideal settings for diverse scenarios. Furthermore, a luminance-keeping dual histogram creation approach based on visual prominence is presented to improve the contrast of the region of interest while maintaining the image's brightness. Finally, the image is altered using an enhanced saturation stretching algorithm to improve the image's color information. Li et al.[8] improved the overall brightness of the image by combining the suggested adaptive particle swarm optimization technique with gamma correction, taking into account the features of low-illumination color photographs. Furthermore, the adaptive stretching function is employed to process the image in order to increase the saturation. This approach enhances the contrast of a low-light color image, prevents color distortion, and successfully improves the brightness of the image, offering greater detail improvement while keeping the image's naturalness.
The quality of the photographs is improved by using clever algorithms to analyse shimmering images. The complexity of the enhancing algorithm has unquestionably risen with the development of intelligent algorithms. Algorithms for picture filtering are further used for image enhancement. A global optimized linear plus window tone mapping algorithm was put out by Ancuti et al.[9] and it presents a novel high dynamic range compression technique using local linear filtering. This method improves the image with a great dynamic range. The noise in the micrographs must not be overlooked. Azimpour et al.[10] suggested a variational strategy for maximizing the posterior estimate for picture denoising that can increase Gaussian noise filtering performance. Rasti et al.[11] suggested a variational approach for estimating the posterior (MAP). This approach uses geometric knowledge to create a regularization function and a nice denoising result picture.
Rather than capturing scintillating photos, these algorithms are typically evaluated using images from publicly available databases. Because of the noise of the dark region in the underwater photos really acquired by the underwater autonomous underwater vehicle, the enhancement algorithm may magnify the noise of the dark area at the same time as the brightness of the image, influencing subsequent splicing. Furthermore, this research employs enhancing approaches to preprocess and execute picture stitching. The image stitching performance will suffer if the enhancement algorithm is very sophisticated. As a result, we describe an adaptive picture enhancement approach based on AUV-guided light source optimization. The V component is extracted first using color space transformation, followed by the illumination component using a multi-scale guide filter. The enhanced illumination-reflection model's enhancement function is utilized to rectify the light component and incorporate adaptive variables. The light components before and after calibration are fused together and then translated to RGB color space. The technique provides quick adaptive improvement of underwater images, resulting in higher quality and more detailed underwater images that may be used for picture stitching later on. Figure 1 depicts the algorithm architecture used in this paper.
|
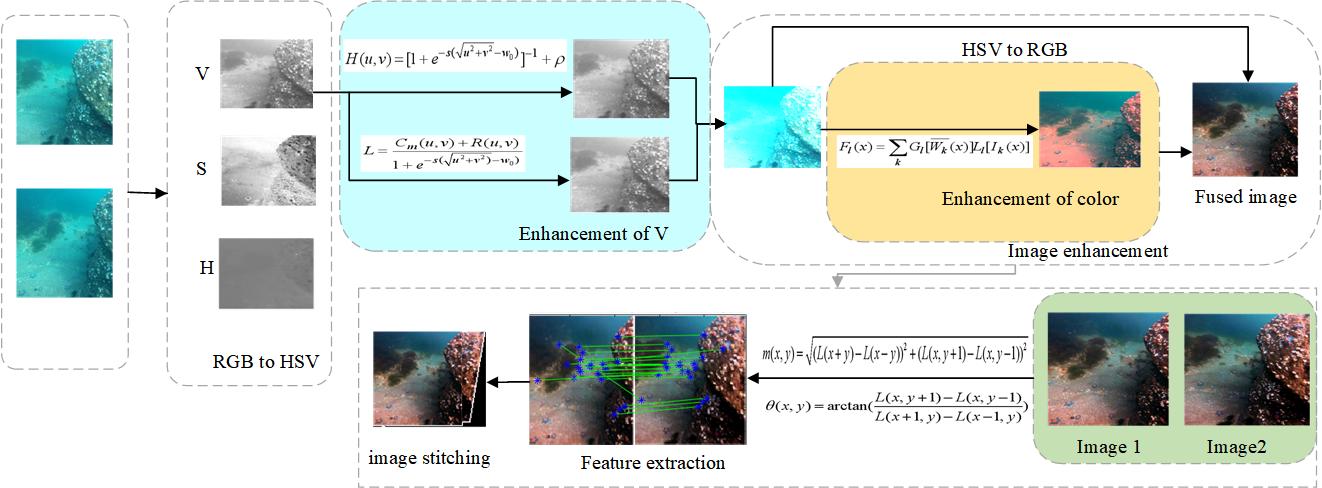
Figure 1. Algorithm flow of this paper.
The rest of this paper is structured as follows. Section 3 describes the suggested underwater picture enhancing algorithm. The stitching approach based on the suggested improvement algorithm is described in Section 4. Section 5 presents the experimental data as well as a commentary. Section 6 provides the conclusion.
2.2 The Proposed Underwater Image Enhancement Method
2.2.1 Space Conversion
HSV color space is a visual representation of color hue, vividness, and brightness that allows for easy color comparison. Saturation (saturation) and Value (luminance)[12]. Hue defines which side of the color spectrum is skewed toward red, green, and blue, with low hue tilted toward red, mid hue tilted toward green, and high hue tilted toward blue. Saturation influences the color composition of the color space; the higher the saturation, the deeper the color, and the lower the saturation, the lighter the color. Brightness regulates the degree of lightness and darkness in the color space; the higher the brightness, the brighter and more vivid the color; and brightness controls the degree of lightness and darkness of the RGB color combination. The mathematical formula is as follows:
|
|
|
|
2.2.2 Optimization of V-component Processing
When compared to the distribution of gray level in an ordinary clear image, the distribution of gray level in a low-light image is more concentrated in the lower gray level area, and the dynamic range of gray level is smaller, so the low-light image enhancement algorithm focuses on the enhancement of the image's low gray level area and uses an efficient method to expand the dynamic range of gray level. And, because of the global enhancement algorithm strategy method used, when the low gray region is improved, the high gray area is also increased, making it simple to overenhance the old high gray area. The light reflection model presented by Garcia et al.[13] is enhanced in this study, and the V-component is optimized by developing the model. As stated in equation, the Lighting-Reflection Model indicates that a picture is a result of the lighting and reflection qualities of a particular scene (5).
|
Where f(x, y) is the camera's perceived picture, i(x, y) is the illumination, and r(x, y) is the reflection function It can alternatively be represented as the product of its value and the gain factor g(x, y), plus an offset term o(x, y), depending on the camera specifications.
|
The smoothing function may be used to mimic the multiplication factor cm(x, y) = g(x, y) × r(x, y) induced by the light source and camera sensitivity. The smoothed picture attempts to determine the degree to which the light field and camera sensitivity impact each pixel. A Gaussian smoothing approach is presented to mimic non-uniform lighting, and the resultant picture may be rectified by point-by-point segmentation of the smoothed image, resulting in the ideal image estimate of.
|
Where δ denotes the normalization constant used to restore the overall brightness of the picture, and fs denotes the image after Gaussian smoothing.
Since the light acquired by the AUV is inhomogeneous, different portions of the picture must be processed owing to the varying brightness they receive. A model is created using homomorphic filtering for the low-frequency section of the picture, which may assume that the light factor fluctuates continuously over the field of vision, and low frequencies can be derived from the image's Fourier transform (ignoring the offset term)[14]. To carry out the above procedure, take the logarithm of Equation (6) and transform the multiplicative effect to an additive effect as shown below.
|
Equation (8)'s Fourier transform produces.
|
Where F(u,v), Cm(u,v) and R(u,v) are the Fourier transforms of ln f(x, y), ln cm(x, y) and ln R(x, y), respectively. For the high frequency part of the illuminated image, the high-pass homomorphic filter is introduced as:
|
Where w0 is the cutoff frequency, s is the multiplication factor, and ρ is the offset term. The low frequency part of the illumination is represented by multiplying the Fourier transformed image with the high-pass homomorphic filter as follows:
|
The filter may not only make the image's illumination more uniform, but it can also enhance the detail aspects of the shadow region.
A high-power LED light source is used in this work. The underwater spectral amplitude-illuminometer measures from 400 to 700nm, has a spectral resolution of 1nm, and a peak wavelength of around 500nm. Through sealing, it can operate normally to a depth of 5m underwater. The spectrum illumination meter is always situated at the primary optical axis of the light source during the underwater measuring procedure; the distance between the two is approximately 0.5m, and it is directly facing the light source. Figure 2 depicts the lighting optimization method.
|
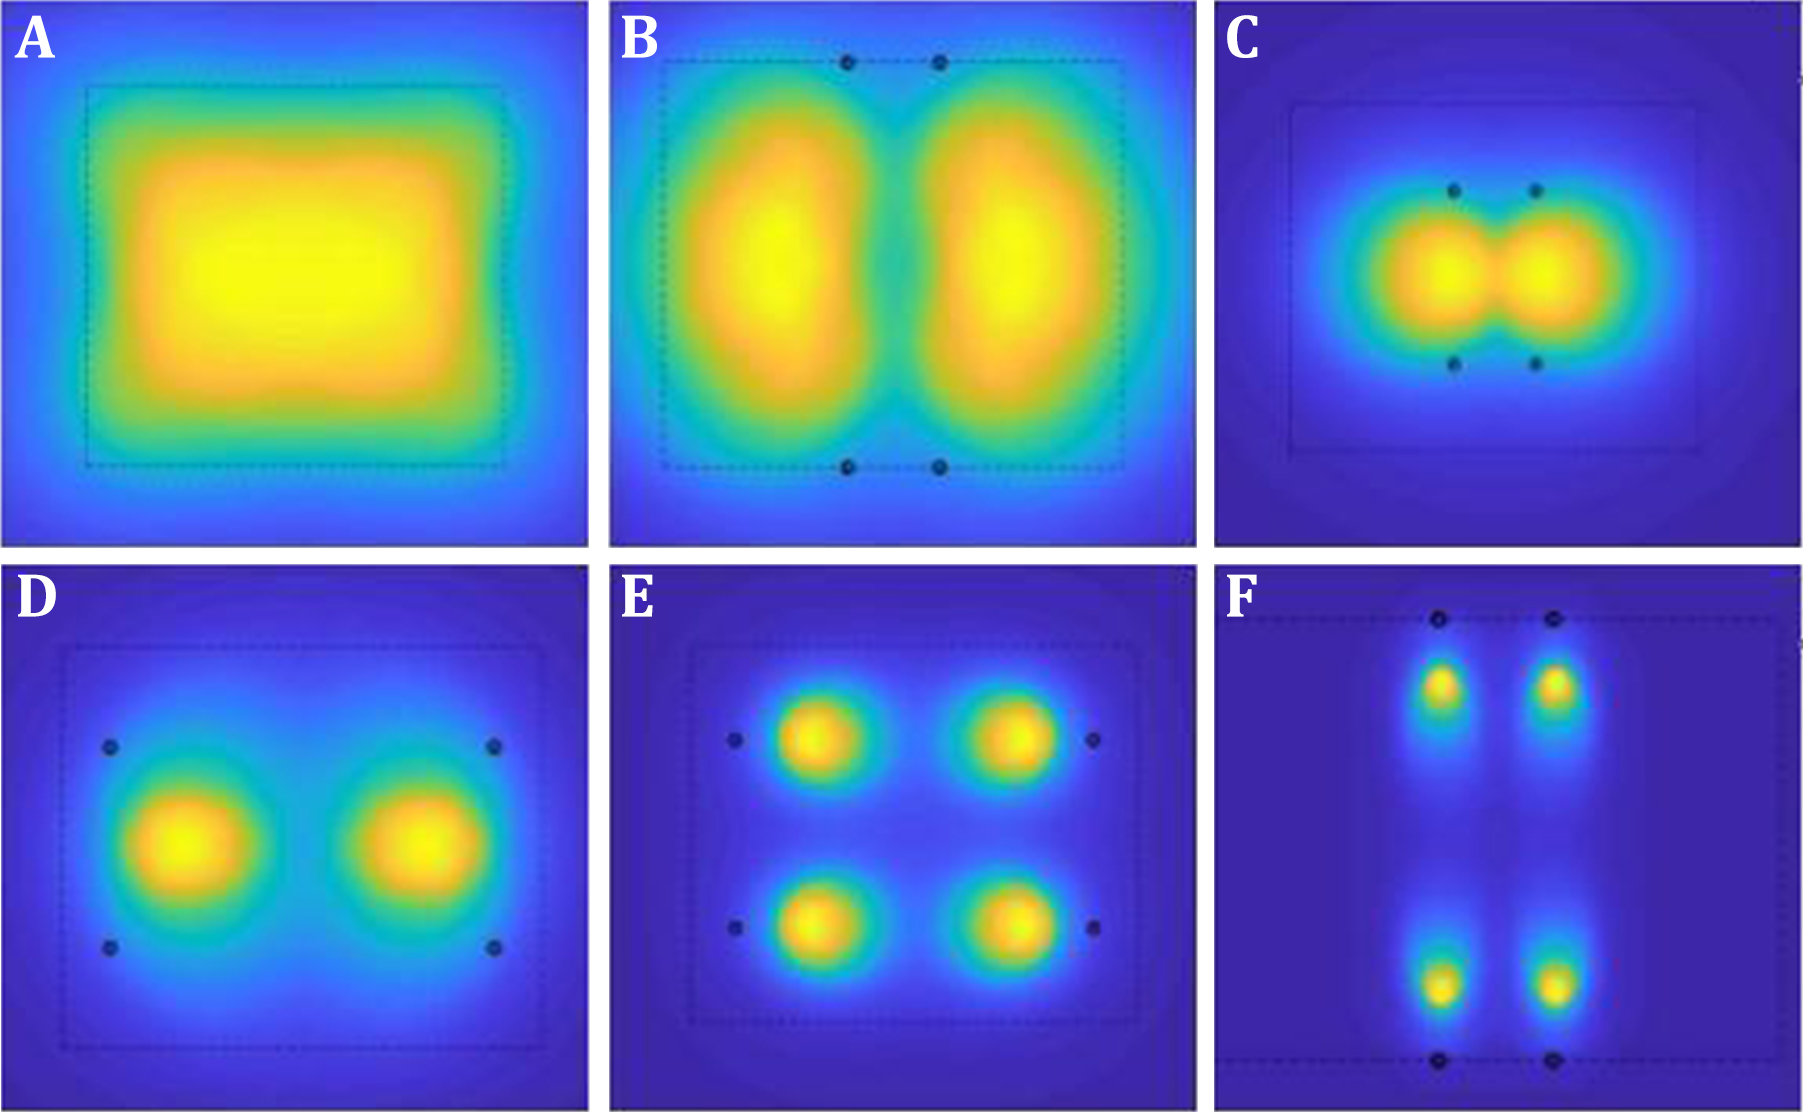
Figure 2. Light source optimization process. Panel A depicts the captured light source image, while Panel B depicts the segmented light source image after Gaussian smoothing. Panel C-F shows the results of performing high and low frequency processing on the segmented image, with Panel c showing the result before segmentation, Panel D showing the result after low frequency processing, Panel E showing the result after high frequency processing, and Panel F showing the final optimized light source effect.
2.2.3 Gamma Edge Correction
As a result of the above steps, an optimized light map can be obtained, but the underwater light map still has the problem of low contrast. Gamma correction is a non-linear algorithm to adjust the image brightness, which is often applied to enhance the image quality[15], and the mathematical expression is:
|
Where Iin and Iout indicate the input image and output image brightness chel, A and γ are used to adjust the correction range, Figure 3 indicates the relationship between the correction value and the value change, from the curve can be seen, a=0, the output image becomes brighter, b=0, the output image becomes darker.
|
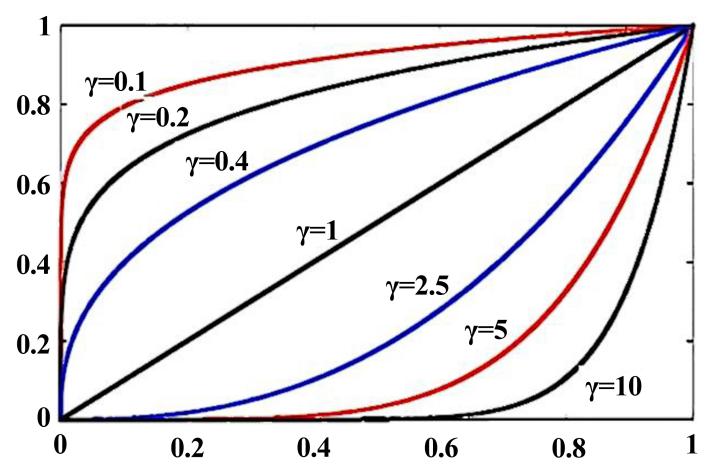
Figure 3. Gamma correction function curve change.
2.2.4 Red Channel Color Compensation
The light image with optimized enhancement of the light source gives the corrected underwater image according to Equation (11). As seen in Figure 1, the red light decays the fastest, and the blue-green light decays the slowest, resulting in underwater images that are mostly blue-green. Easily absorbed, the image red channel brightness is low, while the green channel is relatively better preserved. Therefore, this paper uses the method of red channel color compensation to improve the image color distortion problem.
Let x be the image position, first extract the RGB three channels of the color image, then accumulate the image grayscale values in the channels in turn, finally iterate the number of each element of the image, and divide the summed value after the iteration by the total number of pixels of the image, and the average value of each pixel in the three channels is calculated as follows.
|
|
|
Where Ir, Ig, Ib are the red, green and blue channels and all channels are normalized in the range of [0, 1] after their upper dynamic range. And Īr, Īg, Īb denotes the mean value of Ir, Ig, Ib. Compensating for red attenuation can make certain green signals smaller than the pixels within the red channel become red information and used IRC to represent the red channel, which is compensated as:
|
2.2.5 Multi-scale Integration
2.2.5.1 Weight Fusion
Multiscale fusion of images is a method of image fusion enhancement with different weights based on Laplace pyramid and Gaussian pyramid[16]. The exposed image after light source optimization, gamma correction and color compensation has significantly improved in color distortion and imaging blur, etc. In order to improve the image clarity, the algorithm in this paper only performs weight fusion on the V component of HSV color space, and then Laplace and Gaussian pyramid fusion on the overall image to get the enhanced image. The weight fusion includes the following four types: local contrast weight wc, Laplace contrast weight wl, saturation weight ws, and saliency weight wt.
(1) Local comparison weights
The local contrast weight is the deviation relationship between the brightness of each pixel of the input image and the average of the brightness of the neighboring pixels, so that the local contrast is enhanced in the fusion process[17], and the expression is:
|
Where Lk is the input luminance channel, Iwhc is the Gaussian low-pass filter, and the cutoff frequency is ![]() .
.
(2) Laplace contrast weights
The Laplace operator can effectively handle image edge information by applying the Laplace filter to the bright channel of each input image to obtain the global contrast by calculating the absolute value[18].
(3) Saturation weighting
The saturation weights are used to adjust the saturation range in the image to achieve a saturation-balanced fused image, and the expressions is:
|
Where Li is the input image grayscale map.
(4) Saliency weighting
The saliency weight is to enhance the contrast of the light and dark areas and the overall contrast of the image for the objects that are not prominent in the water environment, the expression is:
|
Where ![]() denotes the average value of the lab color channels. Normalizing the above weights, the expressions are as follows:
denotes the average value of the lab color channels. Normalizing the above weights, the expressions are as follows:
|
|
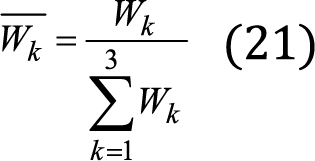
Where Wk is the fused image weight value and ![]() is the normalized weight value.
is the normalized weight value.
2.2.5.2 Pyramid Image Fusion
Once the weights are fused, the image will have obvious halos, which makes some details of the image lost, so it is necessary to perform multi-scale fusion on the image again, the method is as follows: firstly, the processed image is decomposed in a 3-layer Gaussian pyramid as a way to increase the color clarity of each level of the image; then the Laplace pyramid is obtained by making a difference with the adjacent two layers of the Gaussian pyramid, and the low-resolution image xk needs to be expanded to the same width as the high-resolution image xk-1 again as a difference. The new image embedded between the original image is determined by the weighted average of the grayscale difference with the original image. At this point, the kth layer of the pyramid is then scaled between the expanded image and the layer k-1 image to derive the layer k-1 of the Laplace pyramid; finally, the Laplace result map is upsampled to obtain the multiscale fusion image, which is calculated as follows:
|
Where k represents the number of input images, G represents Gaussian pyramid decomposition, L represents Laplace pyramid decomposition, and l is the number of pyramid layers.
2.2.6 Experiment
In this paper, the effect of image processing is tested by subjective evaluation and objective evaluation indicators, so as to verify the effectiveness of the proposed algorithm. According to the underwater data of uneven artificial light source (Figure 4A), weak light (Figure 4B), natural weak light (Figure 4C) and natural weak light with uneven illumination (Figure 4D), At the same time, it is compared with four image enhancement algorithms. The experimental platform is MATLAB R2016a, and the comparison of results is shown in Figure 4.
|
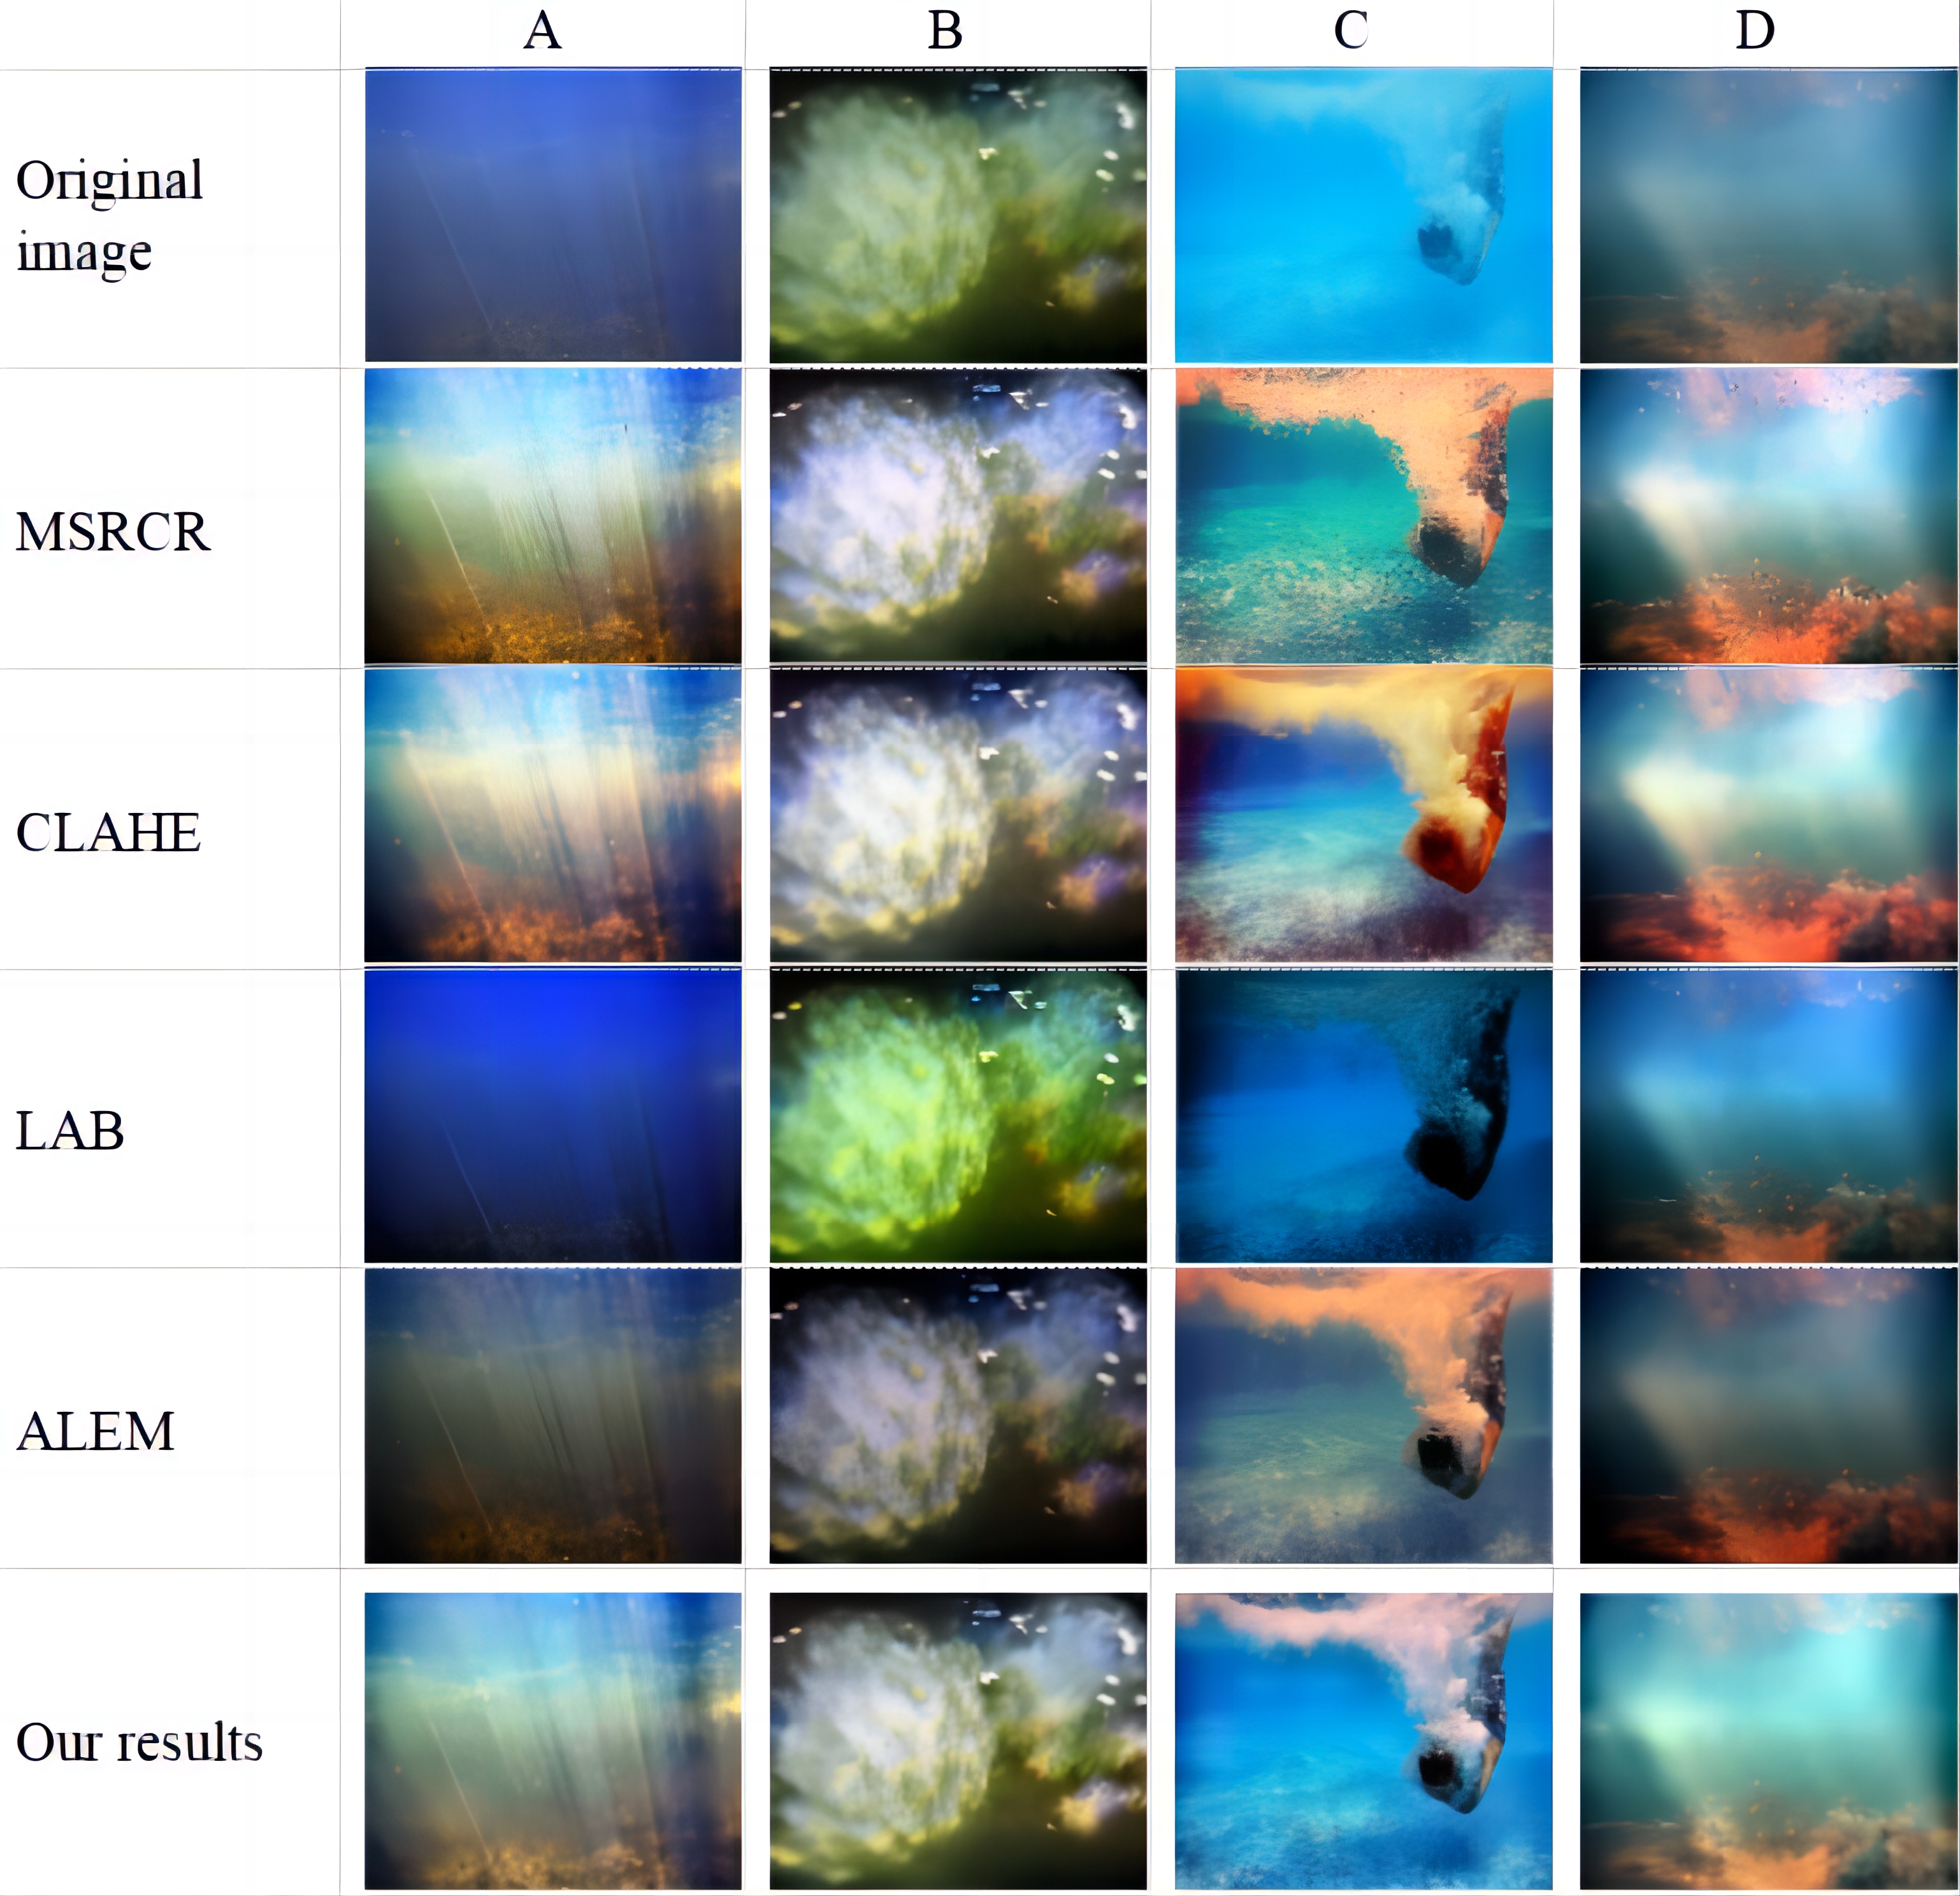
Figure 4. Comparison of different algorith.
2.2.6.1 Subjective Assessment
As can be seen in Figure 4, the brightness of the photo is improved after processing with the MSRCR algorithm, but there is a problem of over-enhancement, which causes the overall image to look white and the image details are lost (see Figure 4B and Figure 4D). The brightness of the photo can be improved using the CLAHE algorithm, but the image color distortion is high (see image (B) and image (C)). the color preservation ability of the image after the LAB algorithm processing is slightly improved, but the brightness of the darker parts is not much improved (see image (A) and image (C)). the image after the AIEM algorithm processing has artifacts at the edges of the foreground objects, which affects the visual effect of the image (see image (A) and image (D)). The technique used in this study improves the brightness of the dark parts of the image without overexposure, and the effect of color preservation is comparable to that of the CLAHE algorithm. The edges of the images processed by the method described in this paper are sharper due to the addition of the filtering operation.
2.2.6.2 Objective Evaluation
For the processing results of the algorithm in Figure 4, three objective indicators, contrast, information entropy, and peak signal-to-noise ratio (PSNR) are used for performance evaluation. The contrast map indicates the overall effect of the image, the better the overall effect of the image depend on the higher value; the information entropy indicates the fidelity of the image after the algorithm processing, i.e., whether the image information is destroyed by the algorithm; the peak signal-to-noise ratio is a quality detection index proposed on the basis of the mean square error, which reflects the compression of pixels before and after image enhancement, and the larger the peak signal-to-noise ratio indicates the better color effect of the image in the experiment, and the formula is expressed as follows:
|
The data results of each index are shown in Table 1, and the comparative analysis is as follows: The structural similarity (SSIM) data shows that the contrast value of the image processed by this algorithm has improved significantly compared with other methods, indicating that the image details obtained by this algorithm are clearer, the overall effect is better, and the chromatic aberration has been well improved. The information entropy (IE) data shows that the information entropy obtained with this algorithm is almost equal, indicating that the image information fidelity obtained with this algorithm is higher, while the information entropy obtained in this paper is slightly higher, indicating that more information is retained and better recovered after image clarification. PSNR data show that the images processed with this algorithm have the largest values, indicating that the overall image effect is better preserved and the colors are more natural. The images in Figure 4 were extracted and matched with features using the scale-invariant feature transform (SIFT) algorithm from the VLFeat library, and the number of extracted feature points is shown in Figure 5. From the data comparison, it can be seen that the number of feature points extracted from the underwater images enhanced by the algorithm in this paper is significantly increased, and the extraction ability is relatively stable for four underwater images with different illumination and does not fluctuate much between different images.
Table 1. Values of the Evaluation Indicators
Image Index |
Algorithm |
SSIM |
IE |
PSNR |
Figure 1 |
MSRCR |
7.3273 |
21.8306 |
10.5068 |
CLAHE |
6.0367 |
23.6343 |
11.3316 |
|
LAB |
5.8580 |
21.0696 |
10.3689 |
|
ALEM |
9.9101 |
24.1989 |
14.3850 |
|
Our results |
15.8497 |
24.9144 |
16.5083 |
|
Figure 2 |
MSRCR |
5.9058 |
23.9884 |
10.4838 |
CLAHE |
4.1322 |
22.5597 |
12.4892 |
|
LAB |
5.4867 |
22.7245 |
11.2695 |
|
ALEM |
8.9301 |
23.6723 |
10.3558 |
|
Our results |
12.8025 |
24.3911 |
14.4981 |
|
Figure 3 |
MSRCR |
4.1712 |
17.1417 |
10.4732 |
CLAHE |
7.0950 |
22.1539 |
11.4964 |
|
LAB |
6.5386 |
14.4129 |
10.2778 |
|
ALEM |
5.0418 |
21.3387 |
12.3685 |
|
Our results |
10.0054 |
24.6684 |
13.4968 |
|
Figure 4 |
MSRCR |
4.3651 |
23.0114 |
10.4989 |
CLAHE |
5.6005 |
24.5192 |
12.4729 |
|
LAB |
3.7448 |
22.5441 |
11.4046 |
|
ALEM |
3.3058 |
22.0114 |
12.2754 |
|
Our results |
11.0848 |
24.4009 |
15.4996 |
|
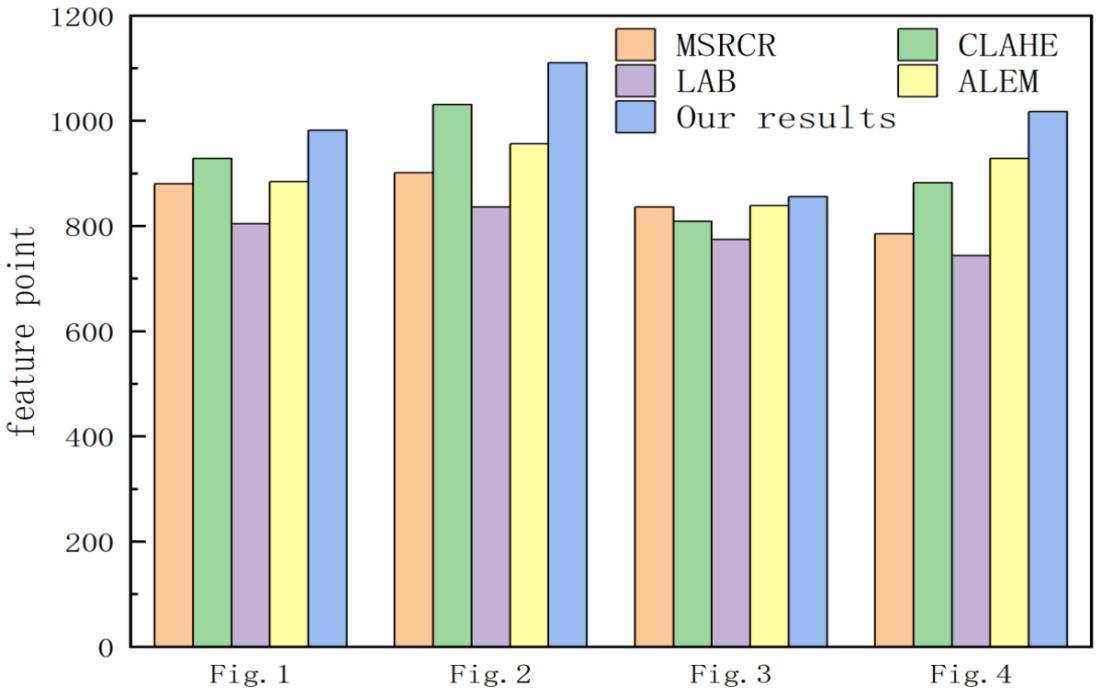
Figure 5. Comparison of the number of feature points.
2.3 Feature Extraction Based on SIFT
The SIFT technique is rotation and scale invariant, which means it discovers key points (feature points) on multiple scale spaces and estimates their direction, size, and scale, among other things[19-21]. The SIFT algorithm offers the following benefits over other algorithms.
(1) Stability, the SIFT feature is a local image feature that retains invariance for rotation, scale scaling, and brightness changes, as well as a certain degree of stability for viewpoint changes, affine transformation, and noise.
(2) Distinctiveness, information-rich, and appropriate for fast and accurate matching in enormous feature databases.
(3) Multi-quantity, even a few items may generate a significant number of SIFT feature vectors.
(4) High speed, the improved SIFT matching method can fulfill real-time needs.
(5) Extensibility, it is simple to mix with various types of feature vectors.
Due to the effect of the underwater environment, underwater picture photography will frequently meet a certain degree of distortion, such as uneven lighting, sea water oscillations, and other variables, which may contribute to the evident edge blur issue after image denoising. Based on the qualities listed above, the SIFT method is more suited for underwater picture mosaic than other algorithms. This research adds texture information of feature points to photos with fewer underwater feature points to gain more key points. The detailed steps are as follows.
2.3.1 Feature Point Detection
2.3.1.1 Construction of Gaussian Differential Scale Space
|
where σ is the spatial scale factor, indicating the degree of picture blurring; scale space L(x,y,σ) is the convolution of the Gaussian function G(x,y,σ) and the original image I(x,y), and the Gaussian function may be represented at different scales as
|
The Gaussian differential scale space is made up of the Gaussian function and the picture pyramid. The Gaussian function blurs the picture to various degrees, alters the image size using an image pyramid, produces an image pyramid model, and builds scale space. Layers of the same size with varying degrees of blurring may be generated by downsampling the picture and differencing (subtracting) each layer, generating a Gaussian differential pyramid model.
2.3.1.2 Find the Feature Point
Determine whether a difference of gaussian scale space point is an extreme point. To identify the local maximum and minimum points, as illustrated in Figure 6, compare the pixel and its 8 neighboring points and 9 adjacent points in the upper and lower layers. The Gaussian difference scale-space formula was used to remove border points in order to remove low contrast and unstable feature points.
|
where k is the parameter governing the magnitude of the eigenvalue.
|
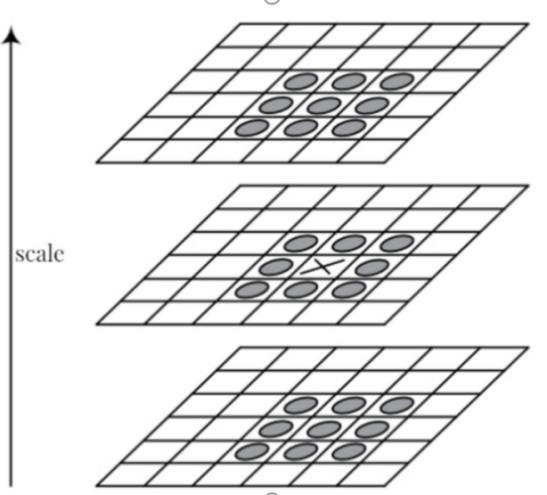
Figure 6. Extreme point judgment.
Since key point identification necessitates three layers of scale space, the first and last levels cannot be employed for key point detection. To guarantee that the extreme points of the first and last layers are not lost, the basic way is to construct two pictures with Gaussian blur[22-25] and position them at the beginning and end points of the scale space.
2.3.1.3 Remove Unqualified Feature Points
Since the value of scale space is sensitive to noise and edge, key points need to be selected, unqualified points[26] (low contrast points and unstable edge points) need to be removed, and the remaining points are feature points after accurate positioning. The steps are as follows.
Taylor's formula is used to expand the scale space function D(x,y,σ) of equation
|
Take the derivative of the formula and set its value to 0 to obtain the key points:
|
|
According to the literature, if ![]() , the key point is not a low contrast point and may be retained; otherwise, it can be erased. Given the unique features of underwater lighting dim, it is preferable in this research to sample the brightness threshold 0.01 feature point by experiment, and increase the accuracy of underwater picture alignment by increasing the key point extraction range.
, the key point is not a low contrast point and may be retained; otherwise, it can be erased. Given the unique features of underwater lighting dim, it is preferable in this research to sample the brightness threshold 0.01 feature point by experiment, and increase the accuracy of underwater picture alignment by increasing the key point extraction range.
2.3.2 Direction of the Key Point
2.3.2.1 Put Values in the Key Points' Direction
The gradient magnitude m(x,y) and gradient direction θ(x,y) around the key point are assigned to it using the following equations, respectively, to make the key point rotationally invariant.
|
|
Where L (x,y) is the scale space's pixel-by-pixel grayscale data corresponding to the key point. The gradient direction is represented by the direction of the arrow, and the length indicates the magnitude size. The window is then divided into eight columns, one column for each 45°, to create a histogram of the gradient direction. Lowe et al.[27] noted that the peak of the histogram indicates the main direction of the gradient.
2.3.2.2 Improved Feature Point Descriptors
Each keypoint is given location, scale, and orientation information using the aforementioned processes. The next step is to build a description for each keypoint that can be distinguished and is independent of factors like lighting, perspective, etc. By chunking the image area around the key point, computing the gradient histogram within the block, dividing the neighborhood around the feature point into 4×4 sub-regions, each of which is a square, and finally computing 8 directions (one direction taken at every 45°) for each sub-region for Gaussian weighting, the main goal is to add texture information to the feature points in order to make the underwater image texture features more obvious. Then, as illustrated in Figure 7, each feature point may provide 4×4×8=128-dimensional feature descriptors.
|
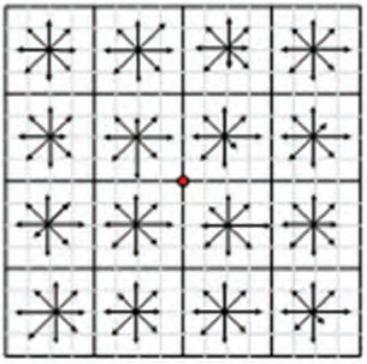
Figure 7. Generation of feature point descriptors.
This study extends the original SIFT feature by include a feature point neighborhood texture information, allowing the descriptors to more precisely characterize the feature point information and increasing the accuracy of feature matching. The classic SIFT method is enhanced by adding the feature vector, and the new approach is tested against the original SIFT algorithm in an experiment for image recognition. The findings demonstrate the excellent identification rate and resilience of this approach. The pixel as well as the neighborhood's grayscale distribution represent the image's textural characteristics. The phrase goes like this:
|
2.3.3 Improved Feature Point Matching
For feature point matching, the traditional SIFT method employs Euclidian Distance. Because underwater picture capture is more susceptible to environmental interference, this research employs Nearest-Neighbor with Distance Ratio for coarse feature point matching before employing the Random Sample Consensus (RANSAC) algorithm for exact feature point matching. Improving matching accuracy improves matching speed.
The principle of the nearest neighbor and second-nearest neighbor ratio method is to calculate the Euclidean distance of two groups of nearest neighbor feature points and the second-nearest neighbor feature points. If the Euclidean distance ratio is less than a certain threshold (generally set as 0.7), the feature points are considered to be matched successfully; otherwise, the matching fails. Let the feature descriptors be n-dimensional, and define the Euclidean distance between the two feature descriptors as:
|
|
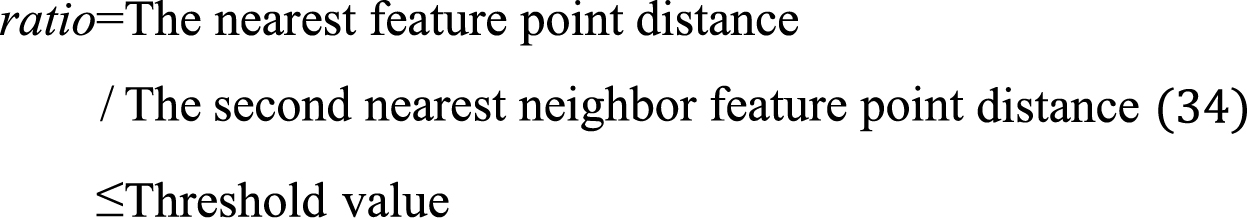
Where N is the number of map feature descriptors to be aligned. The RANSAC method is necessary for fine matching of feature points after coarse matching filters out part of the matching feature points. The RANSSAC (RANdom SAmole Consensus, Random Sampling Consensus)[28-32] algorithm assumes that all data conform to a certain pattern, obtains this pattern by random sampling, and finds the pattern that satisfies a larger number of data conform by repeatedly obtaining the pattern. The reason why it can be applied in feature point matching is that the transformation of two images is a single-shoulder transformation[33,34]. The single-shoulder transformation can be obtained from four corresponding points to obtain the single-shoulder transformation matrix, and all corresponding points in the images should satisfy this single-shoulder matrix transformation law, so the RANSAC algorithm can be used for the optimization of feature point matching[35-39], and its principle is as follows.
(1) Choose four sets of non-coincident matched point pairs at random to form the first set of interior points S’. Solve the transformation matrix H, which is indicated by the model M.
(2) The remaining point pairs are individually substituted into the M model, and the model error is calculated. If the error is less than the specified threshold, the pair is assigned to the inner point set S’.
(3) To generate the optimum model M with the set of interior points S’, assess if the number of interior points in S’ reaches a threshold and stop iterating if the threshold is reached.
(4) After removing the abnormal data, the transformation matrix H is recalculated using the matched set S’.
2.3.4 Image Fusion
After image alignment is the operation of image fusion. If the direct fusion method is used at this point, the visual effect of the fused image will be poor, as the overlapping part of the two images to be stitched is prone to the phenomenon of stitching seams visible to the naked eye, and the image will be blurred due to the simple accumulation of pixels by the algorithm itself. For this reason, a weighted average method is used instead of the direct fusion method[40-43] to perform the fusion operation on the images.
If f1, f2 are two pictures to be stitched together, and images f1 and f2 are superimposed in space, then the fused image pixels f (x,y) may be described as
|
In the overlapping region, d1 gradually changes from 1 to 0 and d2 gradually changes from 0 to 1, providing a smooth transition from f1 to f2 and achieving the effect of picture fusion.
3 RESULTS AND DISSCUSION
The algorithm proposed in this paper is compared to the standard SIFT algorithm in the MATLAB 2018b environment. To verify the effectiveness of the algorithm in this paper, underwater images are acquired with an AUV system, the average dive depth is 1-2 meters to shoot the underwater hull video, two images are selected as the images to be matched, and the experimental processing results are shown in Figure 8.
|
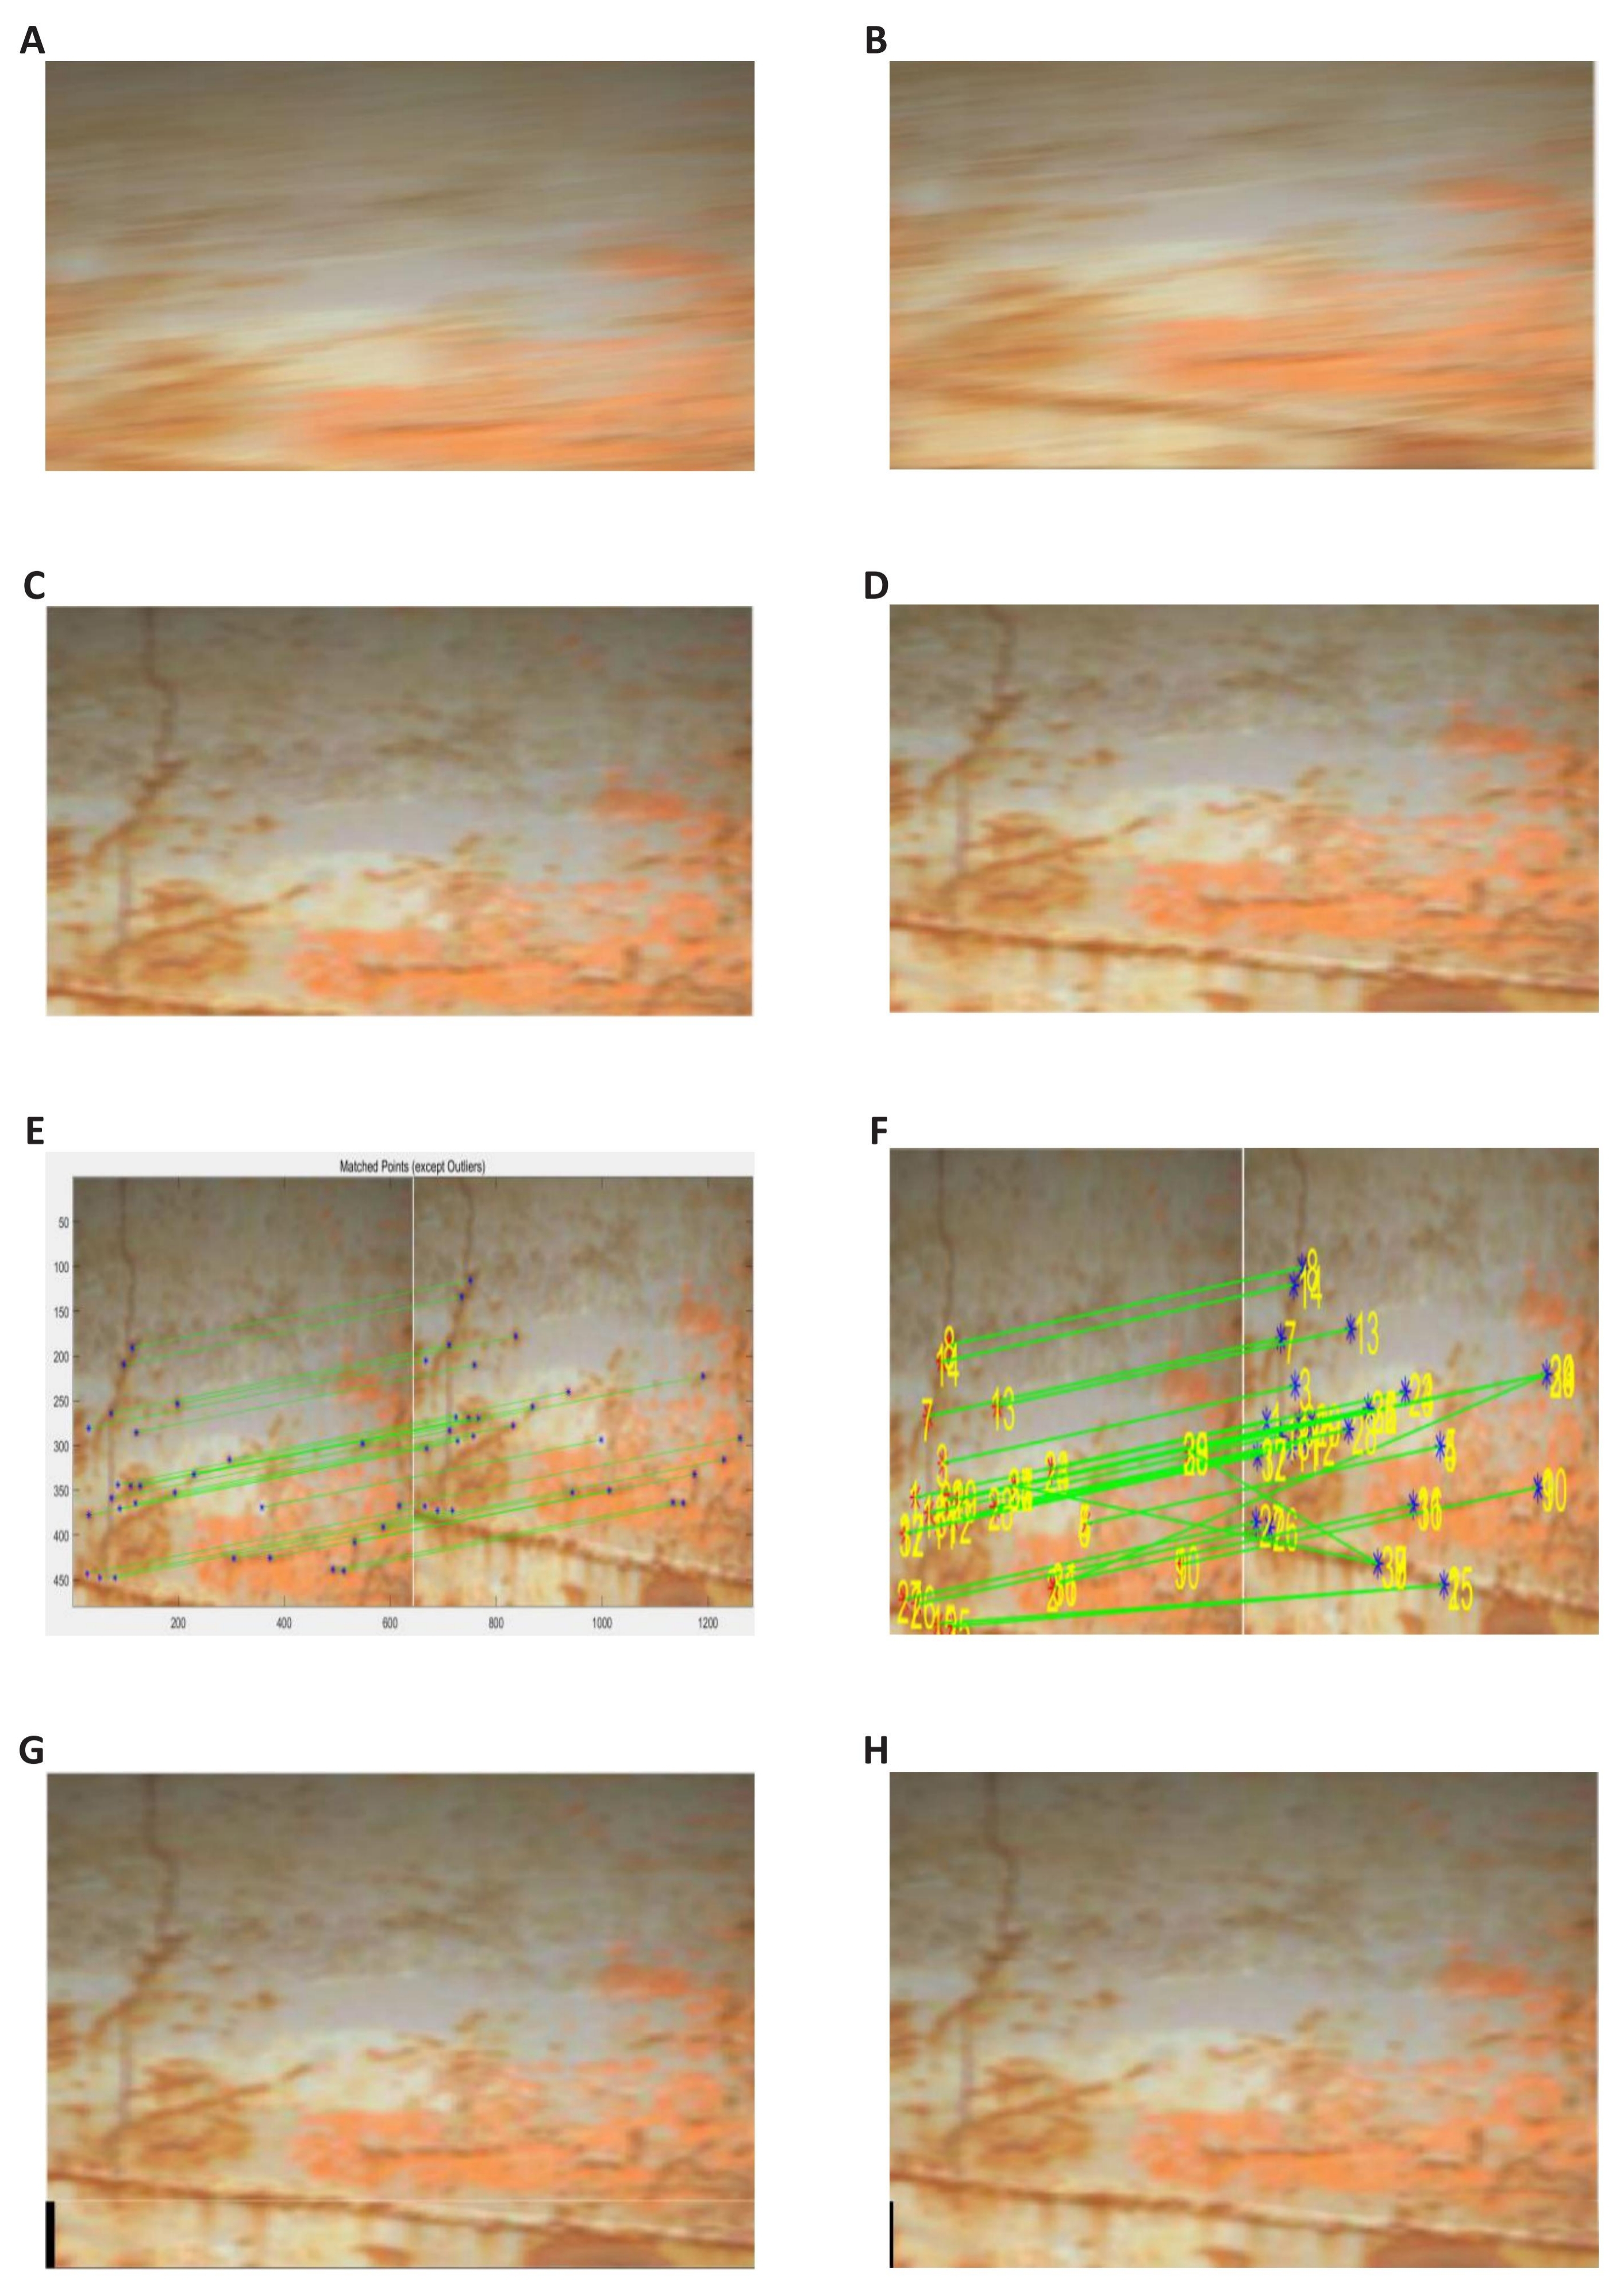
Figure 8. Comparison of image stitching results using SIFT and proposed algorithm for underwater hull video. A and B: Original image to be matched; C and D: Pre-processed image; E and F: Feature point matching results. E: Original SIFT feature matching; F: SIFT feature matching in this paper; G and H: Image Mosaic result. G: Original SIFT image Mosaic results; H: SIFT image Mosaic results in this paper.
By comparing Figure 8G and 8H and quantized Table 2, it can be seen that there are few feature points extracted by standard SIFT technology, and obvious image dislocation exists after matching. However, after adopting the technology described in this study, the number of feature points in the underwater stitching image is obvious, and the stitching dislocation points are reduced after stitching, so the stitching effect can be seen.
Table 2. Data Comparison between the Proposed Algorithm and SIFT Algorithm
Algorithm |
Number of Feature Points |
Number of Feature Matching Points |
Successful Matches |
Matching Accuracy Rate /% |
Time Consum/s |
Classic SIFT |
169 |
11 |
1 |
9.1% |
15 |
Enhancement + Classic SIFT |
242 |
69 |
32 |
46.4% |
35 |
Enhancement + Improved SIFT |
280 |
82 |
57 |
69.5% |
29 |
4 CONCLUSION
In this paper, we provide an underwater image stitching method based on the optimization of AUV-guided light sources for the interference caused by the special underwater environment on the images captured by AUV. We establish an illumination-reflection model for the V-component of the extracted images and add improved algorithms for the low-frequency and high-frequency components to achieve light source optimization. Pre-processing of underwater light interference images is achieved by combining two algorithms of gamma correction and multi-scale fusion. In addition, an improved RANSAC method for underwater image alignment is also proposed, i.e., the matching accuracy is improved by adding feature point texture information, and the coarse matching and fine matching of feature points are improved by using the nearest neighbor and second nearest neighbor ratio method to enhance the matching rate of image stitching and using RANSAC algorithm and eliminate artificial stitching traces. The experimental results show that the proposed enhancement algorithm is used to process the images to obtain images with rich details, good color preservation, high signal-to-noise ratio and rich texture information. Compared with other algorithms, the algorithm extracts the most feature points and can meet the requirements of SIFT image stitching. Therefore, the enhanced image can obtain more matching pairs when image matching is performed, and the image has higher stitching accuracy. In summary, the proposed method can meet the requirements of fast and efficient image stitching, which provides value for the application of AUV in underwater image acquisition and processing.
Acknowledgements
This work was financially supported by the Scientific Research Foundation for Advanced Talents of Beibu Gulf University (18KYQD30), Project of Qinzhou Science and Technology Source (202116622). CSSC Guangxi Shipbuilding and Offshore Engineerin Technology Collaboration Project (ZCGXJSB20226300222-06).
Conflicts of Interest
The authors declared that they have no competing interests.
Author Contribution
Deng R was responsible for conceptualizationt, software, data analysis and paper writing; Qu W was responsible for alidation, writing review & editing, funding acquisition; Qiu C was responsible for supervision, project administration; Luo J was responsible for project administration; Gao J was responsible for visualization; Wu Y was responsible for data curation; Yan J was responsible for resources.
Abbreviation List
AUVs, Autonomous undersea vehicles
MSR, Multi-scale retinex
MSRCR, Multi-scale retinex color restoration
PSNR, Peak signal-to-noise ratio
SSIM, Structural similarity
IE, Information entropy
SIFT, Scale-invariant feature transform
RANSAC, Random sample consensus
[1] Rahman Z, Jobson DJ, Woodell GA. Multi-scale retinex for color image enhancement: Proceedings of 3rd IEEE international conference on image processing. Harbin, China, 26-30 July 2011. DOI: 10.1109/ICIP.1996.560995
[2] Van Dyke JM, Brooks RA. Uninhabited islands: Their impact on the ownership of the oceans’ resources. Ocean Dev Int Law, 1983; 12: 265-300. DOI: 10.1080/00908328309545711
[3] Wang P, Wang Z, Lv D et al. Low illumination color image enhancement based on Gabor filtering and Retinex theory. Multimed Tools Appl, 2021; 80: 17705-17719. DOI: 10.1007/s11042-021-10607-7
[4] Hao S, Han X, Zhang Y et al. Low-light enhancement based on an improved simplified Retinex model via fast illumination map refinement. Pattern Anal Appl, 2021; 24: 321-332. DOI: 10.1007/s10044-020-00908-2
[5] Galdran A. Image dehazing by artificial multiple-exposure image fusion. Signal Pr, 2018; 149: 135-147. DOI: 10.1016/j.sigpro.2018.03.008
[6] Bai L, Zhang W, Pan X et al. Underwater image enhancement based on global and local equalization of histogram and dual-image multi-scale fusion. IEEE Access, 2020; 8: 128973-128990. DOI: 10.1109/ACCESS.2020.3009161
[7] Cristin R, Kumar BS, Priya C et al. Deep neural network based Rider-Cuckoo Search Algorithm for plant disease detection. Artif Intell Rev, 2020; 53: 4993-5018. DOI: 10.1007/s10462-020-09813-w
[8] Li C, Liu J, Wu Q et al. An adaptive enhancement method for low illumination color images. Appl Intell, 2021; 51: 202-222. DOI: 10.1007/s10489-020-01792-3
[9] Ancuti CO, Ancuti C, De Vleeschouwer C et al. Color balance and fusion for underwater image enhancement. IEEE T Image Process, 2017; 27: 379-393. DOI: 10.1109/TIP.2017.2759252
[10] Azimpour P, Bahraini T, Yazdi HS. Hyperspectral image denoising via clustering-based latent variable in variational Bayesian framework. IEEE T Geosci Remote, 2021; 59: 3266-3276. DOI: 10.1109/TGRS.2019.2939512
[11] Rasti B, Koirala B, Scheunders P et al. UnDIP: Hyperspectral unmixing using deep image prior. IEEE T Geosci Remote, 2021; 60: 1-15. DOI: 10.1109/TGRS.2021.3067802
[12] Adams RJ, Smart P, Huff AS. Shades of grey: guidelines for working with the grey literature in systematic reviews for management and organizational studies. Int J Manag Rev, 2017; 19: 432-454. DOI: 10.1111/ijmr.12102
[13] Garcia JCB, Sibille A, Kamoun M. Reconfigurable intelligent surfaces: Bridging the gap between scattering and reflection. IEEE J Sel Area Comm, 2020; 38: 2538-2547. DOI: 10.1109/JSAC.2020.3007037
[14] Desmond H. Shades of grey: Granularity, pragmatics, and non-causal explanation. Perspect Sci, 2019; 27: 68-87. DOI: 10.1162/posc_a_00300
[15] Abbadi NKEL, Al Hassani SA, Abdulkhaleq AH. A review over panoramic image stitching techniques. J Phys Conf Series, 2021; 1999: 012115. DOI: 10.1088/1742-6596/1999/1/012115
[16] Chu HH, Xue B, Li N. Research on Workpiece Image Mosaic Technology of Groove Cutting Robot. Arab J Sci Eng, 2021; 46: 9065-9082. DOI: 10.1007/s13369-021-05734-0
[17] Lowe DG. Distinctive image features from scale-invariant keypoints. Int J Comput Vision, 2004; 60: 91-110. DOI: 10.1023/B:VISI.0000029664.99615.94
[18] Wang J, Lu K, Xue J et al. Single image dehazing based on the physical model and MSRCR algorithm. IEEE T Circ Syst Vid, 2017; 28: 2190-2199. DOI: 10.1109/TCSVT.2017.2728822
[19] Zhang W, Dong L, Pan X et al. Single image defogging based on multi-channel convolutional MSRCR. IEEE Access, 2019; 7: 72492-72504. DOI: 10.1109/ACCESS.2019.2920403
[20] Maini R, Aggarwal H. A comprehensive review of image enhancement techniques. arXiv preprint arXiv: 1003.4053, 2010. DOI: 10.48550/arXiv.1003.4053
[21] Schettini R, Corchs S. Underwater image processing: state of the art of restoration and image enhancement methods. EURASIP J Adv Signal Process, 2010; 2010: 1-14. DOI: 10.1155/2010/746052
[22] Ancuti CO, Ancuti C, De Vleeschouwer C et al. Color balance and fusion for underwater image enhancement. IEEE T Image Process, 2017; 27: 379-393. DOI: 10.1109/TIP.2017.2759252
[23] Iqbal K, Salam R A, Osman A et al. Underwater Image Enhancement Using an Integrated Colour Model. IAENG Int J Com Sci, 2007; 34: IJCS_34_2_12.
[24] Anwar S, Li C, Porikli F. Deep underwater image enhancement. arXiv preprint arXiv: 1807.03528, 2018. DOI: 10.48550/arXiv.1807.03528
[25] Islam MJ, Xia Y, Sattar J. Fast underwater image enhancement for improved visual perception. IEEE Robot Autom Let, 2020; 5: 3227-3234. DOI: 10.1109/LRA.2020.2974710
[26] Chiang JY, Chen YC. Underwater image enhancement by wavelength compensation and dehazing. IEEE T Image Process, 2011; 21: 1756-1769. DOI: 10.1109/TIP.2011.2179666
[27] Wang Y, Zhang J, Cao Y et al. A deep CNN method for underwater image enhancement: 2017 IEEE international conference on image processing (ICIP). Beijing, China, 17-20 September 2017. DOI: 10.1109/ICIP.2017.8296508
[28] Fu X, Fan Z, Ling M et al. Two-step approach for single underwater image enhancement: 2017 international symposium on intelligent signal processing and communication systems (ISPACS). Xiamen, China, 06-09 November 2017. DOI: 10.1109/ISPACS.2017.8266583
[29] Zheng L, Shi H, Sun S. Underwater image enhancement algorithm based on CLAHE and USM: 2016 IEEE International Conference on Information and Automation (ICIA). Ningbo, China, 01-03 August 2016. DOI: 10.1109/ICInfA.2016.7831889
[30] Ma J, Fan X, Yang SX et al. Contrast limited adaptive histogram equalization-based fusion in YIQ and HSI color spaces for underwater image enhancement. Int J Pattern Recogn, 2018; 32: 1854018. DOI: 10.1142/S0218001418540186
[31] Deperlioglu O, Kose U. Practical method for the underwater image enhancement with adjusted CLAHE: 2018 International Conference on Artificial Intelligence and Data Processing (IDAP). Malatya, Turkey, 28-30 September 2018. DOI: 10.1109/IDAP.2018.8620727
[32] Yang ZL, Guo BL. Image mosaic based on SIFT: 2008 International Conference on Intelligent Information Hiding and Multimedia Signal Processing. Harbin, China, 15-17 August 2008. DOI: 10.1109/IIH-MSP.2008.335
[33] Xie X, Xu Y, Liu Q et al. A study on fast SIFT image mosaic algorithm based on compressed sensing and wavelet transform. J Amb Intel Hum Comp, 2015; 6: 835-843. DOI: 10.1007/s12652-015-0319-2
[34] Hossein-Nejad Z, Nasri M. Natural image mosaicing based on redundant keypoint elimination method in SIFT algorithm and adaptive RANSAC method. Signal Data Process, 2021; 18: 147-162. DOI: 10.52547/jsdp.18.2.147
[35] Li D, Han D, Zhang X et al. Panoramic image mosaic technology based on sift algorithm in power monitoring: 2019 6th international conference on systems and informatics (ICSAI). Shanghai, China, 02-04 November 2019. DOI: 10.1109/ICSAI48974.2019.9010294
[36] Wang F B, Tu P, Wu C et al. Multi-image mosaic with SIFT and vision measurement for microscale structures processed by femtosecond laser. Opt Laser Eng, 2018; 100: 124-130. DOI: 10.1016/j.optlaseng.2017.08.004
[37] Suseendran G, Chandrasekaran E, Pal S et al. Comparison of Multidimensional Hyperspectral Image with SIFT Image Mosaic Methods for Mosaic Better Accuracy. In: Intelligent Computing and Innovation on Data Science. Springer Singapore, Singapore, 2021; 201-212. DOI: 10.1007/978-981-16-3153-5_23
[38] Zhu JT, Gong CF, Zhao MX et al. Image mosaic algorithm based on PCA-ORB feature matching. Int Arch Photogramm Remote Sens Spatial Inf Sci, 2020; 42: 83-89. DOI: 10.5194/isprs-archives-XLII-3-W10-83-2020
[39] Wei M, Xiwei P. Wlib-sift: A distinctive local image feature descriptor: 2019 IEEE 2nd International Conference on Information Communication and Signal Processing (ICICSP). Weihai, China, 28-30 September 2019. DOI: 10.1109/ICICSP48821.2019.8958587
[40] Huang Z, Wang H, Li Y. The Research of Image Mosaic Techniques Based on Optimized SIFT Algorithm: Proceedings of the 2019 International Conference on Robotics Systems and Vehicle Technology. Wuhan, China, 16-18 October 2019. DOI: 10.1145/3366715.3366737
[41] Ting R, Hu Y, Yang C et al. A research on Quick-SIFT and ghosting elimination technique for UAV image mosaic: International Symposium on Artificial Intelligence and Robotics. Kitakyushu, Japan, 1-10 August 2020. DOI: 10.1117/12.2579619
[42] Zhao J, Zhang X, Gao C et al. Rapid mosaicking of unmanned aerial vehicle (UAV) images for crop growth monitoring using the SIFT algorithm. Remote Sens, 2019; 11: 1226. DOI: 10.3390/rs11101226
[43] Hossein-Nejad Z, Nasri M. Clustered redundant keypoint elimination method for image mosaicing using a new Gaussian-weighted blending algorithm. Visual Comput, 2022; 38: 1991-2007. DOI: 10.1007/s00371-021-02261-9
Copyright © 2023 The Author(s). This open-access article is licensed under a Creative Commons Attribution 4.0 International License (https://creativecommons.org/licenses/by/4.0), which permits unrestricted use, sharing, adaptation, distribution, and reproduction in any medium, provided the original work is properly cited.


