Design and Analysis of Oscillating Water Column Wave Energy Converter Using Contra Rotary Self-rectifying Impulse Turbine
Raffay Hannan1, Jasim Mehmood1, Saqlain Abbas1*, Ahmed Nauman1, Zulkarnain Abbas2, Arsalan Zafar1
2Department of Mechanical Engineering NFC, Institute of Engineering and Technology, Multan, Pakistan
*Correspondence to: Saqlain Abbas, PhD, Assistant Professor, Head of Mechanical Engineering Department,Department of Mechanical Engineering, University of Engineering and Technology Lahore (Narowal Campus), Narowal 51600, Pakistan; Email: saqlain.abbas@uet.edu.pk
Abstract
Background: The global energy demand is rising day to day. To cover the energy gap, governments around the world are pursuing a variety of strategies to meet energy demands. However, according to the long-term strategy, all nonrenewable energy plants must be replaced with renewable energy sources. Existing technologies are enhanced, and new sources are being investigated for this purpose. The ocean covers 70% of the planet so there is a huge potential to extract energy from this source.
Objective: This research aims to optimize the design of an oscillating water column (OWC) wave energy converter to extract energy from ocean waves.
Methods: The total efficiency of an OWC wave energy converter is determined by the turbine's design configuration and the chamber's partially submerged water column. The various designs of wave energy turbines were examined before simulating the contra rotary impulse turbine with middle vanes at specific angles. The efficiency of the turbine was determined using ANSYS FLUENT workbench simulations. Additionally, the design of an OWC was simulated to determine the optimal chamber slope. To conduct experiments, a 3D-printed contra rotary self-rectifying impulse turbine with middle vanes was generated as a demonstration model. Middle vanes used in contra-rotary turbines can assist in reducing turbulence between contra rotors.
Results: The results demonstrate that the turbine with middle vanes has a higher torque coefficient Ct than the turbine without middle vanes. Similarly, the input coefficient Ca is higher for the turbine which has middle vanes. Therefore, the turbine with a middle vane shows better efficiency than the turbine without a middle vane in low flow coefficient as well as higher flow coefficient.
Conclusion: The efficiency of the contra rotatory turbine is greater than the single rotatory turbine and the efficiency increases further when middle vanes are added.
Keywords: renewable energy, self-rectifying impulse turbine, oscillating water column, wave energy converter
1 INTRODUCTION
Electricity consumption is rapidly expanding worldwide due to the growing human population and technological advances. The electrical power generation system relies on conventional fossil fuels for most of its electricity, sources of which are slowly depleting and generating environmental problems as well. The solution to this prevailing problem is relying on renewable energy sources (RES). Among the readily available RES are wind, sun, hydropower, geothermal, and biomass. Even though oceanic wave energy (OWE) is one of the sources of renewable energy, it is currently undervalued in the power sector[1]. The potential of wave energy is enough to fulfil the demand for energy double to the world's annual energy consumption, however, its contribution to the world energy consumption is 0.000061%[1]. Wind energy depends on the direction and duration, solar energy systems do not run at night, and geothermal energy is only available in certain regions or countries. In this framework, the availability of OWE is around three to four times greater than the availability of typical RES.
Yoshi Masuda, a Japanese naval engineer designed an oscillating water column (OWC) navigational buoy which used a turbine PTO system that generates electricity[2]. It was used to charge the batteries of the buoy. This was the first instance since OWC was used to generate electricity. Different turbines can be used in OWC, such as the Wells turbine, Hanna Turbine and Self-rectifying impulse turbines[3]. The oceans contain enormous reserves of non-renewable energy, which theoretically equal more than double the world's energy demand. This warms the sea and the air above it, creating an air current that moves the water and generates waves. Thus, the ocean is a massive energy source that is generated by four distinct processes including tides, waves, sea currents, and salinity gradients. The moon and sun's gravitational pull also contribute significantly to the formation of tides on the ocean. Ocean energy has a significant advantage in that it is highly predictable in terms of both timing and output levels. As the energy from the ocean has huge potential but the technology to extract energy from waves is not yet mature as compared to the energy from fossil fuels. Hence advanced research work is required to further develop and increase the efficiency of the wave energy conversion technologies. Significant research has already been done to increase the efficiency of turbines used in the OWC wave energy converters. Till now, mostly self-rectifying impulse turbines with modified blades and guided vane angles are used to maximize the efficiency to convert energy from waves into unidirectional rotational kinetic energy.
The main objective of this research is to develop the configuration of a contra rotary self-rectifying impulse turbine with middle vanes. This configuration of OWC wave energy turbine uses two rotors rotating in opposite direction with a middle vane between them to reduce eddies and increases laminar flow. Middle vanes were expected to increase the efficiency as compared to the turbine without middle vanes. A CAD model was designed and a middle vane was introduced in the final assembly. The simulation of the assembly was performed in CFD software to find different data points to evaluate the overall efficiency of the turbine. In the next phase of research, the working model of wave energy converter was fabricated which consists of an artificial wave generator, 2*4 ft acrylic glass tank, OWC chamber and 3D PLA printed contra-rotary self-rectifying impulse turbine with middle vanes. An experiment was conducted to find the energy efficiency of the prototype by relating the output to the energy supplied.
1.1 Literature Review
The primary issue is that fossil fuels are rapidly depleting because they cannot be replicated in a human lifetime. Even though countries worldwide are actively attempting to reduce their reliance on non-RES, demand continues to grow. To meet the world's growing energy demand, countries worldwide rely on fossil fuels. In 2018, nearly 70% of energy demand was met by oil, coal, and natural gas[4]. The only viable solution is to focus exclusively on RES. Renewable energy is a form of energy that is self-renewing and inestimable. Biomass, hydropower, geothermal, wind, and solar are the primary RES. Oceans cover around 70% of the surface of the earth which is mostly untapped due to economical and technological issues. Small Island Developing States (SIDS) can effectively and reliably exploit these types of energy sources. It can also power desalination plants located near shores where fresh water is scarce. Ocean wave energy can significantly reduce carbon dioxide emissions associated with power generation and contribute to a more sustainable future.
1.1.1 Wave Energy Converters
Wave power is the process of capturing the energy of waves to convert it into useful mechanical work such as electricity generation, water desalination, or even water pumping. Wave energy converters are the devices that harness this energy. There are numerous wave energy devices such as attenuators, the point absorber buoy, oscillating wave surge converter, etc. These devices are classified according to their energy extraction method, location, and power take-off system[5-7].
An OWC is an energy-generating device that is typically a partially submerged hollow structure located onshore or offshore in deeper waters. It incorporates an air chamber with a unidirectional air turbine on one side and an opening below the ocean's water level on the other side. The upward and downward motion of the water waves within the chamber compresses and decompresses the air to generate energy to operate a turbine connected to a generator. OWC offer several additional advantages, for example, the fact that they only have a single major moving component, referring to the rotor of a wind turbine that is situated above sea level. Graphical view of working principle of OWC is shown in Figure 1. During the crest and trough of waves, the air is compressed which rotates the impulse turbine to produce output power. Further research is required to evaluate its efficiency for the internal waves in the deep sea.
|
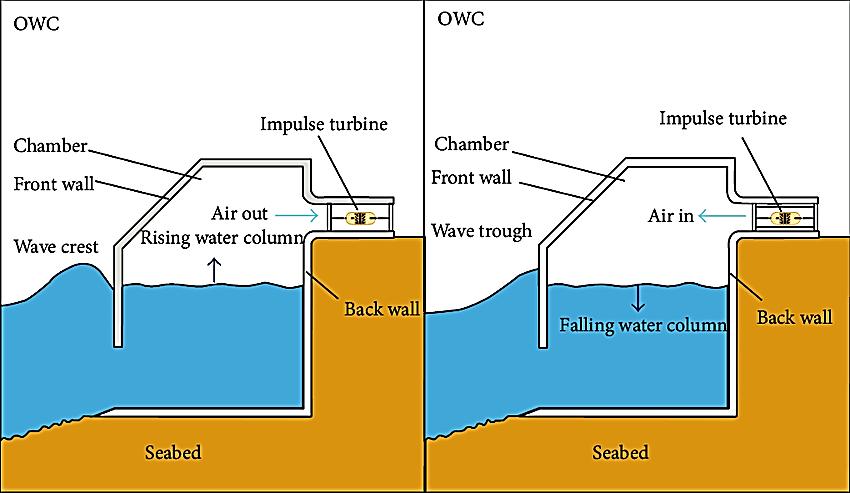
Figure 1. Graphical demonstration of working principle of OWC.
In the field of wave energy conversion, the OWC was the first idea to be developed, and it has remained the technology of choice for the great majority of wave energy transmission applications. Many OWC plants may be accessed from either a detached coastline or a close beachfront position[8]. It is the self-rectifying technology that allows turbines used in OWCs to maintain a steady rotational direction no matter which direction of the airflow is being generated.
In 1885, an American Scientific journal published an article about the whistling buoy invented by M. Courtney in New York. The development and testing of various offshore wind farms (OWFs) along shorelines and coastlines occurred during the 1980 and 1990[9]. The system, which went into service in 1989, was equipped with a Wells tandem turbine. It was originally designed to produce a power of 60kW. In 2010, a conceptual design for the integration of offshore wind turbines with various breakwater formations was presented. According to the findings of this proposed design, the OWCs operate by the turbine having only one moving component and is protected by a sturdy structure, rather than coming into direct contact with water.
1.1.2 Wave Energy Turbines
According to the literature review, there are three main types of wave energy turbines. Wells Turbine is one of the most basic and, in many cases, most inexpensive wave energy conversion turbines as shown in Figure 2[10]. The turbine is more efficient than conventional turbines because it does not need rectifying air valves that will change the direction of blades when needed and can extract energy even when the flow coefficient is low. A significant amount of development has been executed in its design[11].
|
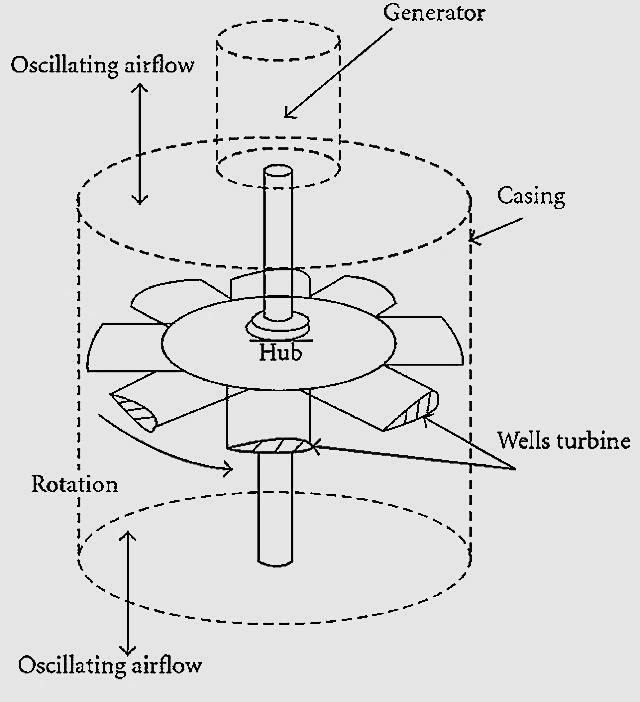
Figure 2. Schematic of Wells Turbine.
In addition to the Wells turbine, the axial flow self-rectifying impulse turbine is also a popular and successful alternative to the Wells turbine. The angle of the exit flows is nearly equal to the angle of the exit of the blades[12-14].
There are many constraints inherent in the Wells Turbine, including a restricted range of flow rates over which it can run at substantial efficiency, poor starting characteristics, high-speed operation with attendant noise, and a large amount of axial thrust[15]. As a solution to the inadequacies of the Wells turbine, Setoguchi developed an impulse turbine that used self-pitch-controlled guide vanes. It achieves realistic efficiency across a broad variety of flow rates while retaining low operating speeds. However, a large number of moving components generates difficulties in terms of maintenance and operational life, as well as higher operating expenses. It was determined that fixed guide vanes were more successful in addressing these difficulties than moving guide vanes, although performance may be lowered as a result of this decision. Experiments were carried out to determine the characteristics of a fixed-guide-vane impulse turbine[12].
The counter-rotating impulse turbine for wave energy converters with OWC has been developed by United States Naval Academy's M. E. McCormick in 1978[16]. There are two distinct rotors on this impulse-type turbine, which makes it one of the most efficient turbines available today. A model test was conducted in 1986. It has been discovered by experts that an average efficiency of approximately 0.3 is reached in this process. In contrast, there is a paucity of precise information available on the properties of the counter-rotating impulse turbine, which is because the turbine rotates in the opposite direction due to wind.
To solve the above-mentioned issues, studies on the design configurations of the turbine are being conducted to further improve the overall efficiency of the OWC power plant. In this framework, the authors of the current research work introduced the concept of middle vanes in Contra rotary radial impulse turbine which could help in reducing the turbulence between rotors, hence possibly increasing the overall efficiency.
2 MATERIALS AND METHODS
2.1 Research Methodology
The current research involved designing the contra rotary radial impulse turbine on 3D CAD software such as Solid Works and then the assembly was simulated in Turbo machinery Workbench of Ansys CFD. In the next phase of the research, a working model was fabricated consisting of a tank and chamber made up of acrylic glass, and a PLA 3D printed turbine.
2.1.1 Modelling of Contra Rotary Radial Impulse Turbine
In the previous studies related to the turbine design, it was found that the higher values of the flow coefficient resulted in greater turbine efficiency, particularly at peak values. In this framework, a middle vane is also installed between the two turbine blades in this particular design of turbine. For this purpose, it is necessary to use two turbines with rotor blades that are moving in opposite directions and separated by a middle vane. The current approach is adopted to enable the turbine to rectify itself in accordance with the direction of the air. Consequently, when the air flow changes direction, the turbine rectifies itself and produces an output in either direction of the air velocity. The middle vane is used to modify the direction of the air coming from the first turbine, and then the air entered the other turbine rotor blades, resulting in the production of electricity. Table 1 shows the dimensions of the Contra-Rotary impulse turbine as designed in SolidWorks. Further, Contra-Rotary Impulse Turbine with middle vanes is demonstrated in Figure 3.
Table 1. Dimensions of Contra Rotary Impulse Turbine with Middle Vanes
Profile |
Symbol |
Dimension (mm) |
Casing diameter rotor blades |
D |
152.5 |
Chord length of rotor blades |
lr |
54 |
Blade thickness ratio |
|
0.3 |
Tip diameter of rotor blades |
Dt |
150 |
Hub diameter of rotor blades |
Dh |
105 |
Hub-to-tip ratio |
v |
0.7 |
Inlet and outlet angles of rotor blades |
ɣb |
70° |
Solidity at mean radius |
δ |
2.02 |
Chord length of guide vane |
l |
70 |
Blade thickness of guide vane |
t |
2 |
No. of the guide vanes |
G |
20 |
Guide vane solidity |
|
1.75 |
Setting angle of fixed guide vane |
ɣg |
30o |
Chord length of the mid vane |
l |
27 |
Blade thickness |
t |
2 |
No. of vanes on middle vane |
|
32 |
Middle vane solidity |
|
1.08 |
Setting angle of the middle vane |
ɣm |
65° |
|
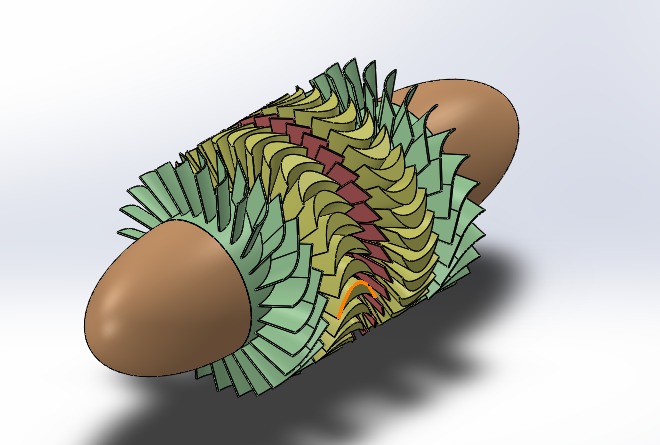
Figure 3. Contra-rotary Impulse Turbine with middle vanes.
The Contra-Rotary Turbine consisted of 5 different components mounted together. These components are listed below.
1. 2 × Nose Cone
2. 2 × Guide Vanes
3. 2 × Turbine Rotors
4. Middle Vane
5. Gear System
All these components are modelled and assembled in SolidWorks. As for the nose cone, the diameter was kept in accordance to match the hub diameter of guide vanes. 4 small pins were also modelled at its end to lock it into the guided vanes hub.
2.2 Simulation Analysis
2.2.1 Numerical Model Setup
CFD software Ansys-Fluent 22.0 is utilized in numerical simulations employing turbo machinery for turbo workflow, the finite volume method for solving Reynolds-Averaged Navier–Stokes equations, and the pressure-based solver. The coupled scheme is used to couple pressure and velocity. In spatial discretization, the second-order upwind algorithm is considered for convection terms[17]. With the viscous heating and production limiter, the SST K-omega turbulence model is used to process the turbulent effects.
During numerical simulations, the computational domain is divided into the upstream guide vane domain, the first rotor blade domain, a middle vane domain, the second rotor blade domain, and the downstream guide vane domain. The guide vane and middle domains are assumed to be stationary, while the rotor blade domain rotates at a constant rate. In this study, the axial incident velocity through the velocity inlet boundary is kept constant at v=5.24m/s, while the revolutions per minute of the rotor blade region are progressively varied to produce a range of flow coefficients. The inlet flow rate was held constant at for the entire machine and 0.03m3/s for a single passage. The opening was made available to the atmosphere.
Since all the calculations are performed under steady conditions, the Moving Reference Frame model is used to incorporate rotating rotor blades, fixed middle vanes, and guide vanes in numerical simulations. Moreover, the rotationally periodic boundaries are used to model the flow through a row of two blades, a middle vane, and two guide vanes based on the assumption that the flow is rotationally periodic. This allows for a good resolution of the flow around a single blade without the computational cost of modelling all blades and guide vanes.
In addition, the mixing plane (MP) model permits the airflow passages to change in the rotor and stator zones to accommodate the number difference between the impulse turbine's guide vanes and blades. Consequently, the flow field around the rotor and stator zones can be calculated in a coupled manner using steady-state calculations. At MP boundary zones, the area-averaged profiles of flow variables are computed during the computation. The profiles are then conveyed to the adjacent zones as their boundary conditions. As the solution converges, the boundary conditions of the MP will adapt to the prevailing flow conditions[13,17].
Figure 4 depicts the boundary conditions of the numerical model. The mass flow inlet and pressure outlet limits are positioned at opposite ends of the computational domain. Along both sides of the blades, middle vane, and guide vanes, periodic rotational boundaries are applied. The MP interfaces link the stator and rotor domains for the exchange of all flow-field data.
|
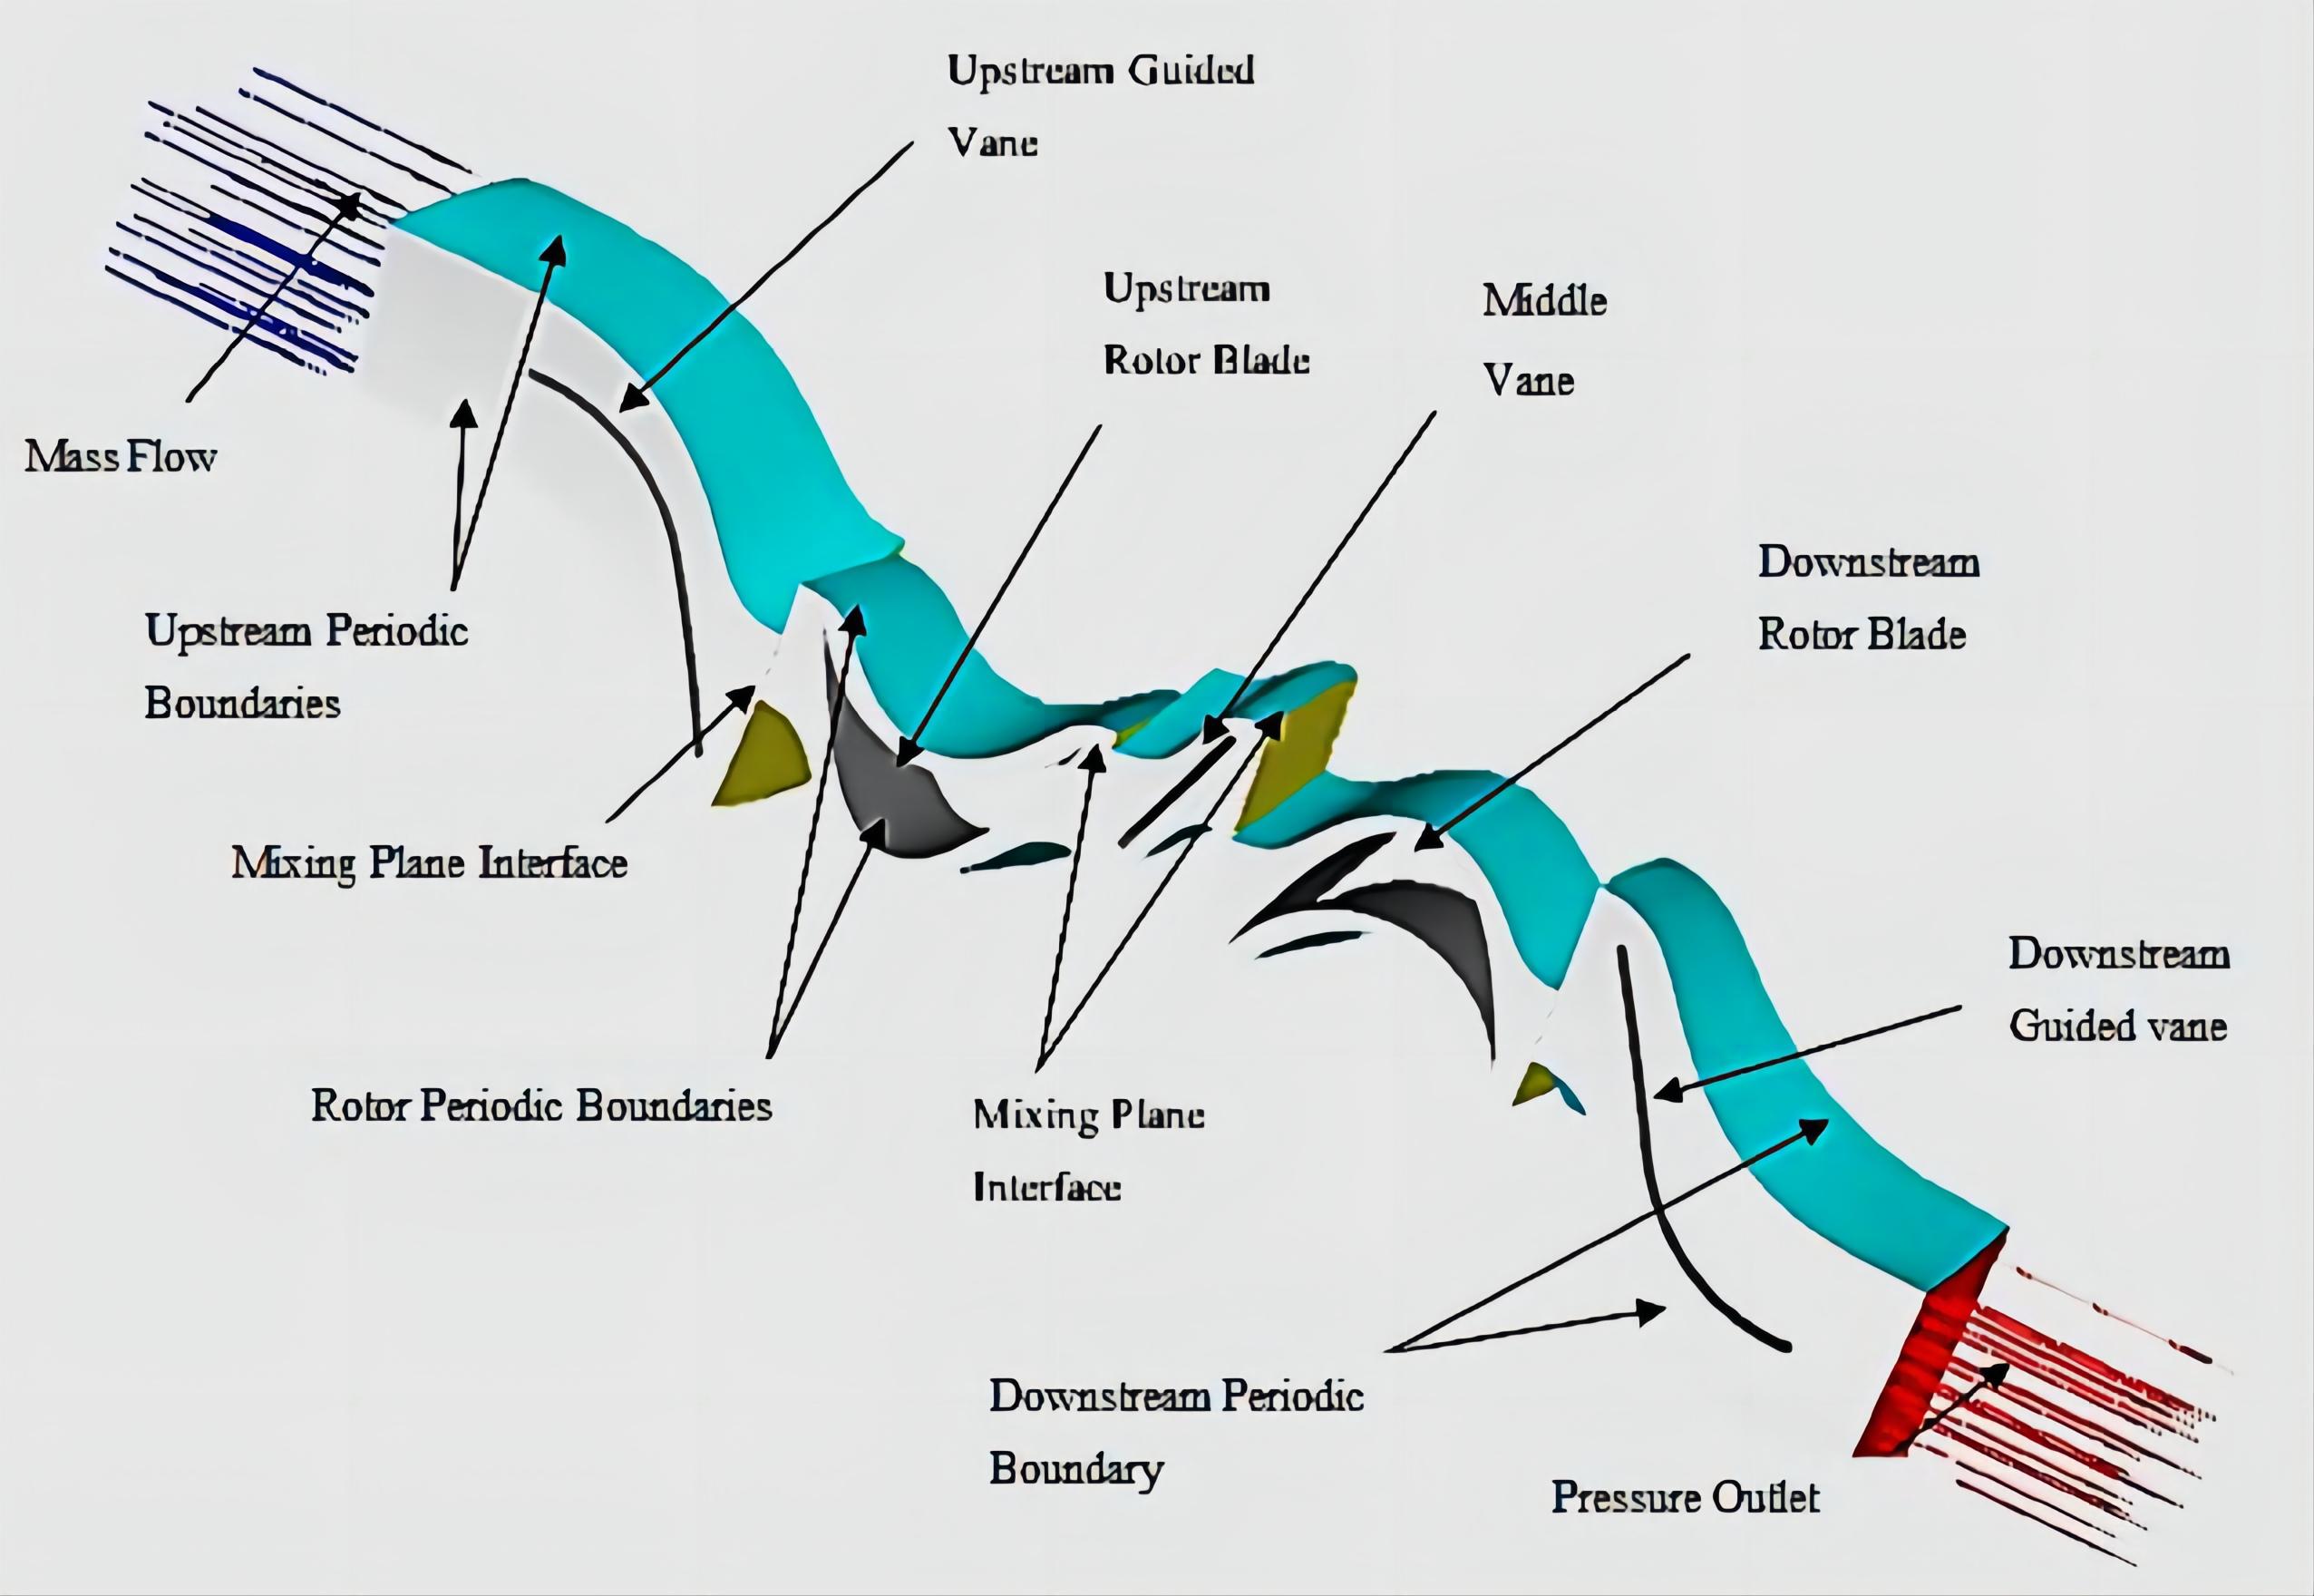
Figure 4. Boundary conditions and computational domains of the numerical model.
2.2.2 Meshing Scheme/Discretization Scheme
The geometry is developed in Solid Works and imported to Ansys software. The meshing is generated in turbogrid present in Ansys. Fully Automated Topology and Meshing techniques (novel technology) are used to generate the high-quality hexagonal mesh. The chord length of the rotor blade is regarded as the characteristic length[18]. The frozen rotor technique is used to decrease the no. of elements. Furthermore, boundary layer grids are structured for the k-omega SST model for the prediction of turbulence effect near the wall boundary. The non-dimensional parameter Y+ is used to define the location of the wall adjacent cells to ensure the cells lie at an appropriate distance away from the wall. The minimum near-wall expansion rate is set to 0.832413 and the maximum is 1.24289. The Y+ value in the present study ranges from 25 to 35[19]. Meshing scheme is provided in Table 2.
Table 2. Meshing Scheme
Domain |
Nodes |
Mesh Elements |
Guided vane(upstream) |
442594 |
417168 |
Rotor 1(upstream) |
605864 |
573650 |
Middle vane |
478400 |
454815 |
Rotor 2(downstream) |
587928 |
555818 |
Guided vane(downstream) |
483132 |
458280 |
Outlet |
13728 |
11438 |
Total |
2611646 |
2471169 |
Velocity and pressure contour in the whole passage at the middle span are shown in Figure 5A and Figure 5B.
|
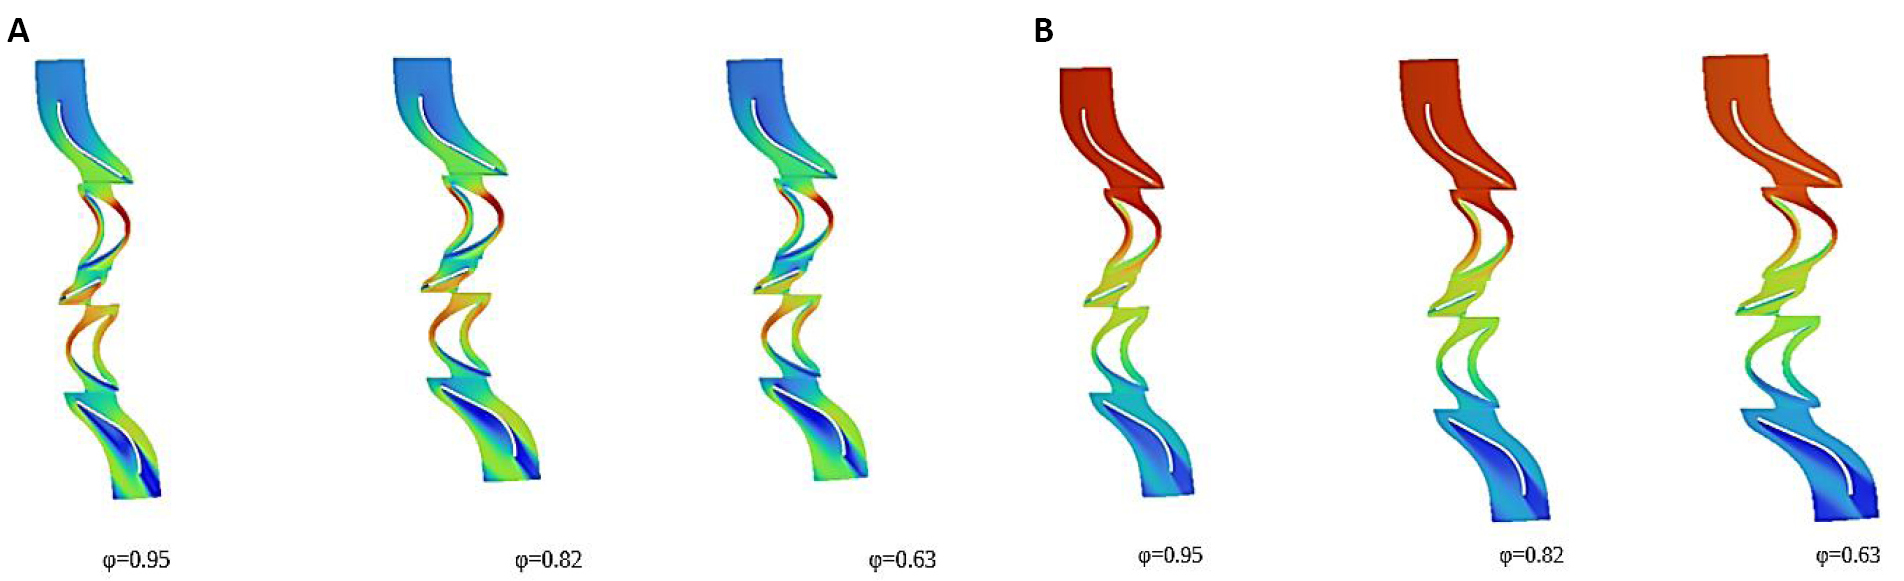
Figure 5. Velocity and pressure contour in the whole passage at the middle span. A: Velocity contour in the whole passage at the middle span; B: Pressure contour in the whole passage at the middle span.
2.3 Fabrication of Working Model
During the fabrication phase, assembly was modelled and modified for 3D printing. The back of the nose cone was kept elliptical to guide the maximum amount of air toward turbine rotors. Guide vanes were modelled with a hub diameter of 105mm and the rotor of guide vanes was such that the total tip-to-tip diameter turned out to be 152mm. Figure 6 represents the Nose Cone model of proposed design.
|
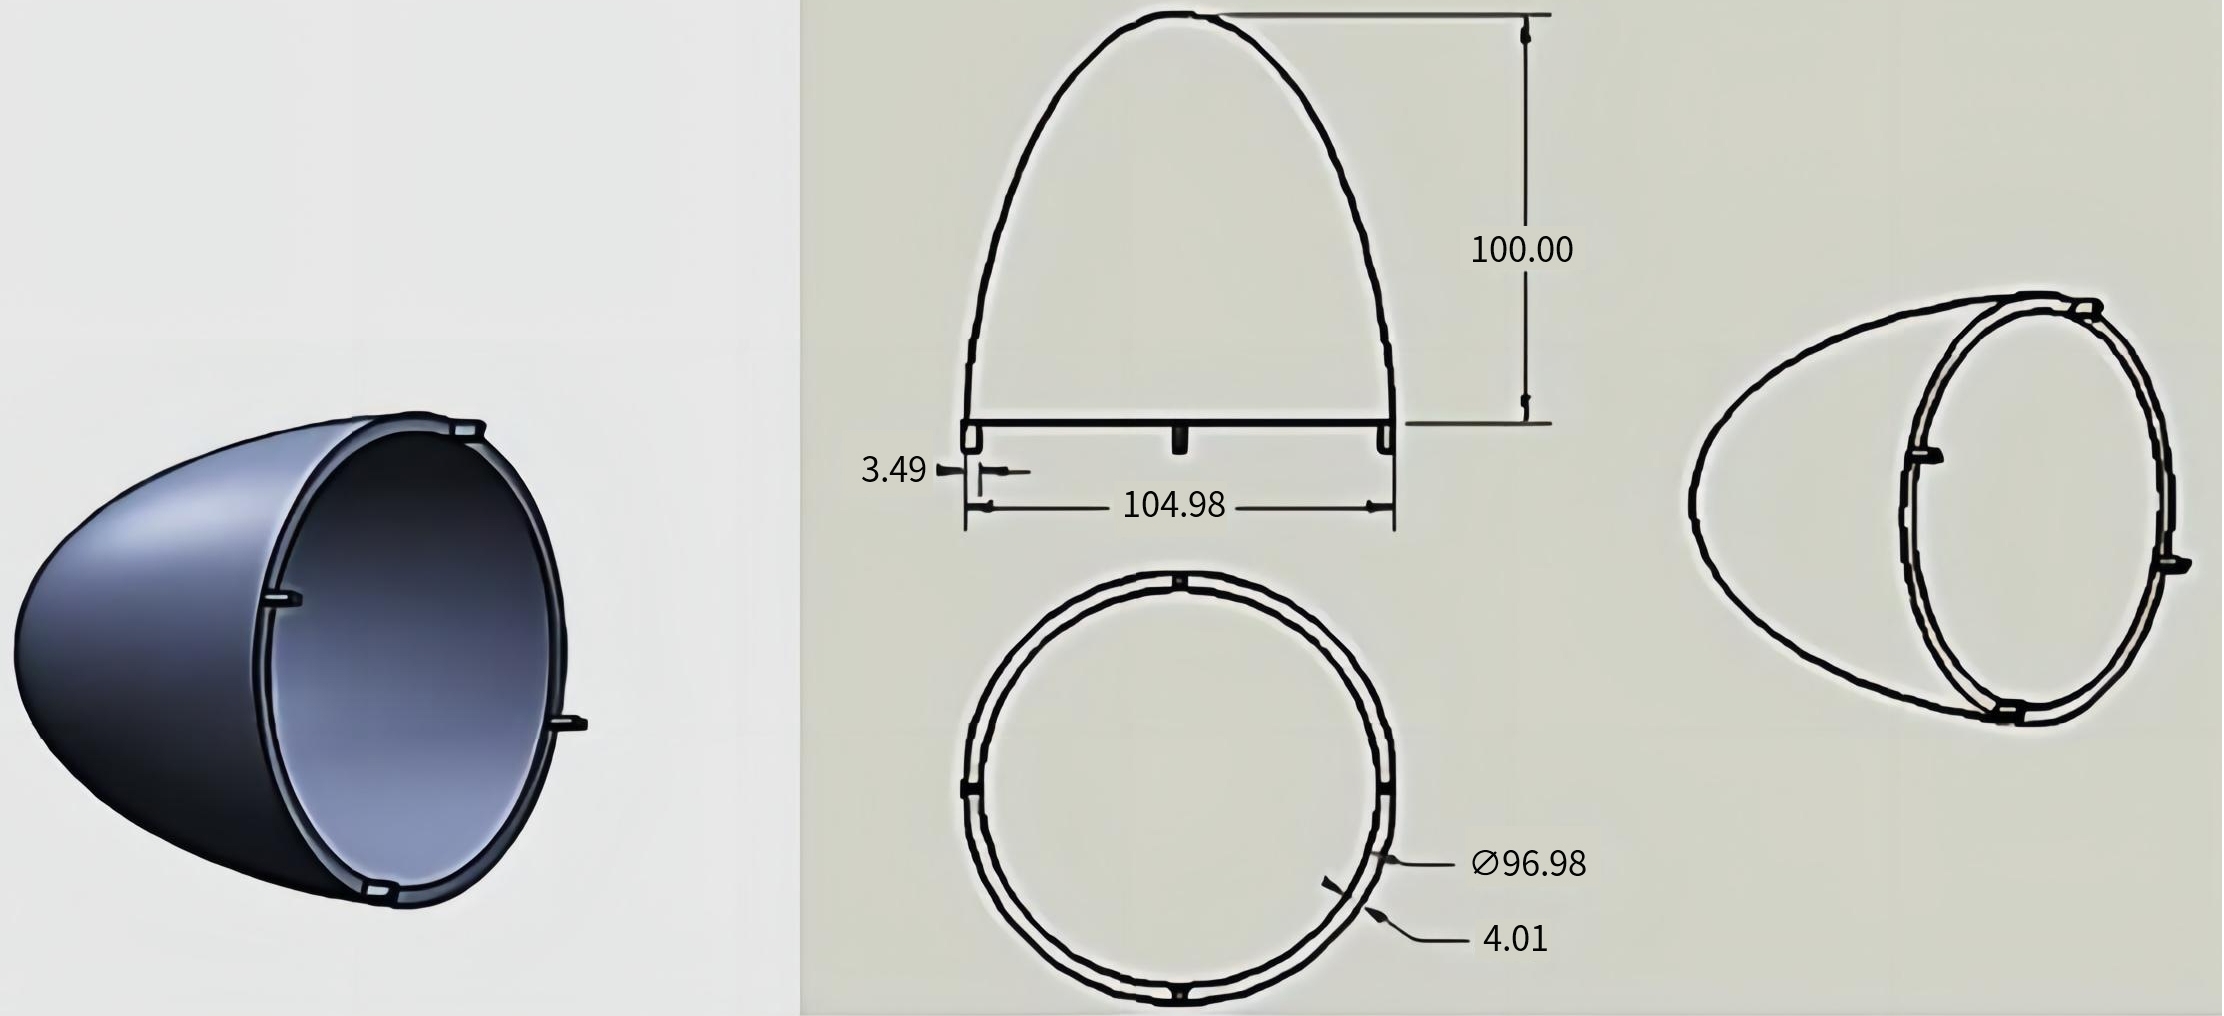
Figure 6. Nose Cone model.
The purpose of guide vanes would be to guide air towards the turbine rotors. The total number of blades modelled was 20 and the thickness of the blades was kept at 2mm. Six holes were introduced in the hub of guide vanes to keep the printing weight and printing cost low. The blade design can be seen in Figure 7.
|
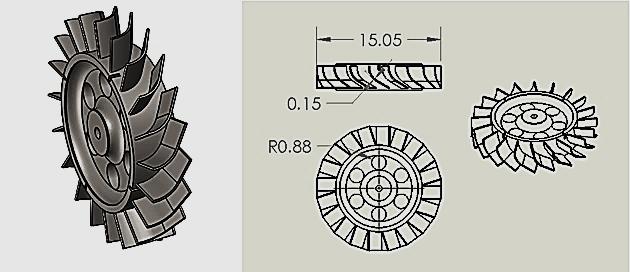
Figure 7. Guide Vanes model.
Moving on to the turbine rotors, the tip-to-tip diameter was maintained at 150mm and the blade thickness was made to vary radially. The number of turbine blades used was 30. The most important part of the proposed design was the concept of a middle vane which was the actual solution to increase the efficiency of the turbine. The purpose of this middle vane was to further guide the air to rotate the second turbine while improving the air velocity. Rotors and Middle Vanes Model with mountings for gear system are demonstrated in Figure 8 and Figure 9.
|
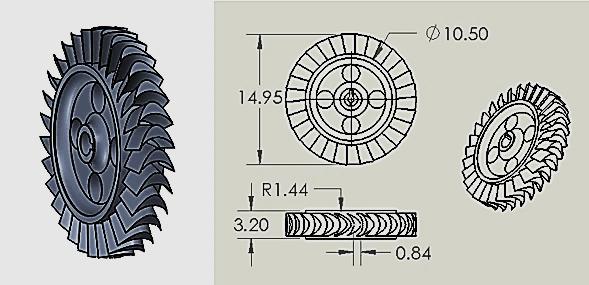
Figure 8. Rotors model.
|
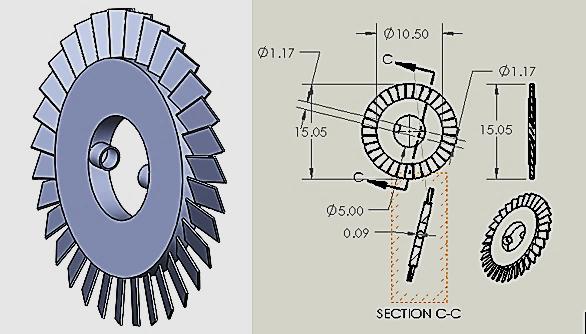
Figure 9. Middle Vanes Model with mountings for gear system.
The final and the most challenging part was to design the gear system to couple both rotors. The most challenging situation while modelling the gear system was to make it fit inside the middle vane, such that we don’t have to compromise on the thickness of the rotors and middle vane. Figure 10 demonstrates the rotor coupling bevel gear system.
|
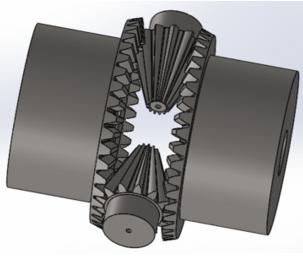
Figure 10. Rotor coupling bevel gear system.
2.3.1 Design of Four-bar Artificial Wave Generator Mechanism
The working principle of the four-bar mechanism was utilized to design the artificial wave generator. It consists of a rectangular frame made up of 10mm circular rods used to hold a wave plate on one end and a rod for bearing a cup on another end. A connecting rod was designed to provide slider and crack motion to the frame with the help of a wiper motor. The wiper motor has a built-in gearbox which provides higher torque at lower rpm which was ideal for this application. Four bar artificial wave generation mechanism model is illustrated in Figure 11.
|

Figure 11. Four bar artificial wave generation mechanism model.
2.3.2 Modelling of Tank
The tank was modelled in such a way that it would be able to hold sufficient water. The material used for the fabrication of the tank was acrylic glass, and the thickness of the acrylic glass was 4mm to keep it strong and affordable. Tank dimensions are provided in Table 3.
Table 3. Tank Dimensions
Parameter |
Size |
Thickness |
4mm |
Length |
4 ft |
Width |
2 ft |
Height |
2 ft |
Tank model is illustrated in Figure 12.
|

Figure 12. Tank model.
2.3.3 Modelling of Chamber
To make the fabrication possible, the chamber was also made up of acrylic glass with simple geometry. The acrylic glass was chosen as a material best suited for the chamber because; the magnificence of the process can only be shown if the material is transparent. Chamber model is shown in Figure 13.
|
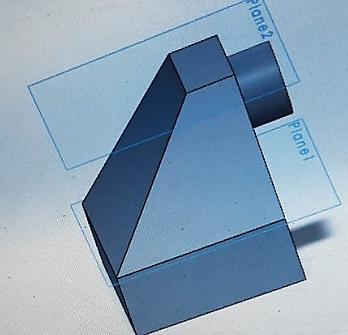
Figure 13. Chamber model.
To simulate a chamber, firstly, the design was imported inside the claimed space and created a fluid geometry. Then after suppressing the outside walls of the chamber, a mesh was created over it and simulation was performed over the k epsilon model. The simulation was for steady input of 3ms-1, the results were converged and the output velocity from the chamber was found to be 43ms-1.
2.3.4 Fabricated Assembly
The final fabricated assembly has a motor which is used to run the slider crank mechanism to generate mechanical waves inside the tank made up of acrylic glass. The waves are directed towards the chamber also made up of acrylic glass wherein the rise of wave height inside the chamber will cause the air inside the chamber to be compressed and finally be delivered to the turbine. The turbine was made to fit in a transparent pipe of 152mm internal diameter and the material used for the pipe was acrylic glass. The material used for the turbine was PLA with a strength-to-weight ratio of about 2. Final Assembly of Working Model is demonstrated in Figure 14.
|
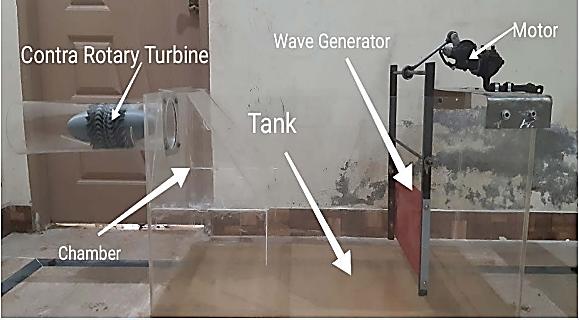
Figure 14. Final assembly of working model.
2.4 Experimentation
An experimental study related to the working of the fabricated model was performed at different levels of water. This experimental study aimed to find out the appropriate level of water in the chamber at which this turbine gave the maximum rotational kinetic energy. The readings were noted by using the digital tachometer and digital wind speed meter as shown in Figure 15.
|
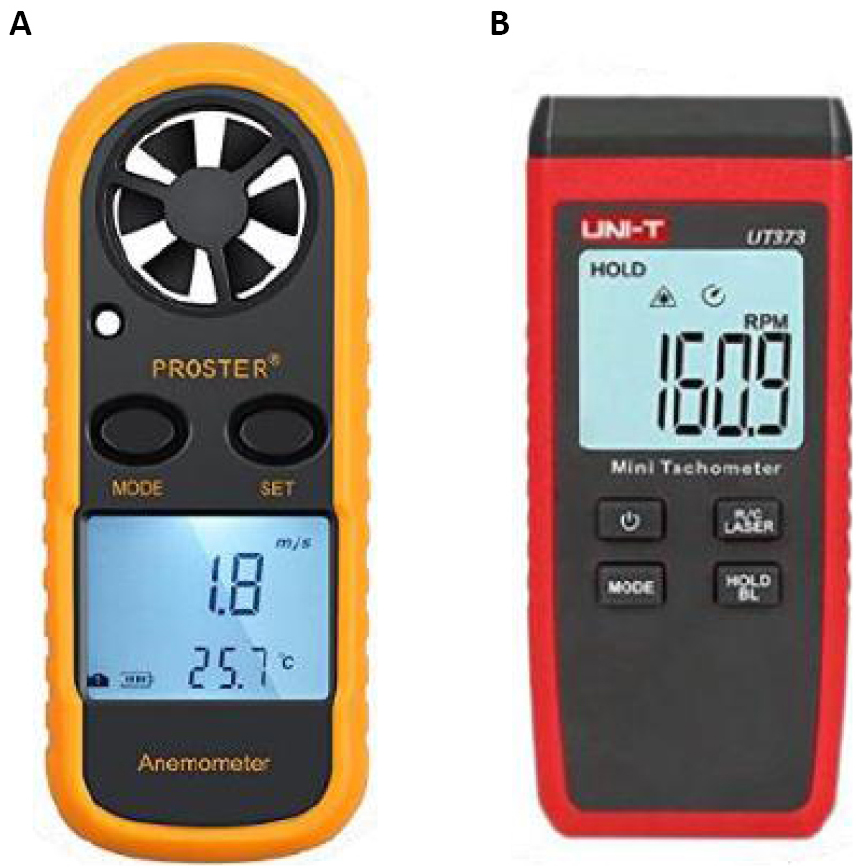
Figure 15. The digital tachometer and digital wind speed meter. A: Digital wind speedometer; B: Digital tachometer.
A small length of reflective tape on the shaft is used which helps to find the rpm. To evaluate the mean wind speed of unidirectional flow, a digital wind speed meter is used exactly at the open end of the turbine housing tube.
The tank was filled at seven different water levels. The lowest level at which water was filled was 6 inches because this was the lowest level of the chamber of the OWC. Then with the difference of one inch, a reading was taken after increasing the water level at each consecutive level. Units for measuring the revolution of the shaft were rpm, airspeed in meters per second and average wave height in meters inside the chamber.
The wave generator motor produced the waves by rotating at 35rpm which was the lower setting instead of 55rpm due to the intensity of waves could be compromised. The wave power is given by the following formula:
|
Where,
P = wave energy flux per unit of wave crest length
H2m = the significat wave height
Te = wave energy period
ρ = density of water
g = gravitational acceleration
The data from different sensors were recorded in tabular form that includes the height of water at a different levels. Experimental results are mentioned in Table 4. This table concluded that maximum power was gained at 11 inches of water height as the energy delivered by the wave generator was 10.08 watts. Wave energy delivered depends on the design of the wave generator mechanism. The sheet metal plate used in the wave generator has a height of 8 inches. Additionally, this plate was fixed at least 3 inches high from the floor of the prototype tank. So at a water level height of 11 inches, the wave plate should be completely submerged and engaged in pushing the water to and fro hence delivering the maximum energy.
Table 4. Experimental Results
Sr No |
Idle Water Level (m) |
Wave Height (m) |
Time Period (s) |
Rpm at Output Shaft (rpm) |
Wave Power (watts) |
Airspeed (m/s) |
1 |
0.15 |
0.121 |
0.45 |
41 |
3.137 |
1.56 |
2 |
0.1778 |
0.134 |
0.51 |
48 |
4.361 |
1.576 |
3 |
0.2032 |
0.169 |
0.55 |
55 |
7.4808 |
1.84 |
4 |
0.2286 |
0.178 |
0.56 |
59 |
8.449 |
1.907 |
5 |
0.254 |
0.191 |
0.56 |
68 |
9.729 |
2.04 |
6 |
0.2794 |
0.198 |
0.54 |
65 |
10.08 |
2.2 |
7 |
0.3048 |
0.182 |
0.53 |
64 |
8.3 |
2.06 |
Figure 16 graphically represents the peak wave energy generated at 11 inches of ideal water level.
|
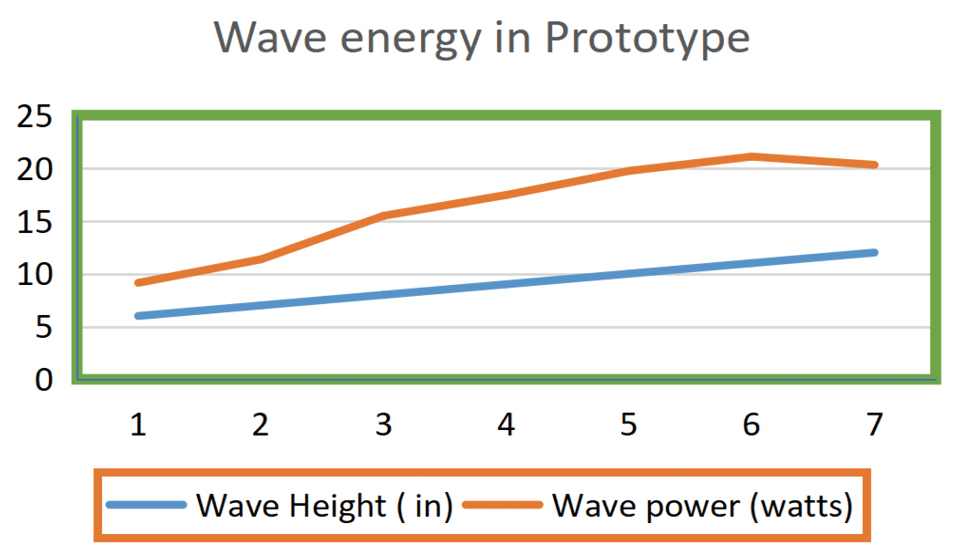
Figure 16. Graphical representation of wave energy at different heights.
3 RESULTS AND DISCUSSION
For the validation of the numerical model in the present study, the result is compared with the data available in[16]. The hub-to-tip ratio ν=0.7 is employed with Reynold no 5.14×10⁴ to validate the numerical result. The number of rotor blades, middle vanes and guided vanes is 20, 32 and 30, respectively. The total number of meshes was 2471169. All the computations were carried out on the personal computer with an Intel(R) Core(TM) i5-8250U CPU @ 1.60GHz 1.80 GHz and 12 GB RAM.
|
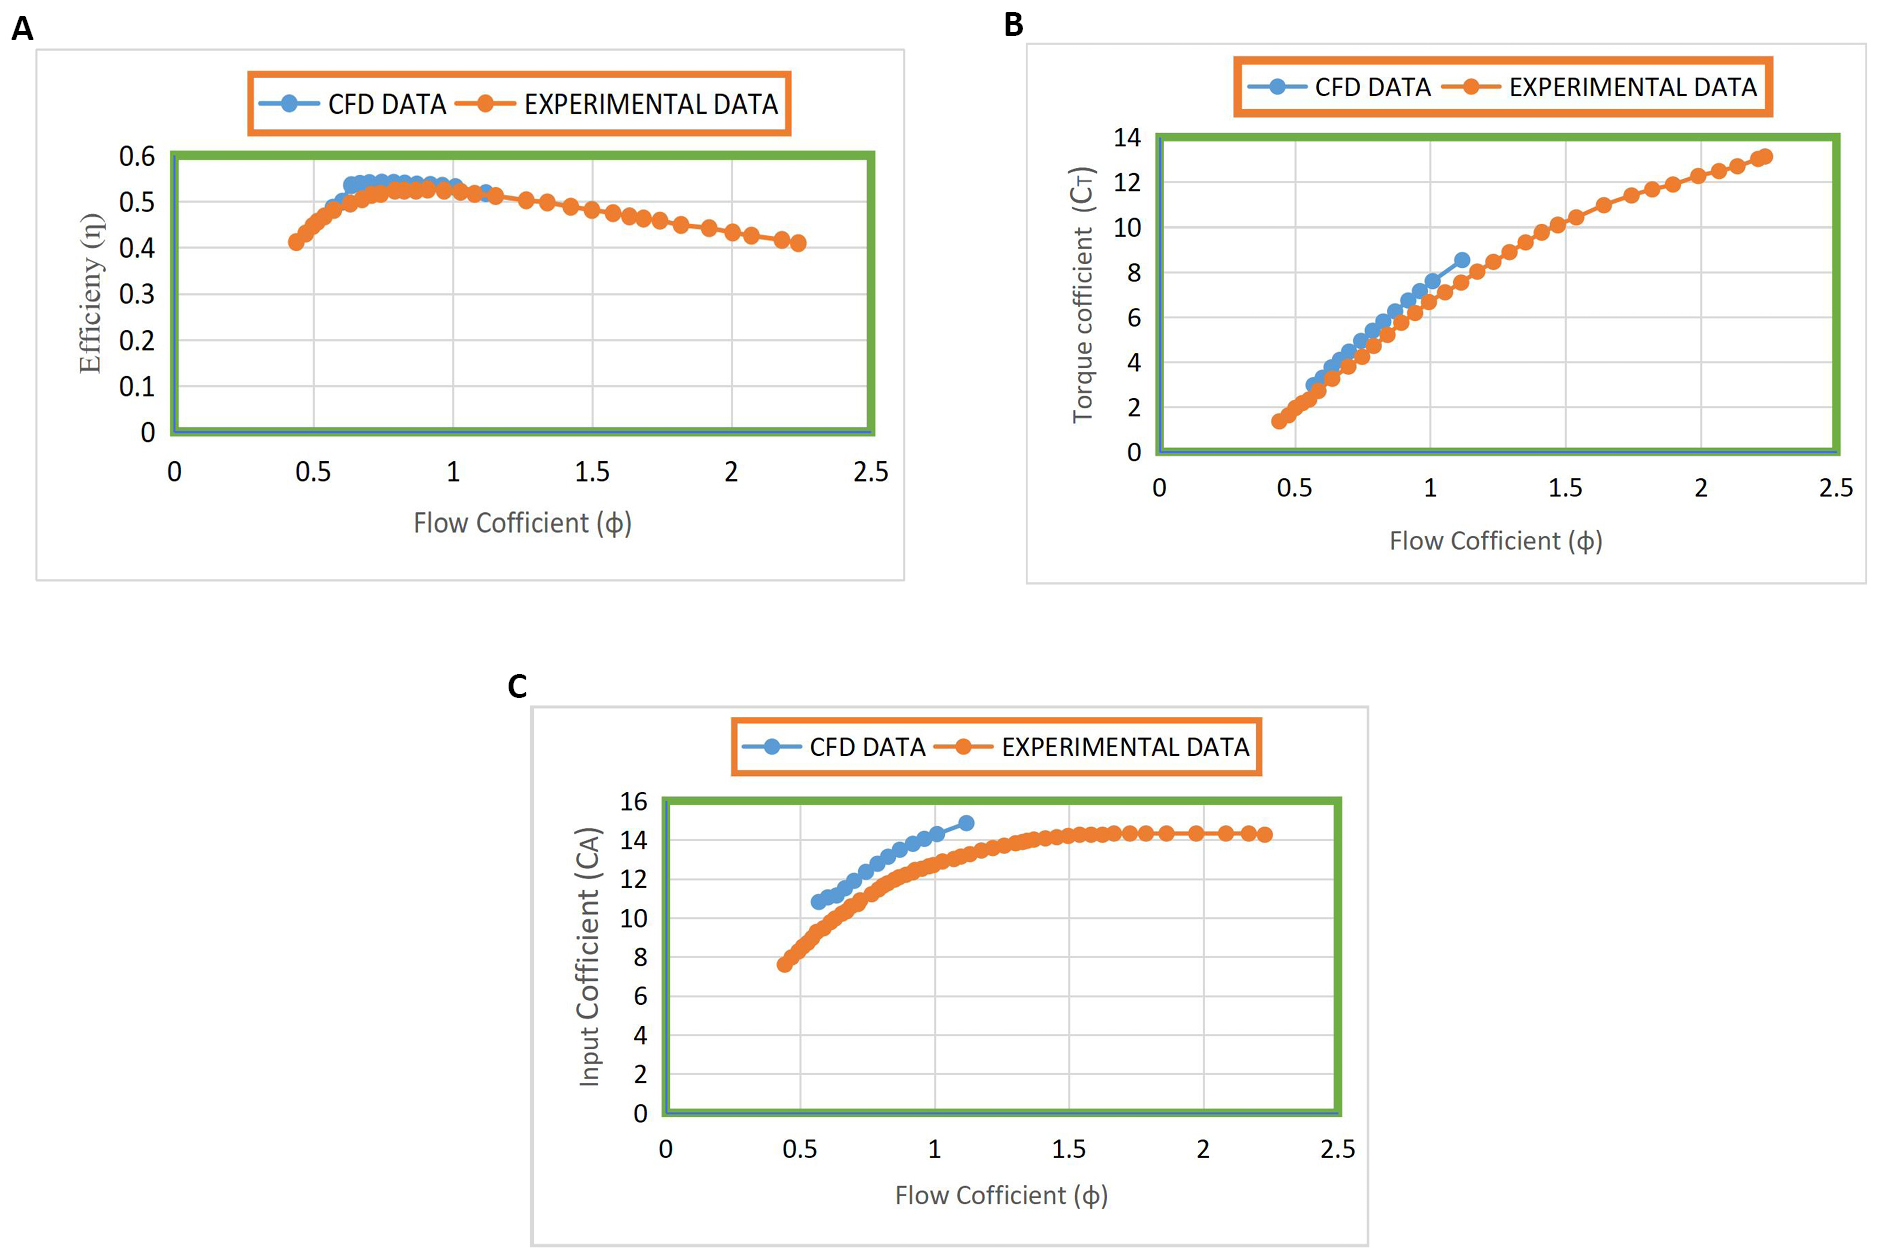
Figure 17. The comparison between experimental data and the numerical results under the fine meshing. A: Turbine efficiency vs Flow coefficient; B: Torque coefficient vs Flow coefficient; C: Input coefficient vs Flow coefficient.
Figure 17 demonstrate the comparison between experimental data and the numerical results under the fine meshing. Also, these graphs show a minor difference between the experimental and numerical results. Torque coefficient and turbine efficiency illustrate a little difference, but the input coefficient shows little more difference at a higher flow coefficient (φ). In the experimental result, 52.5% efficiency has been achieved. While, in the numerical result, 54% efficiency was achieved. This shows the 1.851% variation between the peak efficiency. In the next phase, comparisons of results with a middle vane and without a middle vane were made. The following results illustrated in Figure 18 was obtained.
|
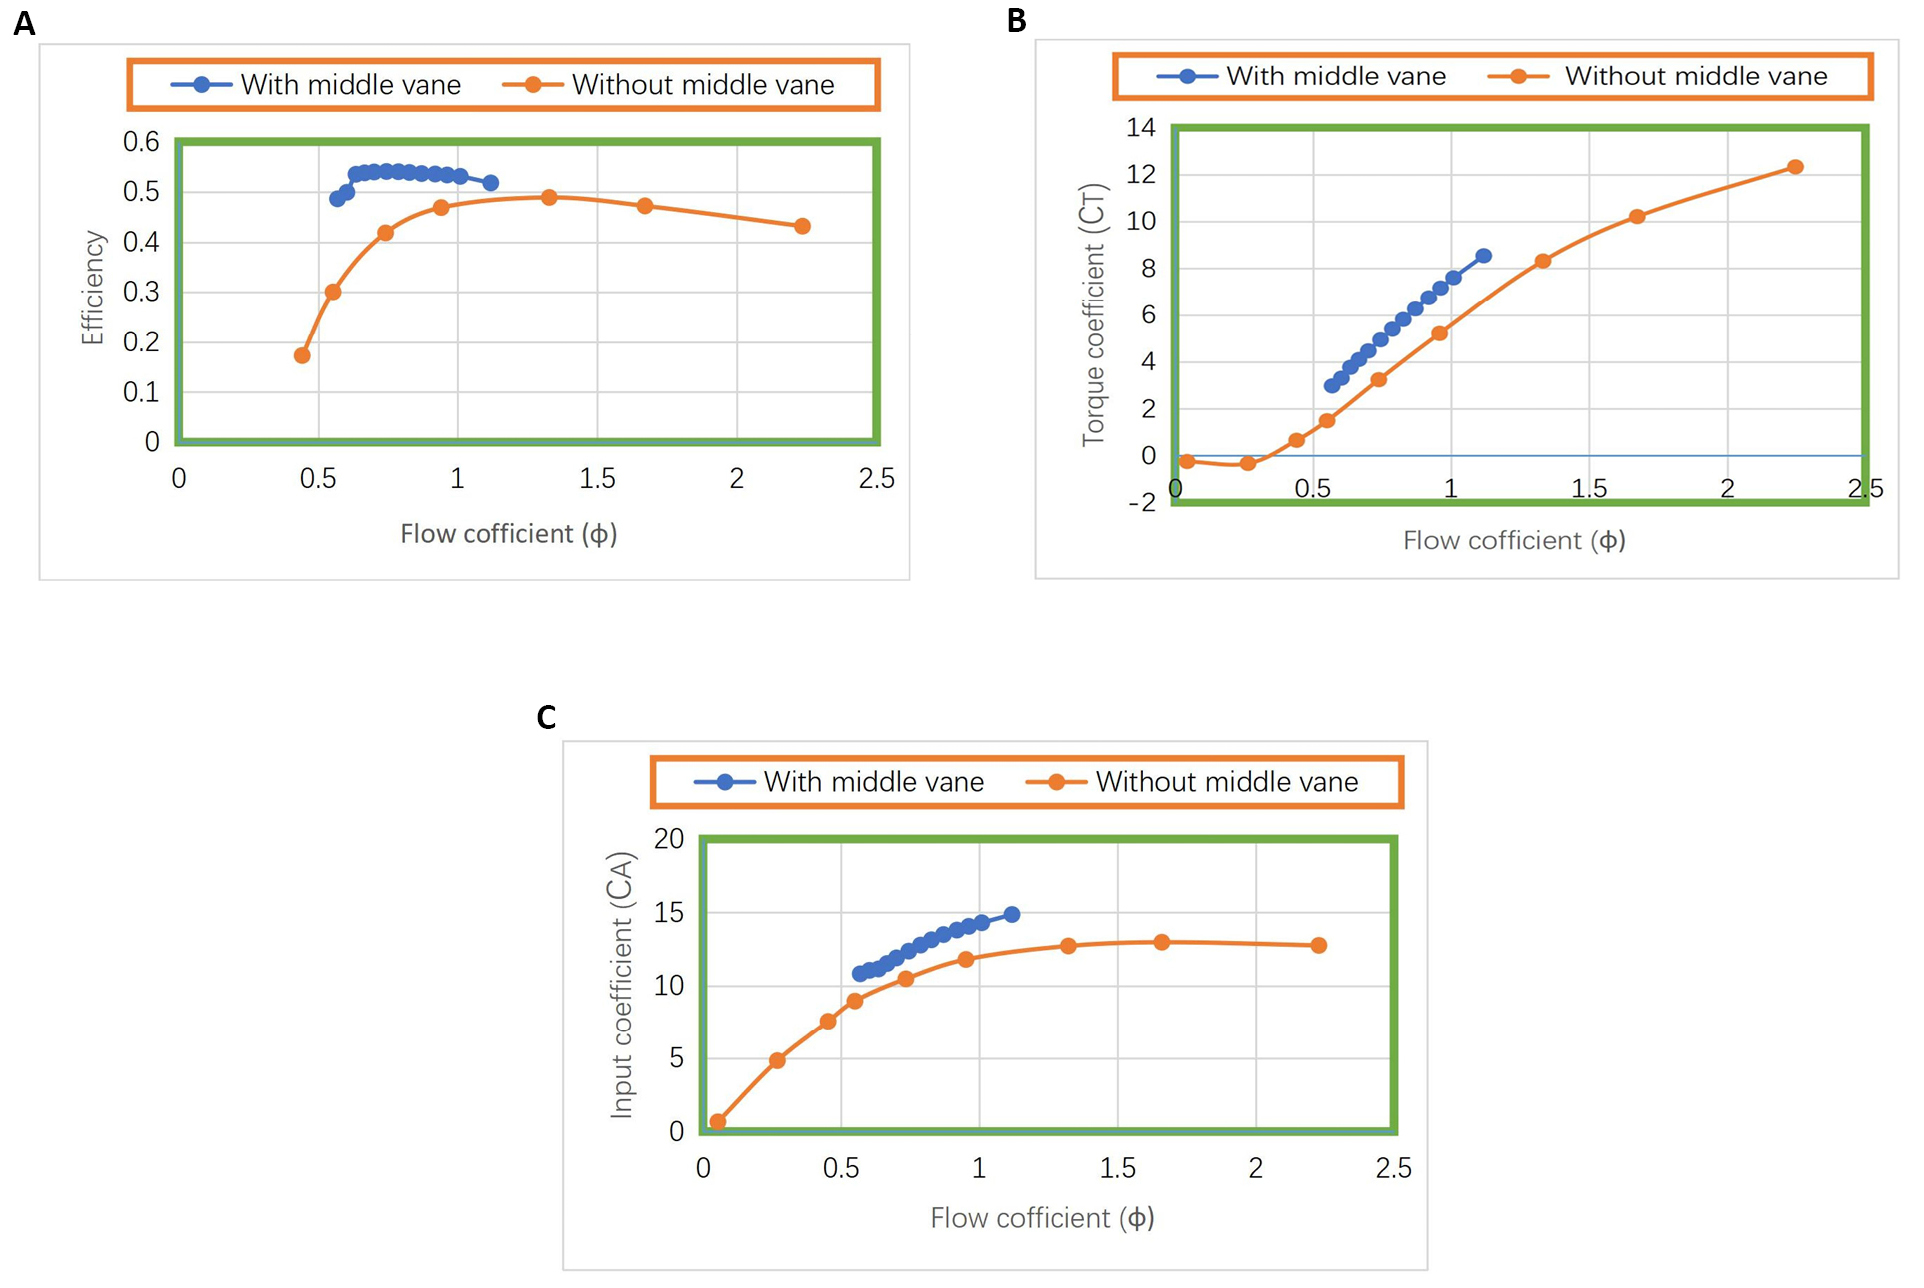
Figure 18. Comparisons of results with a middle vane and without a middle vane. A: Turbine efficiency with and without middle vane; B: Torque coefficient with and without middle vane; C: Input coefficient with and without middle vane.
These graphs show that the turbine with middle vanes has a higher torque coefficient than the turbine without middle vanes. Similarly, the input coefficient is higher for the turbine which has middle vanes. In Figure 18C, as the flow coefficient decreases, the value approaches the value turbine without a middle vane. Therefore, the turbine with a middle vane shows better efficiency than the turbine without a middle vane in low flow coefficient as well as higher flow coefficient.
The graph in Figure 19A depicts the velocity profile of a turbine without a guided vane when the inlet velocity is assumed to be 10 meters per second. In the next step, the simulations were performed at the constant inlet flow rate of Q=0.320m3/s and the velocity profile with the mid vanes is demonstrated in Figure 19B. The greater magnitude of the velocity at the turbine can be seen in the profile of the red, yellow, and orange spaces. In addition, the blue areas of the profile represent the areas where the magnitude of the velocity is zero or minimal.
|
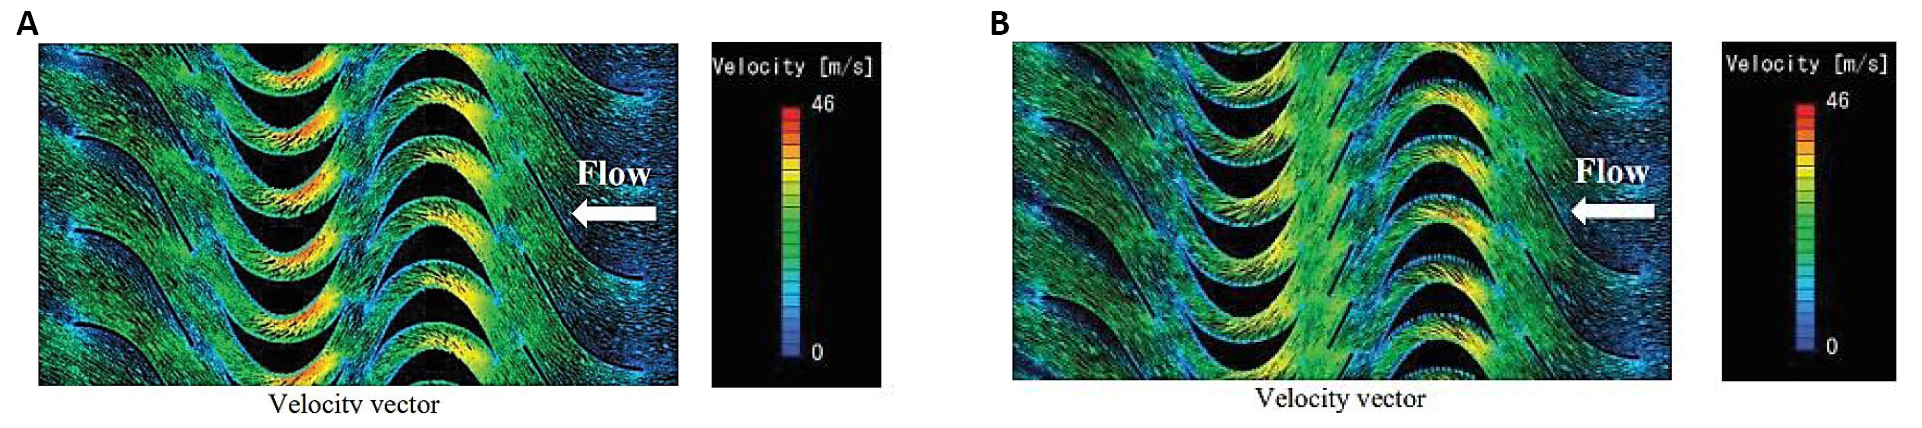
Figure 19. Velocity profiles of the turbine with/without mid vane. A: Velocity profiles of the turbine without mid vane; B: Velocity profiles of the turbine with mid vane.
Similarly, Figure 20A and Figure 20B represents the pressure distribution profiles of the turbine without the mid vane and with the mid vane, respectively.
|
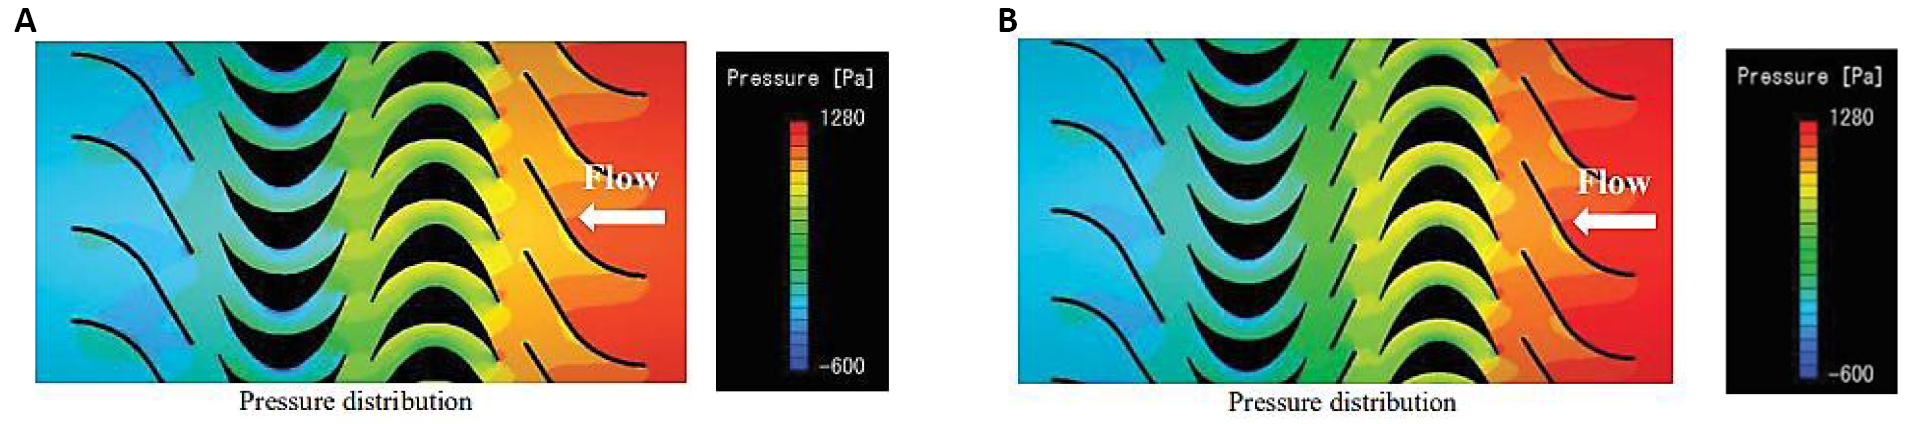
Figure 20. Pressure distribution profile of turbine with/without mid vane. A: Pressure distribution profile of turbine without mid vane; B: Pressure distribution profile of turbine with mid vane.
These pressure distribution profiles of the turbine with or without mid vanes show the points and sections where the pressure will be maximum and minimum. As it is obvious, the red areas where the pressure is the highest are the areas where the air applies the greatest force and has the greatest tendency to rotate the turbine at a specific angular velocity. This angular velocity then tends to rotate the shaft, which drives the generator, and electrical energy is obtained as a result of this rotation.
4 CONCLUSION
This research aims to optimize the design of an OWC wave energy converter to extract energy from ocean waves. For this purpose, the concept of middle vane was proposed in Contra rotary radial impulse turbine which could help in reducing the turbulence between rotors, hence possibly increasing the overall efficiency. With the additions of the middle vanes, the configurations of the turbine led to a decrease in the flow separations and then this decreased the pressure loss on the blades and the guided and middle vanes. A CFD-CAD iterative method was used to reach an optimized blade profile to minimize the losses occurring from flow separation. The final fabricated assembly included a motor which was used to run the slider crank mechanism to generate mechanical waves inside the tank made up of acrylic glass. The waves were directed towards the chamber also made up of acrylic glass wherein the rise of wave height inside the chamber compressed the air and finally delivered it to the turbine. The results demonstrate that the turbine with middle vanes has a higher torque coefficient than the turbine without middle vanes. Similarly, the input coefficient is higher for the turbine which has middle vanes. Therefore, the turbine with a middle vane shows better efficiency than the turbine without a middle vane in low flow coefficient as well as higher flow coefficient. Hence from both numerical and experimental analyses, it is concluded that the efficiency of the contra rotatory turbine is greater than the single rotatory turbine and the efficiency increases further when middle vanes are added.
Acknowledgements
The authors are thankful to UET Lahore, Pakistan for providing the opportunity to complete this research work.
Conflicts of Interest
The authors declared no conflict of interest.
Author Contribution
All authors contributed equally to this manuscript.
Abbreviation List
MP, Mixing plane
OWC, Oscillating water column
OWE, Oceanic wave energy
RES, Renewable energy sources
References
[1] Gonzalez AT, Dunning P, Howard I et al. Is wave energy untapped potential? Int J Mech Sci, 2021; 205: 106544. DOI: 10.1016/j.ijmecsci.2021.106544
[2] Masuda Y, Kuboki T, Ravindrum M et al. Development of backward bent duct buoy (BBDB): The Ninth International Offshore and Polar Engineering Conference. Brest, France, May 1999.
[3] Falcão AFO, Henriques JCC. Oscillating-water-column wave energy converters and air turbines: A review. Renew Energy, 2016; 85: 1391-1424. DOI: 10.1016/j.renene.2015.07.086
[4] Zhongming Z, Linong L, Xiaona Y et al. Global energy demand rose by 2.3% in 2018, its fastest pace in the last decade. Accessed 2023. Available at https://www.iea.org/news/global-energy-demand-rose-by-23-in-2018-its-fastest-pace-in-the-last-decade
[5] Farrok O, Ahmed K, Tahlil AD et al. Electrical power generation from the oceanic wave for sustainable advancement in renewable energy technologies. Sustainability, 2020; 12: 2178. DOI: 10.3390/su12062178
[6] Barstow S, Mørk G, Mollison D et al. The wave energy resource. In: Cruz J eds. Ocean Wave Energy: Current Status and Future Prespectives. Springer: Berlin, Heidelberg, 2008; 93-132. DOI: 10.1007/978-3-540-74895-3_4
[7] Xie J, Zuo L. Dynamics and control of ocean wave energy converters. Int J Dyn Control, 2013; 1: 262-276. DOI: 10.1007/s40435-013-0025-x
[8] Rosa-Santos P, Taveira-Pinto F, Rodríguez CA et al. The CECO wave energy converter: Recent developments. Renew Energy, 2019; 139: 368-384. DOI: 10.1016/j.renene.2019.02.081
[9] Grant RJ, Johnson CG, Sturge DP. Performance of a Wells turbine for use in a wave energy system. IEE Conf Publ, 1981; 192: 3.
[10] Soltanmohamadi R, Lakzian E. Improved design of Wells turbine for wave energy conversion using entropy generation. Meccanica, 2016; 51: 1713-1722. DOI: 10.1007/s11012-015-0330-x
[11] Brewer CE, Brown RC. 5.18-Biochar A2-Sayigh, Ali. Compr Renew Energ, 2012; 5: 357-384. DOI: 10.1016/B978-0-08-087872-0.00524-2
[12] Setoguchi T, Takao M. Current status of self rectifying air turbines for wave energy conversion. Energ Convers Manage, 2006; 47: 2382-2396. DOI: 10.1016/j.enconman.2005.11.013
[13] Liu Z, Jin J, Cui Y et al. Numerical analysis of impulse turbine for isolated pilot OWC system. Adv Mech Eng, 2013; 5: 416109. DOI: 10.1155/2013/416109
[14] Badhurshah R, Dudhgaonkar P, Jalihal P et al. High efficiency design of an impulse turbine used in oscillating water column to harvest wave energy. Renew Energ, 2018; 121: 344-354. DOI: 10.1016/j.renene.2018.01.028
[15] Takao M, Setoguchi T, Kinoue Y et al. Wells turbine with end plates for wave energy conversion. Ocean Eng, 2007; 34: 1790-1795. DOI: 10.1016/j.oceaneng.2006.10.009
[16] Takao M, Yamada K, Okuhara S et al. A Counter-Rotating Impulse Turbine for Wave Energy Conversion. Open J Fluid Dyn, 2018; 8: 435. DOI: 10.4236/ojfd.2018.84028
[17] Cui Y, Liu Z. Effects of solidity ratio on performance of OWC impulse turbine. Adv Mech Eng, 2015; 7: 121373. DOI: 10.1155/2014/121373
[18] Halder P, Kumar PM. Coupled CAD-CFD automated optimization for leading and trailing edge of an axial impulse turbine blade. Ocean Eng, 2020; 213: 107769. DOI: 10.1016/j.oceaneng.2020.107769
[19] Thakker A, Hourigan F. Computational fluid dynamics analysis of a 0.6m, 0.6 hub-to-tip ratio impulse turbine with fixed guide vanes. Renew Energ, 2005; 30: 1387-1399. DOI: 10.1016/j.renene.2004.10.005
Copyright © 2023 The Author(s). This open-access article is licensed under a Creative Commons Attribution 4.0 International License (https://creativecommons.org/licenses/by/4.0), which permits unrestricted use, sharing, adaptation, distribution, and reproduction in any medium, provided the original work is properly cited.


