Cold Plasma for Preparation of Pd/graphene Catalysts toward 4-nitrophenol Reduction: Insight into Plasma Treatment
Yue Hua1, Lingyu Zhao1, Qian Zhao1, Guangqing Xia2,3, Xiuling Zhang1, Lanbo Di1,2,3*
1College of Physical Science and Technology, Dalian University, Dalian, Liaoning Province, China
2State Key Laboratory of Structural Analysis for Industrial Equipment, Dalian, Liaoning Province, China
3Key Laboratory of Advanced Technology for Aerospace Vehicles of Liaoning Province, Dalian University of Technology, Dalian, Liaoning Province, China
*Corresponding to: Lanbo Di, PhD, Professor, College of Physical Science and Technology, Dalian University, No. 10 Xuefu Street, Dalian, 116622, Liaoning Province, China; Email: dilanbo@163.com
Abstract
Objective: Controllable synthesis of high-performance palladium catalysts toward 4-nitrophenol (4-NP) reduction still remains a significant challenge. This work aims to exploit a facile dielectric barrier discharge (DBD) plasma treatment method to synthesize the graphene-supported palladium catalysts (Pd/G-P), and to as certain the effect of plasma discharge voltage and discharge time on the structure-performance relationship of Pd/G-P, then provides insight into the synthesis of high-performance Pd/G-P by DBD plasma.
Methods: A graphene-supported palladium precursor was prepared by excess impregnation method firstly, and then treated using hydrogen DBD plasma to synthesize Pd/G-P catalysts. The effect of discharge voltage and discharge time on the structure-performance relationship of Pd/G-P were systematically investigated based on the reaction model of 4-NP reduction.
Results: The Pd/G-P prepared by DBD plasma at discharge voltage of 13.0kV and discharge time of 4min exhibited the highest performance for 4-NP reduction with a rate constant (k) of as high as 0.88min-1. The discharge diagnosis and sample characterization results showed that Pd/G-P with much higher than Pd/C and O/C atomic ratios, and surface defects density can be obtained at the optimal discharge parameters. These features enabled the formation of small-sized and highly-dispersed palladium nanoparticles, thereby enhancing the catalytic activity. The experimental study of reaction kinetics showed that plasma synthesized Pd/G-P at optimal parameters can adsorb intermediate reactants more effectively and enhance the catalytic performance.
Conclusion: In this work, controllable synthesis of high-performance Pd/G-P were synthesized, which provides important reference significance for preparing other catalysts by plasma regulation.
Keywords: Pd/graphene, 4-nitrophenol reduction, cold plasma, plasma treatment, metal catalysts
1 INTRODUCTION
With the world’ s growing consumption of chemical products, organic polluted wastewater discharge from a huge amount of effluent has caused concern about environmental pollution. 4-nitrophenol (4-NP, nitro compound) has become one of the major contaminants due to its high toxicity, high stability and refractory biodegradabilit[1]. The maximum allowable level concentration in water is 20ppb (>10ppm)[2]. Effective catalytic reduction of 4-NP to low toxicity p-aminophenol (4-AP) in the presence of catalytic materials and NaBH4 provides an efficient and environmentally friendly method for eliminating 4-NP[3]. Therefore, the preparation of efficient catalytic materials for 4-NP reduction has always been a research hotspot.
Among the catalytic materials for reducing 4-NP to 4-AP, Pd-based catalysts are generally considered to own excellent catalytic reduction performance and have been widely studied[4]. Graphene is an excellent carrier as its larger specific surface area, excellent thermal-chemical stability and good electrical conductivity. In addition, the abundant oxygen-containing groups in graphene can increase the dispersibility of the catalytic material in the aqueous solution, improve the adsorption capacity of the graphene carrier, and increase the contact probability between the metal nanoparticles and the reaction solution[5]. Therefore, graphene-supported palladium (Pd/G) catalytic materials have attracted more and more researchers’ attention and lots of work have been investigated widely. Nasrollahzadeh et al.[6] used a one-pot methodto prepare a Pd/rGO catalytic material to reduce 4-NP, and the rate constant k was 2.2min-1. Revathy et al.[7] used NaBH4 reduction method to synthesize a graphene-supported palladium-nickel alloy catalyst to reduce 4-NP to 4-AP, and the rate constant k was 0.16min-1. Tran et al.[8] used a one-pot method to synthesize Pd/GO catalytic materials at room temperature. The Pd/GO nanocomposites demonstrated a superior catalytic activity with apparent rate constant of 1.057min-1 and an excellent stability of up to 15 recycle times toward the reduction of 4-NP. Dong et al.[9] successfully anchored Pd nanoparticles on reduced graphene oxide using a co-deposition and sacrificial method, in which cobalt was used as the sacrificial agent. The prepared catalysts showed extremely high catalytic activity for the reduction of 4-NP at room temperature, and the turn over frequency reaches 9900h-1 at 298K. Although the Pd/GO material has high catalytic reduction performance of 4-NP, there are still problems such as long reaction cycle, complicated operation and environmental pollution in the preparation method. Therefore, developing a more simple, fast and environment-friendly preparation method is still urgently needed, and is of great significance.
Cold plasma is a green and efficient new technology for processing and preparing catalytic materials. It can not only realize the reduction of metal nanoparticles, but also the doping and exfoliation of graphene support. Wang et al.[10] used dielectric barrier discharge (DBD) plasma to treat the mixture of ammonium carbonate and graphite oxide (GO). GO could not only produce exfoliation phenomenon, but also dope N atoms to obtain N-PEGO samples during the preparation process. The N-PEGO used as cathode oxygenreduction reaction catalytic material showed high catalytic performance and stability. Zhou et al.[11,12] employed DBD plasma to exfoliate GO into graphene sheets at atmospheric pressure using different working gases including H2, Ar and CO2. Peng et al.[13] used DBD plasma to obtain monolayer rGO, which possessed a high reduction degree and short preparation time, and exhibited superior electrochemical activity comparing with the rGO prepared by the traditional heating process. Except for the exfoliation and metal nanoparticles reduction effect of DBD plasma on carrier, the plasma-prepared graphene-supported palladium material can also effectively increase the defect sites of the carrier, promote the generation of small-sized metal nanoparticles with high dispersion, and effectively improve the performance of the catalytic material. For instance, Zhang et al.[14] used cold plasma to prepare PdAu/C catalytic material and applied it to formic acid dehydrogenation, which showed excellent catalytic performance. It was mainly because cold plasma treatment improved the alloying degree of metal, promoted the redispersion of agglomerated particles, and adjusted the surface enrichment of active metal components. Wang et al.[15] prepared Pd/C-P(NH3) and Pd/C-C(NH3) catalytic materials by ammonia cold plasma and ammonia heat treatment, which showed that the HCOOH decomposition rate of Pd/C-P(NH3) was 1.14 times that of Pd/C-C(NH3) as the higher dispersibility and smaller particle size of Pd nanoparticles in Pd/C-P(NH3). Zhao et al.[16] used cold plasma to prepare graphene-supported palladium catalysts (Pd/G-P) catalytic material and applied it to reduce 4-NP, the catalytic activity of Pd/G-P was about 2.6 times that of Pd/G-H prepared by hydrothermal reduction method. This work indicated that the improvement of catalyst activity is a comprehensive process affect by the particle size and dispersion, surface enrichment of active metal components, defect sites, oxygen containing group and the interaction between plasma and support on the surface of carrier. Although abundant work about catalytic materials preparation of DBD cold plasma have been investigated widely, the emphasis was mainly focused on the cold plasma modification effect on catalyst support and the comparative investigation among various carriers. Meanwhile, the discharge parameters optimization of DBD hydrogen plasma were still not investigated systematically and more high-efficiency catalytic materials preparation of DBD hydrogen plasma was still lacked.
In this work, Pd/G-P were prepared by atmospheric pressure DBD hydrogen cold plasma with palladium chloride and graphene as palladium source and carrier, respectively. Taking the reduction of 4-NP as a model reaction, the effect of discharge voltage and discharge time on the structure-performance relationship of Pd/G-P were systematically investigated. The results found that the Pd/C, O/C atomic ratios and graphene surface defects were the highest on the sample at discharge voltage of 13kV and discharge time of 4min. These features enabled the formation of palladium nanoparticles with small size and high dispersion on the outer surface of graphene, thereby enhancing the catalytic activity. The k of Pd/G-P catalytic reduction of 4-NP is as high as 0.88min-1 under the optimal conditions.
2 EXPERIMENTAL METHODS
2.1 Experimental Setup
Figure 1 showed the schematic diagram of the experiment setup consisting of a DBD reactor, gas flow control system, an adjustable sinusoidal AC power supply and electrical parameter diagnostics. The reactor mainly consisted of a quartz tube (inner diameter: 7mm, outer diameter: 10mm), a high-voltage electrode (high purity copper, diameter: 2mm), and a grounded electrode (aluminum foil, length: 20mm). The mixture gas of H2 and Ar (flow rate of H2/Ar=1/1) is conveyed to the DBD reactor as working gas through two mass flow controllers (MFC). The applied voltage were measured by using a HV probe (Tektronix P6015A) with 1000: 1 attenuation connected with a Digital Phosphor Oscilloscope (Tektronix DPO2014). A 0.47mF capacitor was connected with the ground electrode in series to obtain the discharge voltage, and the discharge current flow to the capacitor was obtained by a current monitor (Pearson probe). The hydrogen cold plasma can be ignited in DBD reactor by the AC power supply (CTP-2000K Plasma Generator, Nanjing Suman Plasma Technology Co., Ltd.). The peak-to-peak discharge voltage (Up-p) was in the range of 11.0 to 16.0kV, and thedischarge time was 2-9min. All experiments are carried out at a fixed AC discharge frequency of 11.8kHz. More details of the DBD experimental setup can be found in our previous work[16].
|
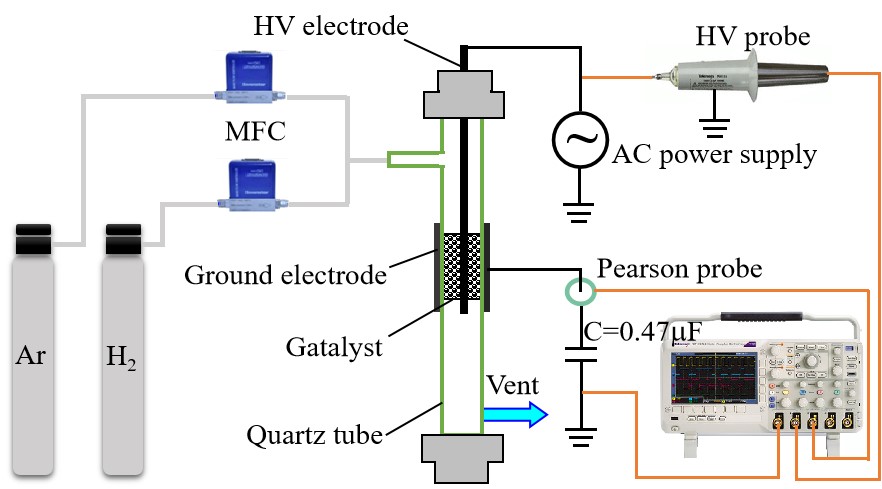
Figure 1. Schematic diagram of the experimental setup.
2.2 Synthesis of Pd/G-P
A simple excessive impregnation method was adopted to prepare the graphene-supported palladium precursor. Typically, 0.5g graphene obtained from Suzhou Tanfeng Technology Co., Ltd. was added in 3.7mL distilled water and sonicated for 1h. Then a certain amount of H2PdCl4 solution (0.0554g·mL-1) by dissolving PdCl2 into dilute HCl was added into the solution, and further treated by ultrasound for 5min. Thereafter, it was transferred into a beaker and stirred for 6h by a magnetic stirrer. Then it was dried in a blast drying oven at 120°C for 2h to be investigated which was marked as Pd/G-As. Finally, 0.1g of Pd/G-As was picked and packed into the DBD reactor, then treated by hydrogen cold plasma at different discharge parameters. The catalyst obtained after plasma treatment was denoted as Pd/G-P.
2.3 Catalyst Characterization
X-ray diffraction (XRD) was performed using a DX-2700 diffractometer (Dandong Haoyuan Instrument Co., Ltd., China) ata 2θ range of 5°—85°, 40kV and 30mA, using Cu-Kα radiation (λ=0.154nm). X-ray photoelectron spectroscopy (XPS) was conducted using ESCALAN250 (Thermo VG instrument, USA). X-ray source of monochromatic Al target K-ray was adopted, and the electron binding energies of elements of the samples were corrected based on the orbital binding energy of C1s (284.6eV). A HT7700 transmission electron microscope (Hitachi Co., Ltd., Japan) was adopted to obtain the transmission electron microscopy (TEM) images at an accelerating voltage of 120kV. More than 100 nanoparticles were selected from the TEM images to calculate the average size and the corresponding size distribution of the Pd species. Fourier transform infrared spectra were recorded using a LabRAM HR Evolution spectrometer (Horiba Jobin-Ivon, France) to analyze the defects in the samples. A UV-vis spectrophotometer (UV-3900, Hitachi instrument, Japan) was used to test the reduction of 4-NP in the scanning range of 250—500nm.
2.4 Activity Test
The reduction of 4-NP by the Pd/G-P catalysts can be monitored by UV-Vis spectroscopy at the maximum absorption wavelength of 400nm. Typically, the Pd/G-P catalyst was dispersed into 4-NP aqueous solution (40mL, 0.3mM) under magnetic stirring for 5min[4]. Then, as-prepared NaBH4 solution (3mL, 0.1M) was injected into the solution during the stirring process. To evaluate the reaction process, 3mL of the mixed solution was took out and placed in a quartz cuvette (optical path 1cm), then the reaction progresswas monitored at constant time intervals in the range of 250—500nm using UV-Vis.
3 RESULTS AND DISCUSSION
3.1 Discharge Parameters of Hydrogen Cold Plasma for Preparation of Pd/G-P
Figure 2 showed the discharge voltage and current waveforms, and the corresponding Lissajous figures at different peak-to-peak voltages (Up-p) and fixed frequency of 11.8kHz for preparing Pd/G-P catalysts. As shown in Figure 2A, all discharge currents presented typical pulse filamentary discharges of DBD, and the intensity of the micro-discharges was gradually enhanced with increasing Up-p[17-19]. Larger the area of the Lissajous figures became, more and more like horizontal quadrilaterals the figures’ shape became with the increase in Up-p, which tended to be the ideal DBD mode from Figure 2B. Based on the Lissajous figures, the discharge power (Pdis) can be obtained, while the input power (Pin) can be measured by a power meterdirectly. Thus the energy efficiency (η) of the power supply calculated according to Equation (1) at different Up-pwere summarized in Table 1.
|
|
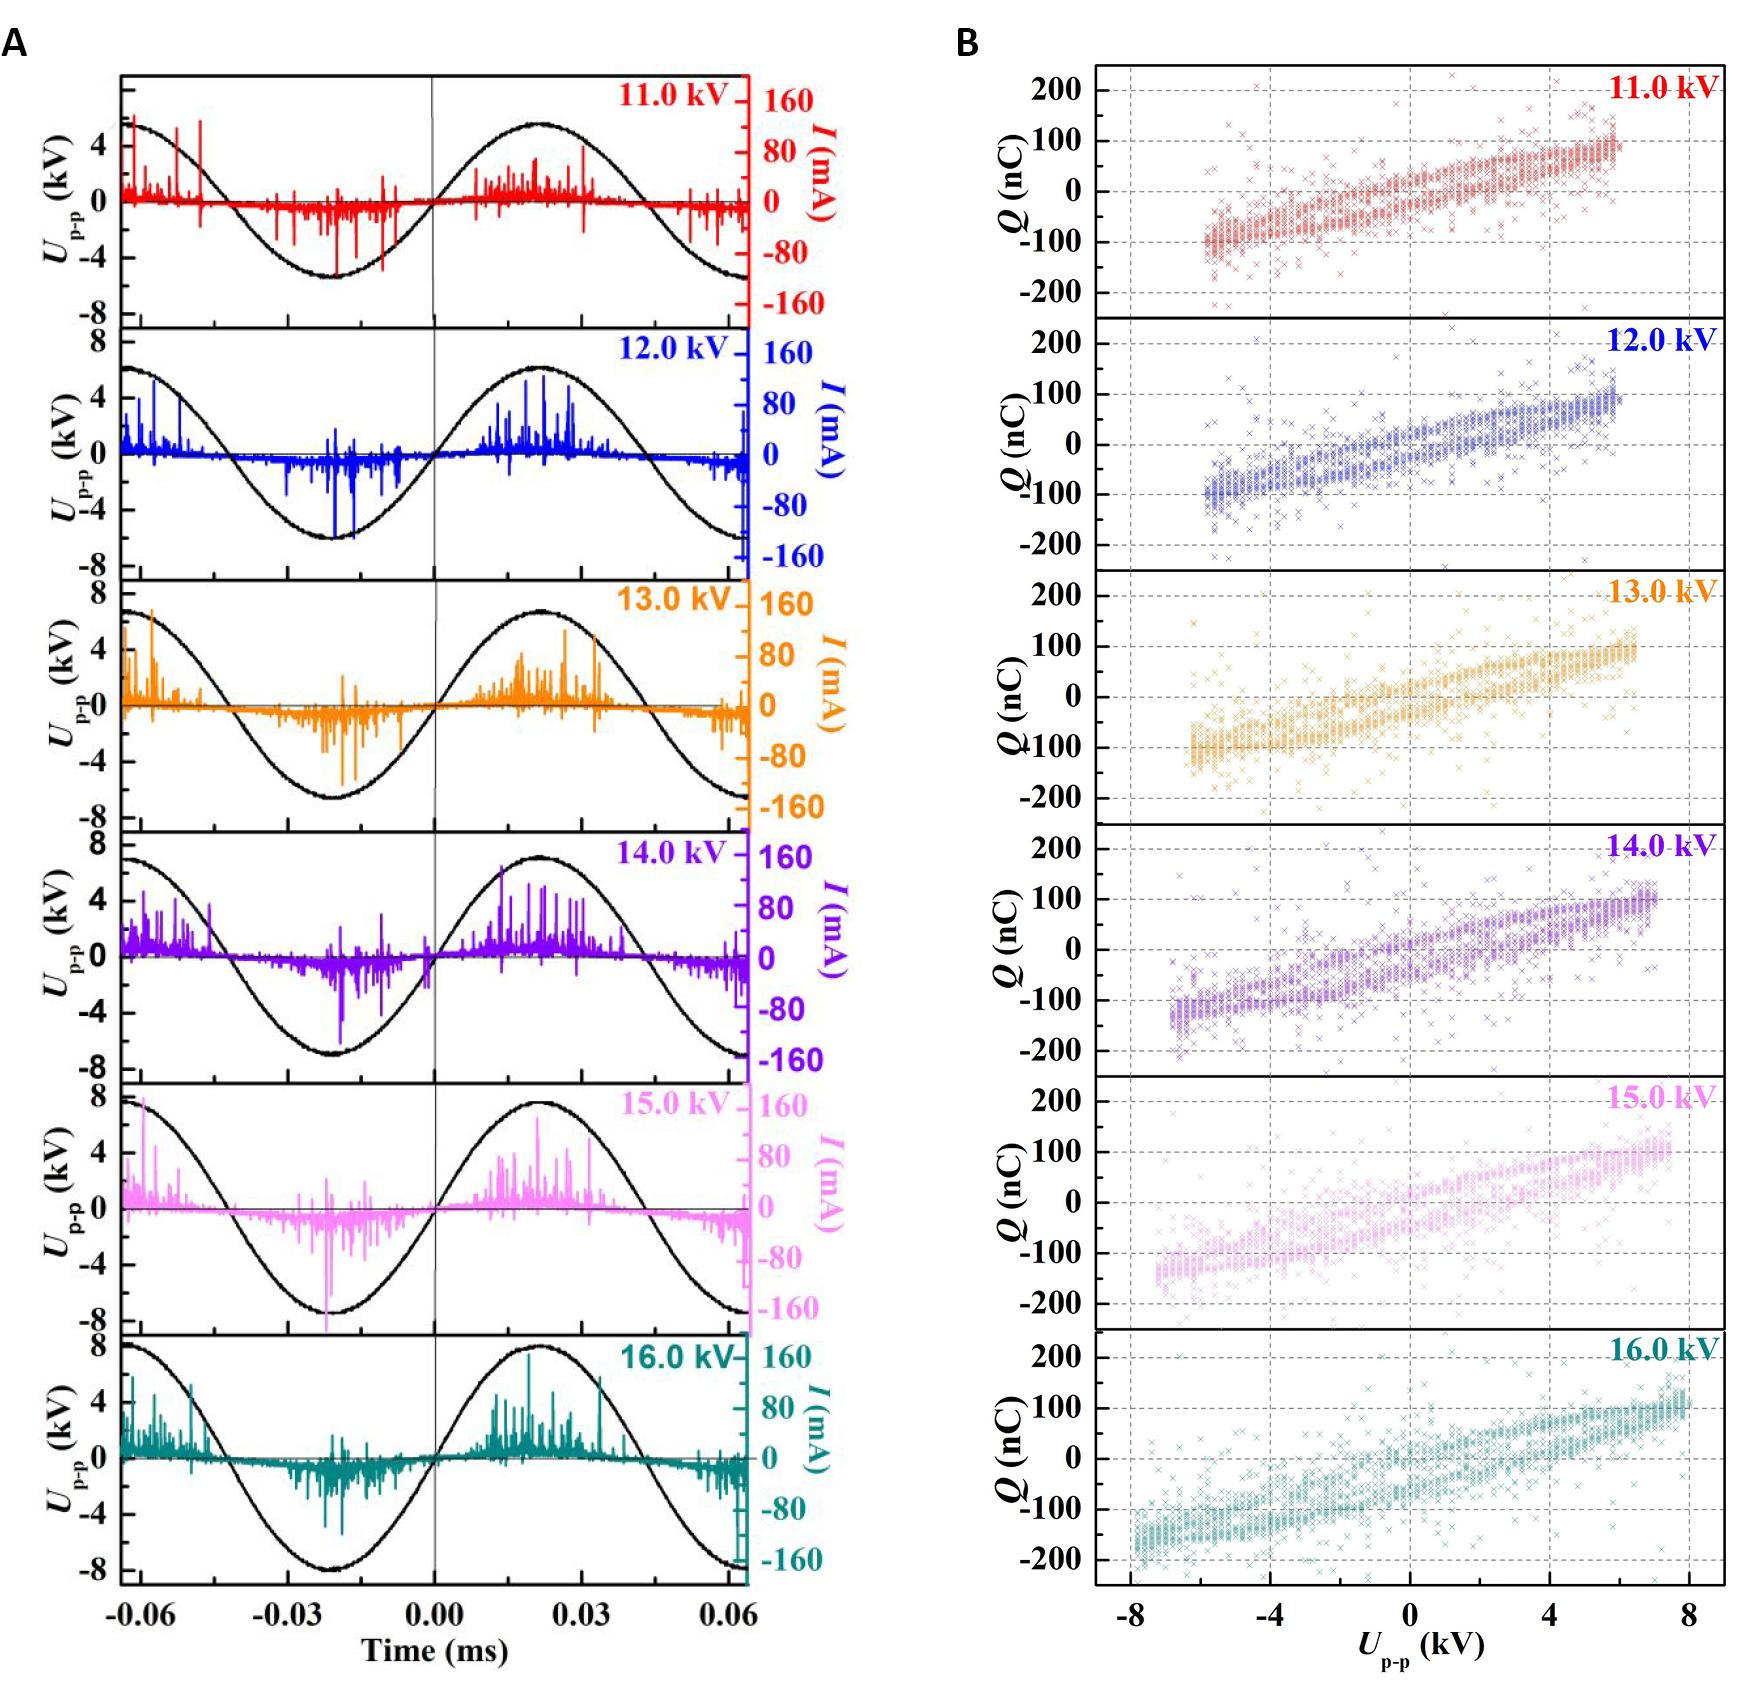
Figure 2. The discharge voltage, current waveforms, and the corresponding Lissajous figures at different peak-to-peak voltages (Up-p). A: The discharge voltage and current waveforms of DBD discharge; B: The corresponding Lissajous figures, at different Up-p and fixed frequency of 11.8kHz for preparing Pd/G-P catalysts.
As shown in Table 1, as the Up-p increased from 11.0 to 16.0kV, Pin and Pdis increased from 12.2 and 3.2W to 26.1 and 19.1W respectively. The significant increase of η from 26.2% to 73.2% indicated that more power was deposited into plasma as the Up-p increased from 11.0 to 16.0kV. According to Figure 2A, the number of the discharge channels increased and the charge transfer capability enhanced with the increase of Up-p, which led to the increase of input power and significant improvement in the energy efficiency of the power supply.
Table 1. The Input Power (Pin), Discharge Power (Pdis), and the Energy Efficiency (η) of the Cold Plasma Operated at Different Up-p
Up-p |
Pin (W) |
Pdis (W) |
η (Pdis/Pin) |
11.0kV |
12.2 |
3.2 |
26.2% |
12.0kV |
14.6 |
4.3 |
29.5% |
13.0kV |
17.7 |
6.4 |
36.2% |
14.0kV |
19.9 |
8.5 |
42.7% |
15.0kV |
22.8 |
12.8 |
56.1% |
16.0kV |
26.1 |
19.1 |
73.2% |
3.2 Effect of Discharge Voltage on the Structure-performance Relationship of Pd/G-P
The effect of discharge voltage on the catalytic activity of the Pd/G-P catalysts for 4-NP reduction was investigated at fixed discharge time 4min, as shown in Figure 3. As the catalytic reaction went on, the absorption peak of 4-NP anions at 400nm was gradually weakened, while a new absorption peak at 300nm corresponding to 4-AP ions gradually appeared and was intensified, which implying that the 4-NP was reduced into 4-AP[20]. Moreover, during the 4-NP reduction process, 4-AP was the only product and no other by-products were detected because of the excessive addition of reactant sodium borohydride. Furthermore, the sequence of the corresponding reaction time (tr) at different Up-p were 13.0kV (163s)< 12.0kV (324s)< 14.0kV (327s)< 11.0kV (379s)< 15.0kV (382s)< 16.0kV (443s), indicating that the Pd/G-P prepared at the discharge voltage of 13.0kV exhibited the highest catalytic activity for 4-NP reduction.
|
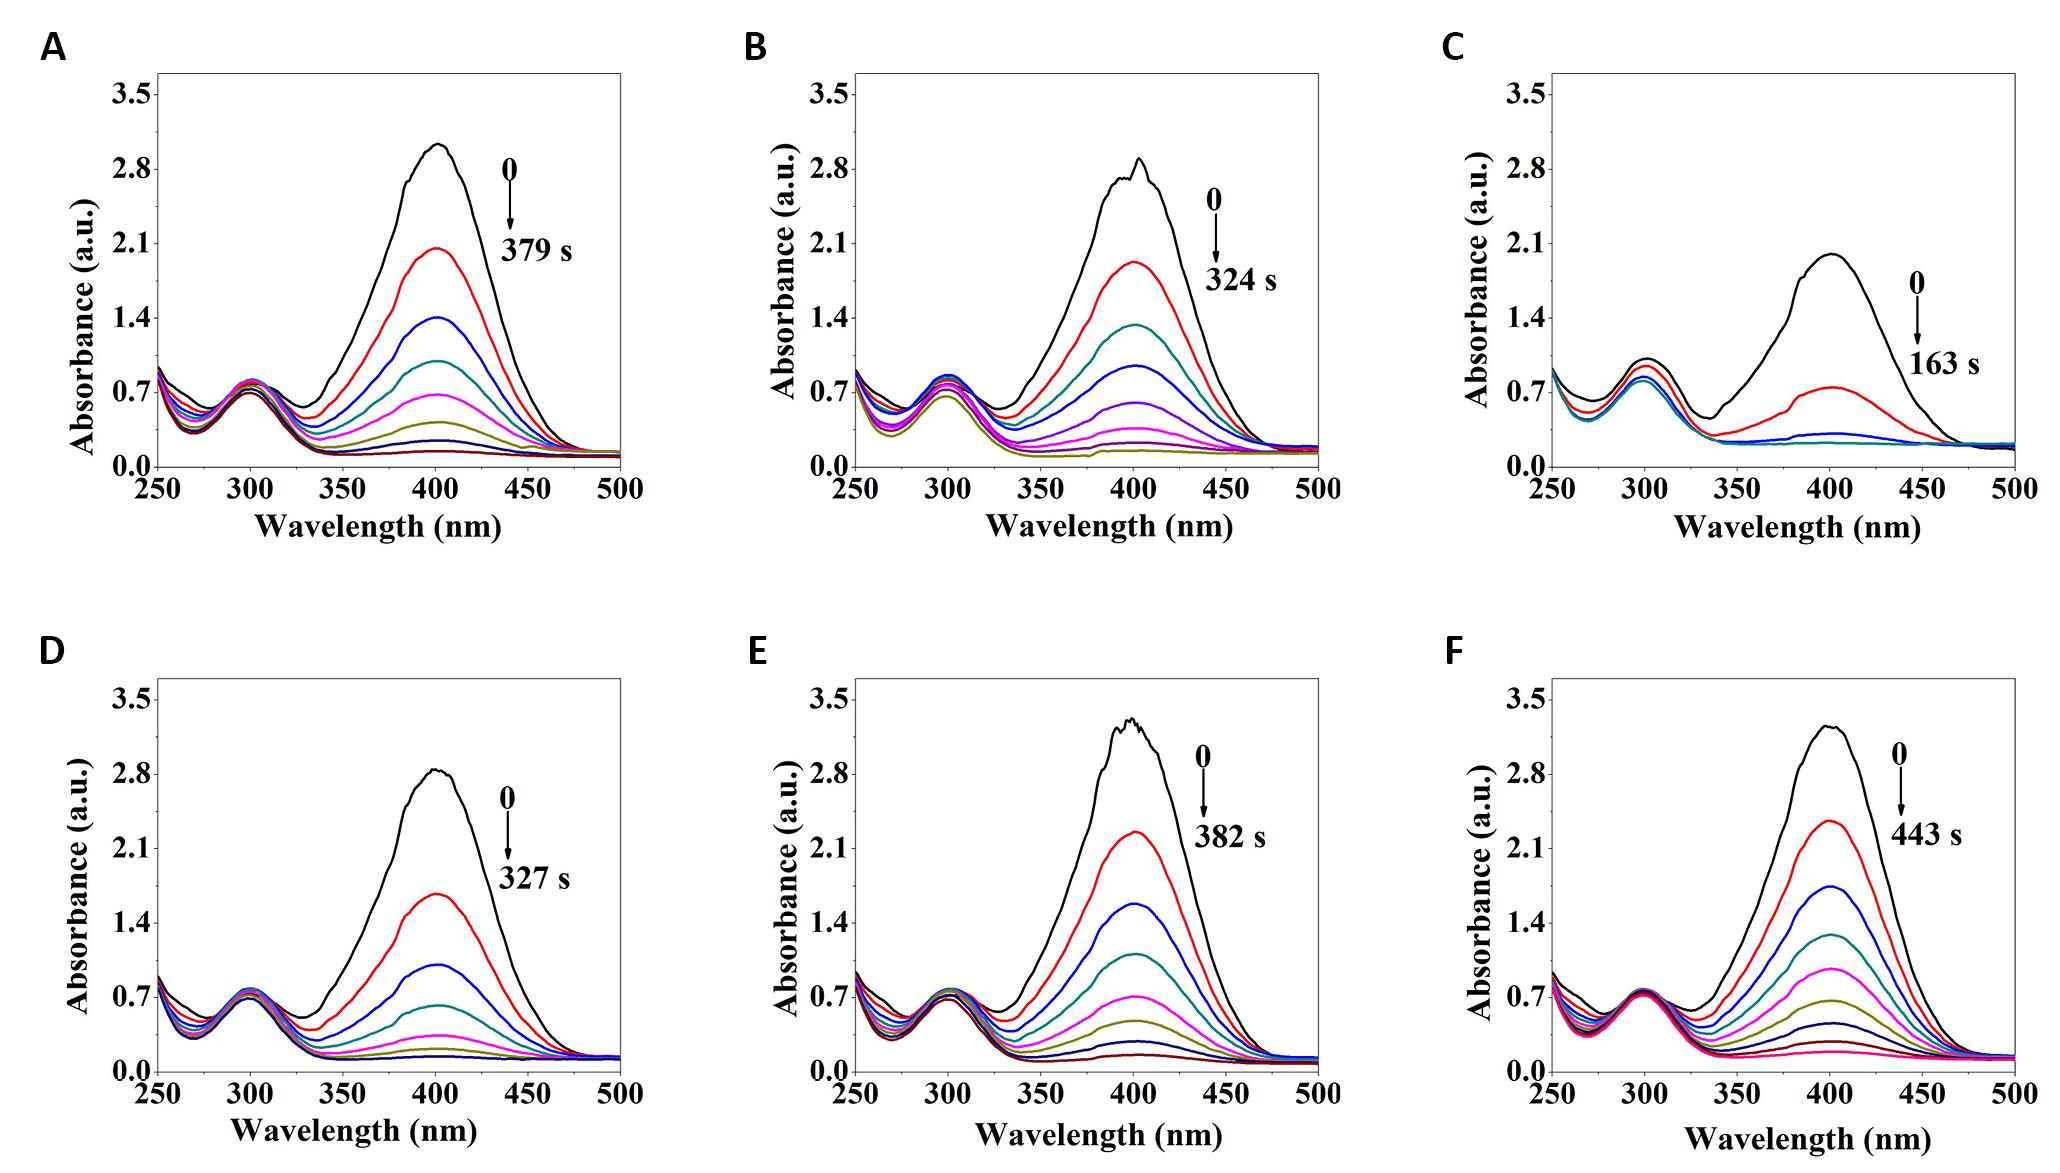
Figure 3. UV-Vis absorption spectra of the Pd/G-P catalysts prepared at 11.0kV (A), 12.0kV (B), 13.0kV (C), 14.0kV (D), 15.0kV (E), and 16.0kV (F) with 4min for 4-NP reduction.
To get insight into the kinetics of the catalytic reduction of 4-NP by Pd/G-P, the ln(At/A0) was plotted against the reaction time tr based on the data from Figure 3, as shown in Figure 4A. A good linear relationship between ln(At/A0) and the reaction time tr, indicating that the reaction was a first-order reaction and follows the Langmuir-Hinshelwood model. The reaction rate constant k was calculated according to the following Equation (2).
|
Where A0 and At were the initial 4-NP concentration and the concentration at a reaction time of tr, respectively.
|
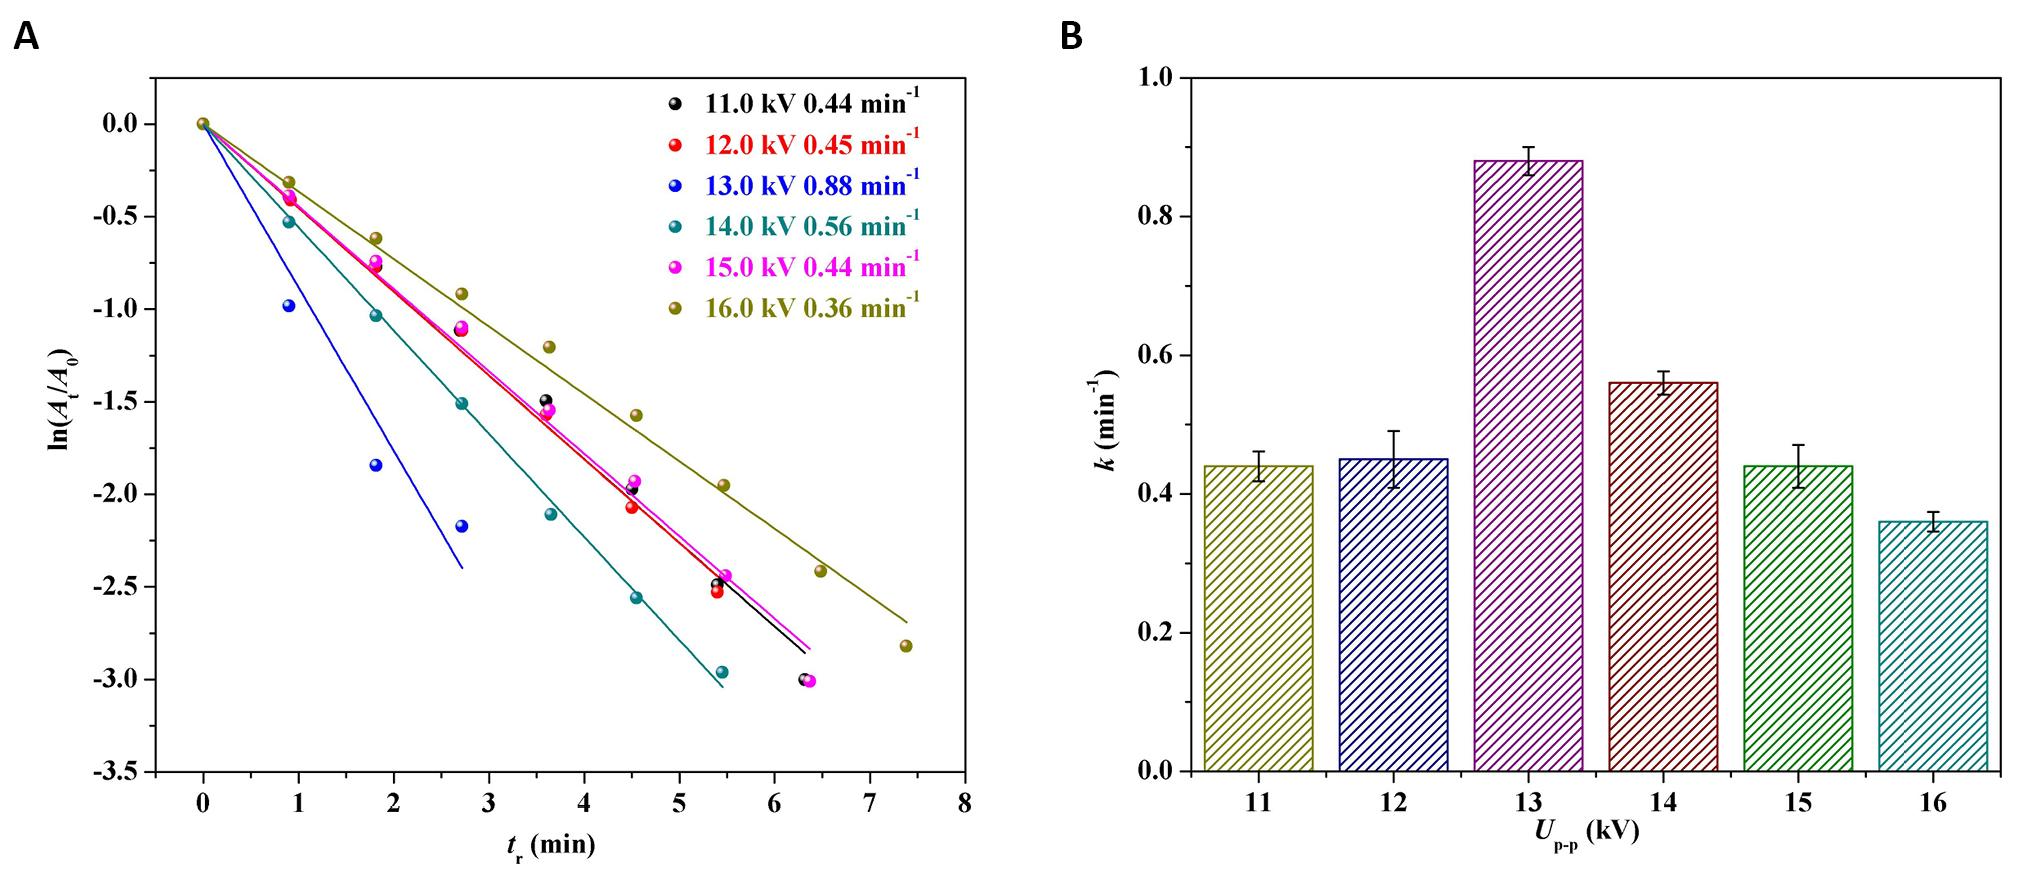
Figure 4. The logarithm of absorbance ratio ln(At/A0) versus reaction time (tr) over the Pd/G-P prepared at different Up-p and 4min (A) and the corresponding reaction rate constant k values versus Up-p (B).
The reaction rate constant k was plotted against thedischarge voltage Up-p as illustrated in Figure 4B. The activity sequence of the Pd/G-P catalysts prepared at different Up-p for 4-NP reduction were 13.0kV (0.88min-1)> 14.0kV (0.56min-1)> 12.0kV (0.46min-1)> 11.0kV (0.45min-1)> 15.0kV (0.44min-1)> 16.0kV (0.36min-1)
. When the Up-p was 13kV, the k value of the Pd/G-P was the largest, which were 1.6, 1.9, 2.0, 2.0 and 2.4 times of the activity of the Pd/G-P prepared at Up-p of 11.0, 12.0, 14.0, 15.0 and 16.0kV respectively. Based on the above characterization, it can be concluded that suitable Up-p was crucial for the preparation of high-performance Pd/G-P catalysts.
In order to reveal the effect of the discharge voltage on the structure-performance relationship of the Pd/G-P catalysts, various methods were employed to characterize the structure of the samples. The crystal structures of the Pd/G-P catalysts prepared at different discharge voltages, as well as the graphene support were analyzed by XRD, and the results were shown in Figure 5. It could be seen that all of the samples exhibited a narrow diffraction peak at 2θ=26.5°, corresponding to the characteristic diffraction peak of the C(002) plane (PDF#97-005-2230).The peak in Pd/G-P was gradually decreased with increasing Up-p aftering plasma treatment, which might be attributed to the increase in the reduction degree of Pd ions and the coverage of the resulting Pd species on graphene support. In addition, a weaker characteristic diffraction peak at 2θ=40.1° corresponding to the Pd(111) crystal plane (PDF#97-005-2251) was detected for all the Pd/G-P samples, indicating the plasma treatment can reduce Pd ions to Pd. While the relatively weak peak intensity was associated with the lower loading and better dispersion of the Pd species in the samples.
|

Figure 5. XRD patterns of the Pd/G-P catalysts prepared at different UP-P, as well as the graphene support.
The elemental composition and relative content of the Pd/G-P catalysts prepared at 11.0, 13.0 and 15.0kV were analyzed by XPS. Figure 6A showed the C1s XPS spectra of the samples, which could be deconvoluted into four peaks. The dominant peak at the binding energy of 284.6eV belonged to the graphitic carbon peak, suggesting that most of the C atoms were still in the honeycomb lattice of graphene[21]. The other three binding energy peaks appeared at 286.2, 287.8, and 289.3eV were attributed to the C-O, C=O and O-C=O functional groups[16] respectively. Figure 6B presented the O1s XPS spectra of the samples, and three peaks at blinding energy of 531.4, 532.7 and 534.2eV can be deconvoluted. The dominant peak at the binding energy of 532.7eV was attributed to the C=O and the peaks at 531.4 and 534.2eV were ascribed to the C-O and O=C-O[22,23] respectively, which was consistent with the splitting results of C1s. Figure 6C illustrated the Pd3d XPS spectra of the samples which can be divided into three peaks at the binding energies of 336.3, 337.8 and 339.0eV respectively, assigned to the three valence states of Pd0, Pd2+ and Pd4+[15,24,25]. The oxidation state of Pd can form Pd-O bonds through the hydroxyl groups on the surface of the support[26], which played a positive role in the hydrogenation of 4-NP. According to the peak areas obtained by fitting the Pd3d energy spectra of the Pd/G-P samples prepared at different Up-p, the relative percentage content of different Pd valence states on the surface of the Pd/G-P samples were determined as shown in Table 2. As the Up-p increased from 11.0kV to 15.0kV, the metallic Pd0 increased from 16.9% to 30.2%, while the Pd2+ decreased from 73.6% to 58.6%. Meantime, a slight increase from 9.5% to 11.2% was observed for the Pd4+, indicating that the increase of Up-p was beneficial to the reduction of Pd ions.
|
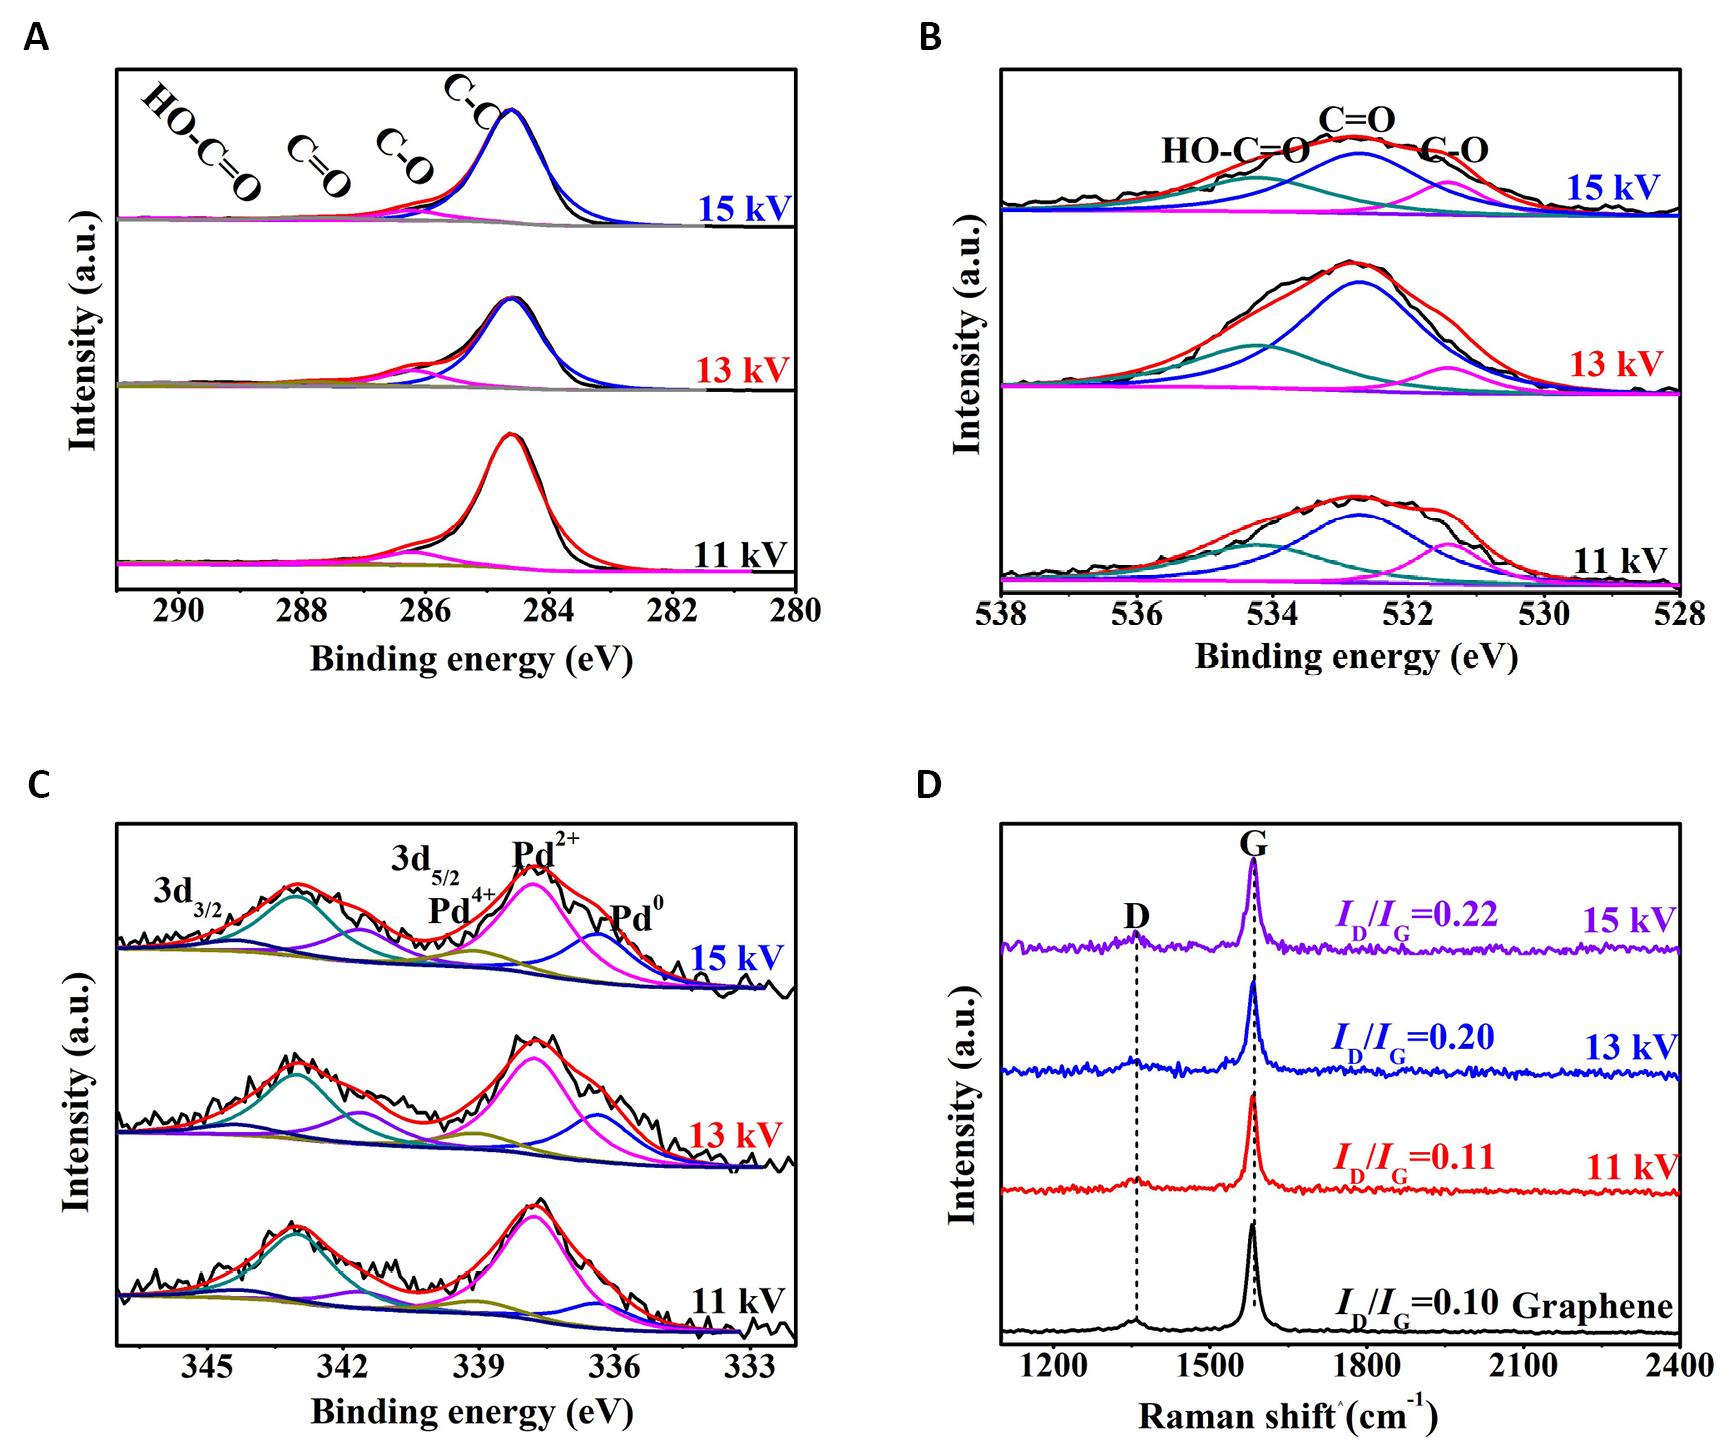
Figure 6. XPS spectra of the Pd/G-P catalysts prepared at different Up-p: C1s (A), O1s (B) Pd3d (C) and the corresponding FT-Raman spectra (D).
Table 2. The Pd Composition and the Atomic Ratios of Pd/C and O/C in the Pd/G-P Catalysts Prepared at Different Up-p
Up-p |
Pd Composition (%) |
Atomic Ratios of Pd/C |
Atomic Ratios of O/C |
||
Pd0 |
Pd2+ |
Pd4+ |
|||
11.0kV |
16.9 |
73.6 |
9.5 |
0.0041 |
0.0473 |
13.0kV |
28.2 |
61.2 |
10.6 |
0.0060 |
0.0801 |
15.0kV |
30.2 |
58.6 |
11.2 |
0.0052 |
0.0497 |
According to the XPS spectra of C1s, O1s, and Pd3d, the atomic ratios of Pd/C and O/C in the Pd/G-P samples prepared at different Up-p were obtained, as summarized in Table 2. The atomic ratios of Pd/C in the Pd/G-P samples prepared at 11.0, 13.0 and 15.0kV were 0.0041, 0.0060 and 0.0052 respectively. With increasing the Up-p, the Pd/C atomic ratio increased and then decreased, which might be due to the effect of the strong electric field of DBD plasma[12]. The electric field enhanced with the increase of Up-p, which promoted the migration of negatively charged PdCl42- and reduced neutral Pd0 nanoparticles to the outer surface of the graphene support. However, if the Up-p was too high, the strong filamentous discharges channel would ablate the graphene, resulting in a decrease of the Pd/C atomic ratio. Interestingly, when the Up-p was 11.0, 13.0 and 15.0kV, the O/C atomic ratios in Pd/G-P were 0.0473, 0.0801 and 0.0497 respectively, which also showed a trend of increasing firstly and decreasing later. This might be due to the fact that the C-C, C-H and C-O bonds in graphene can be broken with the effect of plasma. When they were exposed to air, they will react quickly with O2 in the air, thereby increasing the O/C atomic ratio. However, if the Up-p was too high, it would ablate the graphene, remove the oxygen-containing functional groups with poor stability on the support and reduce the O/C atomic ratio. Consequently, the Pd/G-P prepared at the Up-p of 13.0kV exhibited the highest O/C atomic ratio. These oxygen-containing functional groups made the graphene negatively charged, which were beneficial to increase of the Pd/C atomic ratio and uniform distribution of the Pd nanoparticles on the graphene surface.
The defect structures of the Pd/G-P catalysts prepared at different discharge voltages were analyzed by FT-Raman spectroscopy, as presented in Figure 6D. Two peaks locatedat 1359 and 1589cm-1, respectively, were observed for both the Pd/G-P catalysts and the graphene support. The D peak appeared at 1359cm-1 was generally adopted to measure the structural disorder, while the G peak at 1589cm-1 was related to the stretching vibration of the sp2 carbon atom in thegraphene 2D hexagonal lattice. The intensity ratio of ID/IG was generally used as an indicator of the graphitization degree and defects density in carbon materials. When the Up-p was 11.0, 13.0 and 15.0kV, the ID/IG values of the graphene support and the prepared Pd/G-P catalysts were 0.10, 0.11, 0.20 and 0.22 respectively. Compared with the graphene support, defects in Pd/G-P were increased, revealing that plasma treatment was beneficial to defects formation. In addition, the density of the defects was increased with discharge voltage, which may be attributed to the removal of some unstable oxygen-containing groups by discharge plasma, and the re-establishment of the conjugated graphene grid[27].
The dispersion and size distribution of the Pd nanoparticles in the Pd/G-P catalysts prepared at the discharge voltage of 11.0, 13.0 and 15.0kV were analyzed by TEM, as shown in Figure 7. From Figure 7A-C we can see that the Pd nanoparticles were uniformly dispersed on the graphene support. By calculating more than 100 nanoparticles, the average size of Pd nanoparticles in the Pd/G-P catalysts was calculated, and their corresponding particle size distribution histograms were obtained, as illustrated in Figure 7D-F. The average size of Pd nanoparticles in the Pd/G-P catalysts prepared at the Up-p of 11.0, 13.0 and 15.0kV were 3.0±0.7, 2.8±0.4 and 3.5±0.8nm, respectively. With increasing the Up-p, the average size of the Pd nanoparticles increased and then decreased, and smallest size of Pd nanoparticles were obtained at the Up-p of 13.0kV. According to the XRD, XPS and Raman analyses, the Pd/G-P catalyst prepared at the Up-p of 13.0kV possessed the highest reduction degree of palladium ions, the Pd/C and O/C atomic ratios, and the defects density of graphene. These features would facilitate the adsorption of the metal nanoparticles onto the graphene surface through hydrogen bonds to ensure the generation of small-sized and highly dispersed Pd nanoparticles[28,29]. All of these made the Pd/G-P prepared at the Up-p of 13.0kV exhibited the highest catalytic activity for 4-NP reduction. In the subsequent experiments, the optimal Up-p of 13.0 kV was adopted to further explore the effect of discharge time on the catalytic activity of Pd/GO-P.
|

Figure 7. The typical TEM images and particle size distribution histograms of Pd/G-Pcatalysts prepared at 11kV (A&D), 13kV (B&E) and 15kV (C&F).
3.3 Effect of Discharge Time on the Structure-performance Relationship of Pd/G-P
The effect of discharge time on the catalytic activity of the Pd/G-P catalysts for 4-NP reduction was investigated, as shown in Figure 8 (discharge voltage: 13.0 kV). The sequence of tr at different discharge time (td) were 4min (163s)< 3min (216s)< 5min (217s)< 6min (273s)< 9min (323s)< 2min (380s). This indicatd that the activity of the Pd/G-P catalysts for 4-NP reduction increased and then decreased with discharge time, and the Pd/G-P prepared at the discharge time of 4min exhibited the highest catalytic activity for 4-NP reduction.
|
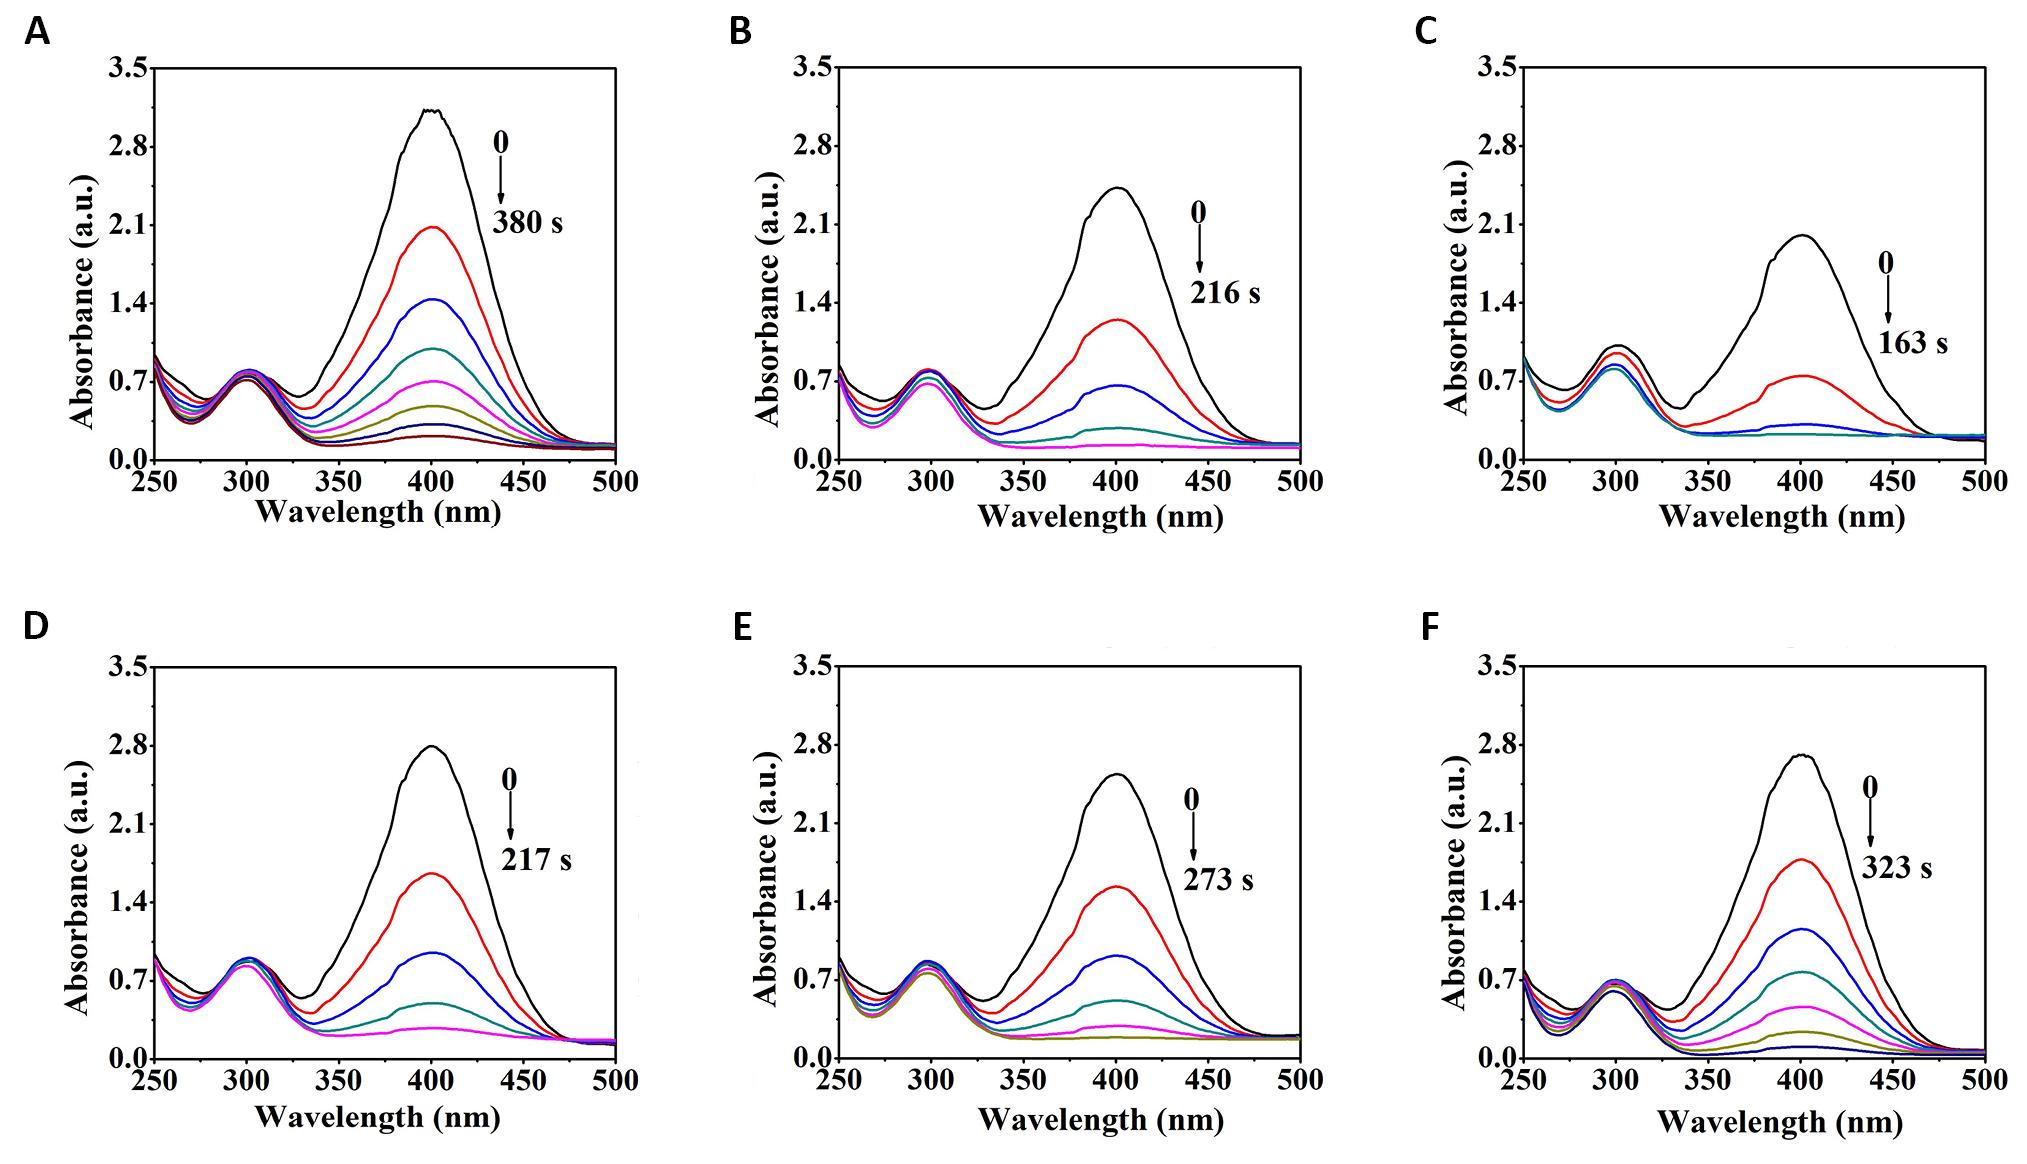
Figure 8. UV-Vis absorption spectra of the Pd/G-P Catalysts prepared at 2min (A), 3min (B), 4min (C), 5min (D), 6min (E), and 9min (F) for the reduction of 4-NP at 13.0kV.
To further understand the reaction kinetics of catalytic reduction of 4-NP and analyze the catalytic reaction rate quantitatively, the data from Figure 8 were taken to plot the curves of the ln(At/A0) against the reaction time tr, as shown in Figure 9. A good linear relationship between ln(At/A0) and tr, indicating that the reaction was a first-order-like reaction. According to Equation (2), the reaction rate constant k was plotted against the discharge time (td), as illustrated in Figure 9B. The activity sequence of the Pd/G-P catalysts prepared at different td for 4-NP reduction were 4min (0.88min-1) > 3min (0.78min-1) > 5min (0.63min-1) > 6min (0.58min-1) > 9min (0.55min-1) > 2min (0.42min-1). When td was 4min, the k value of the Pd/G-P was the largest, which was 2.1, 1.1, 1.4, 1.5 and 1.6 times as that of the Pd/G-P prepared at td of 2, 3, 5, 6 and 9min, respectively. Therefore, suitable discharge timewas crucial for the preparation of high-performance Pd/G-P catalysts, and the optimal discharge time of 4min was employed in the subsequent experiments.
|
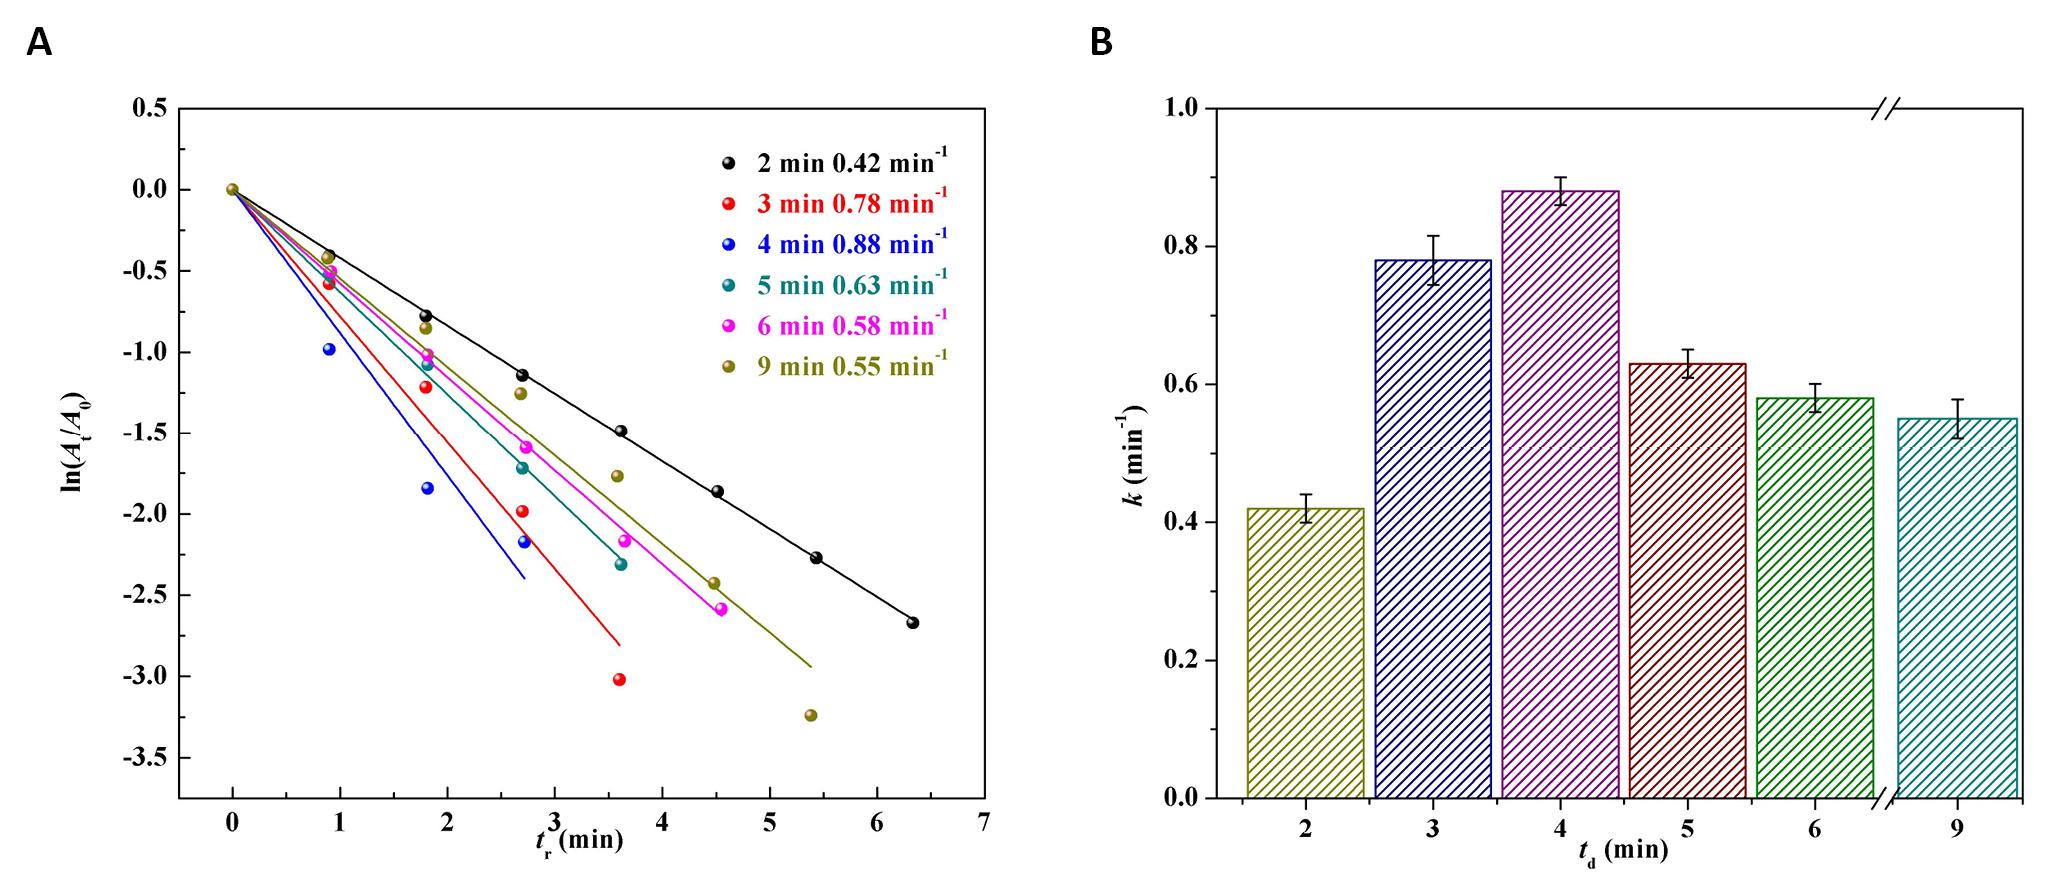
Figure 9. The logarithm of absorbance ratio ln(At/A0) versus reaction time (tr) (A) and the corresponding reaction rate constant k values versus td (B) over the Pd/G-P prepared at different discharge time (td).
Various methods were employed to characterize the structure of the Pd/G-P catalysts to reveal the effect of the discharge time on their structure-performance relationship. The crystal structures of the Pd/G-P catalysts prepared at different td, as well as the graphene support were analyzed by XRD as illustrated in Figure 10. All of the samples exhibited a narrow diffraction peak at 2θ=26.5°, assigning to the characteristic diffraction peak of the C (002) plane. No obvious change for the C (002) peak was observed as td increased from 2 to 9min, indicating that the discharge time had no evident effect on the structure of the graphene support. In addition, a weak characteristic diffraction peak at 2θ=40.1° was detected for all the Pd/G-P samples corresponding to the Pd (111) crystal plane. The weak intensity of the diffraction peak was attributed to the low loading and better dispersion of the Pd species in the samples.
|
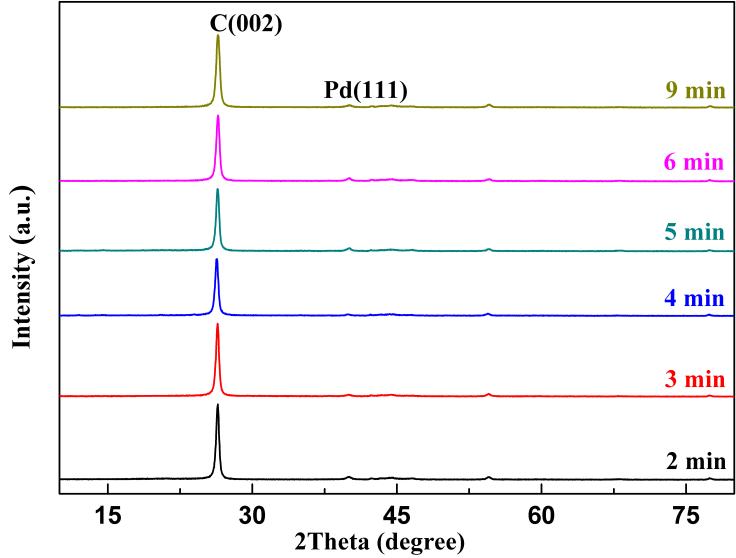
Figure 10. The XRD patterns of the Pd/G-P catalysts prepared at different Up-p, as well as the graphene support.
Figure 11A showed the C1s XPS spectra of the Pd/G-P catalysts prepared at td of 2, 4, and 6min. All the three samples could be deconvoluted into four peaks, ascribing to the C-C, C-O, C=O and O-C=O functional groups respectively. Figure 11B illustrated the O1s XPS spectra of the samples, and three peaks can be deconvoluted, attributing to the C-O, C=O and O=C-O respectively. This is consistent with the splitting results of C1s.
|
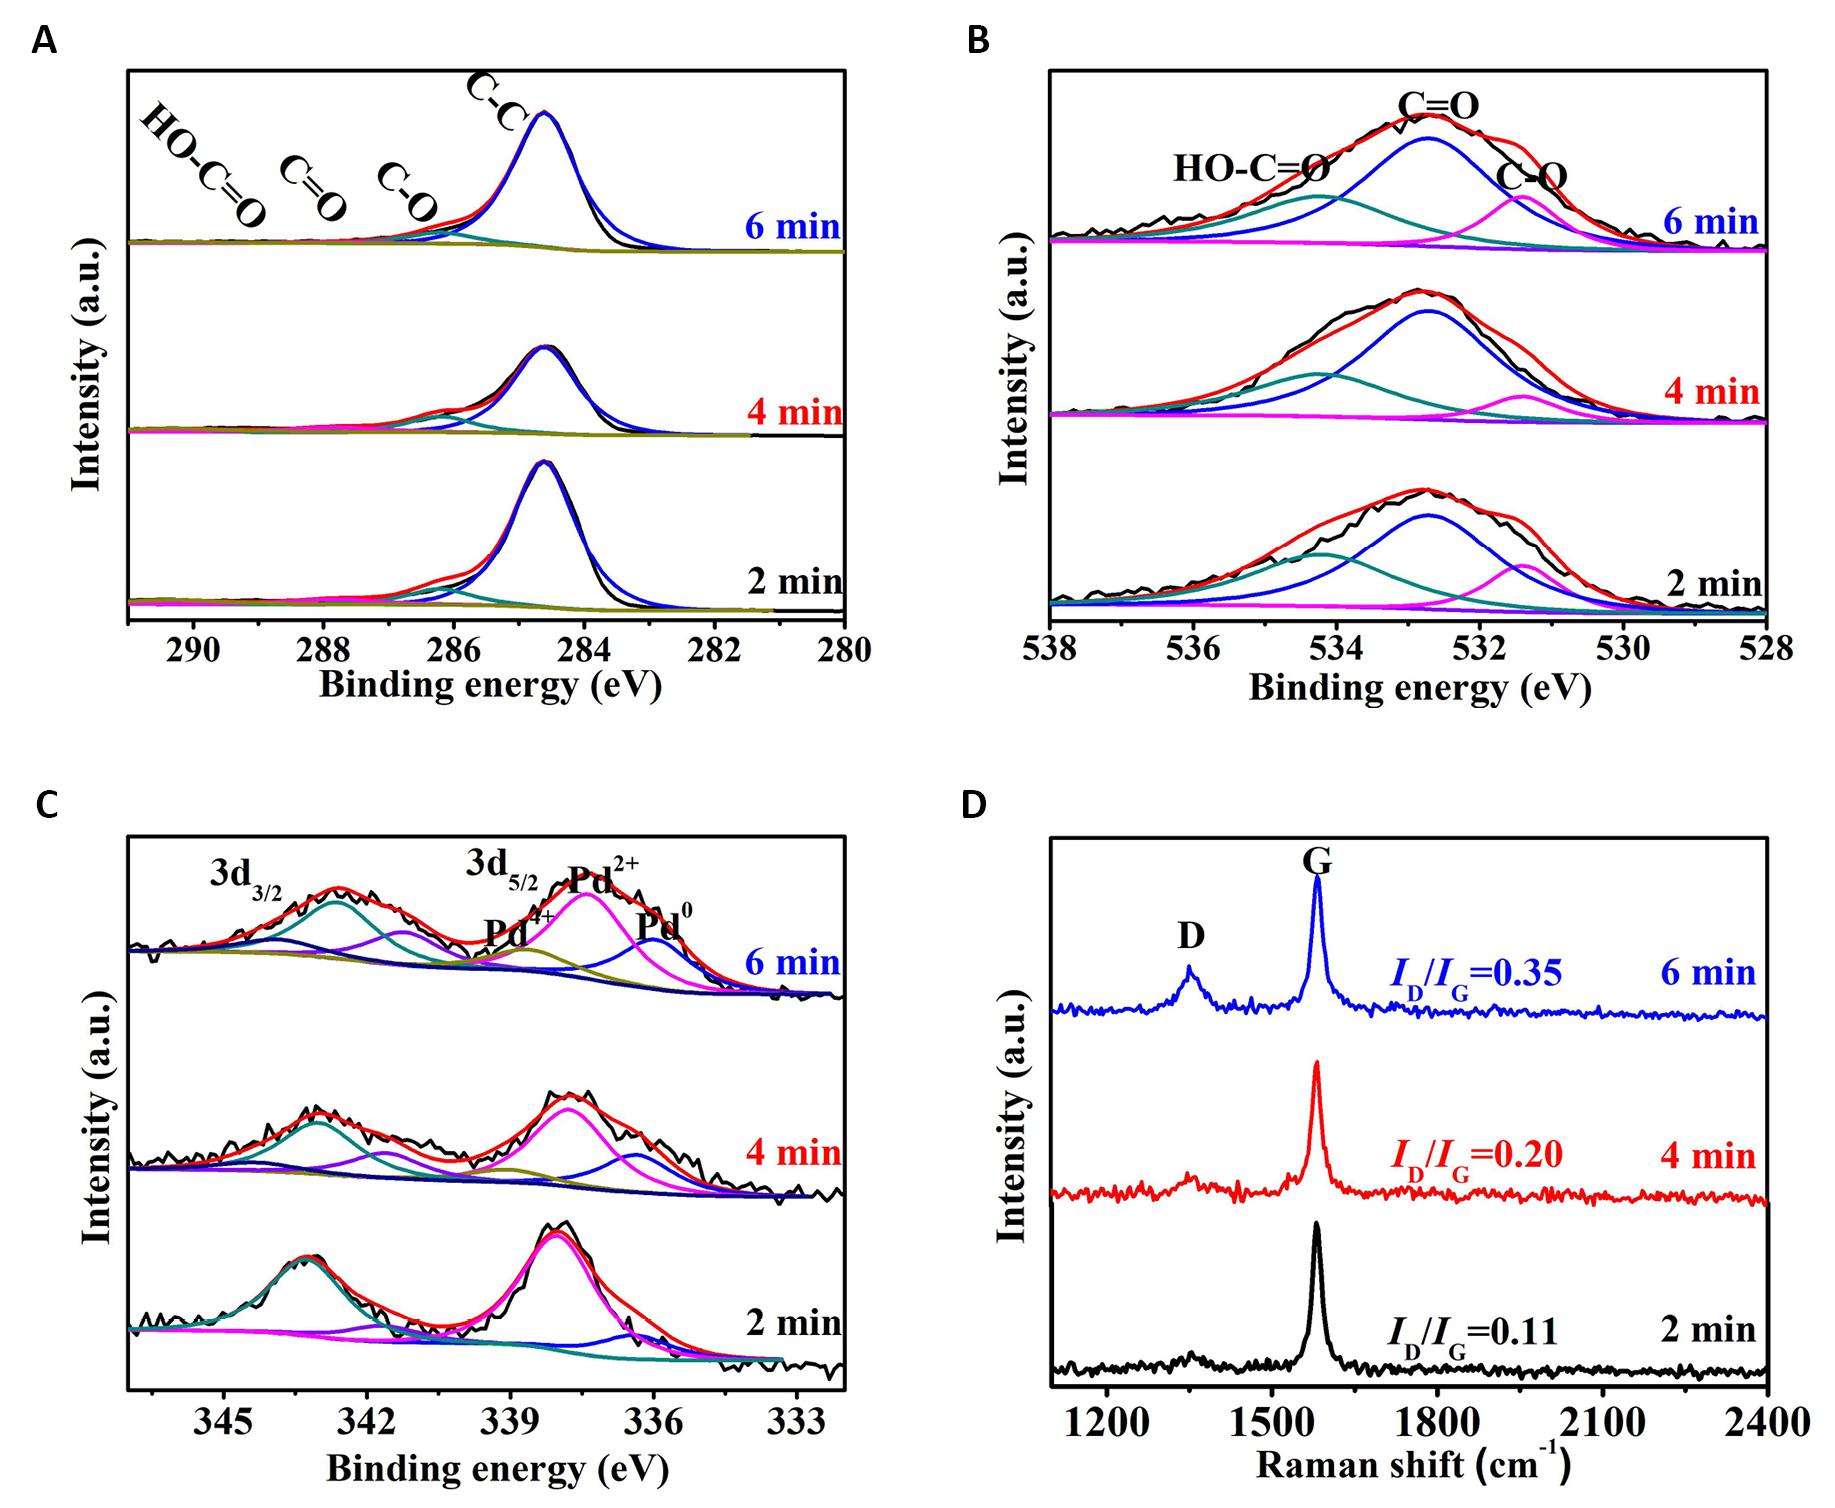
Figure 11. XPS spectra of the Pd/G-P catalysts prepared at different discharge time (td). A: C1s; B: O1s; C: Pd3d and D: the corresponding FT-Raman spectra.
Figure 11C showed the Pd3d XPS spectra of samples which can be divided into three peaks respectively, assigned to the three valence states of Pd0, Pd2+ and Pd4+. The peak of Pd4+ was not separated for the Pd/G-P prepared at td of 2min, which may be resulted from the fact that the discharge time was so short that the PdCl42- was not effectively reduced. While the peak of the Pd/G-P prepared at 6min shifted by 0.4eV toward lower binding energy, which may be due to the enhanced metal-support interaction as the discharge time increased. Accordingly, many electrons transferred from the graphene support to the periphery of Pd species, causing the increased electron cloud density. According to the peak areas obtained by fitting the Pd3d energy spectra of the Pd/G-P samples prepared at different td, the relative content of different Pd valence states on the surface of the Pd/G-P samples were obtained, as shown in Table 3. As the discharge time increased from 2 to 6min, the metallic Pd0 increased from 16.6% to 30.5%, while the Pd2+ decreased from 83.4% to 54.9%. This indicated that the increase of discharge time was in favour of the reduction of Pd ions, which was also consistent with the variation trend resulted from the increasing discharge voltage. While it should be noted that the Pd ions cannot be completely reduced into metallic Pd by increasing the Up-p or td because of the existence of plentiful oxygen-containing groups on the graphene support. Similar phenomenon was also observed by using other carbon materials as support.
Table 3. The Pd Composition and the Atomic Ratios of Pd/C and O/C in the Pd/G-P catalysts Prepared at Different Time
Time |
Pd Composition (%) |
Atomic Ratios of Pd/C |
Atomic Ratios of O/C |
||
Pd0 |
Pd2+ |
Pd4+ |
|||
2min |
16.6 |
83.4 |
- |
0.0043 |
0.0401 |
4min |
28.2 |
61.2 |
10.6 |
0.0060 |
0.0801 |
6min |
30.5 |
54.9 |
14.6 |
0.0061 |
0.0540 |
The atomic ratios of Pd/C and O/C in the Pd/G-P samples prepared at different td were obtained according to the XPS spectra of C1s, O1s, and Pd3d, and were summarized in Table 3. The atomic ratios of Pd/C in the Pd/G-P samples prepared at 2, 4 and 6min, respectively, were 0.0043, 0.0060 and 0.0061. With prolonging the discharge time, more and more negatively charged PdCl42- and reduced neutral Pd nanoparticles migrated from the layer of the support to the outer surface[12,30], which results in the increase of Pd/C atomic ratio with discharge time. However, the O/C atomic ratios of the Pd/G-P samples at discharge time of 2, 4 and 6min were 0.0401, 0.0801 and 0.0540, respectively, showing a trend of increasing firstly and decreasing later. This was induced by the reorganization of the graphene support grid and the etching of amorphous carbon with the effect of plasma. When they were exposed to air, they will react quickly with O2[31], thereby increasing the O/C atomic ratio. However, with the increase of td, the interaction time between plasma and samples are long and the unstable oxygen-containing functional groups (such as -OH, etc.) on the graphene support would be removed, thereby leading to the decrease of O/C atomic ratio. This trend was also consistent with the influence of the Up-p, as showed in Table 2.
Figure 11D showed the FT-Raman spectra of the Pd/G-P catalysts prepared at different discharge time. When the discharge time was increased from 2 to 6min, the ID/IG values of the prepared Pd/G-P increased from 0.11 to 0.35, indicating that the density of the defects was increased. This may be attributed to the fact that the high-energy active particels produced by plasma bombard graphene support consumingly and further induce the formation of defective edge carbon atoms with a suspended bond. This is favorable to the dispersion of metal NPs on the surface of GO and the adsorption of 4-NP, and thereby promoting the catalytic reduction reaction of 4-NP. Siamaki et al.[32,33] reported that structural defects in GC (GO processed to obtain chemically derived graphene) played an important role in enhancing the catalytic activity of the Pd/GC samples, which is consistent with our results obtained from Figure 11D.
The dispersion and size distribution of Pd nanoparticles in the Pd/G-P catalysts prepared at different discharge time of 2, 4 and 6min were analyzed by TEM and shown in Figure 12. It can be seen from Figure 12A that less Pd nanoparticles were observed on the surface of Pd/G-P, which may be ascribed to the short discharge time and the lower reduction degree of Pd species. Moreover, the highly dispersed Pd species do not effectively migrate to the outer surface, which also corresponded to the results of XPS and XRD in Figure 11C and Figure 10. By calculating the average particle size of Pd nanoparticles, their corresponding particle size distribution histograms were obtained and illustrated in Figure 12D-F. It can be seen that the average particlce size of Pd nanoparticles for all the samples were realtively small after plasma treatment, implying plasma treatment is favourable to the formation of small-sized Pd nanoparticle. While the discharge time was prolonged from 2 to 6min, the average particle size of Pd nanopartic less lighty increased from 2.3±0.6nm to 3.2±0.7nm, which may be related to the growth of Pd nuclei and agglomeration during the plasma trearment. On the one hand, the gradually increased discharge temperature will result in the slight agglomeration of Pd active component on the surface of graphene support with the increase of discharge time. On the other hand, the long time bombardment of active particle in plama to the support can also lead to the agglomeration and the dispersion deterioraion of Pd active components.
|
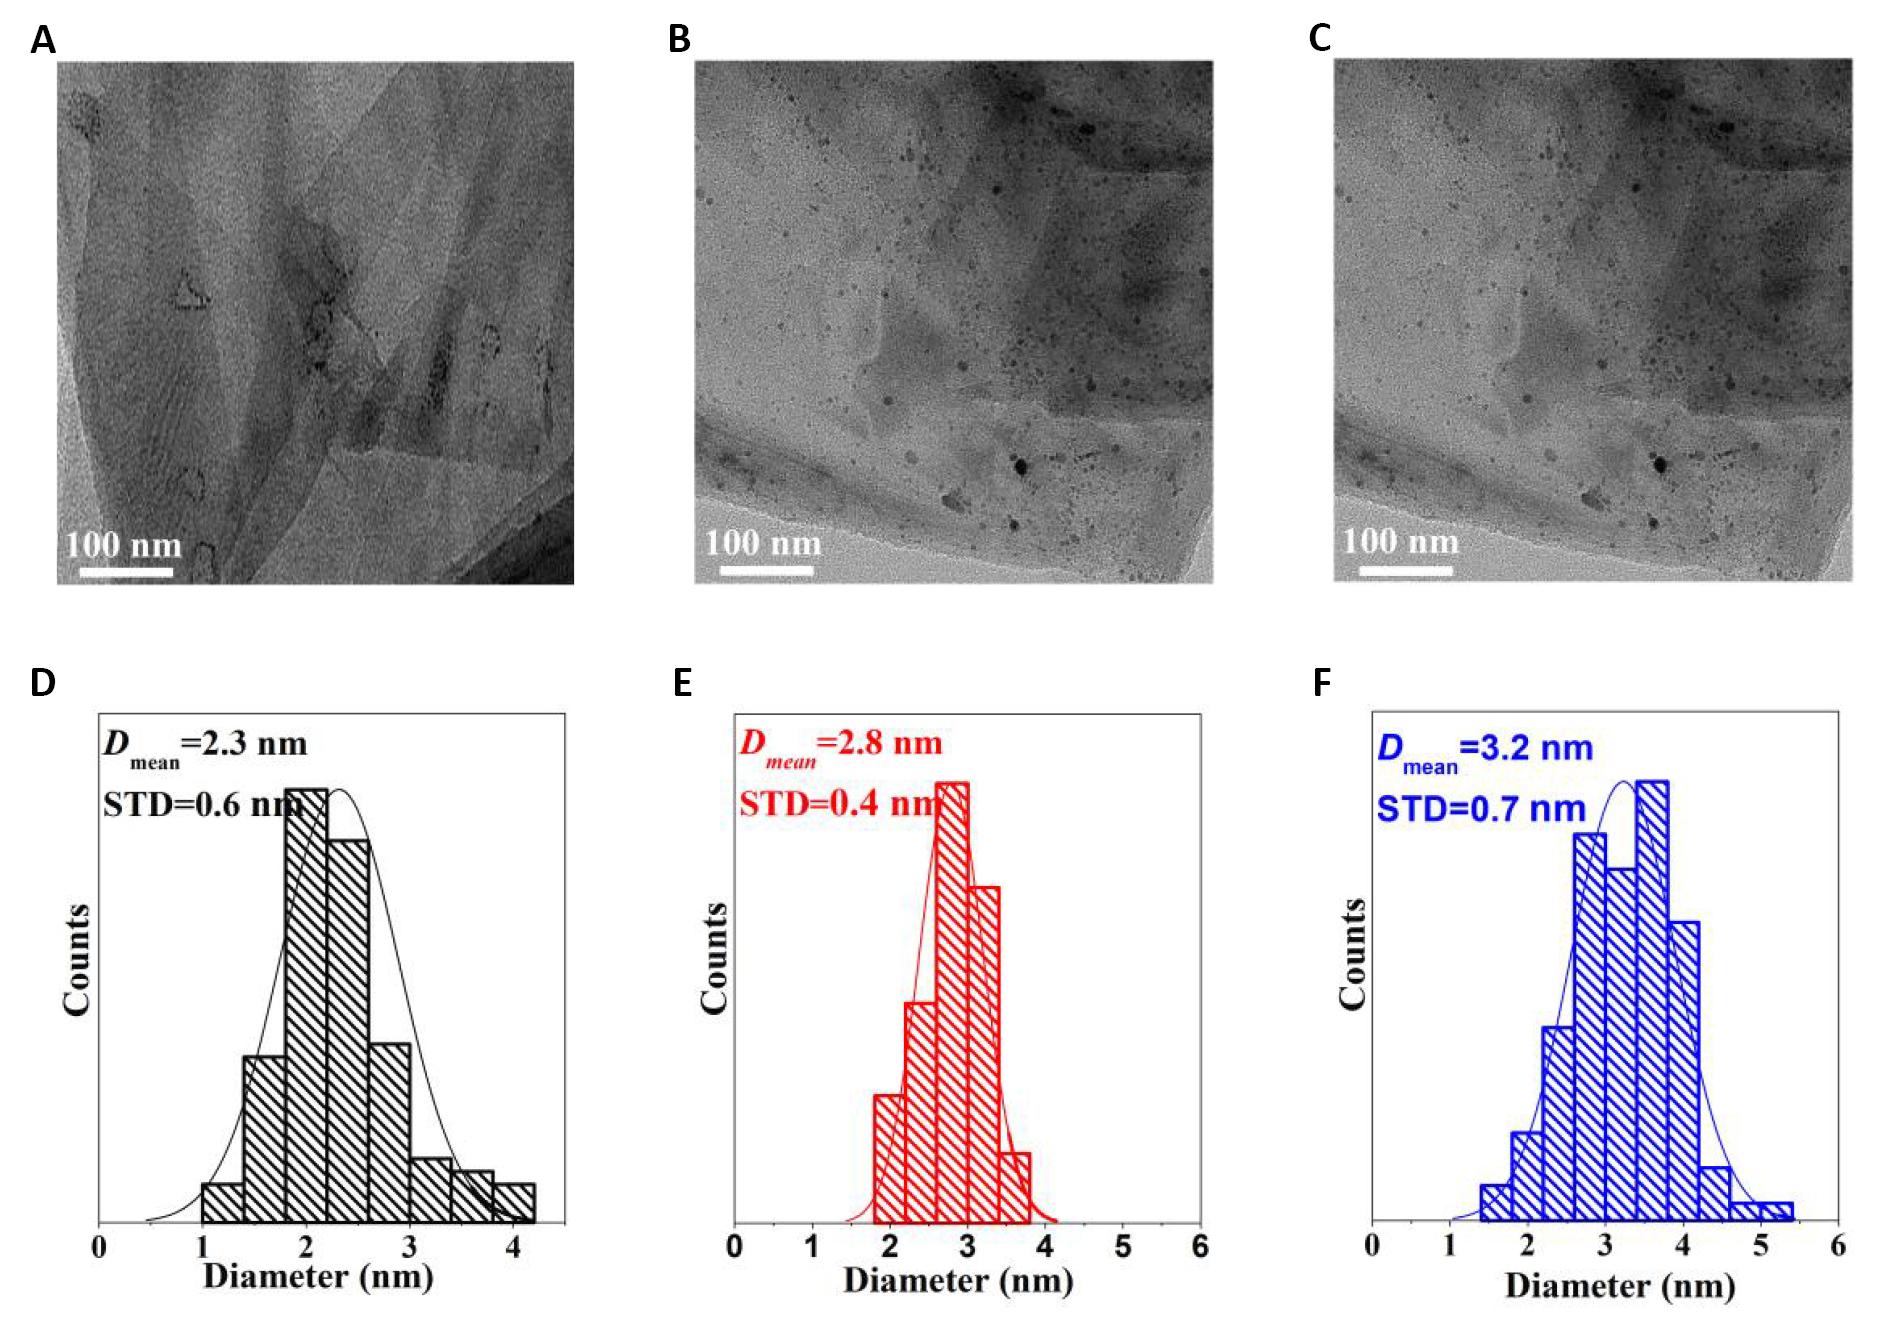
Figure 12. The typical TEM images and particle size distribution histograms of Pd/G-Pcatalysts prepared at different discharge time (td). A and D: 2min; B and E: 4min; C and F: 6min.
3.4 Calculation of Reaction Thermodynamic Parameters
In order to further study the catalytic reaction kinetics of 4-NP by Pd/G-P, the catalytic reduction activity of 4-NP at four different temperatures were conducted on basis of the optimal conditions of hydrogen cold plasma, as shown in Figure 13. As the reaction temperature increased from 10 to 40°C, the reaction time tr decreased from 328s to 162s. According to the data in Figure 13, plots of ln(At/A0) against tr were fitted and a strong linear relationship between ln(At/A0) and tr were confirmed, as shown in Figure 14A. The calculated slope of the fitted lines showed that the rate constant k at 10, 20, 30 and 40°C were 0.42, 0.53, 0.74 and 1.03min-1 respectively, indicating that the reduction of 4-NP was largely dependent on the temperature.
|
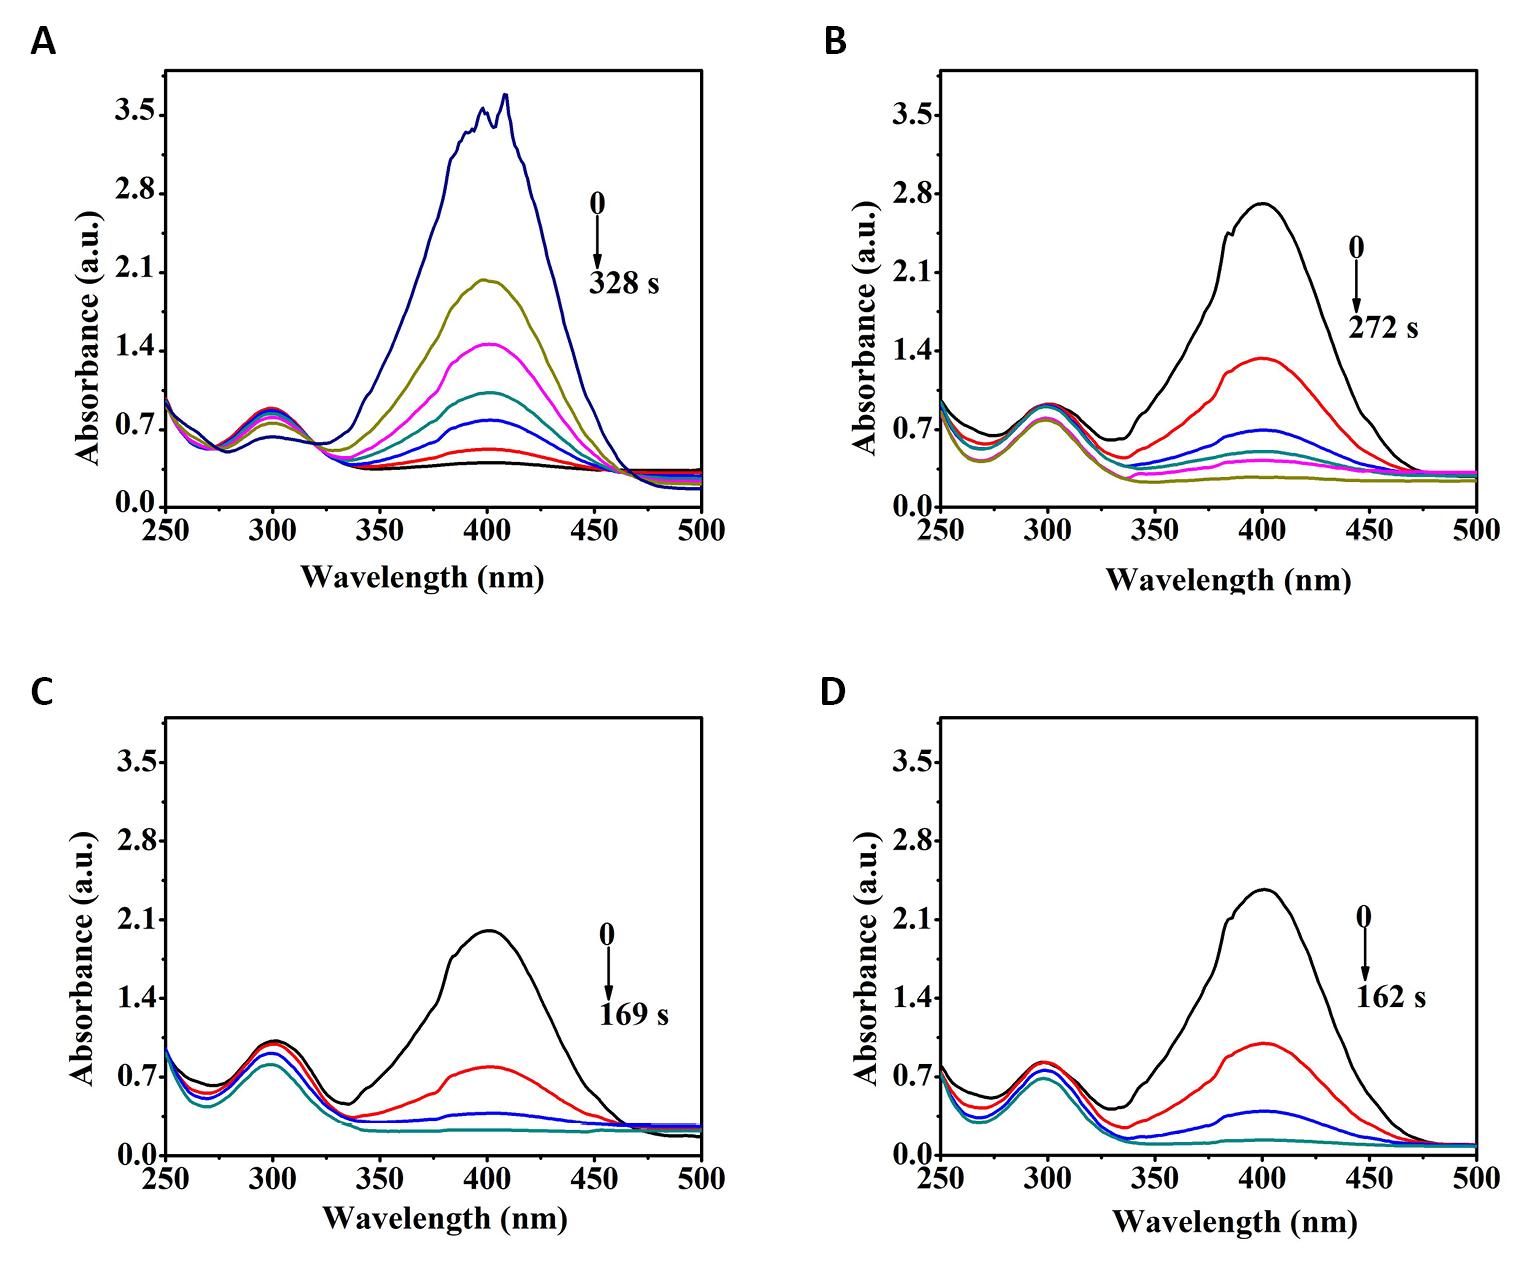
Figure 13. UV-Vis absorption spectra of the Pd/G-Pfor 4-NP reduction at the temperature of A: 10℃, B: 20℃, C: 30℃ and D: 40℃.
|
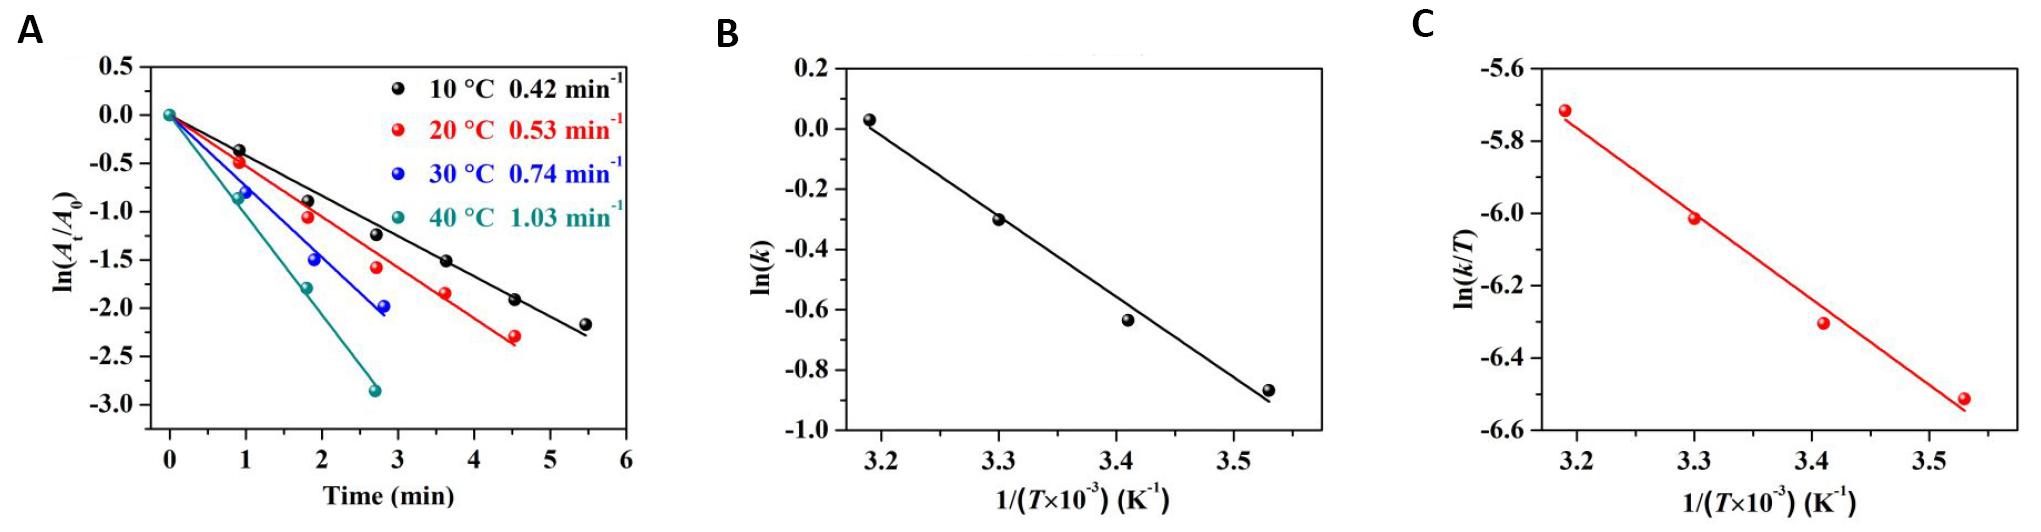
Figure 14. The fitting plots of relative thermodynamic parameters. A: The logarithm of absorbance ratio ln (At/A0) versus reaction time (tr) over Pd/G-P for 4-NP reduction at different temperatures; B: The corresponding Arrhenius plot of ln (k) versus temperature 1/T; C: The plot of ln (k/T) versus 1/T..
The plot of ln(k) versus temperature 1/T was shown in Figure 14B. The activation energy Ea of the Pd/G-P reaction was caculated as 22.2kJ·mol-1 using the Arrhenius equation [Equation (3)]. The relatively low Ea value indicated that the preparation of Pd/G-P by plasma can effectively improve the catalytic reaction rate as the range of general activation energy is 10.0 to 50.0kJ·mol-1 .
|
The plot ln(k/T) versus temperature 1/T was shown in Figure 14C. The change of ΔS value is related to the motion of adsorbed molecules. According to the Eyring equation [Equation (4)], ΔH and ΔS were calculated as 19.7kJ·mol-1 and -182.6J·mol-1·K-1 respectively. In this work, ΔS was as low as -182.6J·mol-1·K-1. Thus we inferred that the water molecules on the surface of the graphene support are replaced by phenol derivatives with higher adsorption properties, so that Pd/G-P has excellent adsorption properties for 4-NP reduction[34].
|
|
|
In terms of Gibbs free energy equation [Equation (5)], the ΔG can be caculated and it increased from 71.4 kJ·mol-1 to 76.9kJ·mol-1 as the reaction temperature increased from 10 to 40℃ respectively. The positive valuse of ΔG and ΔH indicated that the catalytic reduction of 4-NP by Pd/G-P was an endothermic process, and the higher the temperature, the faster the reaction.
4 CONCLUSION
In this work, the research on the preparation of graphene-supported palladium catalytic catalysts (Pd/G-P) hydrogen cold plasma, the effects of discharge voltage and discharge time on the structure of Pd/G-P and their performance for catalytic reduction of 4-NP were systematically investigated. The optimal preparation discharge voltage and discharge time were 13.0kV and 4min respectively. The Pd/G-P exhibited the highest performance for catalytic reduction of 4-NP into 4-AP with a rate constant (k) of as high as 0.88min-1. The Pd/C, O/C atomic ratios and graphene surface defects were the highest on the sample at appropriate discharge voltage and discharge time. These enabled the formation of palladium nanoparticles with small size and high dispersion on the outer surface of graphene, thereby enhancing the catalytic activity. Excessive discharge voltage and discharge time will destroy oxygen-containing functional groups on the surface of graphene, resulting in larger particle size of palladium and poor catalytic activity. The experimental study of reaction kinetics showed that plasma synthesized Pd/G-P at optimal parameters can adsorb intermediate reactants more effectively and enhance the catalytic performance. This research work has important reference value for the preparation of high-performance graphene-supported metal catalytic materials by plasma control.
Acknowledgements
This work is supported by the National Natural Science Foundation of China (Grant No. 52077024, 21773020, 21673026), Xingliao Talents Program (Grant No. 2022RJ16), the State Key Laboratory of Structural Analysis for Industrial Equipment at Dalian University of Technology (Grant No. GZ21105), the Yunnan Police College (YJKF003) and the Youth Fund Project supported by the Education Department of Liaoning Province (No. LJKQZ20222434).
Conflicts of Interest
The authors declared no conflict of interest.
Author Contribution
Hua Y was responsible for project administration and funding acquisition. Zhao L handled visualization and the original draft of the writing. Zhao L and Zhao Q were in charge of conceptualization, methodology investigation, and formal analysis. Zhao L, Zhao Q, Zhang X, Xia G and Di L participated in the review and editing process. All authors contributed to the manuscript and approved the final version.
Abbreviation List
DBD, Dielectric barrier discharge
GO, Graphite oxide
Pd/G, Graphene-supported palladium catalyst
Pd/G-P, Graphene-supported palladium catalyst treated by plasma
TEM, Transmission electron microscopy
XRD, X-ray diffraction
XPS, X-ray photoelectron spectroscopy
4-AP, P-aminophenol
4-NP, 4-nitrophenol
References
[1] Liu T, Sun Y, Jiang B et al. Pd Nanoparticle-Decorated 3D-printed hierarchically porous TiO2 scaffolds for the efficient reduction of a highly concentrated 4-nitrophenol solution. ACS Appl Mater Inter, 2020; 12: 28100-28109.[DOI]
[2] Lee HG, Sai-Anand G, Komathi S et al. Efficient visible-light-driven photocatalytic degradation of nitrophenol by using graphene-encapsulated TiO2 nanowires. J Hazard Mater, 2015; 283: 400-409.[DOI]
[3] Vilian ATE, Choe SR, Giribabu K et al. Pd nanospheres decorated reduced graphene oxide with multi-functions: Highly efficient catalytic reduction and ultrasensitive sensing of hazardous 4-nitrophenol pollutant. J Hazard Mater, 2017; 333: 54-62.[DOI]
[4] Sun J, Fu Y, He G et al. Catalytic hydrogenation of nitrophenols and nitrotoluenes over a palladium/graphene nanocomposite. Catal Sci Technol, 2014; 4: 1742-1748.[DOI]
[5] Liu T, Cui Z, Liu Y et al. In-situ fabrication of ultrafine Pd supported on nitrogen-doped reduced graphene oxide via nitrogen glow discharge plasma for catalytic reduction of 4-Nitrophenol. App Catal A Gen, 2019; 588: 117278.[DOI]
[6] Nasrollahzadeh M, Jaleh B, Baran T et al. Efficient degradation of environmental contaminants using Pd-RGO nanocomposite as a retrievable catalyst. Clean Techno Envir, 2019; 22: 325-335.[DOI]
[7] Revathy TA, Dhanavel S, Sivaranjani T et al. Highly active graphene-supported palladium-nickel alloy nanoparticles for catalytic reduction of 4-nitrophenol. Appl Surf Sci, 2018; 449: 764-771.[DOI]
[8] Tran TN, Nguyen TL, Nguyen HTD et al. One-pot, green and surfactant-less synthesis of polyhedral PdNPs anchored on GO as superior catalyst for reduction of 4-nitrophenol. Synthetic Met, 2021; 282: 116957.[DOI]
[9] Dong W, Cheng S, Feng C et al. Fabrication of highly dispersed Pd nanoparticles supported on reduced graphene oxide for catalytic reduction of 4-nitrophenol. Catal Commun, 2017; 90: 70-74.[DOI]
[10] Wang Y, Yu F, Zhu M et al. N-doping of plasma exfoliated graphene oxide via dielectric barrier discharge plasma treatment for oxygen reduction reaction. J Mater Chem A, 2018; 6: 2011-2017.[DOI]
[11] Zhou Q, Zhao Z, Chen Y et al. Low temperature plasma-mediated synthesis of graphene nanosheets for supercapacitor electrodes. J Mater Chem, 2012; 22: 6061.[DOI]
[12] Di L, Zhang J, Zhang X et al. Cold plasma treatment of catalytic materials: a review. J Phys D Appl Phys, 2021; 54: 333001.[DOI]
[13] Peng X, Wang Z, Wang Z et al. Electron reduction for the preparation of rGO with high electrochemical activity. Catal Today, 2019; 337: 63-68.[DOI]
[14] Zhang J, Wang H, Zhao Q et al. Facile synthesis of PdAu/C by cold plasma for efficient dehydrogenation of formic acid. Int J Hydrogen Energ, 2020; 45: 9624-9634.[DOI]
[15] Wang H, Zhou Y, Zhao Q et al. NH3 plasma synthesis of N-doped activated carbon supported Pd catalysts with high catalytic activity and stability for HCOOH dehydrogenation. Int J Hydrogen Energ, 2020; 45: 21380-21391.[DOI]
[16] Zhao Q, Bu D, Li Z et al. Cold plasma preparation of Pd/Graphene catalyst for reduction of p-nitrophenol. Nanomaterials-Basel, 2021; 11: 1341.[DOI]
[17] Arrigo R, Schuster M, Xie Z et al. Nature of the N–Pd Interaction in nitrogen-doped carbon nanotube catalysts. ACS Catal, 2015; 5: 2740-2753.[DOI]
[18] Deng Q, Xin J, Ma S et al. Hydrogen production from the decomposition of formic acid over carbon nitride-supported AgPd alloy nanoparticles. Energy Ger, 2018; 6: 2374-2379.[DOI]
[19] Zacharska M, Bulusheva LG, Lisitsyn AS et al. Factors influencing the performance of Pd/C catalysts in the green production of hydrogen from formic acid. ChemSusChem, 2017; 10: 720-730.[DOI]
[20] Liu J, Yan X, Wang L et al. Three-dimensional nitrogen-doped graphene foam as metal-free catalyst for the hydrogenation reduction of p-nitrophenol. J Colloid Interf Sci, 2017; 497: 102-107.[DOI]
[21] Sheng Z, Shao L, Chen J et al. Catalyst-free synthesis of nitrogen-doped graphenevia thermal annealing graphite oxide with melamine and its excellent electrocatalysis. ACS Nano, 2011; 5: 4350-4358.[DOI]
[22] Aguilar-Bolados H, Yazdani-Pedram M, Quinteros-Jara E et al. Synthesis of sustainable, lightweight and electrically conductive polymer brushes grafted multi-layer graphene oxide. Polym Test, 2021; 93: 106986.[DOI]
[23] Zhang J, Jiang Y, Zhang J et al. Preparation of Pd/GO/ITO composite electrode and degradation of 2,4-chlorophene. J Mater Sci, 2019; 55: 1525-1535.[DOI]
[24] Li Y, Yu Y, Wang J et al. CO oxidation over graphene supported palladium catalyst. Appl Catal B Environ, 2012; 125: 189-196.[DOI]
[25] Wang C, Yang F, Yang W et al. PdO nanoparticles enhancing the catalytic activity of Pd/carbon nanotubes for 4-nitrophenol reduction. RSC Adv, 2015; 5: 27526-27532.[DOI]
[26] Zhao J, Wang B, Yue Y et al. Towards a greener approach for the preparation of highly active gold/carbon catalyst for the hydrochlorination of ethyne. J Catal, 2018; 365: 153-162.[DOI]
[27] Yang J, Tian C, Wang L et al. An effective strategy for small-sized and highly-dispersed palladium nanoparticles supported on graphene with excellent performance for formic acid oxidation. J Mater Chem, 2011; 21: 3384.[DOI]
[28] Zhao Y, Yang X, Tian J et al. Methanol electro-oxidation on Ni@Pd core-shell nanoparticles supported on multi-walled carbon nanotubes in alkaline media. Int J Hydrogen Energ, 2010; 35: 3249-3257.[DOI]
[29] Zhuo H, Zhang X, Liang J et al. Theoretical understandings of graphene-based metal single-atom catalysts: stability and catalytic performance. Chem Rev, 2020; 120: 12315-12341.[DOI]
[30] Di L, Zhang J, Zhang X. A review on the recent progress, challenges, and perspectives of atmospheric-pressure cold plasma for preparation of supported metal catalysts. Plasma Process Polym, 2018; 15: 1700234.[DOI]
[31] Ding D, Song Z, Cheng Z et al. Plasma-assisted nitrogen doping of graphene-encapsulated Pt nanocrystals as efficient fuel cell catalysts. J Mater Chem A, 2014; 2: 472-477.[DOI]
[32] Siamaki AR, Khder AERS, Abdelsayed V et al. Microwave-assisted synthesis of palladium nanoparticles supported on graphene: A highly active and recyclable catalyst for carbon-carbon cross-coupling reactions. J Catal, 2011; 279: 1-11.[DOI]
[33] Wu G, Wang X, Guan N et al. Palladium on graphene as efficient catalyst for solvent-free aerobic oxidation of aromatic alcohols: Role of graphene support. Appl Catal B- Environ, 2013; 136: 177-185.[DOI]
[34] Bogireddy NKR, Sahare P, Pal U et al. Platinum nanoparticle-assembled porous biogenic silica 3D hybrid structures with outstanding 4-nitrophenol degradation performance. Chem Eng J, 2020; 388: 124237.[DOI]
Copyright © 2023 The Author(s). This open-access article is licensed under a Creative Commons Attribution 4.0 International License (https://creativecommons.org/licenses/by/4.0), which permits unrestricted use, sharing, adaptation, distribution, and reproduction in any medium, provided the original work is properly cited.


