Numerical Investigation of a Helium Plasma Jet Impinging on Substrates: Effects of Relative Permittivity and Surface Morphology
Baowei Zhou1, Yunxiang Luo1, He Cheng3, Qingnan Xu2, Shuqun Wu1*
1College of Automation Engineering, Nanjing University of Aeronautics and Astronautics, Nanjing, China
2Key Laboratory of Materials Modification by Laser, Ion, and Electron Beams, Dalian University of Technology, Dalian, China
3School of Chemistry and Chemical Engineering, Nanjing University of Science and Technology, Nanjing, China
*Correspondence to: Shuqun Wu, PhD, Professor, College of Automation Engineering, Nanjing University of Aeronautics and Astronautics, Wenyuan Road, Baixia District, Nanjing 210094, Jiangsu Province, China; Email: wushuqun@nuaa.edu.cn
Abstract
Objective: Atmospheric pressure plasma jet is one of the promising plasma sources for biomedical applications. This work provides insight into the plasma dynamics near the substrate surface during the plasma treatment.
Methods: Two-dimensional modeling of a helium plasma jet impinging on substrates with different relative permittivity and surface morphology is implemented.
Results: When the tip of the plasma jet touches the substrate surface, there is a strong electric field and a high density of surface charge on the surface. The higher the substrate’s relative permittivity, the higher density of electrons and excited states near the surface are obtained, and the smaller area of the plasma on the surface is observed. For the wavy surface of the substrate, a surface ionization wave slowly propagating along the protrusions of the substrate is observed. It propagates along the protrusions (rather than the concaves), resulting in no plasma being generated directly inside the concaves. Detailed analysis shows that because the height and width of the concaves are smaller than the thickness of the plasma sheath, the narrow space of the concaves probably restricts the direct production of plasma inside it.
Conclusion: The increase of substrate permittivity is beneficial to the production of electrons and chemical species but limits the radial propagation of the plasma along the surface. To generate the plasma directly inside the narrow concaves for the uneven surface of the substrate, the electron density or the width of the concaves should increase.
Keywords: plasma jets, substrates, plasma medicine, relative permittivity, surface morphology
1 INTRODUCTION
Atmospheric pressure plasma jets (APPJs) have received significant attention due to their promising application in plasma medicine, such as sterilization[1-4], root canal[5], wound healing[6-8], and cancer therapy[9-12]. APPJs excited by ac or pulsed power supply operated in several kHz are usually ignited inside dielectric tubes with noble gas fed in and propagating along the noble gas column into the ambient air[13]. The plasma plume is generated in the open air rather than in a limited space. High-speed imaging technique reveals that the plasma plume travels as a series of discrete plasma volumes (one or several plasma bullets) at a speed of 104-105m/s, similar to the propagation of guided streamers[14]. It allows delivering a bunch of active species (such as charges, OH radical, O, NO, and O3) to the surface of samples directly with the uneven surface, resulting in effective plasma treatment of the samples with complex three-dimensional structures. It strongly enhances the applicability of plasma medicine to human beings[15-17].
The interaction between the plasma jet and the substrate (samples) is an essential process for the applications of plasma medicine, which largely determines the efficiency of the plasma treatment. Experimental and numerical investigations have been implemented to understand the discharge mechanisms of the interaction between them. Using two-dimensional numerical modeling, Viegas and Bourdon[18] investigated the interaction between the He/O2 plasma jet and substrates. It is found that the electric field distribution and the accumulation of the charges on the surface of the substrate greatly depend on the dielectric constant and the thickness of the substrate. Abuzairi et al.[19] experimentally studied the plasma dynamics when the plasma jet is impinging on a substrate. They found that the plasma jet propagates along the surface of the substrate after it contacts the substrate. The smaller the relative permittivity of the substrate is, the further away the plasma jet reaches. When the pulse width of the applied voltage increases, Johnson et al.[20] bserved the third discharge during the interaction between the plasma jet and the metal substrate, which may be due to Penning ionization. As a wavy substrate replaces the substrate, Ning et al.[21] reported the numerical modeling of the treatment of wavy substrate structure with helium plasma jet at different N2 concentrations. They found that a homogenous discharge could be obtained for the pulse voltage with negative polarity. On the other hand, not only physical mechanism of the interaction between the plasma jet and the substrate is concerned, but also the distributions of the active species near the surface of the substrate are of great interest for biomedical applications. Yamada et al.[22] observed a rapid increase in the emission intensity of the plasma plume when the plasma jet contacted a conductive substrate. Urabe et al.[23] measured the spatial-temporal distributions of the densities of metastable helium atoms and nitrogen ions by laser spectroscopic measurements. It found that the nitrogen ions near the surface of the substrate are mainly produced by direct electron-impact collisional ionization, instead of Penning ionization. Yonemori and Ono[24] discovered that the maximum density of OH was located at the center of the plasma disk on the substrate, while the maximum density of O atoms was offset from the center. Yue et al.[25] conducted a comparative study on the distributions of the O and OH radicals in APPJs for glass, water, and metal substrates. They found that the intensity of the O and OH radicals measured by laser-induced fluorescence (LIF) is much lower for the glass substrate. Cheng et al.[26] numerically investigated the interaction between the air streamer and the biofilms. It showed that the strong electric field and the high flux of RONS generated by the streamer discharge should be responsible for the killing of biofilms.
Based on the previous works, the characteristics of the substrate play an essential role in the plasma dynamics and the generation of chemical species during the interaction between the plasma jet and the substrate. Therefore, a detailed study of the physicochemical during plasma dynamics when the jet impinges on the substrate is required to understand this process better. In this work, two-dimensional modeling of a helium plasma jet impinging on substrates is established to characterize the plasma dynamics close to or on the surface of the substrate. The effects of the relative permittivity and the surface morphology of the substrate on the plasma dynamics and the distributions of active species near the surface are investigated.
2 MATERIALS AND METHODS
The simulation configuration of the plasma jet in a 2D axisymmetric model is shown in Figure 1A. A high-voltage needle electrode is inserted into the medium tube filled with helium. The flow rate of the helium gas is 1.5L/min. The substrate is placed at a vertical distance of 10mm away from the exit of the dielectric tube. The dielectric tube's inner radius and thickness are 0.75mm and 8.25mm. The length of the dielectric tube is 12mm. The relative permittivity of the dielectric tube is 4.3. The thickness of the substrate is 0.5mm. The radius of the pin electrode is about 0.25mm. The waveform of the applied voltage is presented in Figure 1B. The amplitude of the pulse is 4.3kV, and its rising time and pulse width are 50ns and 1μs, respectively. In order to enhance convergence, the right boundary and the upper boundary of the calculation area are set to zero potential (grounded). It is worth noting that the Laplace electric field inside the tube remains unchanged even if the radial length of the calculation zone increases up to 15mm.
|

Figure 1. The simulation model of the plasma jet impinging on substrate with different permittivity. A: The configuration of the plasma model; B: The applied voltage waveform.
Regarding the initial conditions of the excited species, the initial density of the excited species is 102cm-3, which is considered to be generated by natural radiation photoionization. The excited species are quenched to the ground state when they arrive at the inner wall of the dielectric tube. The secondary electron emission coefficient of the tube wall is 0.01, which roughly includes the contribution of the photoemission, secondary emission of electrons by the impact of metastable molecules, and field emission[27]. According to the experimental results and numerical modelling of the plasma jets in previous works[28,29], due to the high background electron density accumulated from previous repetitive discharge, the photoionization plays a minor role in the propagation of the He plasma plume operated with several to tens of kHz repetitive frequency. Therefore, referring to the previous works[30-32], a pre-ionization level with the electron density of 1011m-3 is assumed before the ignition of the plasma jet in this work, and helium photoionization is not taken into account in the model.
The plasma governing equations include the continuity equation, the drift-diffusion equation, the energy conservation equation, and Poisson’s equation, which are presented as follows.
|
|
|
|
|
|
|
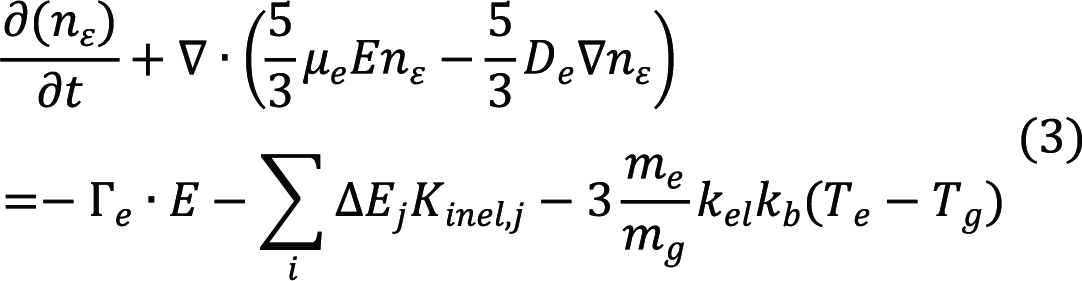
The i, e, and g are the number of species, electrons, and background gas. n is the number density. E is the electric field strength, and represents the flux of charges or neutral species. and q represent the electric potential and the charges, respectively. and D are the species’ drift mobility and diffusion coefficient, respectively. =1.5kBTe is the average electron energy. Rij represents the reaction rate of the jth reaction. kb is Boltzmann Constant. ∆E and Kinel are the energy loss and the reaction rate during an inelastic collision, respectively. Kel is the reaction rate of elastic collision. εr and ε0 are the medium’s relative permittivity and the vacuum relative permittivity, respectively. σsδs represents the accumulated charge density deposited on the surface of the wall.
The boundary conditions of the plasma model are presented in Table 1, where the number of 1-5 corresponds to the boundaries in Figure 1A. The boundary conditions for the flux of particles and the electron energy density are given by,
|
|
|
|
|
|
|
The net charge density accumulated on the dielectric surface (σS) was calculated by Gauss’s law.
|
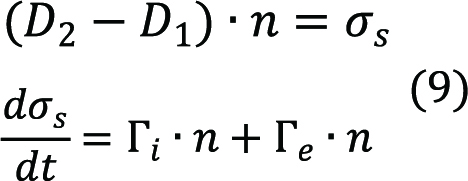
Table 1. The Boundary Conditions of the Particle Number Density and the Electric Potential
|
1 |
2 |
3 |
4 |
5 |
ne |
|
Equation (5) |
Equation (5) |
|
Equation (5) |
ni |
|
Equation (6) |
Equation (6) |
|
Equation (6) |
nm |
|
Equation (7) |
Equation (7) |
|
Equation (7) |
nε |
|
Equation (8) |
Equation (8) |
|
Equation (8) |
Φ |
|
0 |
Equation (9) |
|
V |
Notes: r is the radial direction; z is the axial direction.
The e, i, and m denote electrons, positive ions, and metastable particles. n represents the normal vector of the substrate surface, γ is the secondary electron emission coefficient, Ti is the ion temperature, and Tg is the gas temperature, respectively. αs and α’s are switching function that takes the value of 0 or 1, which depend on the direction of the electric field and the n vector.
As shown in Table 2, regarding the plasma chemistry in the plasma model, 15species (e, He, He*, He+, He2*, He2+, N2, N2+, N2*(excited states), O2, O2*(excited states), O2+, O, O(1D), O2-) and 41 reactions are taken into account. The reaction rates of the direct collisions between electrons and atoms or molecules are calculated by BOLSIG+[33], and the others are referred to References 30 and 34[30-34]. The Penning ionization of N2 by He metastable is taken into account. Reaction rates are presented in the form of Arrhenius expression ![]() .
.
Table 2. Helium-air Chemical Reactions Used in the Plasma Model
Number |
Reaction |
Reaction Rate Coefficient |
||
A |
B |
C |
||
R1 |
e + He e + He |
BOLSIG+ |
|
|
R2 |
e + He e + He* |
BOLSIG+ |
|
|
R3 |
e + He 2e + He+ |
BOLSIG+ |
|
|
R4 |
e + He* 2e + He+ |
4.661e-16 |
0.6 |
4.78 |
R5 |
e + He2* 2e + He2+ |
1.268e-18 |
0.71 |
3.4 |
R6 |
2He* e +He+ He+ |
4.5e-16 |
0 |
0 |
R7 |
e+ He2+ He+ He* |
5.386e-13 |
-0.5 |
0 |
R8 |
He*+ N2 e + N2+ + He |
7.0e-17 |
0 |
0 |
R9 |
He2*+ N2 e + N2+ + 2He |
7.0e-17 |
0 |
0 |
R10 |
He+ + N2 N2+ + He |
5.0e-16 |
0 |
0 |
R11 |
He2+ + N2 N2+ + 2He |
5.0e-16 |
0 |
0 |
R12 |
He* + 2He He + He2* |
1.3e-45 |
0 |
0 |
R13 |
He+ + 2He He + He2+ |
1.0e-43 |
0 |
0 |
R14 |
e + He+ He* |
6.76e-19 |
-0.5 |
0 |
R15 |
2e + He+ e + He* |
6.186e-39 |
-4.4 |
0 |
R16 |
e + He+ + He He* + He |
6.66e-42 |
-2 |
0 |
R17 |
2e + He2+ e + He2* |
2.8e-32 |
0 |
0 |
R18 |
e + He2+ + He He* + 2He |
3.5e-39 |
0 |
0 |
R19 |
e + He2+ + He He2* + He |
1.5e-39 |
0 |
0 |
R20 |
2e + He2+ He* + He + e |
2.8e-32 |
0 |
0 |
R21 |
e + N2 e + N2 |
BOLSIG+ |
0 |
|
R22 |
e + N2 e + N2(VIB v1) |
BOLSIG+ |
0.2889 |
|
R23 |
e + N2 e + N2(VIB 3v1) |
BOLSIG+ |
0.8559 |
|
R24 |
e + N2 e + N2(VIB 4v1) |
BOLSIG+ |
1.134 |
|
R25 |
e + N2 e + N2(VIB 5v1) |
BOLSIG+ |
1.409 |
|
R26 |
e + N2 2e + N2+ |
BOLSIG+ |
15.6 |
|
R27 |
e + O2 e + O2(VIB 3v1) |
BOLSIG+ |
0.57 |
|
R28 |
e + O2 e + O2(VIB 4v1) |
BOLSIG+ |
0.772 |
|
R29 |
e + O2 e + O2(A1) |
BOLSIG+ |
0.977 |
|
R30 |
e + O2(A1) e + O2 |
BOLSIG+ |
-0.977 |
|
R31 |
e + O2 e + O2(B1) |
BOLSIG+ |
1.627 |
|
R32 |
e + O2(B1) e + O2 |
BOLSIG+ |
-1.627 |
|
R33 |
e + O2 e + O2(EXC) |
BOLSIG+ |
4.5 |
|
R34 |
e + O2(EXC) e + O2 |
BOLSIG+ |
-4.5 |
|
R35 |
e + O2 e + 2O |
BOLSIG+ |
5.58 |
|
R36 |
e + O2 e + O + O(1D) |
BOLSIG+ |
8.4 |
|
R37 |
e + O2 2e + O2+ |
BOLSIG+ |
12.06 |
|
R38 |
2e + N2+ e + N2 |
3.165e-30 |
-0.8 |
0 |
R39 |
e + N2+ + N2 2N2 |
4.184e-44 |
-2.5 |
0 |
R40 |
e + 2O2 O2- + O2 |
5.17e-43 |
-1 |
0 |
R41 |
O2- + O2+ 2O2 |
2.0e-13 |
0 |
0 |
Notes: The units of reaction rates are m3/s for two-body reactions and m6/s for three-body reactions.
The Plasma Module in COMSOL Multiphysics software is applied to solve the abovementioned equations[35]. In order to ensure the correctness and accuracy of the solution, we use finite triangular elements to divide the mesh. The region of helium discharge is divided with finer grids where the maximum value of the mesh size is 0.022mm. The computation domain of the plasma model is divided into 211339 elements total with 1814016 degrees of freedom. The parallel sparse direct solver is chosen for its excellent robustness. The maximum time step is automatically set at 2×10⁻⁹s.
3 RESULTS
3.1 Model Validation
A high-speed ICCD camera with an exposure time of 5ns is used to capture the dynamics of the propagation of the plasma plume. The amplitude of the voltage is 4.3kV. The pulse width is 1µs. The rising time and fall time of the pulse voltage is 50ns. The helium gas flow rate of He is 1.5L/min. Figure 2A shows the dynamics of the plasma jet when it contacts the substrate. After the head of the plasma plume reaches the substrate at 345ns, it spreads along the substrate surface, and the intensity of the plasma channel left behind decreases significantly. Since the ionization rate is one of the essential parameters to indicate the propagation of the plasma plume, the time-varying distribution of the ionization rate is shown in Figure 2B. The maximum ionization rate reaches 3×10¹¹m3/(s×mol). It clearly shows that, as the time increases from 340ns to 500ns, the plasma also spreads along the surface of the substrate, and the ionization rate in the plasma channel left behind decreases significantly, which indicates that the ionization wave propagates along the substrate surface. It is well agreed with the experimental results of the plasma dynamics in Figure 2A, which enhance the validation of the plasma model.
|
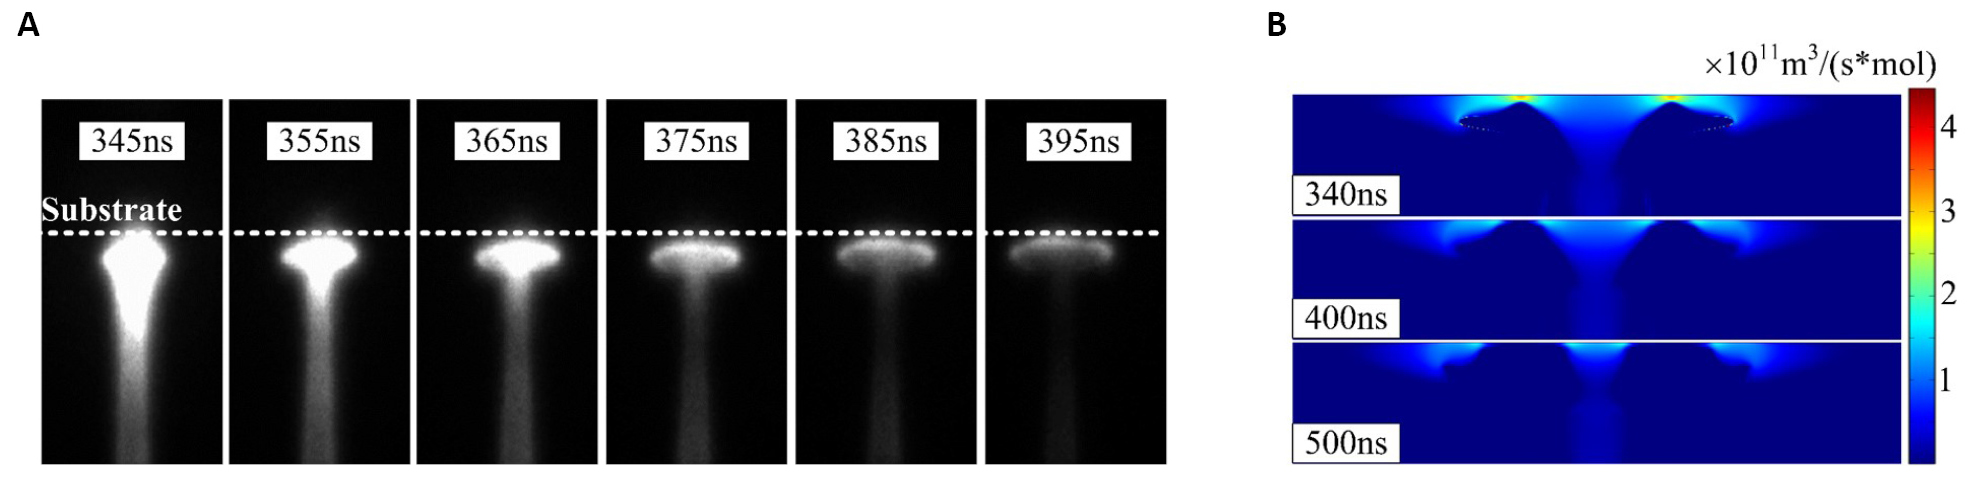
Figure 2. The dynamics of the plasma jet impinging on the substrate. A: The high-speed ICCD images of the plasma dynamics; B: The simulated distribution of ionization rate on the substrate surface.
Figure 3 compares the simulated and experimental velocities of the plasma plume. In the simulation, a maximum velocity of 1.1×10⁵m/s at the exit of the dielectric tube is observed, which is close to the experimental velocity of 1.4×10⁵m/s. With the increase of the axial distance, the velocity of the plasma plume decreases first. Then it increases as it approaches the surface of the substrate, similar to the experimental results. This phenomenon can be explained as follows: on the one hand, as the helium gas flows into the ambient air, the mole fraction of the helium gas decreases along the flow direction due to the gas diffusion. In addition, as the head of the plasma plume propagation forwards, the external electric field (Laplace electric field) decreases, and the energy deposited into the plasma channel increases. According to the expression of the streamer velocity in reference[36], the electric field (Eh) and the Townsend ionization coefficient (α) decrease with the decrease of the mole fraction of helium gas and the external electric field, which leads to the reduction of the propagation velocity of the plasma plume. On the other hand, when the head of the plasma plume approaches the substrate, the substrate surface is negatively charged due to the electric polarization, and the surface charge density reaches the order of 10-10C/m2. Because the electric field induced by the negative charges on the substrate surface is in the same direction as the external electric field and the electric field induced by the positive charges in the plasma head, which may greatly enhance the total electric field in front of the plasma head. Therefore, the propagation velocity of the plasma head would increase as it approaches the substrate surface. In addition, we would like to point out that when the plasma head is far from the substrate surface, the surface charge density is too low to affect the electric field in front of the plasma head.
|
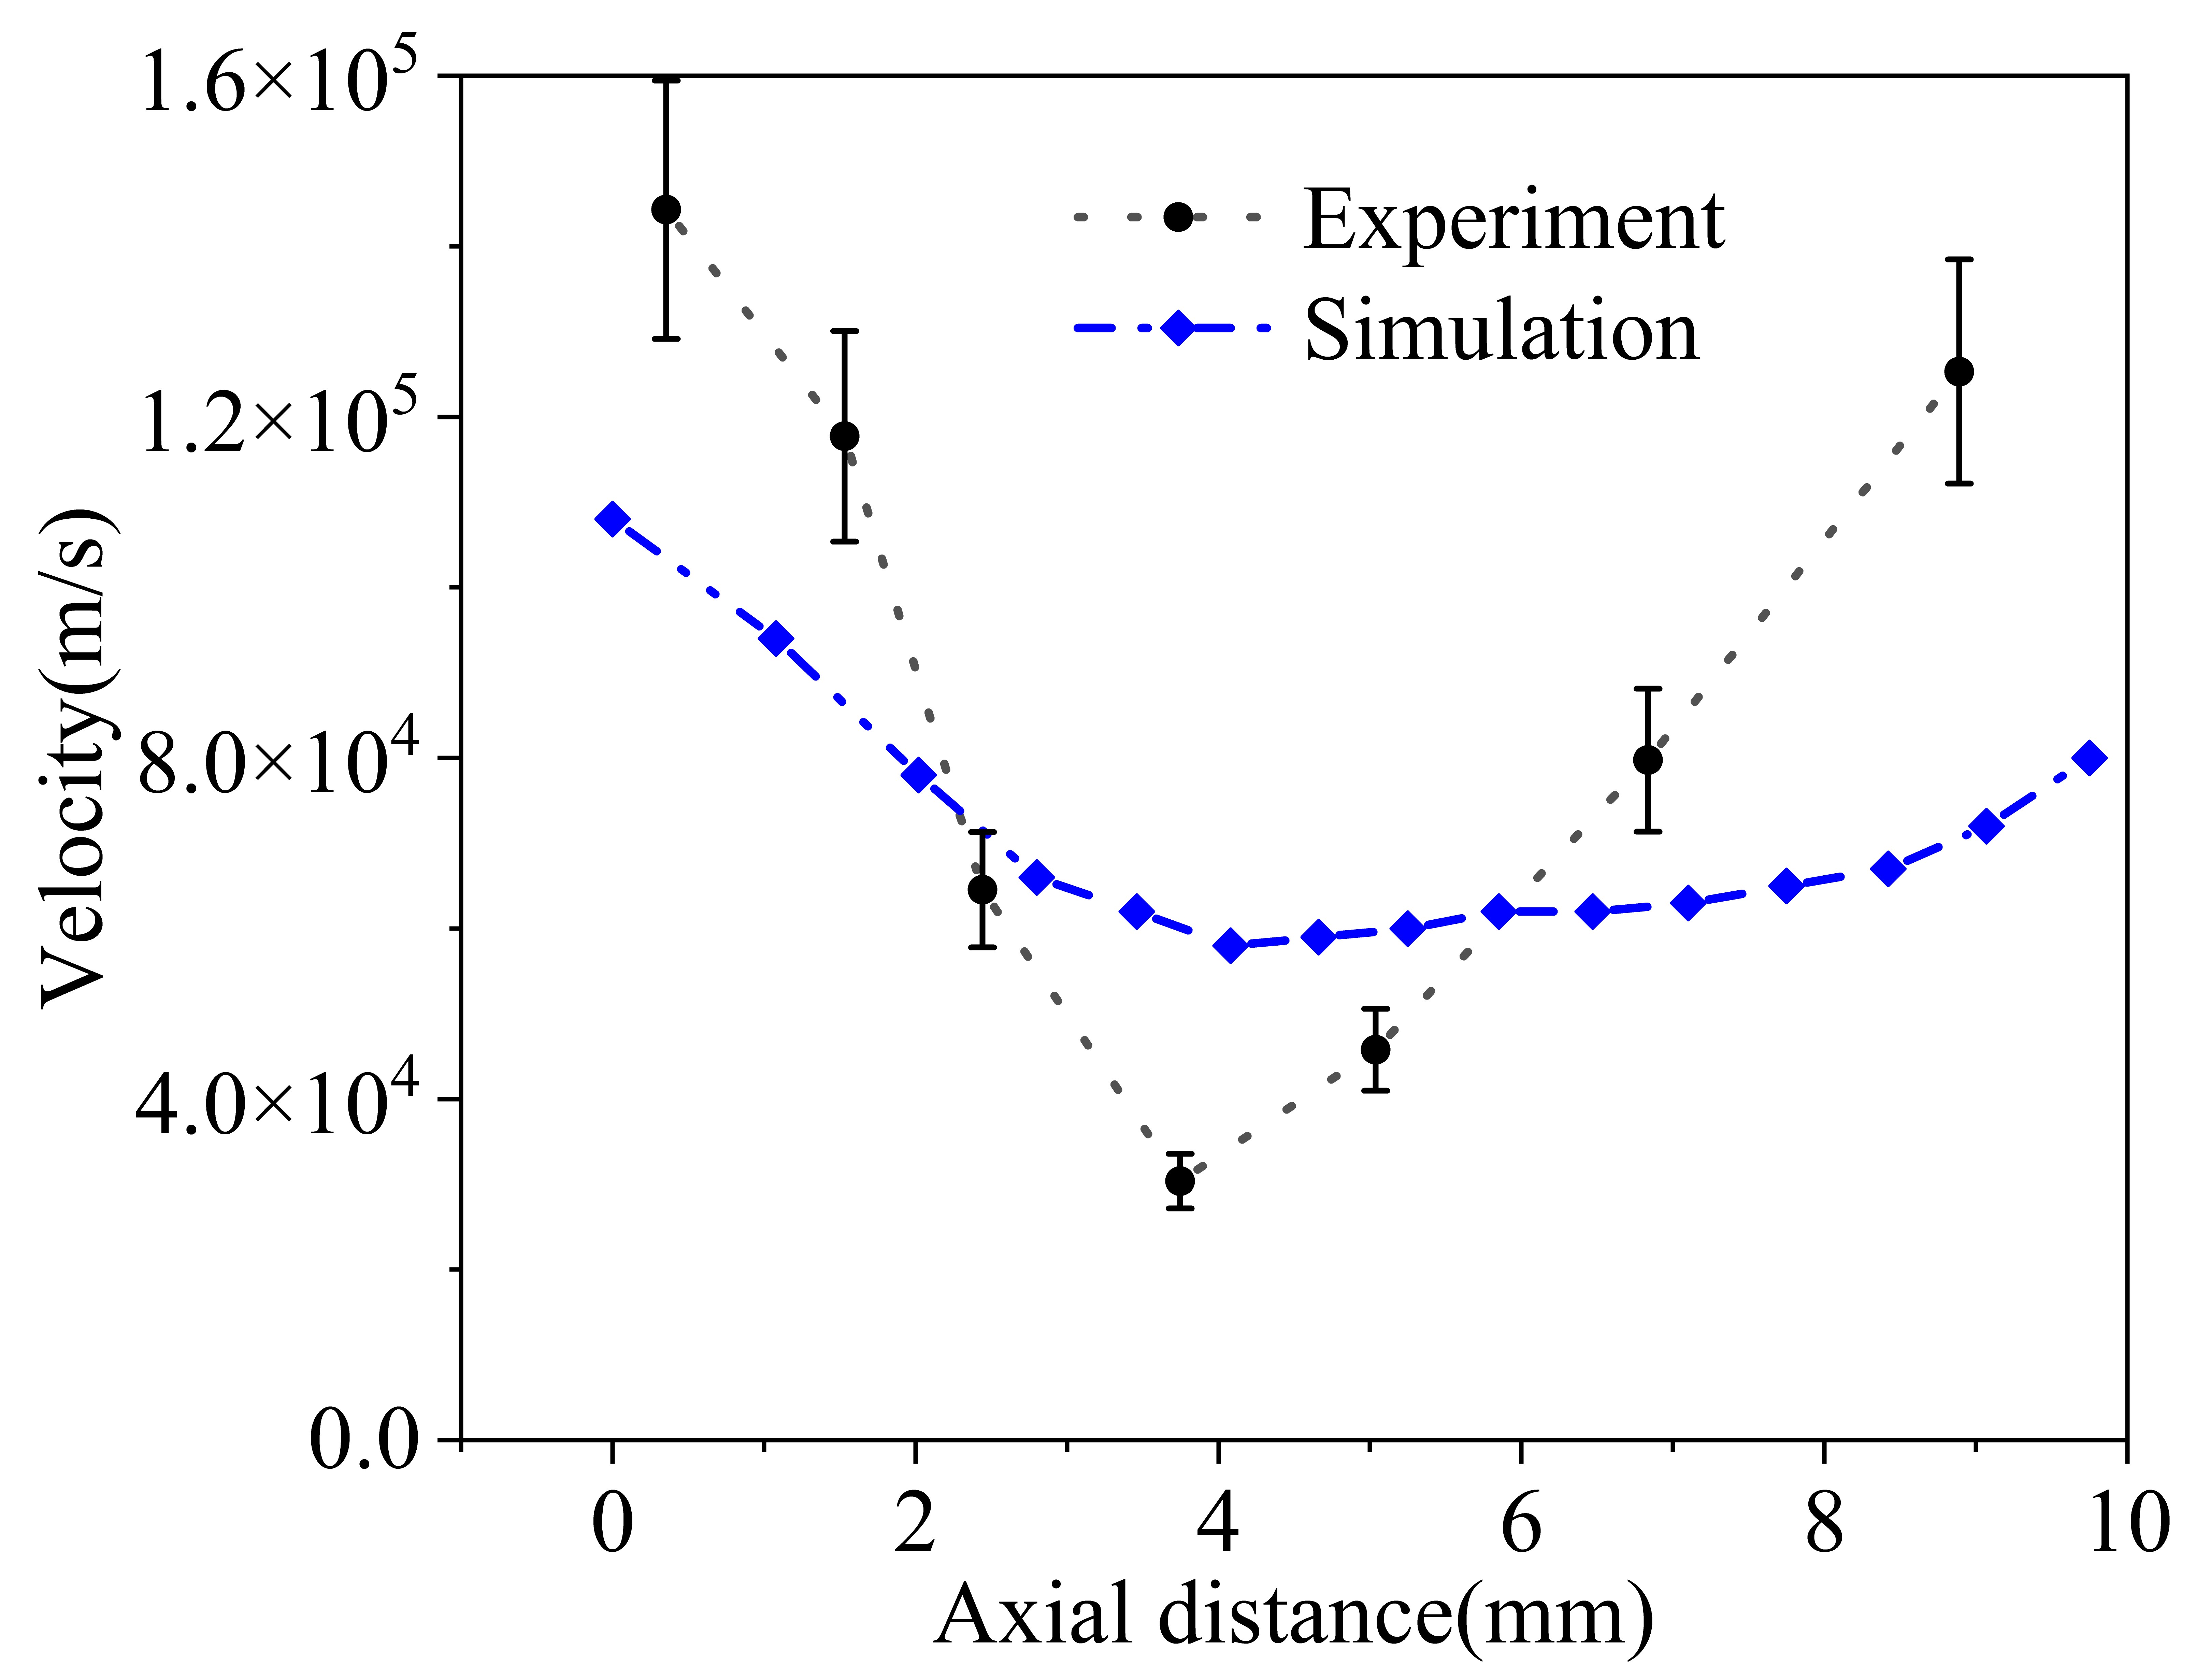
Figure 3. The simulated and experimental propagation velocity of the plasma plume as a function of the axial distance. The plasma jet impinges on a substrate with relative permittivity of 4.9. The zero position represents the exit of the dielectric tube.
The spatial distribution of the plasma parameters (electron density, electric field, and electron temperature) at 600ns are presented in Figure 4. The maximum values of the electric field and the electron temperature close to the surface are about 95kV/cm and 10eV, respectively. In the plasma column, the maximum electron density and the maximum electron temperature are about 1.3×10¹⁹m-3 and 3eV, respectively. These results are close to the results reported by Norberg et al.[37], where the maximum electric field and the maximum electron density near the surface of the substrate with relative permittivity of 5 are 75kV/cm and 1×10¹⁹m-3 at 100ns, respectively. It should be pointed out that the differences in the applied voltage, the electrode configuration, and the substrate possibly cause the discrepancy of these plasma parameters between our works and previous works.
|
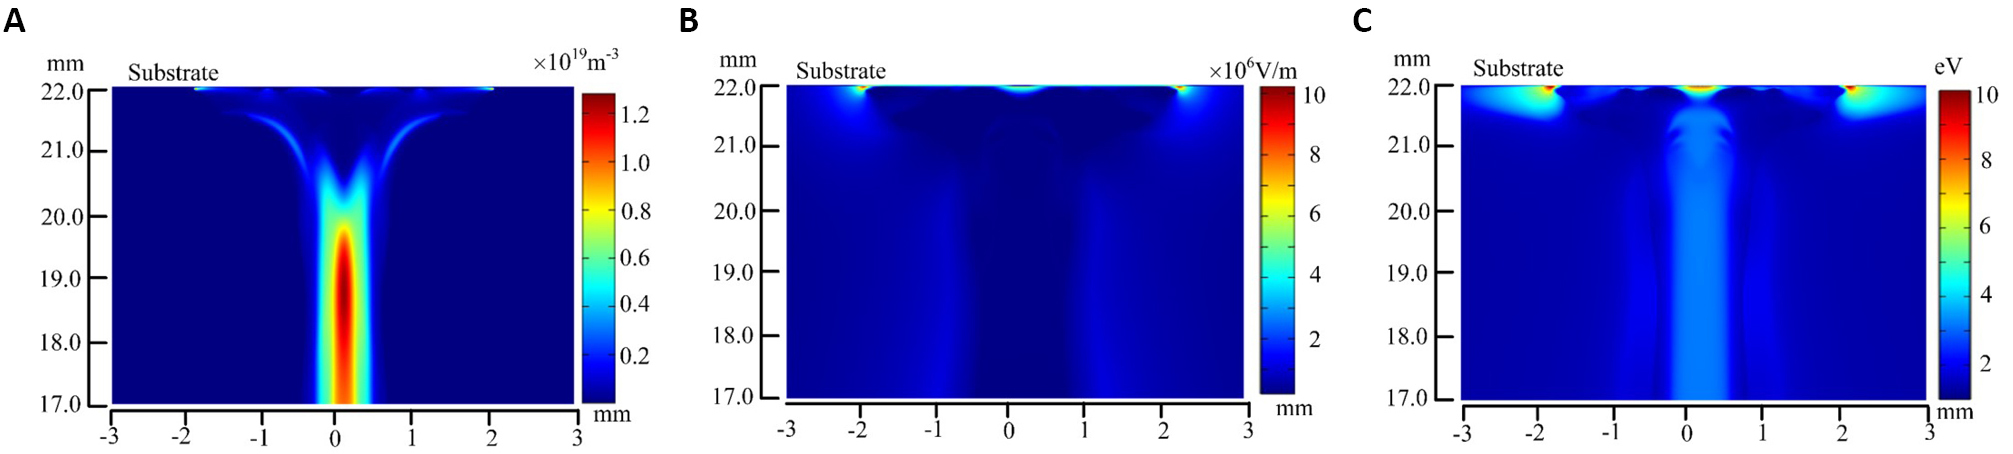
Figure 4. The two-dimensional distribution of the electron density (A), the electric field (B), and the electron temperature (C) when the plasma jet touches the substrate at 600ns.
3.2 The Characteristics of the Plasma Dynamics Near the Substrate Surface
Figure 5 shows the spatial-temporal distribution of the electric field near the substrate surface after the tip of the plasma jet reaches the substrate. At 310ns, the electric field strength close to the substrate is about 30kV/cm. As the plasma propagates further along the surface of the substrate at 340ns, the maximum electric field increases up to 95kV/cm at a radial position of 1.2mm offset from the axis of symmetry. It also clearly shows that the electric field is highly concentrated at the radial distance of 1.2mm. At 500ns, the electric field strength near the substrate surface decreases significantly as the front of the plasma propagates forward radially along the substrate surface, while the electric field strength inside the substrate increases up to about 28kV/cm. Therefore, after the plasma jet impinges on the substrate, the electric field distribution near the substrate surface changes significantly, which may be related to the accumulation of the charges on the substrate provided by the plasma jet.
The radial distribution of the surface charge density before and after the moment when the plasma jet contacts with the substrate are separately plotted in Figure 6. At 200ns-280ns, the substrate’s surface is negatively charged due to the dielectric polarization, and the density of the surface charge is as low as on the order of 10-11C/m2. After 350ns, the surface of the substrate is charged positively. The maximum surface charge density reaches about 8.26×10⁻⁵C/m2, six orders of magnitude higher than before the plasma jet contacts with the substrate. During 350-900ns, the density of the surface charges increases, and the surface charge density profile moves radially outward, which accompanies the propagation of the plasma on the substrate surface. In addition, it is interesting to observe that a peak of the surface charge density appears at the radial distance of 1.2mm, similar to the distribution of the electric field in Figure 5. It indicates that the accumulation of the positive charges on the substrate, provided by the plasma jet, induces a high electric field near the substrate surface.
The plasma sheath near the surface of the substrate is an essential parameter for the interaction between plasma and matter. Figure 7A shows the axial distribution of positive ions, electron number density, and electric field at the radial distance of 1.2mm at 340ns. The density of the position ions near the surface of the substrate is significantly higher than the electron density, and a high electric field is also present. It indicates the formation of the plasma sheath. At 340ns, the sheath thickness at the axial distance of 1.2mm is about 0.09mm. The maximum electric field is about 95kV/cm. Figure 7B shows the radial distribution of the sheath thickness at different moments. As the radial distance increases, the sheath thickness decreases first and then increases after it reaches the minimum value at the radial distance of about 1.2mm. With time varying from 330ns to 400ns, the thickness of the plasma sheath decreases.
|
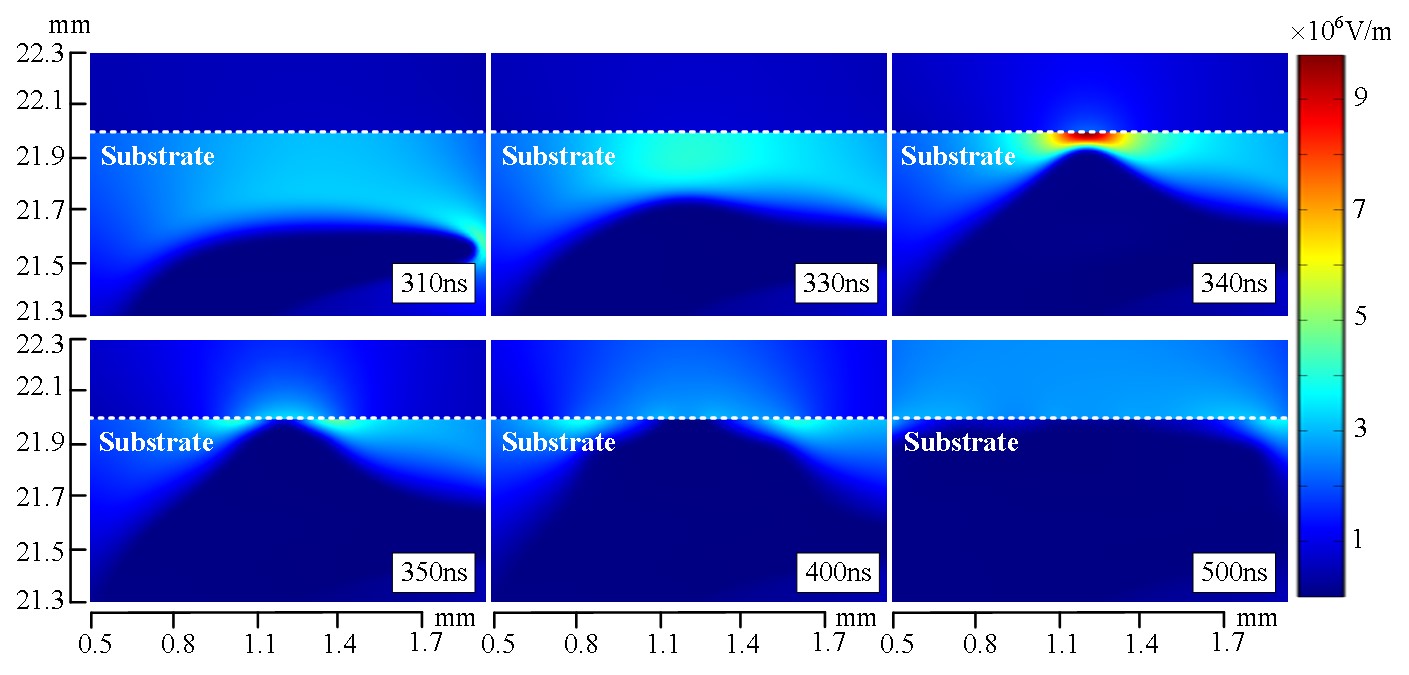
Figure 5. The spatial-temporal distribution of the electric field near the substrate surface.
|
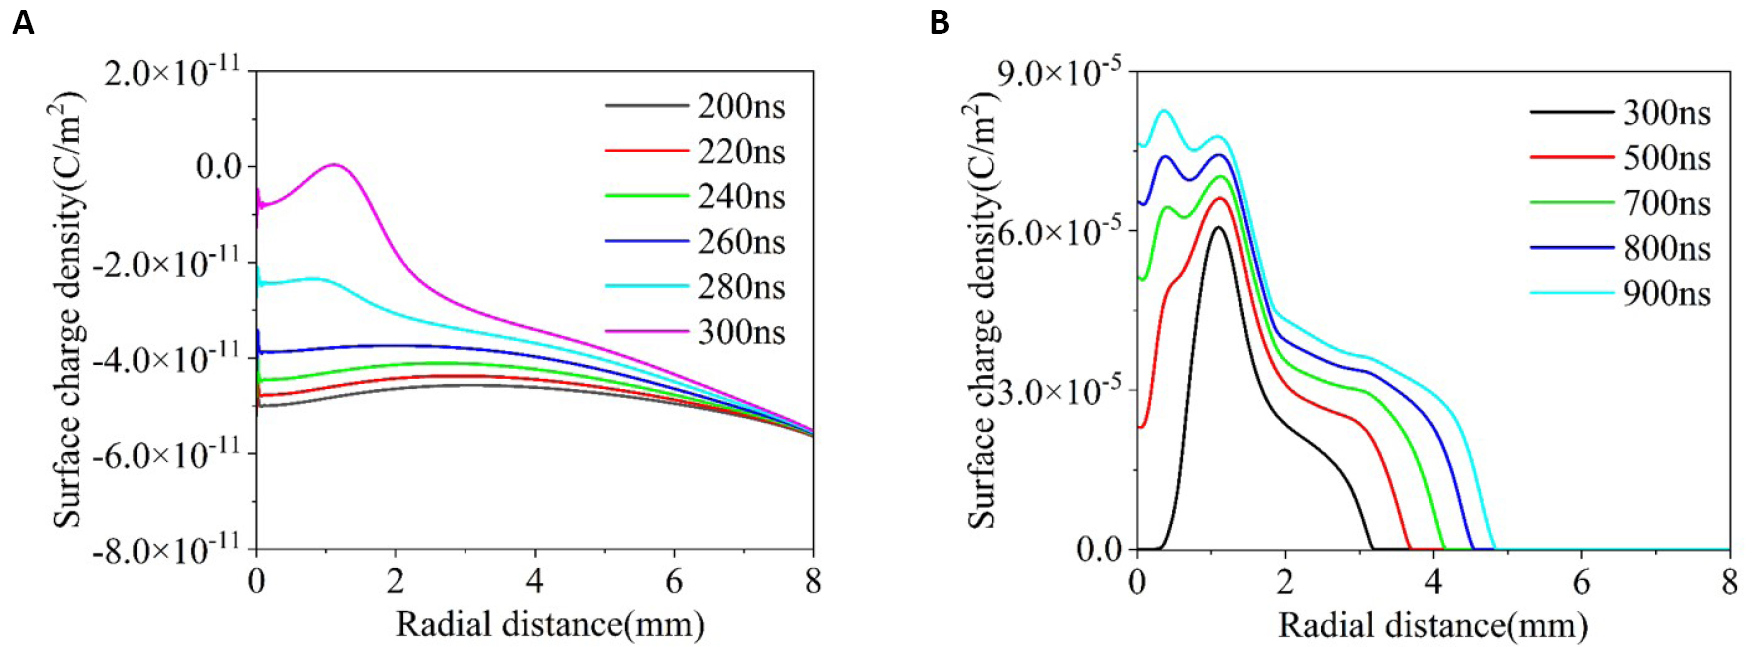
Figure 6. The radial distribution of the surface charge density on the substrate at different moments (A) 200-300ns, (B) 350-900ns.
|
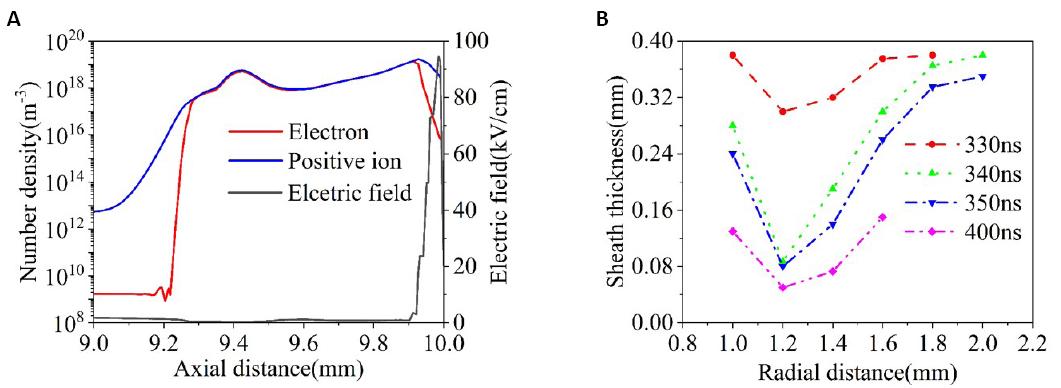
Figure 7. The spatial distribution of charge densities and plasma sheath. A: The axial distribution of positive ion, electron number density, and electric field at the radial distance of 1.2 mm at 340ns. The position at 10 mm represents the surface of the substrate. B: The radial distribution of plasma sheaths at different moments on the substrate surface.
3.3 The Effects of the Relative Permittivity
Figure 8 shows the two-dimensional distribution of electron density, electric field, and the ionization rates for the different relative permittivity of the substrate. The simulation time in Figure 8 is chosen when the maximum plasma parameters appear near the substrate surface. When the relative permittivity of the substrate increases from 2.1 to 11.7, the maximum electric field near the substrate surface increases from 48.9kV/cm to 160kV/cm, the ionization rate increases from 1.37×10¹¹m3/(s×mol) to 1×10¹²m3/(s×mol), and the electron density increases from 1.32×10¹⁹m-3 to 5.86×10¹⁹m-3. It is also observed that as the relative permittivity increases, the moment for the appearance of the maximum plasma parameters becomes earlier. In addition, it is interesting to find that the distribution of the electric field and the ionization rate for the relative permittivity of 2.1 is almost uniform near the substrate, instead of non-uniform distribution in other cases.
Figure 9 shows the sheath thickness and the maximum electric field for different relative permittivity at the radial distance of 1.2mm. For the relative permittivity of 2.1, the thickness of the plasma sheath and the maximum electric field near the substrate is kept almost constant at about 0.45mm and 24kV/cm, respectively. On the other hand, for other cases, as the time increases from 310ns to 350ns, the thickness of the plasma sheath decreases monotonously, and the maximum electric field increases first and then decreases after reaching a peak value. In addition, when the relative permittivity of the substrate increases from 2.1 to 11.7, the thickness of the plasma sheath decreases, and the maximum electric field increases.
Figure 10 shows the radial distribution of the surface charge density for the different relative permittivity of the substrate at 300ns, 500ns, and 900ns. At 300ns, the density of the surface charge is on the order of 10-11C/m2, corresponding to the dielectric polarization of the dielectric and no charge accumulation by the plasma jet. It is also noted that the peak value of the surface charge density appears at the radial distance of 1.2mm. At 500ns, the density of the surface charge increases significantly with the increase of the relative permittivity of the substrate. The maximum density of the surface charge reaches 3.03×10⁻⁴C/m2 for a relative permittivity of 11.7. At 900ns, the profiles of the surface charge density move to the right, corresponding to the plasma’s radial propagation on the substrate surface.
Figure 11A shows the distribution of the ionization rate for different relative permittivity at 1000ns. The smaller the relative permittivity of the substrate is, the further the plasma on the substrate surface propagates. The radial propagation length at 1000ns for the different relative permittivity of the substrate is plotted in Figure 11B. When the permittivity of the substrate increases from 2.1 to 11.7, the radial propagation length decreases from 4.8mm to 2.5mm. It can be explained as follows: When a plasma jet is fixed and the substrates with different relative permittivity are used, the total charges provided by the plasma jet keeps almost unchanged; As the relative permittivity of the substrate increases, the density of the surface charge increases significantly, and therefore the area of plasma on the surface of the substrate would decrease; In other words, a shorter propagation length of the plasma on the surface is obtained for higher relative permittivity.
Figure 12 shows the two-dimensional distribution of the density of the N2 excited states and O atoms for the different relative permittivity of the substrates. It clearly shows that the N2 excited states and O atoms are mainly generated at places away from the substrate surface, corresponding to the interface between the helium flow and the ambient air. When the relative permittivity of the substrate increases from 2.1 to 11.7, the density of N2 excited states increases from 2.74×10¹⁷m-3 to 2.55×10¹⁸m-3, and the density of O atoms increases from 7.04×10¹⁸m-3 to 6.05×10¹⁹m-3. It indicates that when the sample treated by APPJs has a larger relative permittivity, a higher concentration of the active species will be obtained. In addition, it should be noted that the production of the N2 excited states and O atom close to the surface of the substrate is observed for the large relative permittivity, which is possible due to the enhancement of the electric field near the substrate.
|
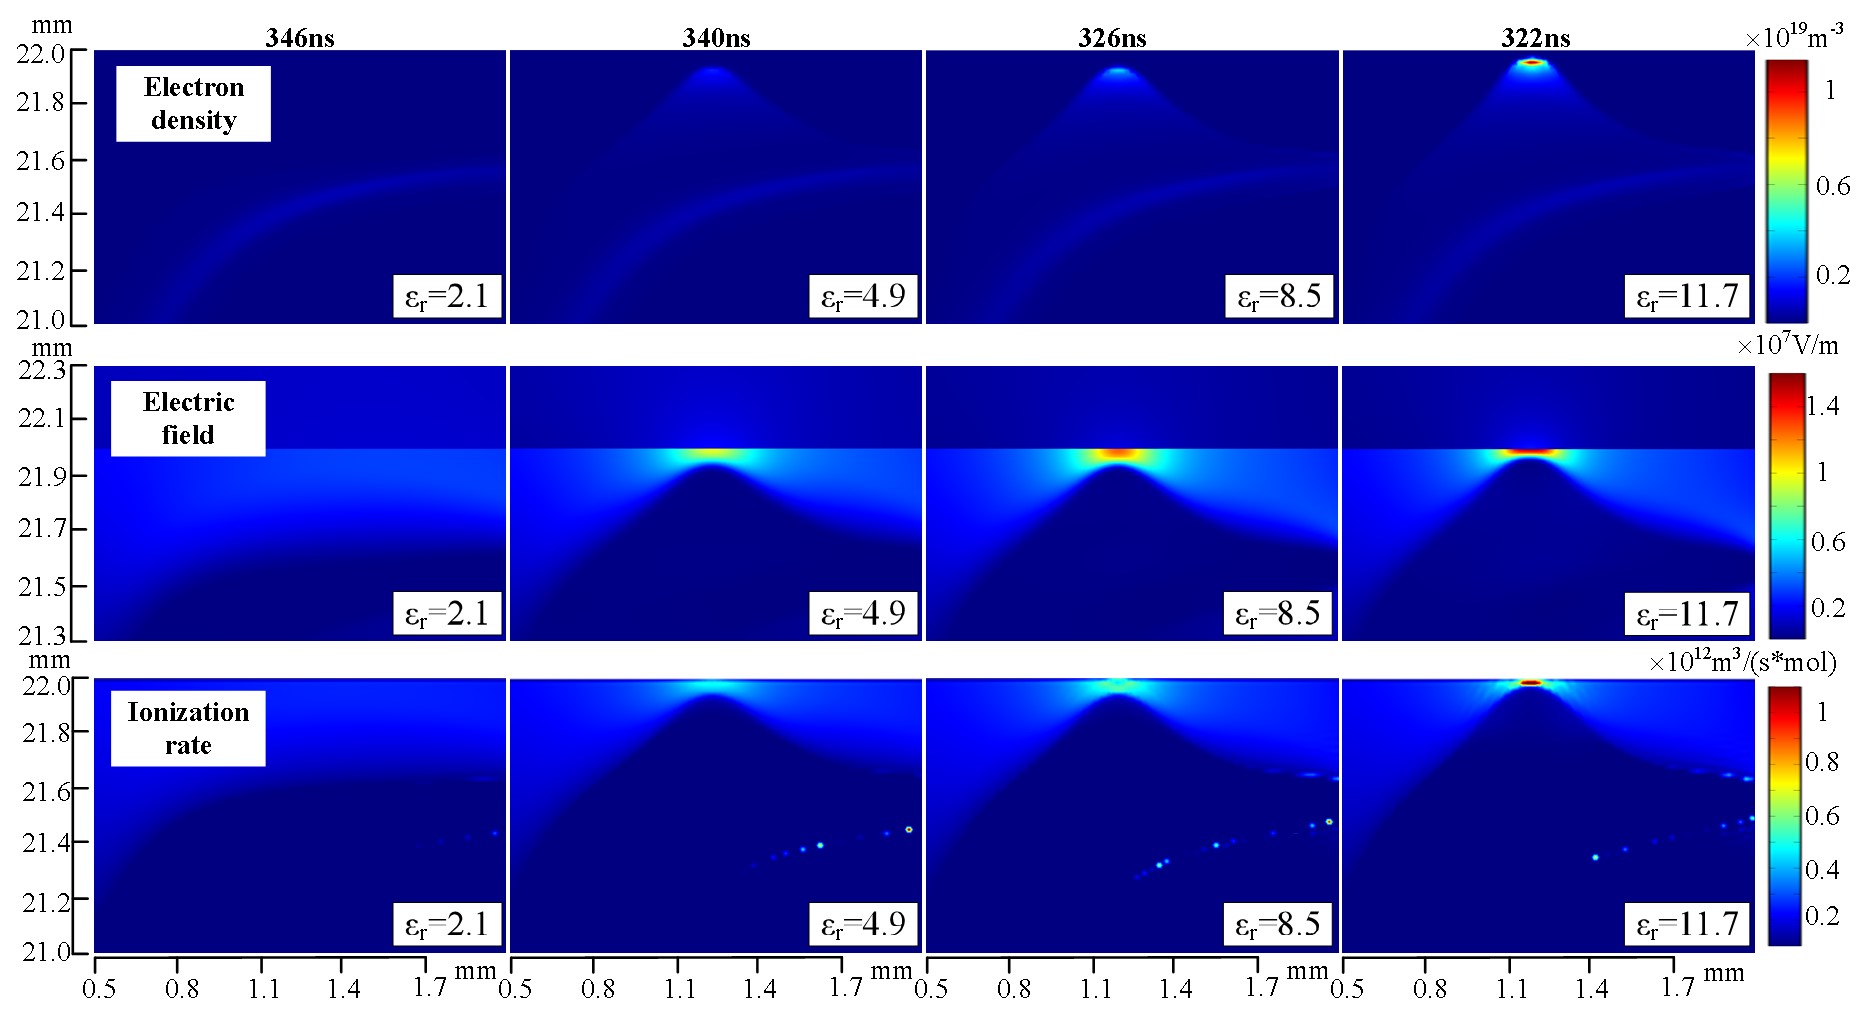
Figure 8. Two-dimensional distribution of electron density, electric field, and the ionization rates for different relative permittivity of the substrate.
|
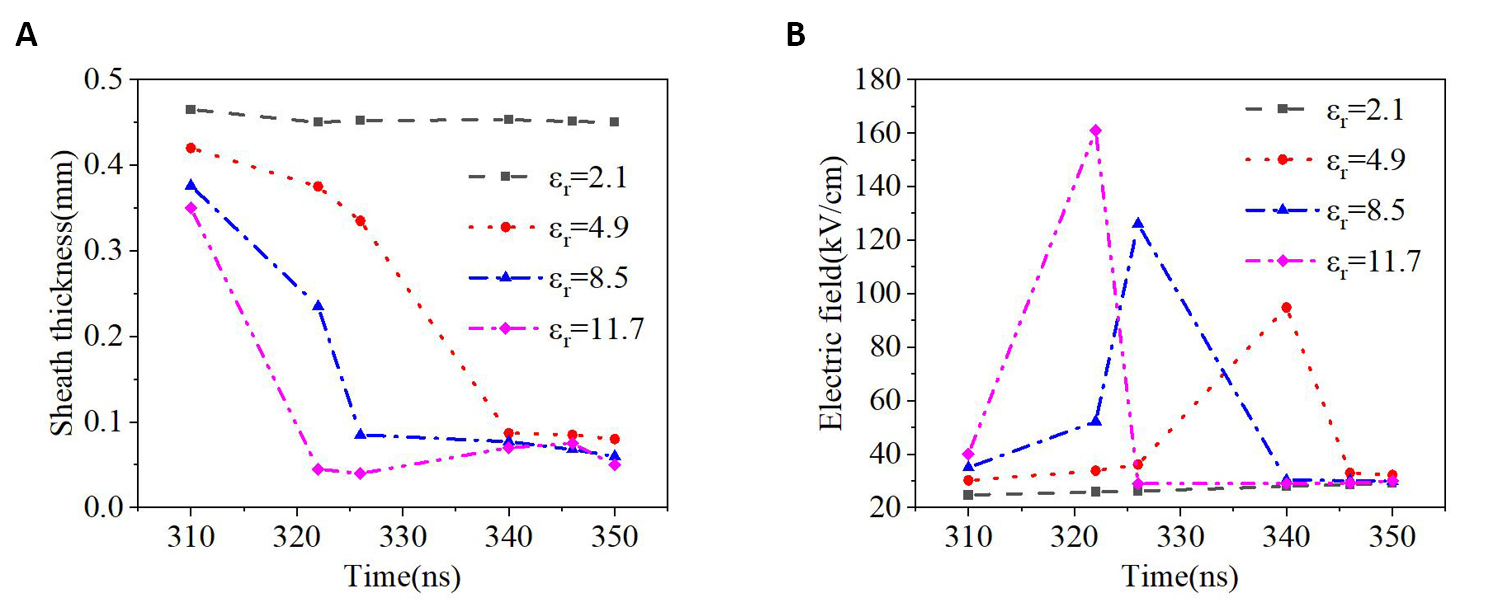
Figure 9. The temporal distribution of the thickness of the plasma sheath (A) and the maximum electric field near the surface of the substrate (B) for different relative permittivity at the radial distance of 1.2mm.
|
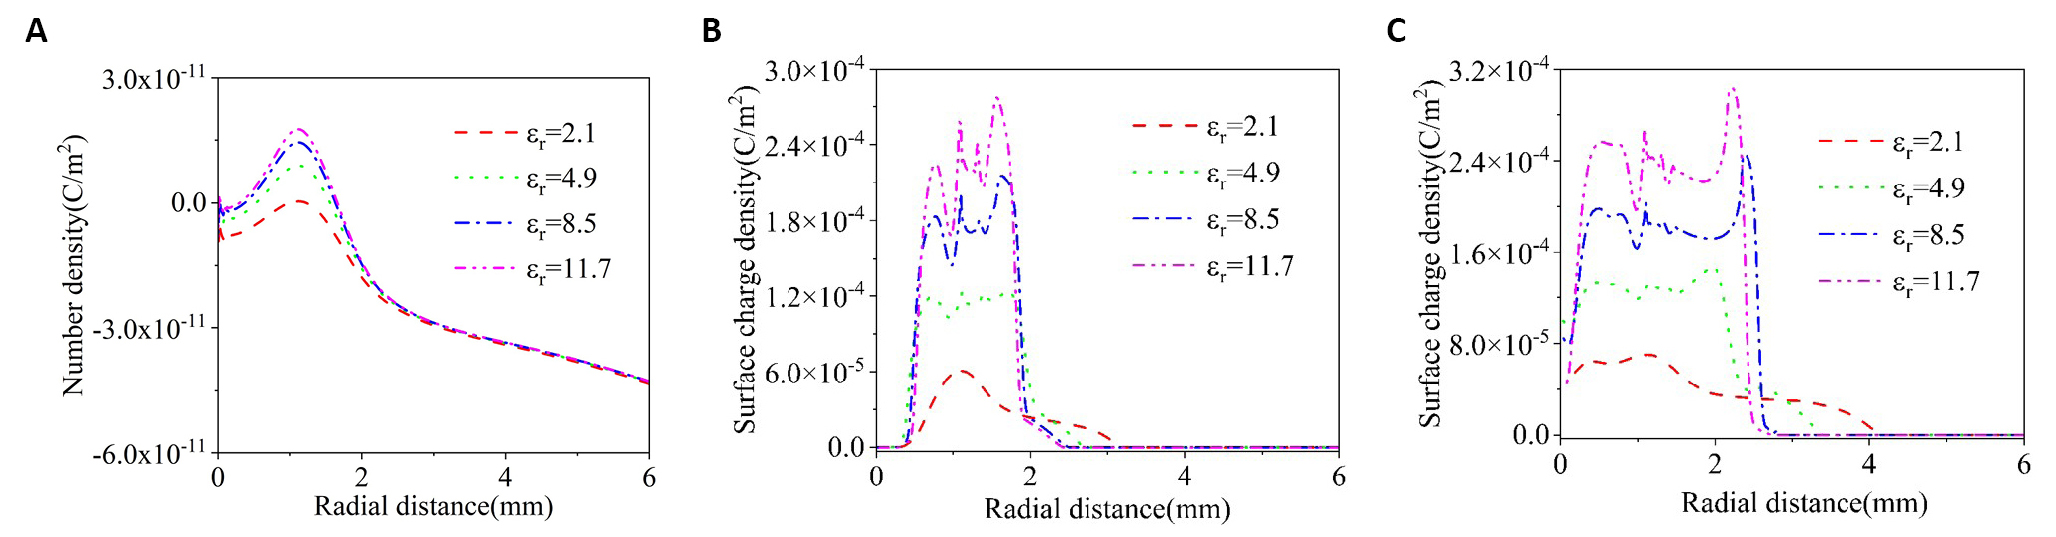
Figure 10. The radial distribution of the density of surface charges for different relative permittivity at (A) 300ns, (B) 500ns, and (C) 900ns.
|
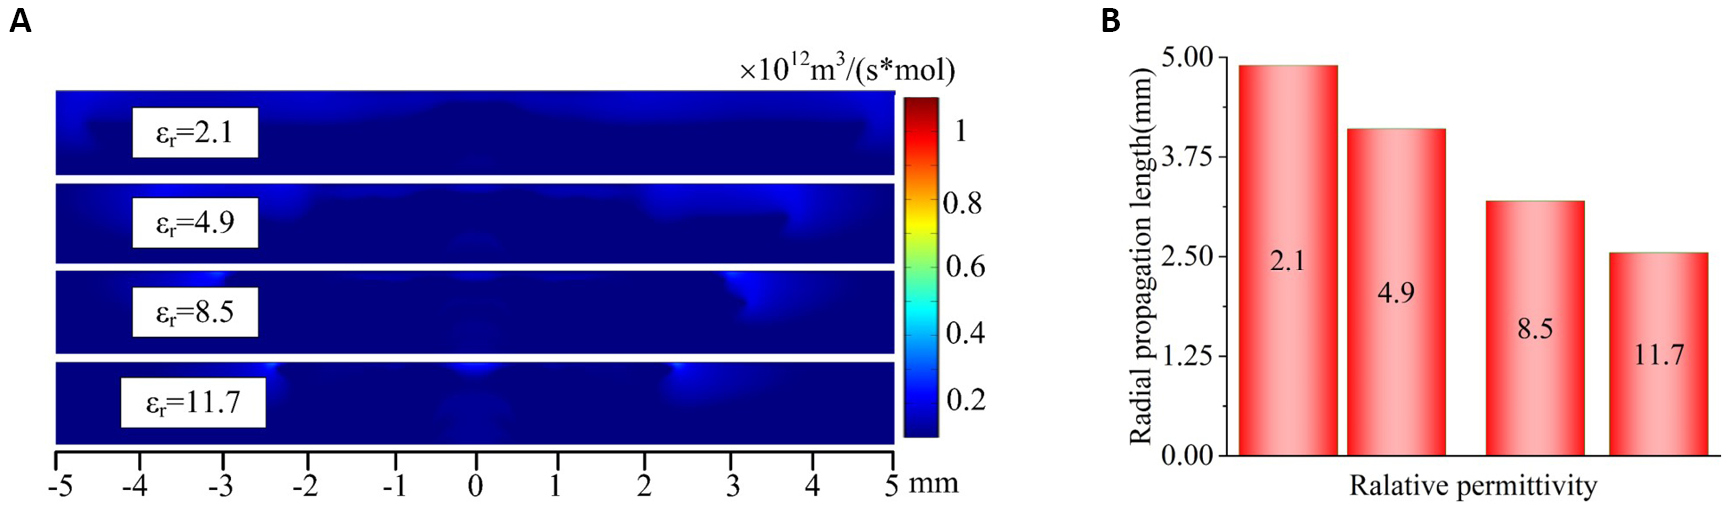
Figure 11. The effects of the relative permittivity on ionization rate and radial propagation length. A: The two-dimensional distribution of the ionization rate for different relative permittivity at 1000ns. B: The radial propagation length of the ionization wave on substrate surface for different relative permittivity.
|
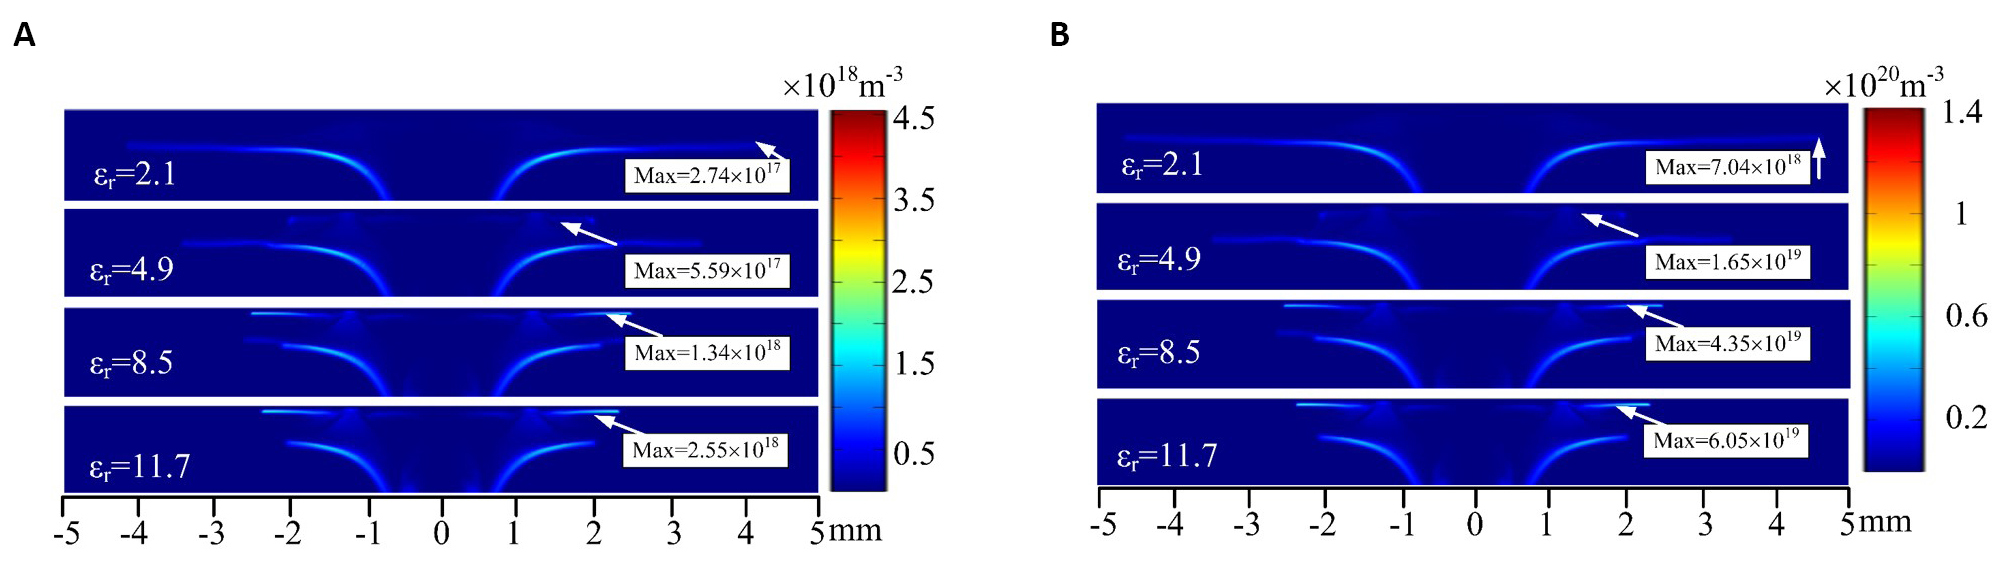
Figure 12. The distribution of the density of (A) nitrogen excited states (N2*) and (B) O atom near the substrate surface for different relative permittivity.
3.4 Effects of Surface Morphology
In practical applications, the surface of the substrate is not ideally flat. For example, the sample to be treated by plasma jet could be biofilms for biomedical applications. To understand the effects of the surface morphology of the substrate on the plasma dynamics, a plasma model with a wavy surface of the substrate is established. Figure 13 shows the simulation configuration of the plasma model, which is similar to the model in Figure 1. The difference is the surface morphology in which a wavy substrate surface structure is used. The distance between the adjacent convexity is 50μm. The radius of the convexity is 100μm. The relative permittivity of the substrate is 15.
Figure 14 shows the spatial-temporal distribution of the electron density, the electric field, the electron temperature, and the ionization rate near the substrate surface. At 300ns, the electrons are mainly generated at the interface between the helium gas and the ambient air, which is away from the surface of the substrate. The maximum electron density reaches about 1.8×10¹⁹m-3. The electric field intensity reaches 39.1kV/cm on the surface of the substrate, while the electric field inside the convexity is as low as 3.1kV/cm. At 340ns, the electrons are generated near convexity 1, and the electric field on the surface of convexity 2 reaches as high as 50kV/cm. At 400ns, the electrons are generated near convexity 2, and the maximum electric field appears at the surface of the next convexity. It seems like that an ionization wave is ignited at 340ns and then propagates along the surface of the substrate. The propagation length of the ionization wave is about 1.5mm. It should be noted that the electron density close to the substrate surface or at the positions between the two adjacent convexities is extremely low. In addition, the maximum electron temperature is about 10eV, and the ionization rate is on the order of 1011m3/ (s×mol). The trend of distribution of the electron temperature and ionization rate as a function of time is the same as that of the electric field.
Figure 15 shows the surface charge density as a function of the surface length at different moments. At 340ns, a peak of the surface charge density is observed, corresponding to the convexity 1. The maximum density of the surface charge reaches as high as 5.6×10⁻⁴C/m2, which is higher than that for the flat substrate in Figure 9. At 500ns or 1000ns, a wavy distribution of the surface charge density is observed, which corresponds to the wavy structure in Figure 13. The surface charge density on the surface of the protrusion is significantly higher than on the surface of the concavity.
|
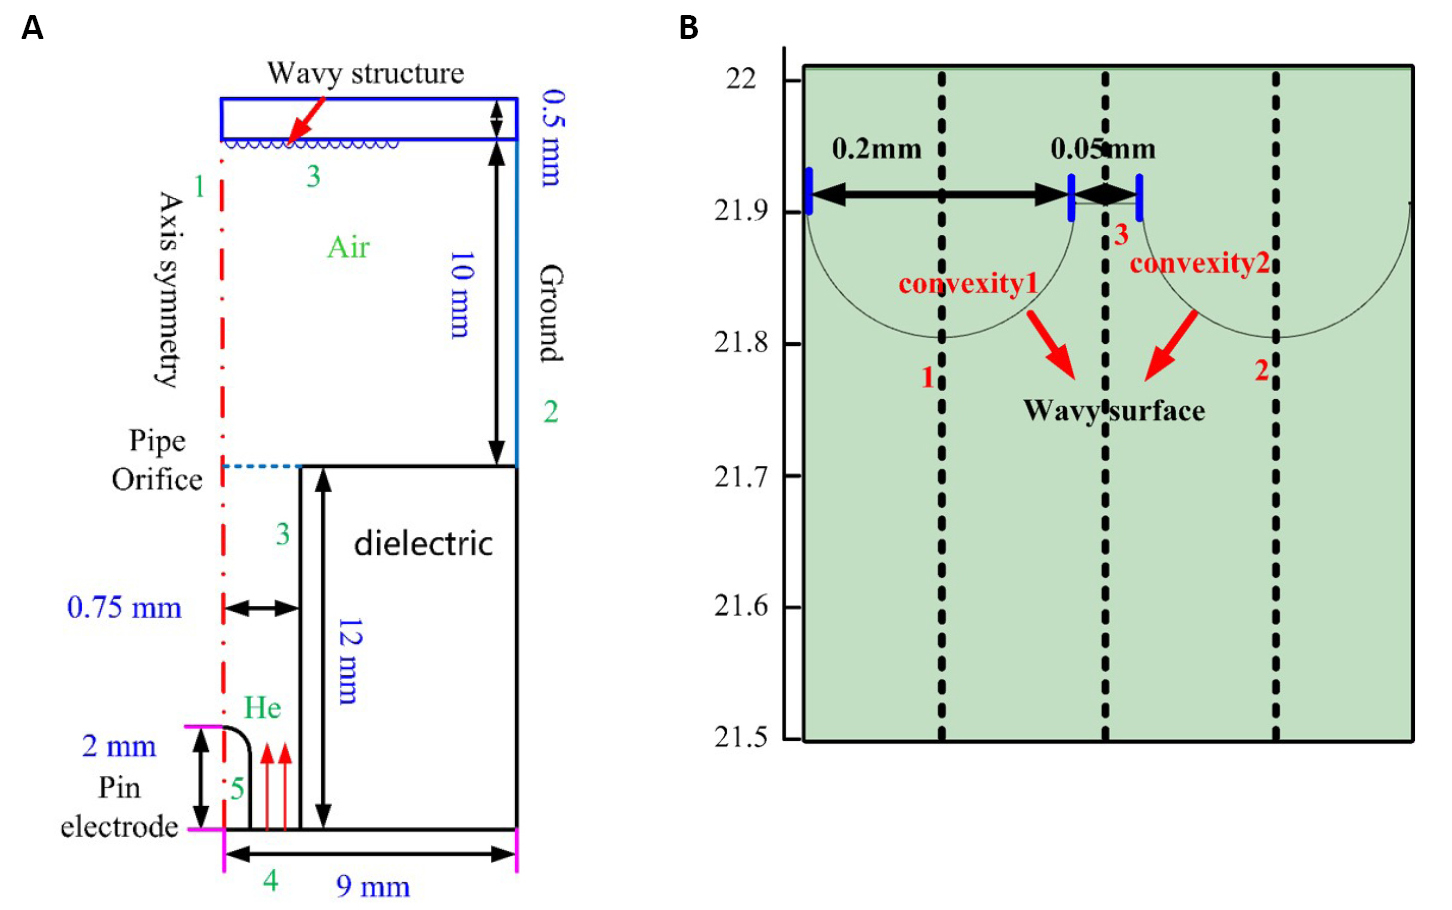
Figure 13. The simulation model of the plasma jet impinging on a wavy substrate surface. A: The simulation configuration of the plasma model. B: The wavy structure zooms in.
|
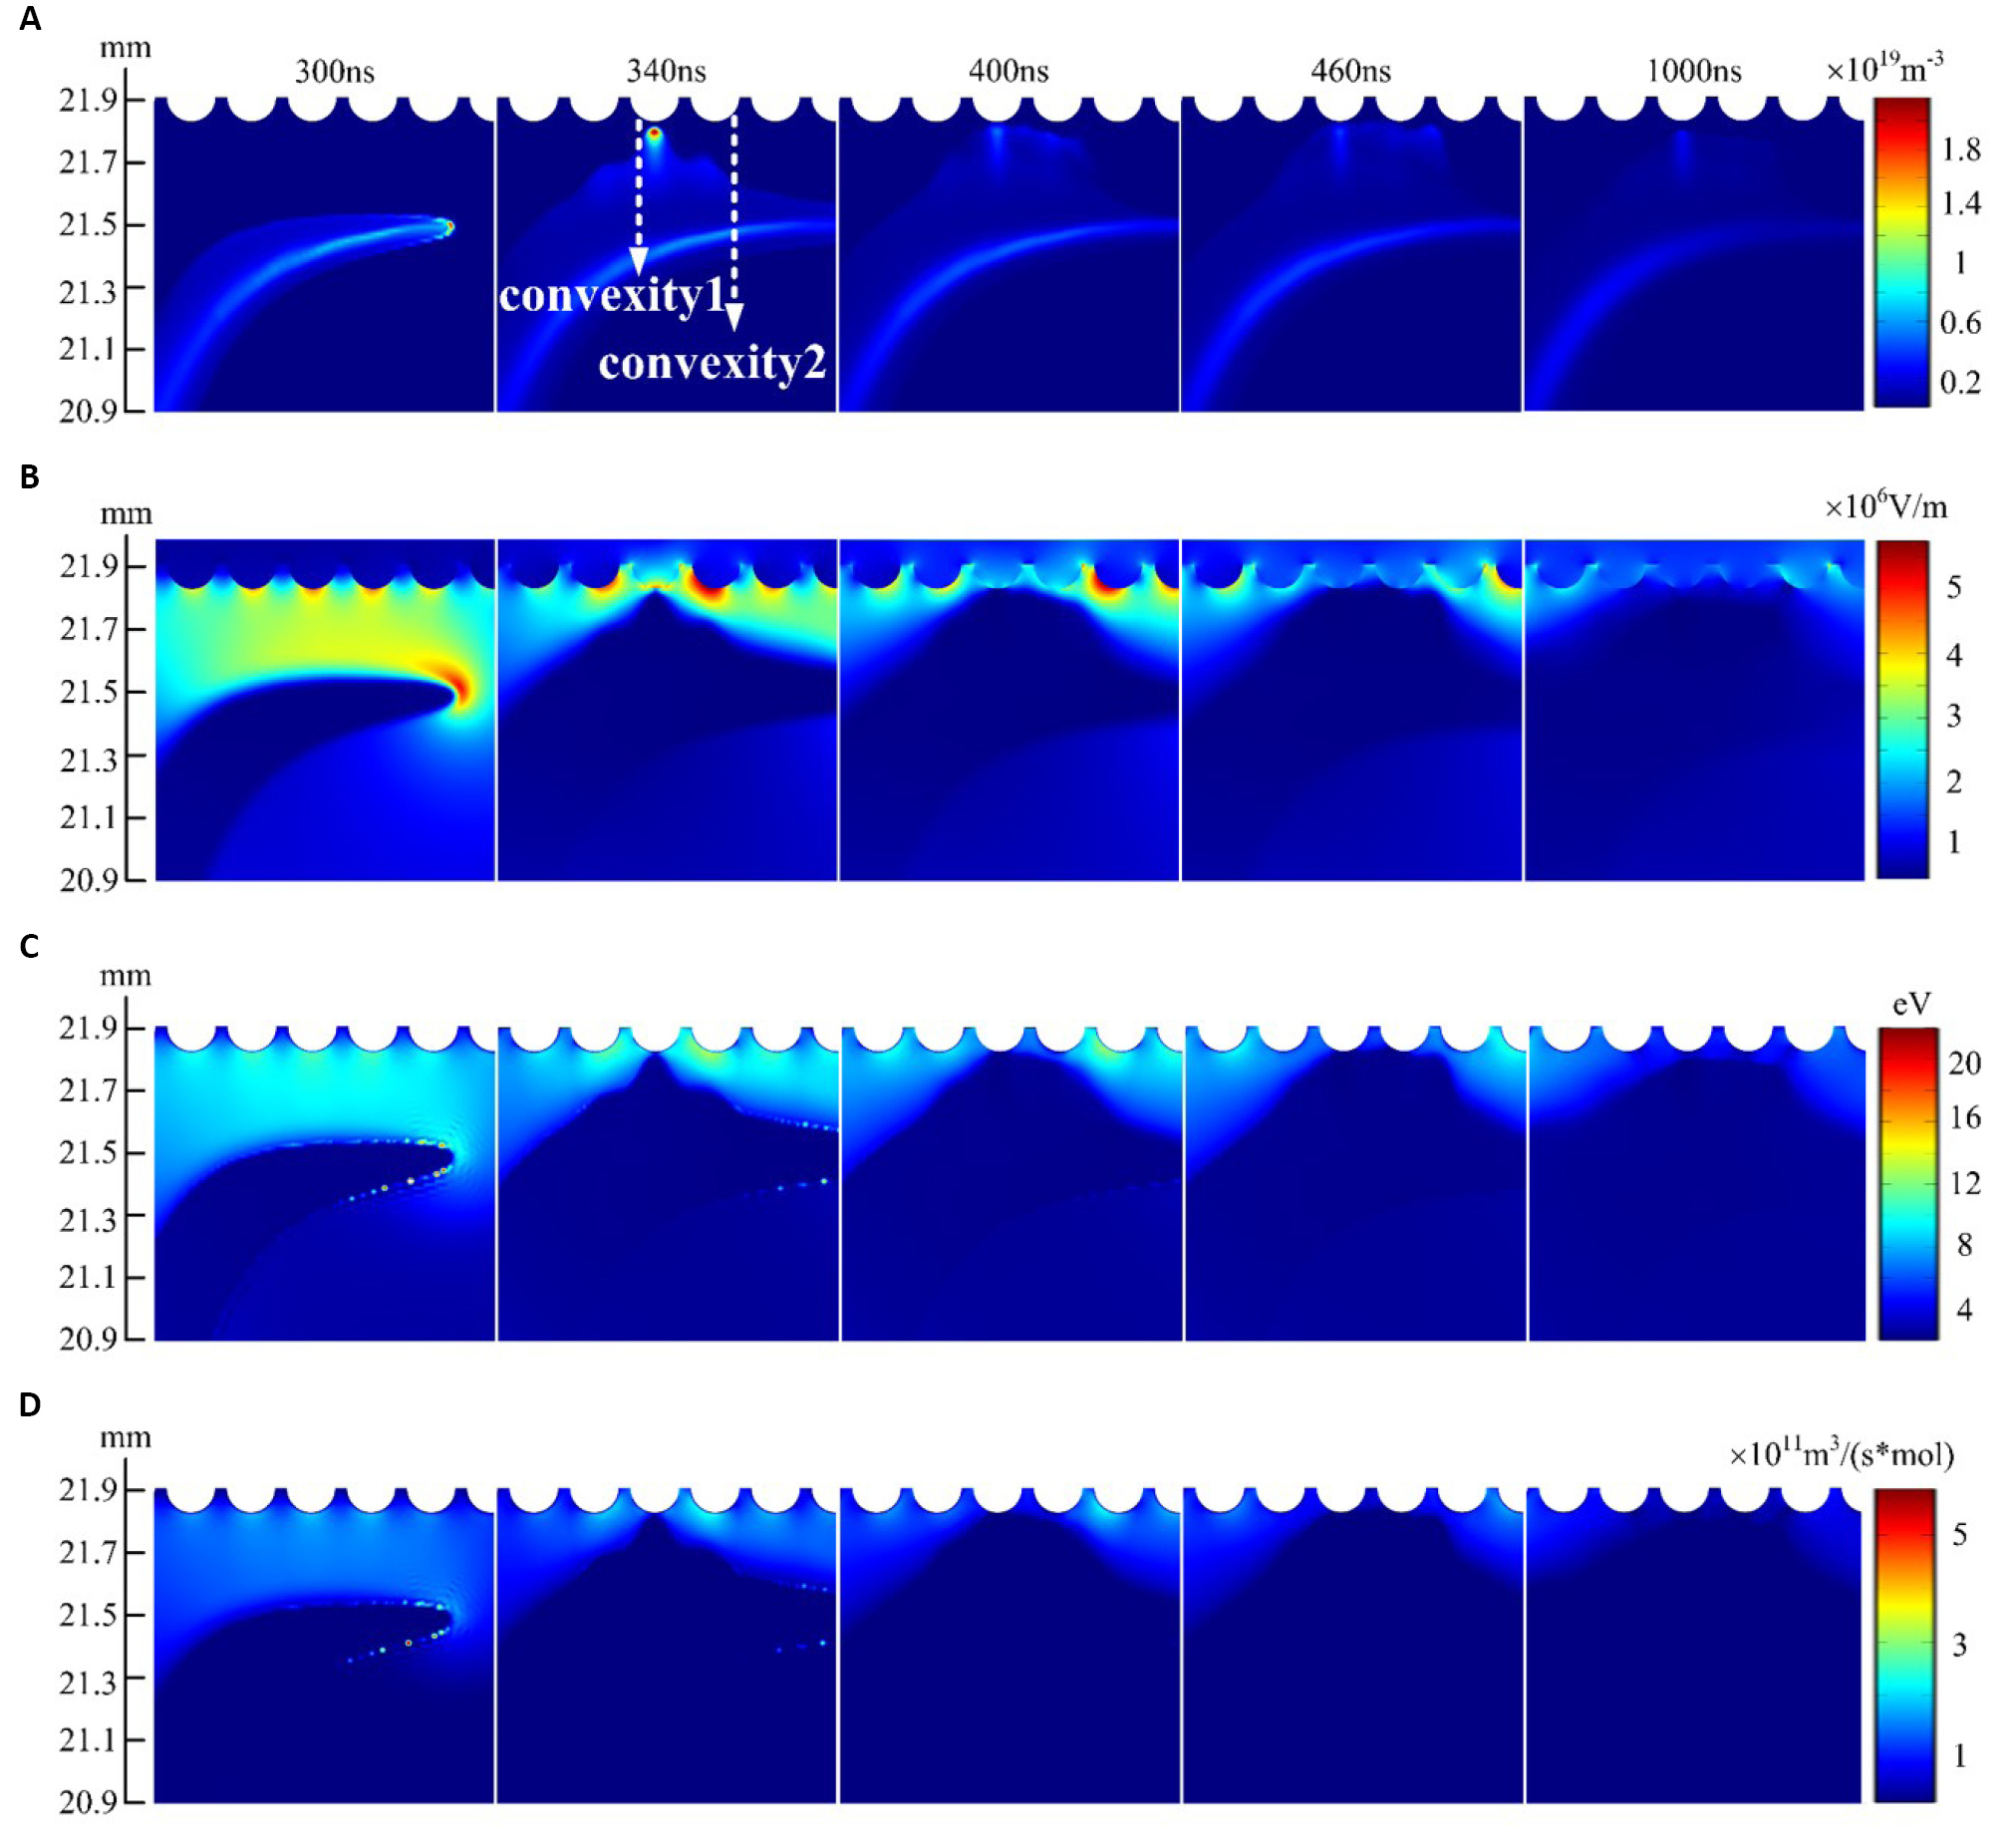
Figure 14. The simulated plasma dynamics near the surface of the substrate. (A) electron density, (B) electric field strength, (C) electron temperature, (D) ionization rate.
|
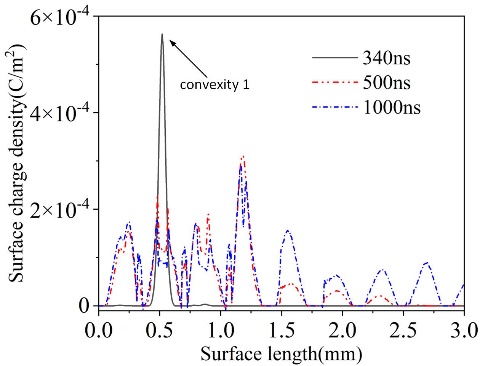
Figure 15. The surface charge density as a function of the surface length. Zero position represents the edge of the second protrusion in Figure 13.
Figure 16 shows the axial distribution of the electron density and position ion density at different moments. Line 1, line 2, and line 3 correspond to the black dashed line in Figure 13. At 300ns, the electron and ion density are very low near the surface, indicating that no plasma sheath exists. At 340ns, the thickness of the plasma sheath on line 1 (protrusion) and line 2 (protrusion) is about 0.03mm and 0.18mm, respectively. At 400ns, the thickness of the sheath on line 2 is reduced to 0.07mm, corresponding to the arrival of the ionization wave on the second protrusion in Figure 14. It is worth noting that the thickness of the plasma sheath on line 3 (concave) is always larger than the radius of the convexity at 100µm, which indicates that no plasma is generated inside the concave. Therefore, if the plasma jet is used to treat the surface of the samples (such as biofilms) with a wavy structure, the plasma is probably not generated directly inside the concave.
The chemical species generated by the plasma jet are important in killing biofilms. The spatial-temporal distribution of the density of O1d, O2*, and N2* near the wavy surface of the substrate is presented in Figure 17. The maximum density of the O1d, O2*, and N2* is 4×10¹⁹m-3, 1.8×10¹⁸m-3, and 2×10¹⁸m-3, respectively. They are mainly generated at positions that are at distances greater than 0.2mm away from the surface, corresponding to the interface between the helium gas and the ambient air. After 340ns, the surface ionization wave is generated and propagates along the substrate surface. Consequently, the O1d, O2*, and N2* close to the substrate surface is generated by the ionization wave. In addition, it is interesting to find that, at 1000ns, the density of the O1d, O2*, and N2* close to the substrate surface slightly increases, which is opposite to the results of the electron density in Figure 14. This is because the lifetime of these chemicals is longer than the pulse width of 1000ns, which leads to the accumulation of chemicals. In addition, the electron temperature remains several eV before and at 1000ns in Figure 14, which provides the electron energy for the excitation of the molecules. It may also contribute to the increase of the density of the O1d, O2*, and N2*.
Regarding the obvious spot region near the substrate of the number density of species in Figure 17, the obvious spot region of the species number density is closely related to the spatial distribution of the electron density near the substrate surface in Figure 14. At 300ns, a strong electric field presents between the plasma plume and the substrate. In addition, the mole fraction of the helium gas decreases significantly in the radial direction from the jet center to the edge of the substrate. Since the Townsend ionization coefficient is strongly dependent on the electric field and the mole fraction of the helium gas, a secondary discharge between the substrate and the plasma plume on the interface between the helium gas and the ambient air is more likely ignited at about radial distance of 0.5mm near the jet center, as shown in Figure 14. As the secondary discharge further develops towards the surface of the substrate, a plasma sheath would form near the surface. The sheath thickness is much larger than the concave's width and depth, resulting in no plasma generated inside the concaves. Therefore, the plasma generated by the secondary discharge should mainly propagate to the protrusion of the convexity, which leads to the high electron density close to the protrusion. Furthermore, because the O atom, O2 excited states, and N2 excited states are mainly generated by the collisions between the electrons and the air molecules, an obvious spot region near the substrate for the species number density will present, which is consistent with the spatial distribution of the electron density. Additionally, it should be noted that the surface ionization wave starts after the plasma generated by the secondary discharge touches the substrate surface.
The chemical species' fluxes onto the substrate surface are presented in Figure 18. The distribution of the fluxes of the O1d, O2*, and N2* is wavy, corresponding to the surface morphology of the substrate. The maximum flux of the O1d, O2*, and N2* on the protrusion reaches 1.25×10²³m-2s-1, 4.91×10²¹m-2s-1, 5.28×10²¹m-2s-1, respectively. The fluxes of these chemical species on the protrusion are at least one order of magnitude higher than that on the concave, which indicates that the treatment efficiency of the plasma jet for the concave may be lower than that for the protrusion in practical applications. In addition, the fluxes of the O1d, O2*, and N2* at 1000ns on the protrusion are greater than that at 340ns.
|
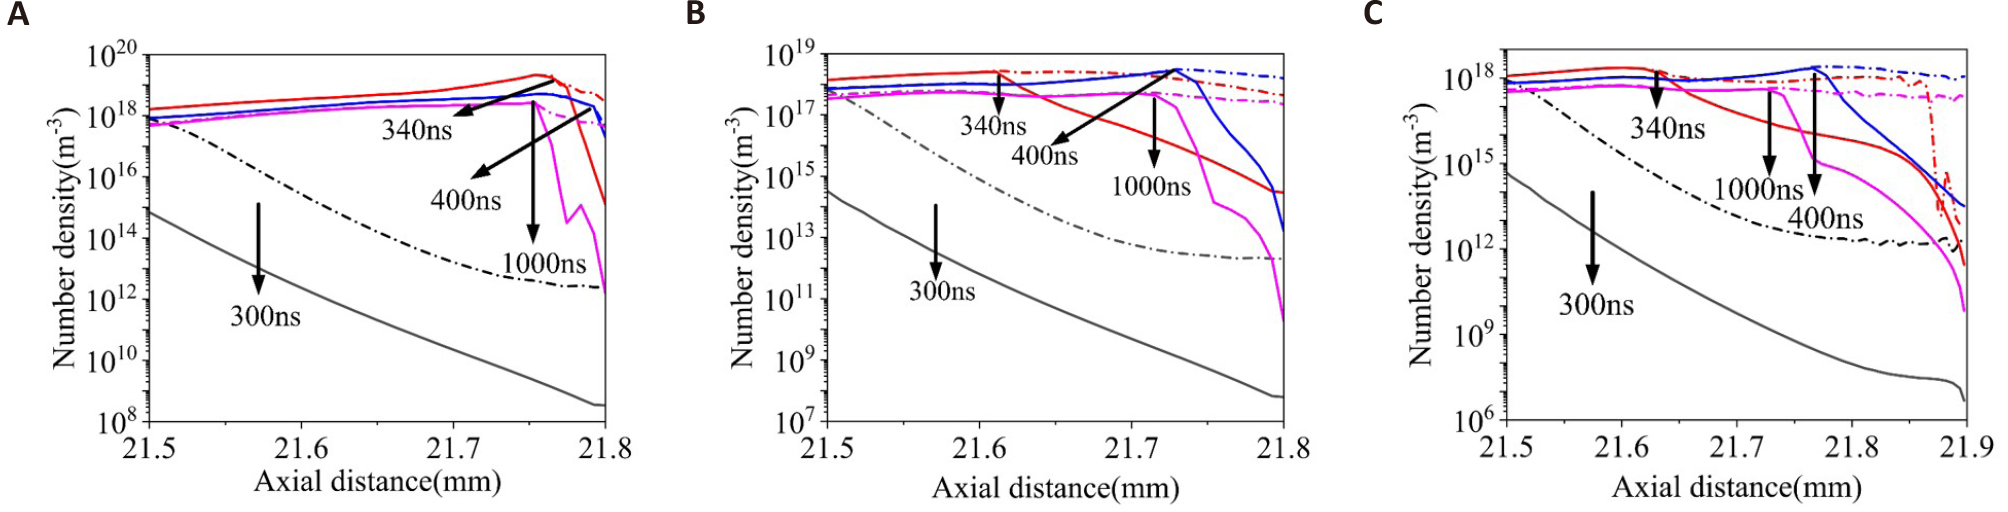
Figure 16. The axial distribution of the positive ion and the electron density on the (A) line 1 (protrusion), (B) line 2 (protrusion), and (C) line 3 (concavity) in Figure 12 at different moments.
|
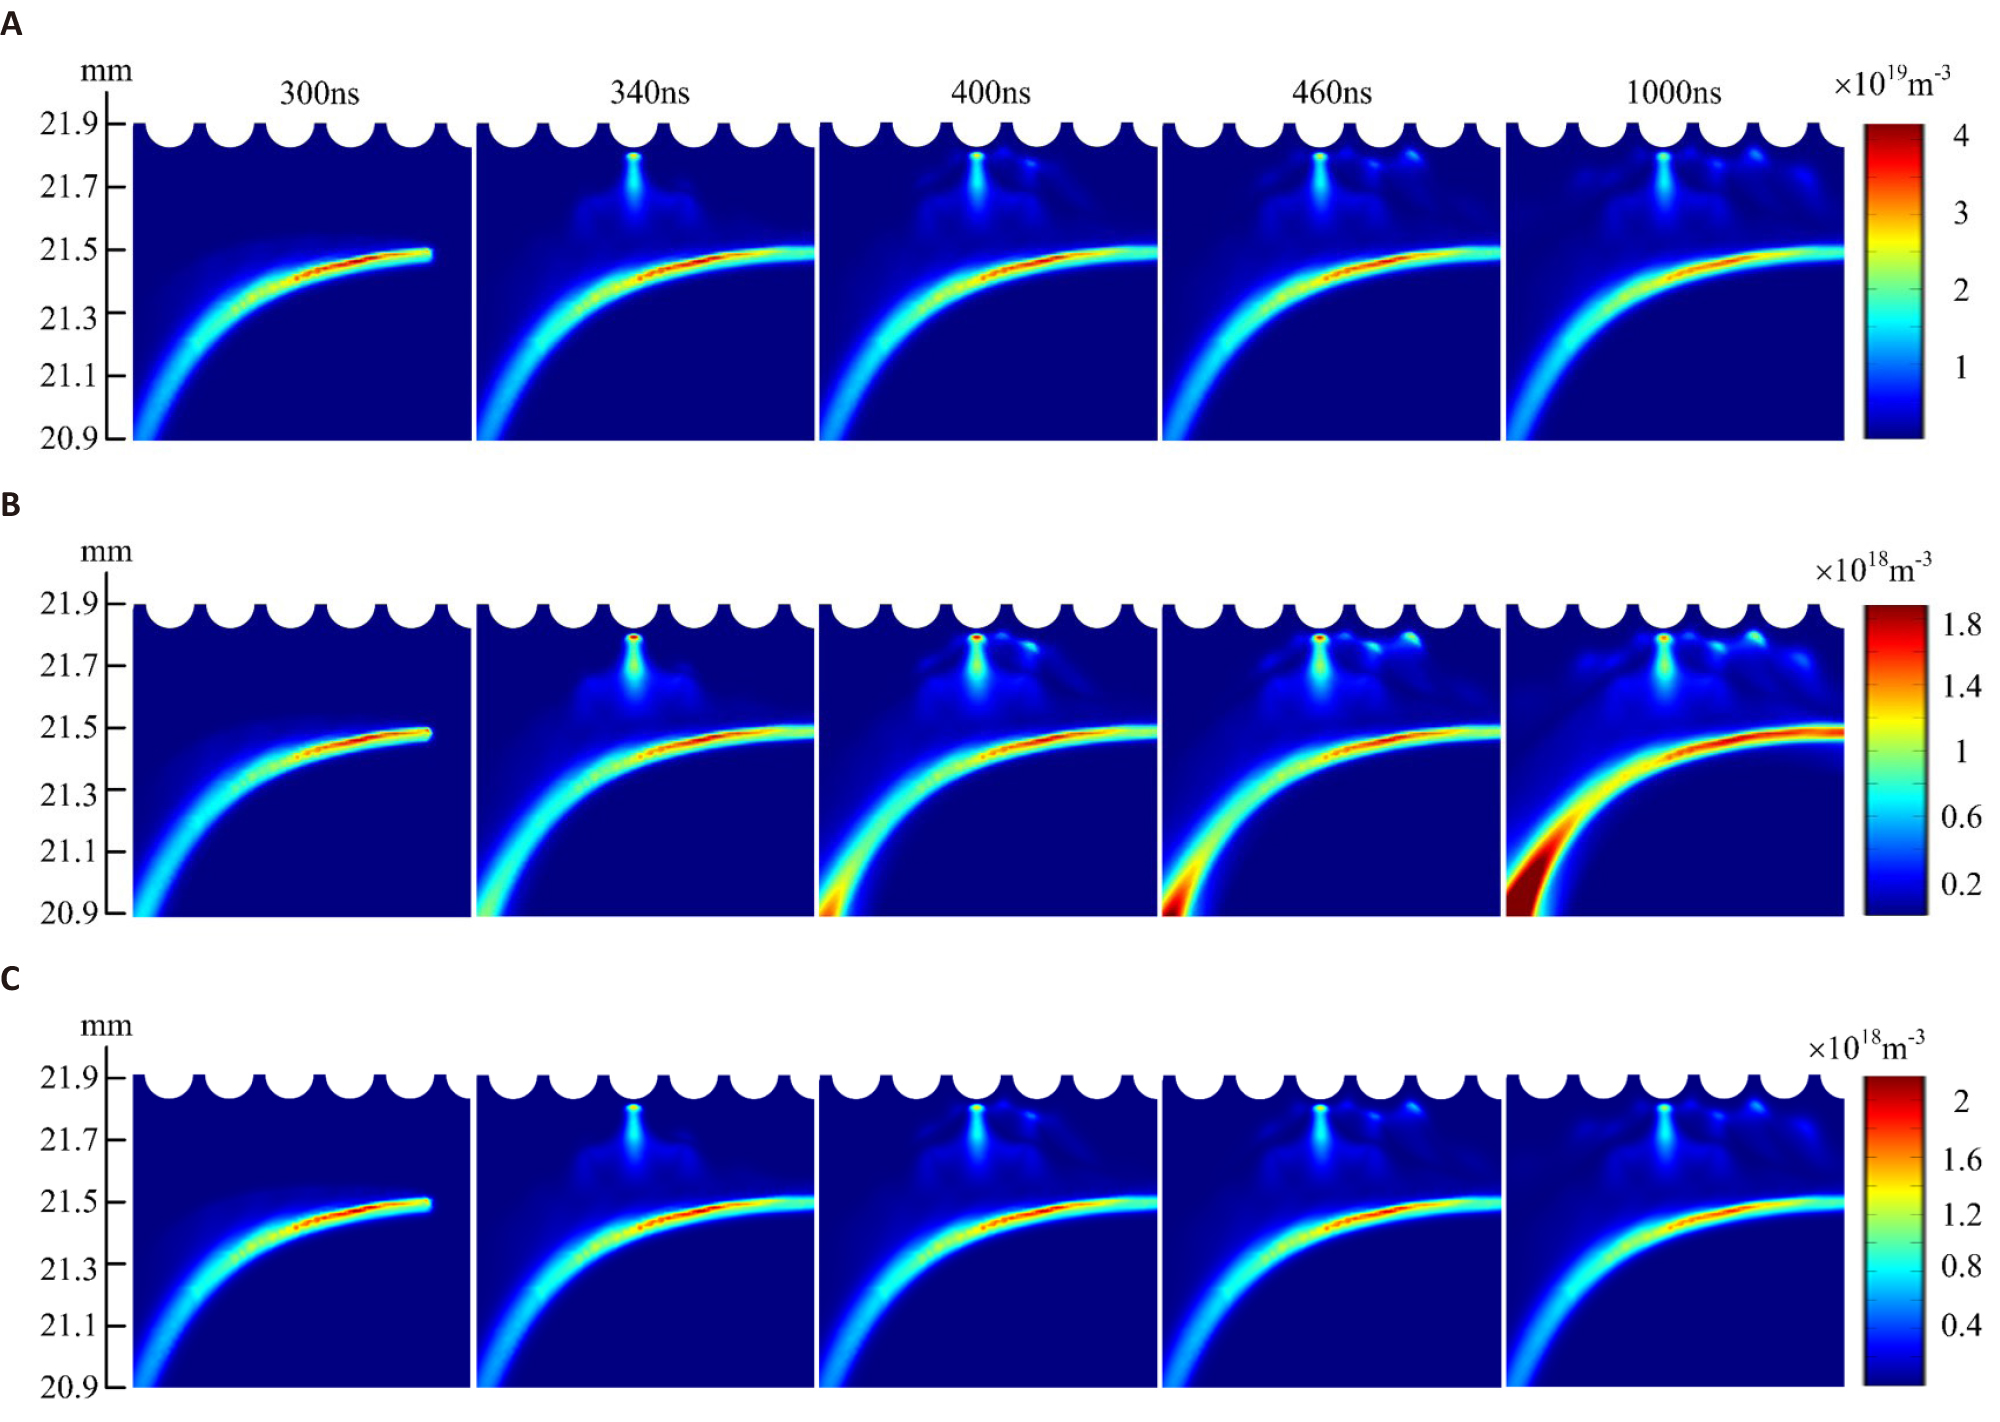
Figure 17. The spatial-temporal distribution of the density of the (A) O1d, (B) O2* and (C) N2* on the substrate surface.
|
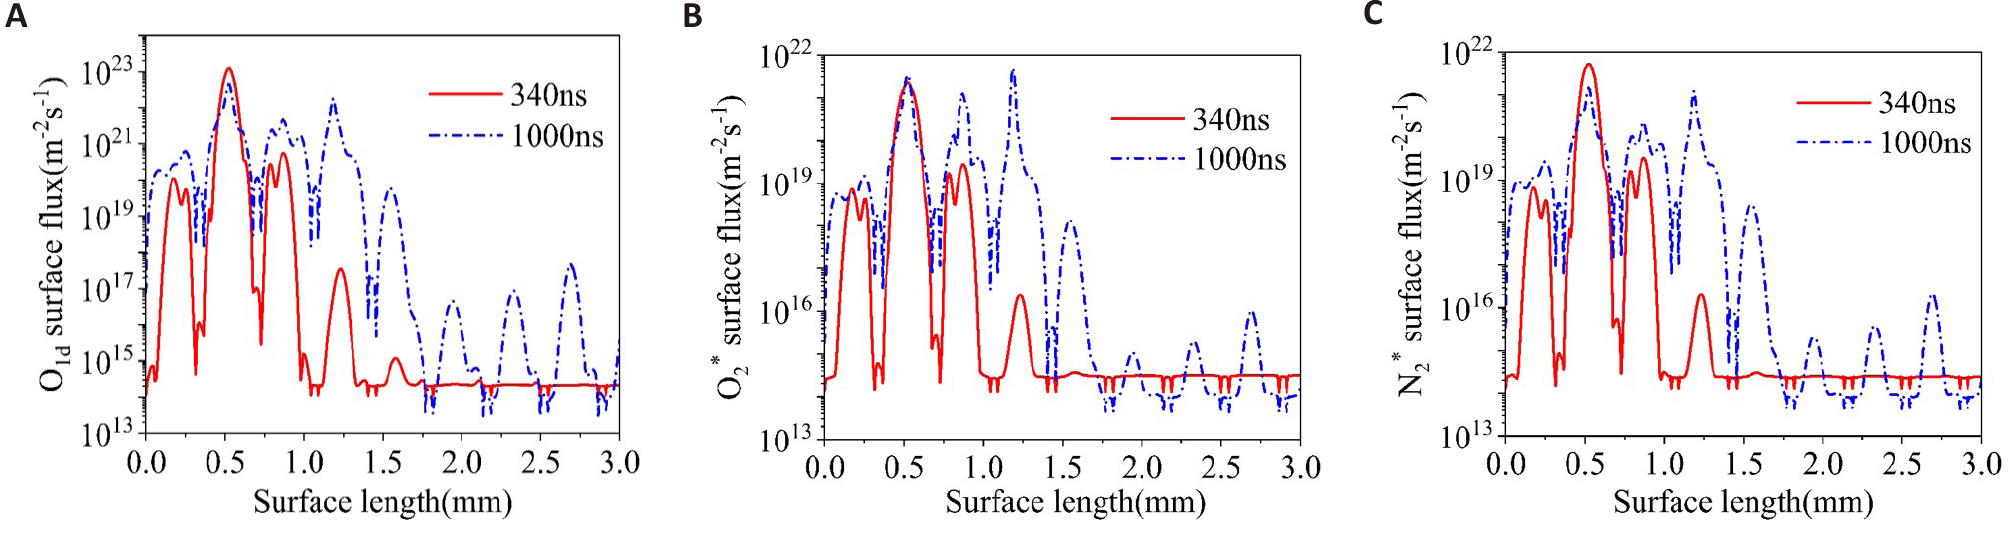
Figure 18. The fluxes of the (A) O1d, (B) O2* and (C) N2* onto the surface of the substrate as a function of surface length at different moments.
4 DISCUSSION
4.1 Characteristics of the Plasma Dynamics Near the Substrate
In this work, a two-dimensional distribution of the helium plasma jet impinging on substrates is established. During the propagation of the plasma in open space, the propagation velocity is on the order of 104-105m/s, and the electron density in the plasma column is about 1018-1019m-3. They agree well with the simulation and experimental results reported in references[38-40]. After the head of the plasma jet hits the substrate surface, the plasma spreads radially along the surface of the substrate, similar to the experimental observation of the surface discharge in previous work[19]. Importantly, this work focuses on the plasma dynamics near the substrate surface, including the spatial-temporal distribution of the electric field, the surface charges, and the plasma sheath near the substrate surface. After the plasma jet touches the substrate surface, the maximum electric field on the substrate surface increases up to 95kV/cm at a radial position of 1.2mm offset from the axis of symmetry, and while the electric field strength inside the substrate is greater than 10kV/cm; The surface of the substrate is charged positively, and the maximum surface charge density reaches about 8.26×10⁻⁵C/m2, which is close to the numerical results reported by Wang et al[41]. Moreover, if the relative permittivity is reduced to 2.1, the maximum electric field on the substrate surface decreases to 48.9kV/cm. The observation of the strong electric field on the substrate surface is probably due to the accumulation of the charges provided by the plasma jet and dielectric polarization. In addition, the plasma sheath presents after the contact between the plasma jet and the substrate. For example, the sheath thickness at the axial distance of 1.2mm is about 0.09mm at 340ns. As the radial distance increases, the sheath thickness decreases first and then increases after it reaches the minimum value at the radial distance of about 1.2mm. The plasma sheath's thickness decreases with the simulation time increase.
4.2 Effects of the Relative Permittivity
The effects of the relative permittivity of the substrate have been investigated in this work. When the relative permittivity increases from 2.1 to 11.7, the typical plasma parameters (such as the electric field, ionization rate, electron density, and the density of excited states) increase, while both the thickness of the plasma sheath and the radial propagation length decrease. Similar numerical results have been reported in references[37,38,41,42]. Wang et al.[41] found that the increase of relative permittivity leads to the increase of the electron density in the plasma column and the reduction of the radial propagation length on the substrate surface. Babaeva et al.[38] presented that the lower relative permittivity of the substrate results in a larger treatment area Norberg et al.[37] reported that as the relative permittivity increases, the electron density in the plasma column and the density of excited neutral species increases, and the area of the plasma spreading along the surface becomes smaller. In addition, it would like to note that the thickness of the plasma sheath is usually equal to several to tens of Debye length (λD) at high pressure. According to the Benilov[43], the relationship between the thickness of the plasma-wall sheath and the Debye length in collision-dominated plasma can be expressed by ![]() . Therefore, since the electron density increases with the growth of the relative permittivity of the substrate, the Deby length and the thickness of the plasma sheath decrease.
. Therefore, since the electron density increases with the growth of the relative permittivity of the substrate, the Deby length and the thickness of the plasma sheath decrease.
4.3 Effects of the Wavy Surface
A wavy surface of the substrate is adopted to study the effects of the surface morphology on the plasma dynamics and the production of chemical species. According to the dynamics of the plasma parameters, a surface ionization wave propagating along the protrusions of the substrate is observed. The electrons and the excited neutral species are mainly generated on the protrusions, instead of the concaves. Unlike the results reported by Ning et al.[21], no zigzag propagation behavior of the surface ionization wave is observed. The propagation velocity of the surface ionization wave is about 4×10³m/s, much lower than the propagation velocity of the plasma plume in Figure 3. In addition, the wavy distribution of the surface charge density and the flux of chemical species is observed, corresponding to the wavy structure of the surface. In other words, no plasma is generated inside the concaves. In real applications, when the samples with wavy structures are treated by plasma jets, the efficiency of the plasma treatment inside the concave is probably lower than that of the protrusions. This can be explained as follows: The plasma sheath always presents between the bulk plasma and the surface of the substrate during the interaction between the plasma jet and the substrate; The axial distribution of the positive ion and the electron density in Figure 7 shows that the thickness of the plasma sheath is about 130µm at 400ns, which is greater than the radius of the convexity and the width of the concave; Therefore, no plasma is generated inside the concave due to the space limitation. In order to generate plasma directly inside the concaves in this work, the electron density has to be increased further.
5 CONCLUSION
This work establishes a two-dimensional distribution of the helium plasma jet impinging on substrates. The plasma dynamics near the substrate surface are characterized by the spatial-temporal distribution of the electric field, the surface charge density, and the plasma sheath. When the tip of the plasma jet arrives at the substrate surface, the maximum electric field and the maximum surface charge density on the surface are 95kV/cm and 8.26×10⁻⁵C/m2, respectively. The minimum thickness of the plasma sheath is about 0.09mm. The observation of the strong electric field on the substrate surface is probably due to the accumulation of the charges provided by the plasma jet and the dielectric polarization.
The effects of the relative permittivity and the surface morphology of the substrate have been investigated in this work. When the relative permittivity increases, the electric field, the electron density, and the density of excited states near the substrate surface increase, but sheath thickness and the radial propagation length of the plasma on the surface decrease.
When a wavy surface of the substrate is used, a surface ionization wave slowly propagating along the protrusions of the substrate is observed. The electrons and the excited neutral species are mainly generated on the protrusions, rather than inside the concaves. In other words, no plasma is generated directly inside the concaves. This is probably because the thickness of the plasma sheath is greater than the convexity’s radius and the concave’s width.
From the application's point of view, higher substrate permittivity leads to higher plasma parameters, which benefits the production of electrons and chemical species. The lower permittivity of the substrate results in a larger area of the plasma propagating along the surface. On the other hand, to improve the treatment efficiency, the plasma is required to generate directly inside the concaves for the uneven surface of the substrate, leading to the demand for the high electron density of the plasma or the wide concaves. This work provides insight into the plasma dynamics near the substrate surface, which helps improve the plasma treatment efficiency and select the substrates in biomedical applications.
Acknowledgments
This work was supported by National Natural Science Foundation of China (No. 51977110).
Conflicts of Interest
There was no conflict of interest between the authors.
Author Contribution
Zhou BW contributed to investigation, visualization, writing-review and editing, data verification. Luo YX contributed to conceptualization, writing-original draft preparation, visualization. Xu QN contributed to data verification, analysis. Cheng H contributed to conceptualization, supervision. Wu SQ contributed to conceptualization, methodology, writing-review and editing, supervision, analysis.
Abbreviation List
APPJS, Atmospheric pressure plasma jets
LIF, Laser-induced fluorescence
2D, Two-dimensional
References
[1] Laroussi M, Bekeschus S, Keidar M et al. Low-temperature plasma for biology, hygiene, and medicine: perspective and roadmap. IEEE T Radiat Plasma, 2022; 6: 127-157. DOI: 10.1109/TRPMS.2021.3135118
[2] Cheng H, Xu JX, Li X et al. On the dose of plasma medicine: Equivalent total oxidation potential (ETOP). Phys Plasmas, 2020; 27: 063514. DOI: 10.1063/5.0008881
[3] Shaw P, Kumar N, Kwak HS et al. Bacterial inactivation by plasma treated water enhanced by reactive nitrogen species. Sci Rep, 2018; 8: 1-10. DOI: 10.1038/s41598-018-29549-6
[4] Lietz AM, Kushner MJ. Molecular admixtures and impurities in atmospheric pressure plasma jets. J Appl Phys, 2018; 124: 153303. DOI: 10.1063/1.5049430
[5] Wu S, Cao Y, Lu X. The state of the art of applications of atmospheric-pressure nonequilibrium plasma jets in dentistry. IEEE T Plasma Sci, 2015; 44: 134-151. DOI: 10.1109/TPS.2015.2506658
[6] Bekeschus S, von Woedtke T, Emmert S et al. Medical gas plasma-stimulated wound healing: Evidence and mechanisms. Redox Biol, 2021; 46: 102116. DOI: 10.1016/j.redox.2021.102116
[7] Weltmann K D, Kindel E, von Woedtke T et al. Atmospheric-pressure plasma sources: Prospective tools for plasma medicine. Pure Appl Chem, 2010; 82: 1223-1237. DOI: 10.1351/PAC-CON-09-10-35
[8] O’connell D, Cox LJ, Hyland WB et al. Cold atmospheric pressure plasma jet interactions with plasmid DNA. Appl Phys Lett, 2011; 98: 043701. DOI: 10.1063/1.3521502
[9] Graves DB. Reactive species from cold atmospheric plasma: implications for cancer therapy. Plasma Process Polym, 2014; 11: 1120-1127. DOI: 10.1002/ppap.201400068
[10] Keidar M, Yan D, Sherman JH. Cold plasma cancer therapy. Morgan & Claypool Publishers, Vermont, USA, 2019. DOI: 10.1088/2053-2571/aafb9c
[11] Cheng X, Sherman J, Murphy W et al. The effect of tuning cold plasma composition on glioblastoma cell viability. PloS one, 2014; 9: e98652. DOI: 10.1371/journal.pone.0098652
[12] Yan D, Xu W, Yao X et al. The cell activation phenomena in the cold atmospheric plasma cancer treatment. Sci Rep, 2018; 8: 1-10. DOI: 10.1038/s41598-018-33914-w
[13] Golda J, Held J, Redeker B et al. Concepts and characteristics of the ‘COST Reference Microplasma Jet’. J Phys D Appl Phys, 2016; 49: 084003. DOI: 10.1088/0022-3727/49/8/084003
[14] Xian YB, Zhang P, Lu XP et al. From short pulses to short breaks: exotic plasma bullets via residual electron control. Sci Rep, 2013; 3: 1599. DOI: 10.1038/srep01599
[15] Lu XP, Reuter S, Laroussi M et al. Nonequilibrium atmospheric pressure plasma jets: Fundamentals, diagnostics, and medical applications. CRC Press, USA, 2019. DOI: 10.1201/9780429053665
[16] Laroussi M. Cold plasma in medicine and healthcare: The new frontier in low temperature plasma applications. Front Phys-Lausanne, 2020; 8: 74. DOI: 10.3389/fphy.2020.00074
[17] Laroussi M. Low-temperature plasma jet for biomedical applications: a review. IEEE T Plasma Sci, 2015; 43: 703-712. DOI: 10.1109/TPS.2015.2403307
[18] Viegas P, Bourdon A. Numerical study of jet–target interaction: influence of dielectric permittivity on the electric field experienced by the target. Plasma Chem Plasma P, 2020; 40: 661-683. DOI: 10.1007/s11090-019-10033-6
[19] Abuzairi T, Okada M, Bhattacharjee S et al. Surface conductivity dependent dynamic behaviour of an ultrafine atmospheric pressure plasma jet for microscale surface processing. Appl Surf Sci, 2016; 390: 489-496. DOI: 10.1016/j.apsusc.2016.08.047
[20] Johnson MJ, Boris DR, Petrova TB et al. Spatio-temporal characterization of a pulsed DC atmospheric pressure plasma jet interacting with substrates. J Phys D Appl Phys, 2020; 54: 085202. DOI: 10.1088/1361-6463/abc502
[21] Ning W, Dai D, Li L. Atmospheric pressure plasma jet impinging on a wavy dielectric surface: effects of DC polarities. Plasma Sources Sci T, 2018; 27: 08LT01. DOI: 10.1088/1361-6595/aacfe2
[22] Yamada H, Sakakita H, Kato S et al. Spectroscopy of reactive species produced by low-energy atmospheric-pressure plasma on conductive target material surface. J Phys D Appl Phys, 2016; 49: 394001. DOI: 10.1088/0022-3727/49/39/394001
[23] Urabe K, Morita T, Tachibana K et al. Investigation of discharge mechanisms in helium plasma jet at atmospheric pressure by laser spectroscopic measurements. J Phys D Appl Phys, 2010; 43: 095201. DOI: 10.1088/0022-3727/43/9/095201
[24] Yonemori S, Ono R. Flux of OH and O radicals onto a surface by an atmospheric-pressure helium plasma jet measured by laser-induced fluorescence. J Phys D Appl Phys, 2014; 47: 125401. DOI: 10.1088/0022-3727/47/12/125401
[25] Yue Y, Pei X, Gidon D et al. Investigation of plasma dynamics and spatially varying O and OH concentrations in atmospheric pressure plasma jets impinging on glass, water and metal substrates. Plasma Sources Sci T, 2018; 27: 064001. DOI: 10.1088/1361-6595/aac618
[26] Cheng H, Maoyuan XU, Shuhui PA Net al. Interactions between multiple filaments and bacterial biofilms on the surface of an apple. Plasma Sci T, 2018; 20: 044006. DOI: 10.1088/2058-6272/aa9d7e
[27] Jánský J, Bourdon A. Surface charge deposition inside a capillary glass tube by an atmospheric pressure discharge in air. EPJAP, 2011; 55. DOI: 10.1051/epjap/2011100504
[28] Breden D, Miki K, Raja LL. Computational study of cold atmospheric nanosecond pulsed helium plasma jet in air. Appl Phy Let, 2011; 99: 111501. DOI: 10.1063/1.3636433
[29] Wu S, Lu X, Liu D et al. Photo-ionization and residual electron effects in guided streamers. Phy Pla, 2014; 21: 103508. DOI: 10.1063/1.4897393
[30] Breden D, Miki K, Raja LL. Self-consistent two-dimensional modeling of cold atmospheric-pressure plasma jets/bullets. Plasma Sources Sci T, 2012; 21: 034011. DOI: 10.1088/0963-0252/21/3/034011
[31] Boeuf JP, Yang LL, Pitchford LC. Dynamics of a guided streamer (‘plasma bullet’) in a helium jet in air at atmospheric pressure. J Phys D Appl Phys, 2012; 46: 015201. DOI: 10.1088/0022-3727/46/1/015201
[32] Naidis GV. Modelling of plasma bullet propagation along a helium jet in ambient air. J Phys D Appl Phys, 2011; 44: 215203. DOI: 10.1088/0022-3727/44/21/215203
[33] Hagelaar GJM, Pitchford LC. Solving the Boltzmann equation to obtain electron transport coefficients and rate coefficients for fluid models. Plasma Sources Sci T, 2005; 14: 722. DOI: 10.1088/0963-0252/14/4/011
[34] Liu XY, Pei XK, Lu XP et al. Numerical and experimental study on a pulsed-dc plasma jet. Plasma Sources Sci T, 2014; 23: 035007. DOI: 10.1088/0963-0252/23/3/035007
[35] COMSOL Multiphysics 5.5. Accessed 2023. Available at https://www.comsol.com
[36] Wu S, Lu X, Yue Y et al. Effects of the tube diameter on the propagation of helium plasma plume via electric field measurement. Phys Plasmas, 2016; 23: 103506. DOI: 10.1088/0963-0252/23/3/035007
[37] Norberg S A, Johnsen E, Kushner MJ. Helium atmospheric pressure plasma jets touching dielectric and metal surfaces. J Appl Phys, 2015; 118: 013301. DOI: 10.1088/0963-0252/23/3/035007
[38] Babaeva NY, Naidis GV, Tereshonok DV et al. Interaction of helium plasma jet with tilted targets: consequences of target permittivity, conductivity and incidence angle. Plasma Sources Sci T, 2021; 30: 115021. DOI: 10.1088/1361-6595/ac3212
[39] Wu S, Lu X, Pan Y. On the mechanism of acceleration behavior of plasma bullet. Phys Plasmas, 2014; 21: 073509. DOI: 10.1063/1.4890490
[40] Breden D, Raja LL. Computational study of the interaction of cold atmospheric helium plasma jets with surfaces. Plasma Sources Sci T, 2014; 23: 065020. DOI: 10.1088/0963-0252/23/6/065020
[41] Wang L, Zheng Y, Jia S. Numerical study of the interaction of a helium atmospheric pressure plasma jet with a dielectric material. Phys Plasmas, 2016; 23: 103504. DOI: 10.1063/1.4964482
[42] Martinez L, Dhruv A, Balaras E et al. On self organization: model for ionization wave propagation with targets of varying electrical properties. Plasma Sources Sci T, 2022; 31: 035004. DOI: 10.1088/1361-6595/ac4b67
[43] Benilov MS. The Child-Langmuir law and analytical theory of collisionless to collision-dominated sheaths. Plasma Sources Sci T, 2008; 18: 014005. DOI: 10.1088/0963-0252/18/1/014005
Copyright © 2023 The Author(s). This open-access article is licensed under a Creative Commons Attribution 4.0 International License (https://creativecommons.org/licenses/by/4.0), which permits unrestricted use, sharing, adaptation, distribution, and reproduction in any medium, provided the original work is properly cited.


