Plasma Generated in Hydrodynamic Cavitation Bubbles for the Preparation of Plasma Activated Water
Yunge Zhang1, Ming Zhu1, Jinxing Xie1, Yifan Huang1*
1Shenzhen Institute of Advanced Technology, Chinese Academy of Sciences, Shenzhen, China
*Correspondence to: Yifan Huang, PhD, Research Associate, Shenzhen Institute of Advanced Technology, Chinese Academy of Sciences, Shenzhen University Town, Xueyuan Avenue No.1068, Nanshan District, Shenzhen 518055, Guangdong Province, China; E-mail: yf.huang@siat.ac.cn
Abstract
Objective: In recent years, the medical applications of plasma activated water (PAW) have attracted growing interest. PAW can be prepared using plasma generated by hydrodynamic cavitation bubbles (HCB). To facilitate this application, the current study was performed to investigate the efficiency of plasma generation in HCB.
Methods: Based on the plasma generated in HCB, an experimental system has been constructed. We measured the characteristics of the cavitating flow, including pressure, temperature, and water flow rate, and estimated the system and cavitation power consumptions. High-speed images of cavitating flow were obtained to examine the evolution of the cavitation zone. Images of discharge emission at various velocities were captured to identify the location of electrodes. In addition, optical emission spectra were examined to determine the type of reactive species. H2O2 concentration and energy efficiency were measured and analyzed.
Results: In this experiment, the system power consumption was 1.2W. The highest cavitation power consumption was 50.4W and increased with the elevation of throat velocities. The processing findings of high-speed images revealed that the cavitation characteristic length was essential for plasma generation and was necessary for establishing the location of electrodes. In addition, the UV-Vis emission spectra of the plasma discharge demonstrated that the hydroxyl radical ·OH was formed in situ and that cavitation increased the yield of ·OH. H2O2 was the principal active component of PAW. Plasma generated in HCB produced H2O2 with a high energy efficiency of 77.0mol/kWh.
Conclusion: Plasma generated in HCB may provide a viable and cost-effective alternative method for PAW preparation.
Keywords: hydrodynamic cavitation, plasma, plasma activated water, hydroxyl radical, hydrogen peroxide
1 INTRODUCTION
Plasma activated water (PAW) has gained increasing attention for its application in the fields of medicine[1,2], food, and agriculture[3-5] in recent years. Plasma, generated in liquid or at the interface of liquid-gas, form reactive species (reactive oxygen species ROS or reactive nitrogen species RNS) into the water, thereby producing PAW. The gases and liquids used to generate plasma determine the type and concentration of the reactive species dissolved in PAW. Thus, the approach to prepare PAW is essential[4]. There are two methods of PAW preparation: one utilizes the interactions of gas plasma with solutions, while the other directly generates plasma in liquid[4,5]. The most prevalently studied approach is the interactions of gas plasma with solutions, particularly plasma discharge in contact with water, while direct generation of plasma in liquid has been scarcely reported. Researchers used external raw gas as media to directly generate plasma in liquid[6-8], in which plasma is generated inside bubbles or at the gas-liquid interface of bubbles. Therefore, this approach highly depends on the external gas supplement and the gas-liquid mixing mode. An innovative method using hydrodynamic cavitation bubbles (HCB) to substitute external gas has been provided.
Cavitation can be triggered in multiple ways[9], such as acoustic cavitation and hydrodynamic cavitation, which are commonly employed in the water treatment industry[10]. Hydrodynamic cavitation, which is generated by pressure gradients in water via varied reactor geometries[11], requires less energy and is more appropriate for large-scale use than acoustic cavitation[12,13]. The collapse of HCB generates huge temperature and pressure, which contributes to the production of -OH. As a result, cavitation can also promote the generation of PAW.
The method based on plasma generated in HCB has great potential, while relevant research is scanty. Treatment of E. coli cells with pulsed discharges with cavitation bubbles leads to the formation of reactive oxygen species (ROS) from the generated plasma, which decreases the viability of the cells and induces DNA damage in E. coli[14]. Ihara et al.[15] analyzed the impact of solution conductivity and discharge frequency of discharge plasma formed in HCB on water treatment efficiency. A nozzle-less structure reactor has been developed to increase the efficacy of plasma generated by HCB in water treatment[16]. Abramov et al.[17] investigated the efficacy of plasma generated in HCB as a flow-through water treatment method. Existing research on this approach has mostly focused on the process of disinfection and discharge, with little consideration of the impact of cavitation performance. Moreover, anodic oxidation, which causes secondary pollution and raises expenses, is also omitted in these studies.
The present paper investigated the influence of cavitation performance on the method based on the plasma generated in HCB. The plasma in this experiment was propelled using a system of dielectric barrier discharge. At various water velocities at the throat, high-speed cavitation and discharge emission pictures, plasma optical emission spectra, and the concertation of hydrogen peroxide H2O2 were analyzed. The experimental results provide critical data and references for engineering applications of the technology based on plasma created in HCB in the preparation of PAW.
2 MATERIALS AND METHODS
2.1 Equipment Setup
2.1.1 General Equipment
Figure 1 shows a schematic representation of the experimental setup. This system includes a hydrodynamic cavitation reactor (HCR) with discharge electrodes, a high-voltage pulse power source to generate plasma, two water tanks, and a booster pump, among other components. With the booster pump, water was pumped from tank A into tank B through the HCR. The maximum head and power of the booster pump were 40m and 1.5kW. The working power of the booster pump was appropriately adjusted with a frequency changer. The inner diameter of the cylindrical water pipe used in the experimental system was 12mm on the inside diameter. A turbine flow sensor was used to measure the amount of water flowing through the system (MIK-LWGY-DN10, MIKE, China). Two gauge pressure sensors (MIK-P300, MIKE, China) were fitted at both ends of the HCR to monitor the upstream pressure pup and downstream pressure pdown. The gauge pressure sensors were installed in the range of 0~1.0MPa. A temperature sensor (MIK-LWGY-DN10, MIKE, China) was installed near the water tank to monitor the temperature of the water.
1 |
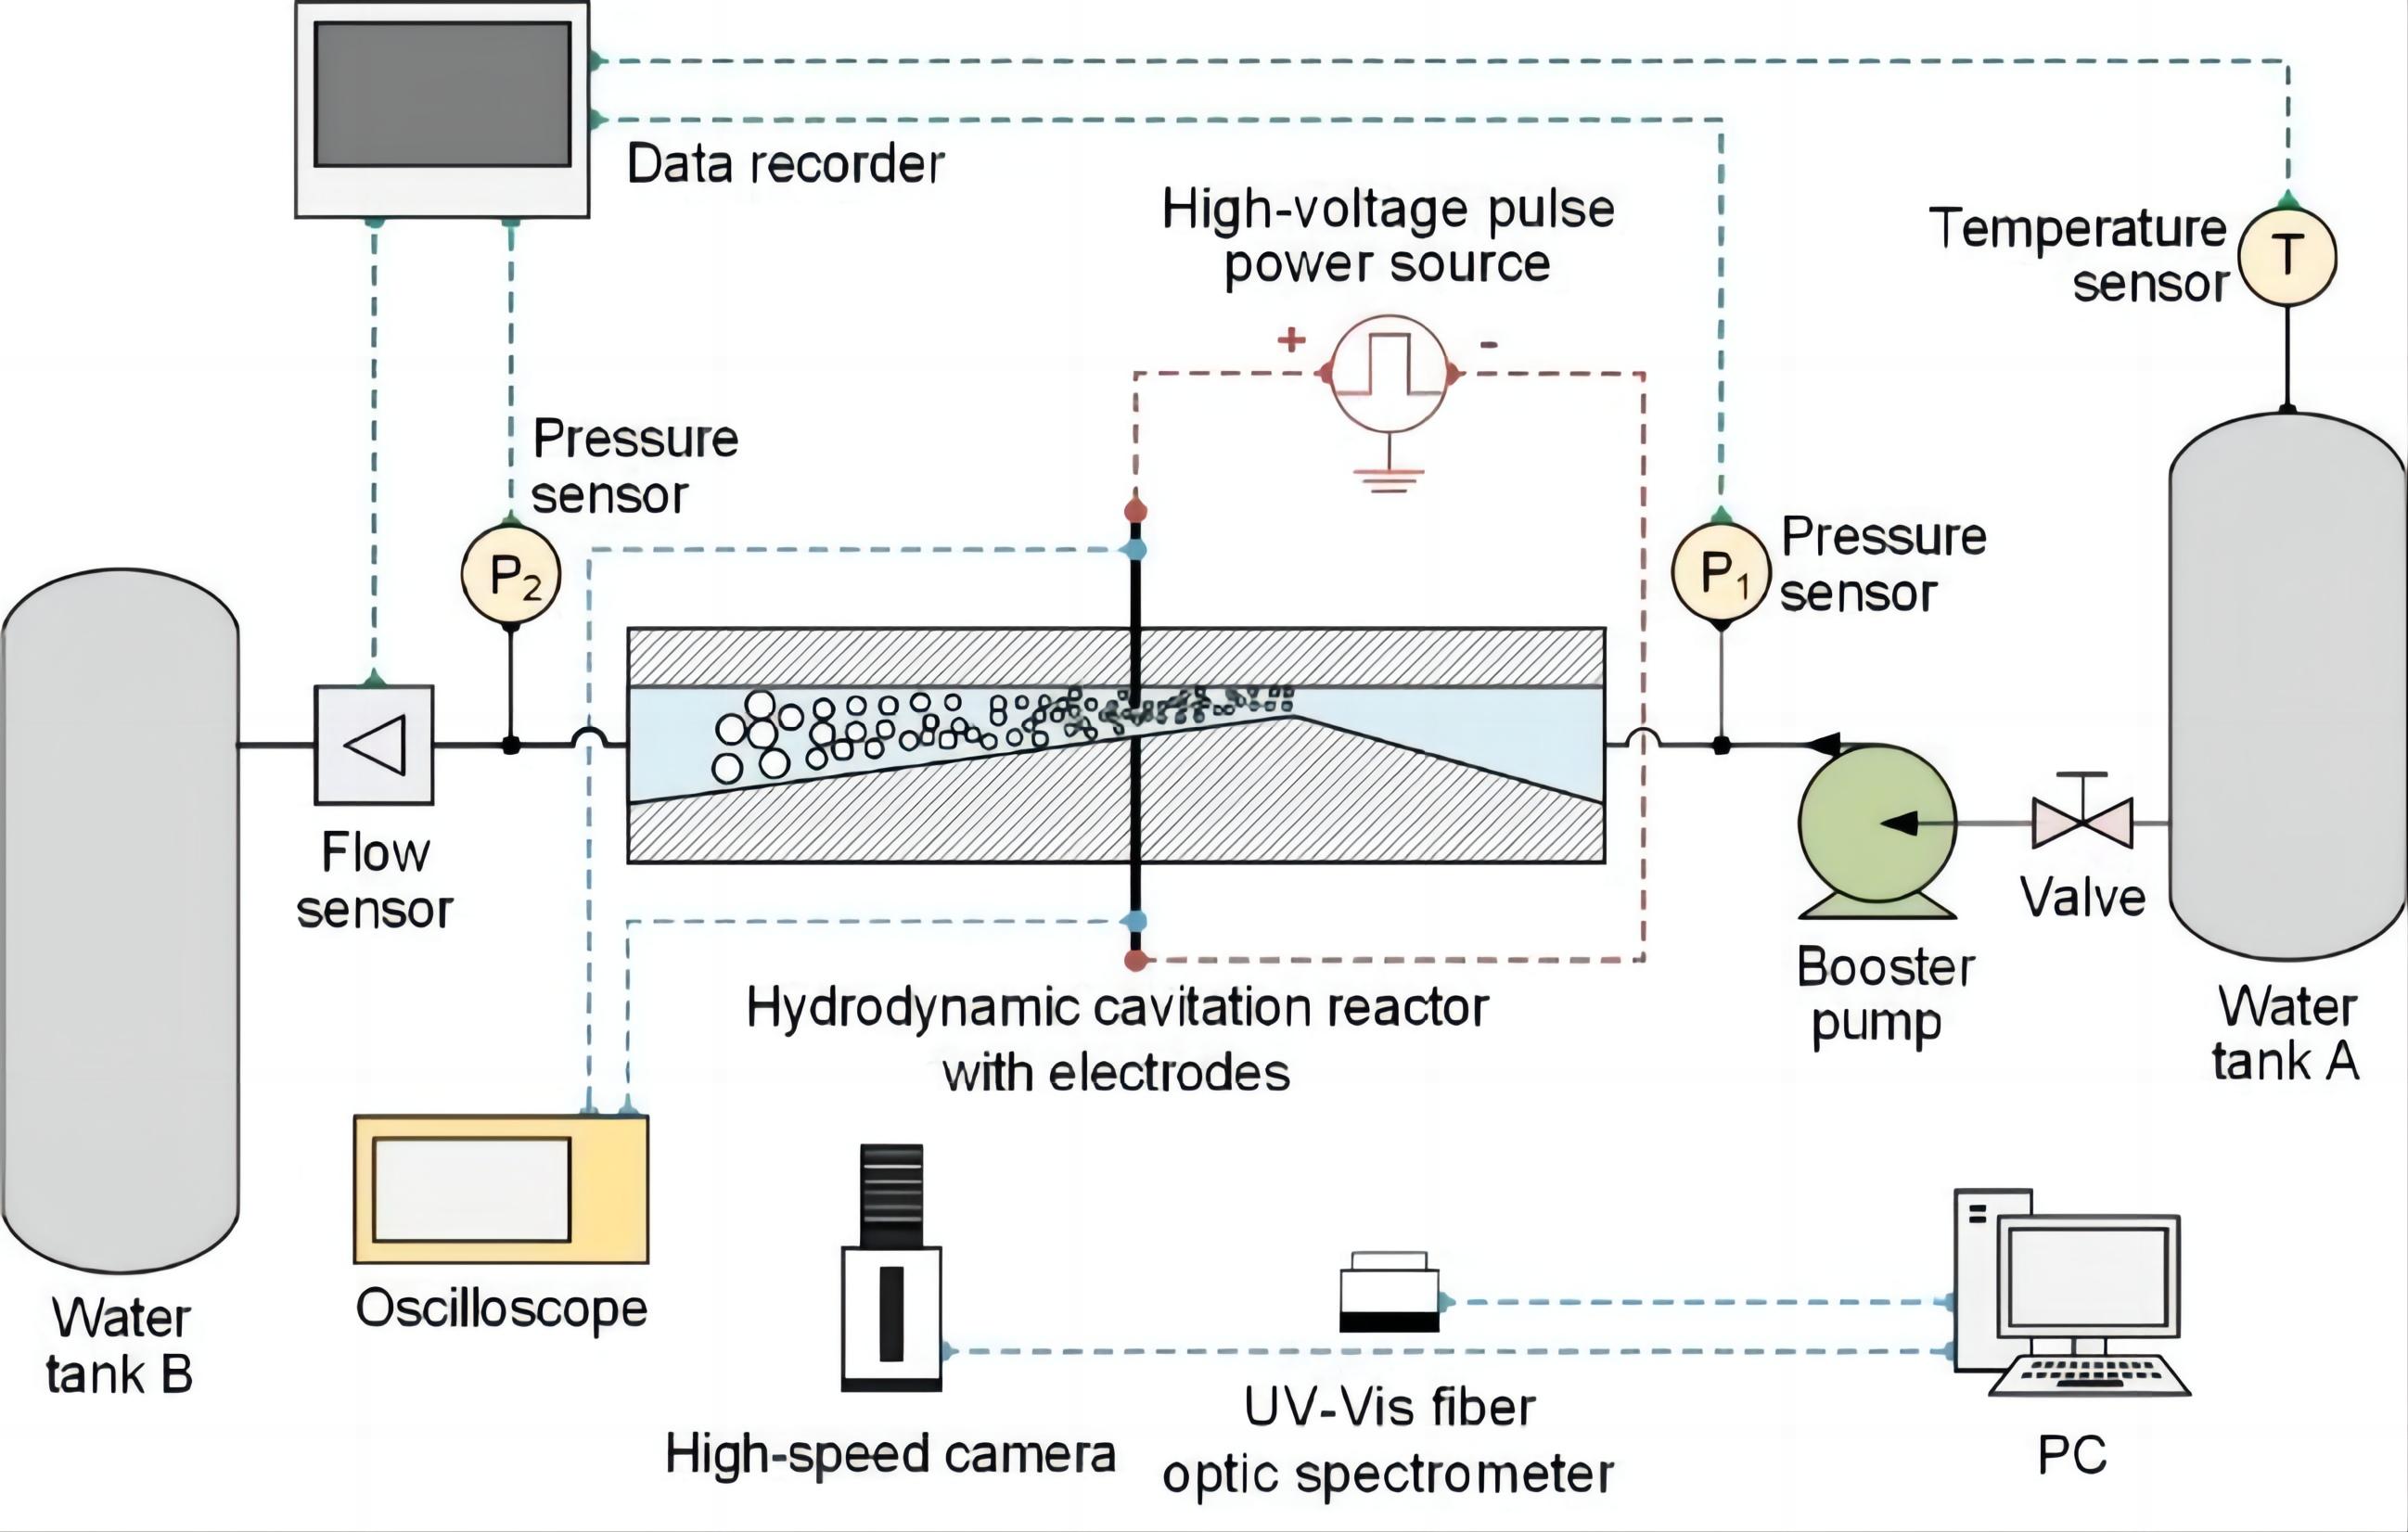
Figure 1. Schematic of the experimental system.
2.1.2 HCR
Figure 2 depicts the overall structure of the HCR, as well as the positions of the relevant electrodes. The HCR was constructed using 3D printing technology and was made of clear UV-curable resin. The HCR was placed horizontally in the experimental system. The inner geometric structure of HCR was similar to the Venturi tube. The HCR included three main components: the constriction part, the throat part, and the diffusion part. The length of constriction and diffusion were 10 and 50mm. The inlet and outlet diameters of HCR were 6mm, and the diameter of the throat of 1.5mm.
|
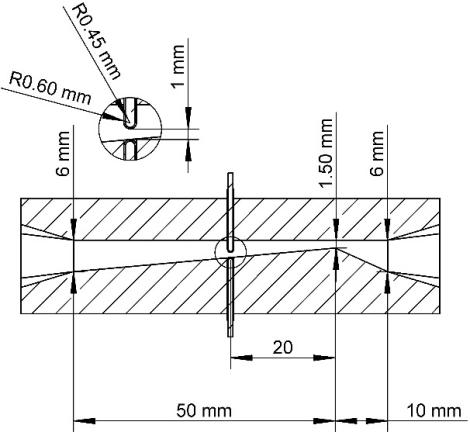
Figure 2. Structure of hydrodynamic cavitation reactor.
The inner geometric structure of HCR can change the pressure of liquid flowing into it. When liquid flows into the HCR, the pressure reduces with the decrease of the cross-section diameter of the constriction. The pressure will reach the minimum value in the throat part. Finally, the pressure of liquid will recover with the increase in the cross-section diameter of the diffusion. When the pressure of liquid is less than the saturated vapor pressure at the corresponding temperature, hydrodynamic cavitation emerges in the HCR.
2.2 High-Speed Images Capture and Post-Processing Method
A high-speed camera (MEMRECAM HX-7s, NAC, Japan) was utilized to capture high-speed images of cavitating flow. A high-power white LED was used to continually illuminate the cavitation flow from the backside. High-speed photos were taken with a frame rate of 2000 frames per second in this experiment. The post-processing technique was developed with reference to Tomov et al.[18] and Dular and Bachert[19]. All instantaneous images were normalized with a reference image. The reference image was taken at a flow rate where there was no cavitation. The normalization process can be summarized as follows:
|
where G, Gref, and Gn are grey level, reference grey level, and normalized grey level, respectively.
2.3 Plasma Generation and Measurement
The discharge reactor was primarily comprised of a pair of opposing tungsten needle electrodes that were each encased with a quartz glass tube (Figure 2). The diameter of the tungsten needle electrodes was 0.9mm. The inner and outer diameter of the quartz glass tube was 0.9mm and 1.2mm. The distance between the electrodes and the throat is adjustable. In this study, the distance was 20mm. On the bottom side, the electrode was parallel to the inner surface of the HCR. The distance between the tops of the two electrodes was 1mm.
To drive the discharge reactor, a homemade high-voltage pulse power source was employed. It can create positive high-voltage pulses with a frequency of around 50Hz. The typical waveforms of this study are depicted in Figure 3. The maximum voltage is approximately 2.0kV, and the maximum current is around 2.0mA. The instantaneous discharge voltage U(t) and discharge current I(t) were measured using a high-voltage probe (P6015A, Tektronix, US) and a current probe (MODEL 4418, PEARSON, US). An oscilloscope was used to record the waveforms of voltage and current (MDO3024, Tektronix, US). These discharge emission photos were produced by a digital camera with an exposure period of 1/40s and were taken with a flash (D40, Nikon, Japan).
|
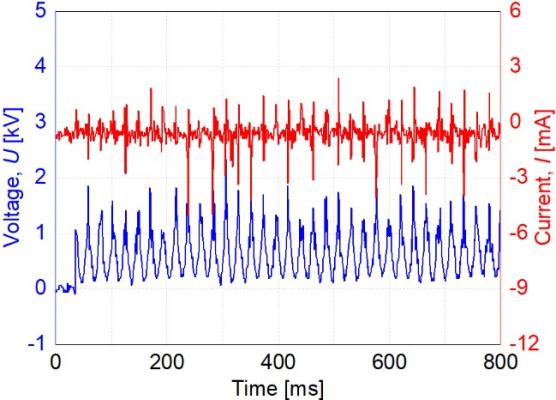
Figure 3. Typical waveforms of discharge voltage and current.
With an observation range of 200 to 740nm, UV-Vis spectra of plasma generated in HCR were collected using a UV-Vis fiber optic spectrometer (AvaSpec-MINI2048L-OEM, Avantes, Netherlands). The optical fiber was mounted on the HCR and directed toward the center of the discharge gap. Each of the three UV-Vis spectra was recorded, and the average was taken.
2.4 H2O2 Measurement
In each experiment, 5L of water was treated by the plasma at room temperature in a single procedure. Each treatment period was determined by the amount of water that flowed through the experimental system. Following plasma treatment, water samples were tested for residual H2O2 concentrations using an H2O2 colorimetric assay kit (E-BC-K102-S, Elabscience, China) and UV-Vis spectroscopy, followed by additional testing (A390, AOE, China). The reaction between residual H2O2 and ammonium molybdate may form a yellow complex, and the absorbance of the yellowish complex at 405nm was used to quantify the number of residual H2O2 in the solution. All tests were repeated at least thrice. The errors and average values were determined, and the results were depicted in the graphs below.
2.5 Parameters and Equations
The loss coefficient (lc), which is defined as follows, was used to quantify the pressure loss caused by HCR:
|
where vth denotes the water velocity in the throat and ρ denotes the water density. The potential for triggering cavitation is represented by the cavitation number σ, which is defined as:
|
where pref is the reference pressure, and pv is the saturation vapor pressure. In this paper, the reference pressure was denoted by the letter pdown. The cavitation power consumption Pc was calculated by subtracting the power loss across the HCR from the system power consumption Ps:
|
The average discharge power Pd was calculated using the following integral:
|
where T denotes the duration of the pulsed discharge and f denotes the frequency of the pulses. The following was used to calculate the energy efficiency (η; mol/kWh):
|
where AH represents the yield of H2O2, PT represents the total power consumption of plasma generation, and cH represents H2O2 concentration.
3 RESULTS AND DISCUSSION
3.1 Cavitation Power Consumption
Figure 4 depicts the loss coefficient lc as a function of the cavitation number σ. The lc was found to be a decreasing function of the σ. The trend of lc, on the other hand, was divided into two regions. The lc decreases significantly as the σ increases in the orange region. When compared to the orange region, the lc is mostly constant in the white region. The critical point of the two regions is 1.28, and the corresponding throat velocity is 12.2m/s. In the absence of cavitation, the pressure loss was determined by the inner geometry structure of HCR. As soon as the cavitation inception was reached, the cavitation power consumption Pc ramped up the power loss across the HCR, thereby increasing lc. Thus, cavitation was found to be the most important factor influencing lc. As a result, the orange region represents the cavitation area, while the white region represents the non-cavitation area.
|
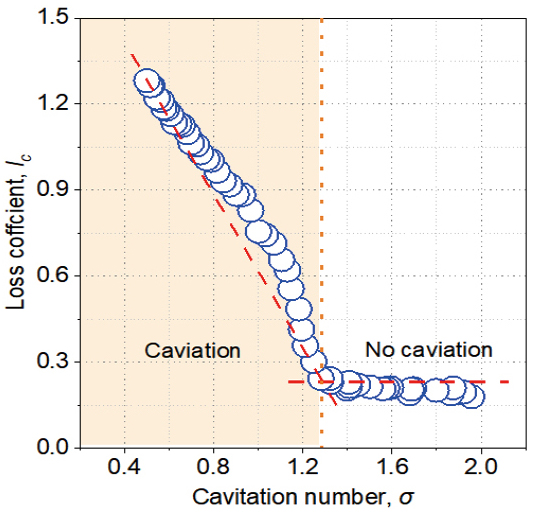
Figure 4. Loss coefficient with cavitation number.
The data gathered in the cavitation area (orange region) could be used to calculate the amount of Pc. Pc can be considered an indicator of the amount of cavitation present. The larger Pc denotes the higher intensity of cavitation.
According to equation (4) and the discussion above, the system and cavitation power consumption is calculated. The plot of the Pc in terms of vth is shown in Figure 5. Pc almost increases linearly with the vth increase. According to equation (3), the σ is inversely proportional to the square power of vth. Hence the increase of vth indicates the decrease of σ. As a result, the maximum cavitation power consumption Pc is 50.4W in this study, and the corresponding vth is 22.0m/s.
|
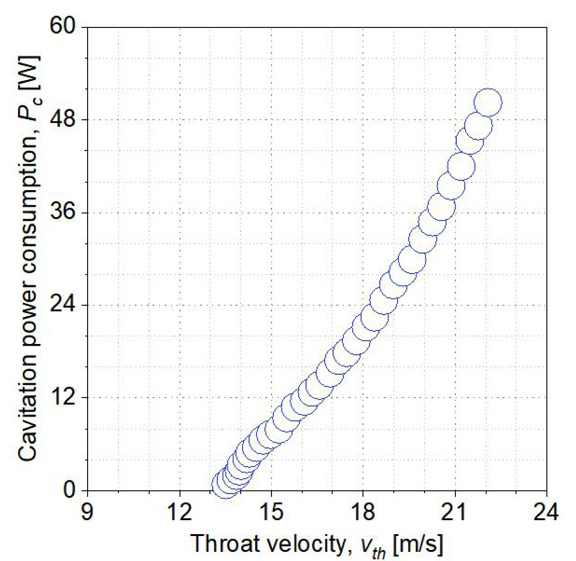
Figure 5. Cavitation power consumption with throat velocity.
3.2 The High-speed Images of Cavitating Flow
The system and high-speed photographs of cavitating flow are acquired and evaluated by equation (4) and the description above. The instantaneous photographs are captured at various throat velocities (vth=15.7, 17.4, 18.8, 20.4, and 22.0m/s), and the instantaneous photographs are captured at a frame rate of 2000f/s. The time-averaged value and standard deviation of 2000 instantaneous pictures are calculated using the post-processing approach mentioned above. Figure 6 shows the images of the time-averaged value and the standard deviation. A cloud of cavitation bubbles is represented by the white hue, while the pure liquid phase is represented by the black color. The time-averaged images may determine the proportion of frames in which cavitation is triggered at a certain spatial position, and the standard deviation images are available to identify the areas where cavitation varied dramatically over time[18]. In other words, the time-averaged images indicate the area where cavitation bubbles cloud occur, and the standard deviation images indicate the region where cavitation bubbles cloud change most frequently. Images of cavitation bubbles cloud-sheeted on the downside of the HCR are impacted by electrodes, as depicted by the time-averaged value and standard deviation images. Cavitation is incepted at the throat of HCR and spread downstream until cavitation bubbles collapse completely. The potential of cavitation increases dramatically with the elevation of vth. The higher vth increases the intensity of cavitation, and the white area thus expands in time-averaged images. The cavitation bubbles cloud collapse because of the pressure recovery downstream. The cloud of cavitation bubbles constantly changes due to factors, such as turbulence, vortex, re-entrant jet, and high-speed micro-jet. All these factors can be enhanced with the increase in cavitation intensity. Therefore, the white region expands and moves downstream with the increase of the vth.
|
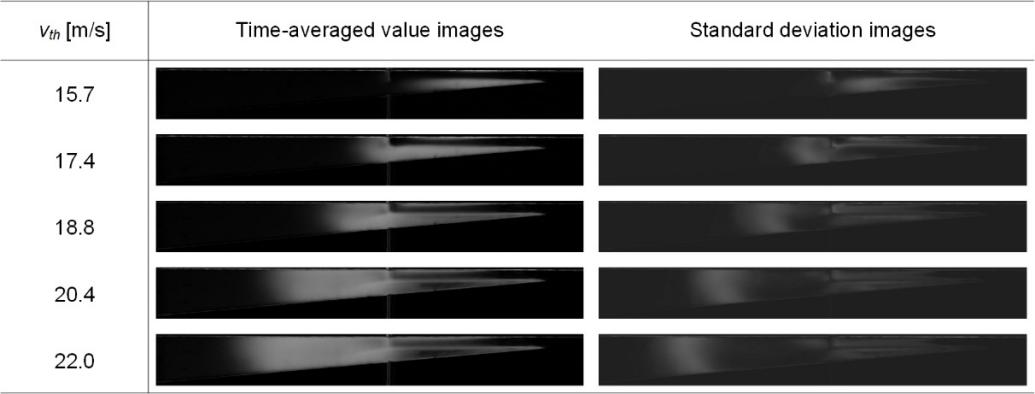
Figure 6. Average and standard deviation images of cavitating flow at different throat velocities.
Since cavitation bubbles were used as a dielectric in this study, the available area for plasma generation in the HCR must be determined. In this experiment, the characteristic cavitation length Lc was used as an indicator to quantify the area of the cavitation bubble cloud. The maximum value of standard deviation was used to denote the Lc. In other words, a cloud of cavitation bubbles may form within the Lc. Figure 7 illustrates the Lc at various vth. A larger Lc denotes a wider cavitation area, which also denotes the higher intensity of cavitation. The Lc increases as vth increases, and an equation is used to fit the Lc data (with an R-square value greater than 0.99). The fitting equation is as follows:
|
The Lc and vth have a linear relationship. When the vth is 12.2m/s, the cavitation bubble cloud fails to completely cover the electrodes. The cavitation bubbles cloud fills the discharge gap until the Lc exceeds the distance between the throat and the electrode. As a result, the maximum distance between the electrodes and the throat should be less than the Lc at the corresponding throat velocity.
|
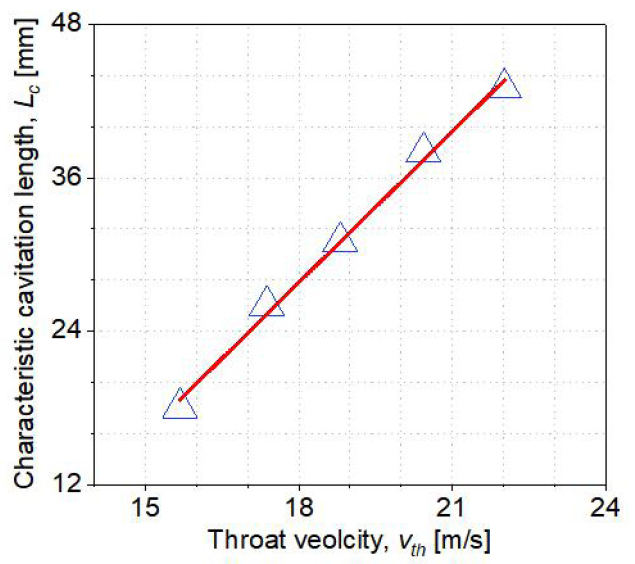
Figure 7. Cavitation characteristic length with throat velocity.
3.2 Discharge Emission
|
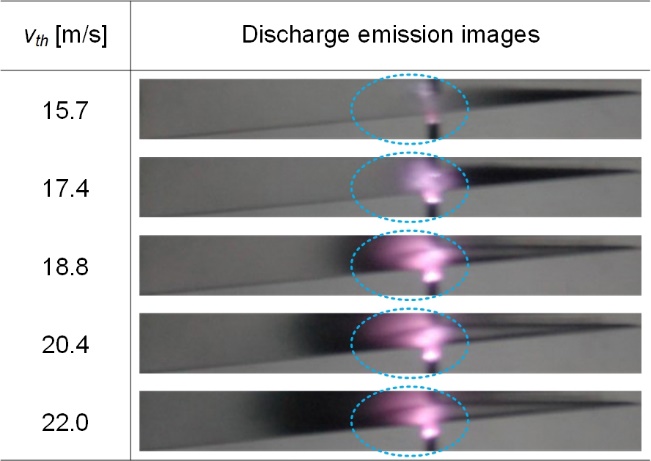
Figure 8. Images of plasma generated in HCB.
Figure 9 illustrates the optical emission spectrum as measured by a CCD spectrometer connected to an optical fiber. This experiment detected the ·OH A 2Σ+-X2∏ (0, 0) band (309nm), Hα (656nm), Hβ (486nm), and Hγ (434nm) as the Balmer atomic hydrogen lines. When radiation (including alpha and beta particles, gamma radiation, and other heavy particles) interacts with water, a variety of reactions may occur, including the overall decomposition of the water[20].
|
|
|
|
|
This process may also be attributed to the dissociation of individual water molecules in vapor as a result of collisions with energetic electrons generated by plasma[20,21]. The reaction chain for the formation of ·OH can be triggered by dissociative electron attachment.
|
The hydroxyl radical ·OH at 309nm is one of the most powerful oxidizing agents. It can instantly degrade surrounding organic pollution and kill harmful microorganisms without selecting them[22].·OH may serve as an intermediate in the reaction to induce chain reactions and promote the generation of various types of long-live active species. Figure 9 illustrates that plasma generated in HCB has the function of generating ·OH in situ without external raw gas supply.
|
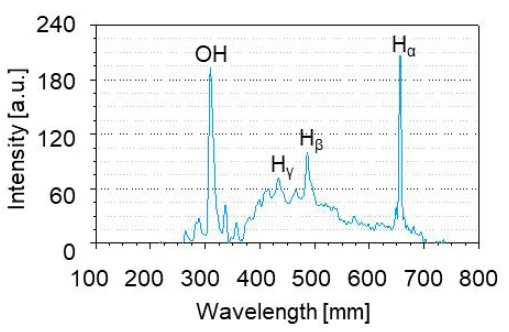
Figure 9. Optical emission spectra of plasma generated in HCB.
In addition, the increased intensity of cavitation results in cavitation bubbles that are smaller in size and have a greater cloud density than before. The behavior of plasma within a bubble is significantly influenced by the size of the bubble[23]. In other words, the incremental intensity of cavitation improves plasma generation efficiency. Thus, results from plasma optical emission spectra indicate that plasma generated in HCB can form ·OH in situ and that cavitation intensity can affect the yield of ·OH formation. Additionally, plasma optical emission spectra indicate that plasma generated in HCB can form ·OH in situ.
|
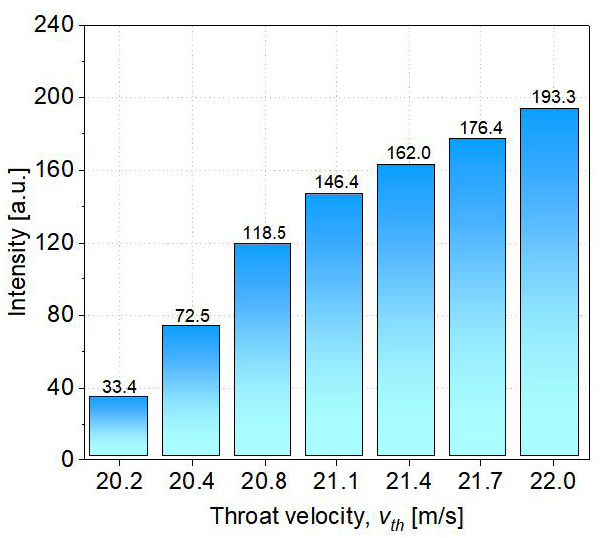
Figure 10. Relationship between the throat velocity vth and the relative intensity of the ·OH (309nm) spectral line.
3.4 H2O2 Concentration and Energy Efficiency
The H2O2 concentration and the energy efficiency of the PAW preparation method based on the plasma generated in HCB are critical factors when evaluating the method's potential. The concentration of H2O2 is available to determine the amount of OH present, while the application's value can be determined by its energy efficiency. Energy efficiency is calculated by equation (6). The variation in H2O2 concentration and energy efficiency as a function of increasing temperature is depicted in Figure 11. As the throat velocity increases, the concentration of H2O2 and the efficiency of energy conversion increase as well. The energy efficiency of H2O2 formation is proportional to the sum of the power consumed by cavitation and discharge. According to equation (5), the discharge power is 0.73W as a constant, whereas the cavitation power increases as the throat velocity increases, as shown in Figure 5. As a result, during the hydrodynamic cavitation process, the input power dissipates at an increasing rate.
|
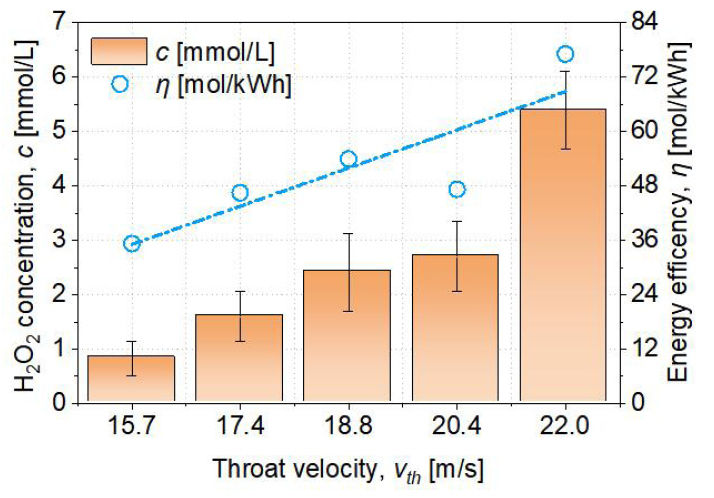
Figure 11. Relationship between the throat velocity and H2O2 concentration and energy efficiency influenced by throat velocity.
As shown in Table 1, this study compares the energy efficiency of H2O2 formation in water using low-temperature plasma generated in HCB to that of other plasma generation systems that have previously been reported[24]. Wang et al.[25] used air aeration to generate plasma in water and investigated the energy efficiency of H2O2 formation under a variety of experimental conditions, including peak pulse voltage, air flow rate, electrode gap, initial pH value, solution conductivity, and activated carbon. In addition to the reduction of the electrode gap and the increase of voltage and air flow rate, the addition of activated carbon significantly also boosts the formation of H2O2. The highest energy efficiency for H2O2 formation has shown to be 81.0mol/kWh in the presence of activated carbon, and 64.1mol/kwh in the absence of activated carbon. Liu et al.[26] used the Ar atmospheric pressure discharge plasma between a tungsten steel tube and an aqueous solution surface to form H2O2. Burlica et al.[27] determined the energy efficiency of H2O2 formation from pure water exposed to a nonthermal pulsed plasma-gliding arc reactor equipped with a spray nozzle.
Table 1. Comparison of H2O2 Formation by Various Plasma Generation Systems
System |
Energy Efficiency (mol/kWh) |
Ref. |
77.0 |
This study |
|
64.1 |
Wang et al.[25] |
|
0.5 |
Liu et al.[26] |
|
Plasma generated in water spray |
2.4 |
Burlica et al.[27] |
The energy efficiency of the plasma produced in HCB in the present study was extremely close to the most promising results in the literature. The high energy efficiency arises from the fact that hydrodynamic cavitation promotes the formation of ·OH and H2O2. Thus, plasma generated in cavitation bubbles may potentially provide a cost-effective alternative for the preparation of PAWs.
4 CONCLUSION
To summarize, the intensity of cavitation in low-temperature plasma generated in HCB with a dielectric barrier has a significant effect on the plasma: The higher the cavitation intensity, the more likely the plasma to be generated, and the more ·OH is formed. The amount of energy consumed by cavitation can be used to determine its intensity. Cavitation consumes more energy as the throat velocity increases. When the maximum distance between electrodes and the throat is no higher than the characteristic cavitation length at the corresponding throat velocity, HCB can generate plasma. The emission spectrum indicates that plasma generated in HCB can spontaneously generate the ·OH and that a high cavitation intensity produces a significant effect on the yield of ·OH. Cavitation power is a critical factor affecting the amount of energy consumed by plasma generated in HCB. A comparison of the energy efficiency of the low-temperature plasma generated in HCB to form H2O2 in water with the energy efficiency of other previously reported plasma systems to form H2O2 in water revealed an extremely high efficiency of the plasma generated in HCB. The maximum energy efficiency of plasma generated in HCB discovered in the present study is 77.0mol/kWh. Compared with other systems, plasma generated in HCB has higher energy efficiency. According to these findings, plasma generated in HCB may serve as a feasible method of H2O2 preparation. The variety of active species can be increased by changing the solution composition and injecting external gases in this method. Therefore, plasma generated in HCB provides a potentially feasible cost-effective approach to PAW preparation.
Acknowledgements
This work was supported by the National Natural Science Foundation of China [grant numbers 62001459], Shenzhen Science and Technology Research Funding [grant numbers, JCYJ20200109141003910, JCYJ20180507182200750].
Conflicts of Interest
The authors declared no conflict of interest.
Author Contribution
All authors contributed to the manuscript and approved the final version.
Abbreviation List
HCB, Hydrodynamic cavitation bubbles
HCR, Hydrodynamic cavitation reactor
PAW, Plasma activated water
ROS, Reactive oxygen species
References
[1] Lee CB, Seo IH, Chae MW et al. Effects of non-thermal plasma activated water on the anti-cancer immune activities of macrophages. Clin Plasma Med, 2018; 9: 31. DOI: 10.1016/j.cpme.2017.12.049
[2] Li Y, Song Z, Zhang T et al. Gene expression variation of Astragalus adsurgens pall. through discharge plasma and its activated water. Free Radical Bio Med, 2022; 182: 1-10. DOI: 10.1016/j.freeradbiomed.2022.02.016
[3] Kutlu SN, Canatan F, Güleç A. Plasma activated water for plasma medicine: 2018 medical technologies national congress (TIPTEKNO), Magusa, Cyprus, 08-10 November 2018. Magusa, Cyprus: IEEE; 2019. DOI: 10.1109/TIPTEKNO.2018.8596950
[4] Zhou R, Zhou R, Wang P et al. Plasma-activated water: generation, origin of reactive species and biological applications. J Phys D Appl Phys, 2020; 53: 303001. DOI: 10.1088/1361-6463/ab81cf
[5] Thirumdas R, Kothakota A, Annapure U et al. Plasma activated water (PAW): Chemistry, physico-chemical properties, applications in food and agriculture. Trends Food Sci Tech, 2018; 77: 21-31. DOI: 10.1016/j.tifs.2018.05.007
[6] Ma S, Lee S, Kim K et al. Purification of organic pollutants in cationic thiazine and azo dye solutions using plasma-based advanced oxidation process via submerged multi-hole dielectric barrier discharge. Sep Purif Technol, 2021; 255: 117715. DOI: 10.1016/j.seppur.2020.117715
[7] Zhang T, Zhou R, Wang P et al. Degradation of cefixime antibiotic in water by atmospheric plasma bubbles: Performance, degradation pathways and toxicity evaluation. Chem Eng J, 2021; 421: 127730. DOI: 10.1016/j.cej.2020.127730
[8] Zhou R, Zhang T, Zhou R et al. Underwater microplasma bubbles for efficient and simultaneous degradation of mixed dye pollutants. Sci Total Environ, 2021; 750: 142295. DOI: 10.1016/j.scitotenv.2020.142295
[9] Sun X, Liu J, Ji L et al. A review on hydrodynamic cavitation disinfection: The current state of knowledge. Sci Total Environ, 2020; 737: 139606. DOI: 10.1016/j.scitotenv.2020.139606
[10] Agarkoti C, Thanekar PD, Gogate PR. Cavitation based treatment of industrial wastewater: A critical review focusing on mechanisms, design aspects, operating conditions and application to real effluents. J Environ Manage, 2021; 300: 113786. DOI: 10.1016/j.jenvman.2021.113786
[11] Gągol M, Przyjazny A, Boczkaj G. Wastewater treatment by means of advanced oxidation processes based on cavitation-A review. Chem Eng J, 2018; 338: 599-627. DOI: 10.1016/j.cej.2018.01.049
[12] Loraine G. Liquid oxidation: Hydrodynamic cavitation for cost effective oxidation. Filtr Separat, 2007; 44: 16-18. DOI: 10.1016/S0015-1882(07)70281-1
[13] Agarkoti C, Gogate PR, Pandit AB. Comparison of acoustic and hydrodynamic cavitation based hybrid AOPs for COD reduction of commercial effluent from CETP. J Environ Manage, 2021; 281: 111792. DOI: 10.1016/j.jenvman.2020.111792
[14] Kudo K, Ito H, Ihara S et al. Quantitative analysis of oxidative DNA damage induced by high-voltage pulsed discharge with cavitation. J Electrostat, 2015; 73: 131-139. DOI: 10.1016/j.elstat.2014.10.010
[15] Ihara S, Sakai T, Yoshida Y et al. Fundamental characteristics of discharge plasma generated in a water cavitation field. J Electrostat, 2018; 93: 110-117. DOI: 10.1016/j.elstat.2018.04.004
[16] Ihara S, Nishiyama H, Matsunaga T et al. Improving the efficiency of a water-treatment system based on water cavitation and plasma using a nozzle-less reactor. AIP Adv, 2019; 9: 045005. DOI: 10.1063/1.5092296
[17] Abramov VO, Abramova AV, Cravotto G et al. Flow-mode water treatment under simultaneous hydrodynamic cavitation and plasma. Ultrason Sonochem, 2021; 70: 105323. DOI: 10.1016/j.ultsonch.2020.105323
[18] Tomov P, Khelladi S, Ravelet F et al. Experimental study of aerated cavitation in a horizontal venturi nozzle. Exp Therm Fluid Sci, 2016; 70: 85-95. DOI: 10.1016/j.expthermflusci.2015.08.018
[19] Dular M, Bachert R. The issue of strouhal number definition in cavitating flow. J Mech Eng, 2009; 55: 666-674.
[20] Locke BR, Shih KY. Review of the methods to form hydrogen peroxide in electrical discharge plasma with liquid water. Plasma Sources Sci T, 2011; 20: 034006. DOI: 10.1088/0963-0252/20/3/034006
[21] Aoki H, Kitano K, Hamaguchi S. Plasma generation inside externally supplied Ar bubbles in water. Plasma Sources Sci T, 2008; 17: 025006. DOI: 10.1088/0963-0252/17/2/025006
[22] Gligorovski S, Strekowski R, Barbati S et al. Environmental Implications of Hydroxyl Radicals (•OH). Chem Rev, 2015; 115: 13051-13092. DOI: 10.1021/cr500310b
[23] Xiong R, Nikiforov AY, Vanraes P et al. Characteristics of an underwater direct current discharge in bubbles and the temperature distribution in the bubbles. Phys Plasmas, 2012; 19: 023501. DOI: 10.1063/1.3680615
[24] Wandell RJ, Wang H, Tachibana K et al. Nanosecond pulsed plasma discharge over a flowing water film: Characterization of hydrodynamics, electrical, and plasma properties and their effect on hydrogen peroxide generation. Plasma Processes Polym, 2018; 15: 1800008. DOI: 10.1002/ppap.201800008
[25] Wang H, Guo H, Wu Q et al. Effect of activated carbon addition on H2O2 formation and dye decoloration in a pulsed discharge plasma system. Vacuum, 2016; 128: 99-105. DOI: 10.1016/j.vacuum.2016.03.015
[26] Liu J, He B, Chen Q et al. Direct synthesis of hydrogen peroxide from plasma-water interactions. Sci Rep, 2016; 6: 38454. DOI: 10.1038/srep38454
[27] Burlica R, Shih KY, Locke BR. Formation of H2 and H2O2 in a water-spray gliding arc nonthermal plasma reactor. Ind Eng Chem Res, 2013; 52: 13516. DOI: 10.1021/ie402767f
Copyright © 2023 The Author(s). This open-access article is licensed under a Creative Commons Attribution 4.0 International License (https://creativecommons.org/licenses/by/4.0), which permits unrestricted use, sharing, adaptation, distribution, and reproduction in any medium, provided the original work is properly cited.


