
Assessment of Inventory Management for Profitability in the Energy Sector: A Case Study of Nigerian Power Distribution Asset Companies
Tayo P. Ogundunmade1*, Yahaya T. Olawale2, Ganiyu Kabir Adewale2
1Department of Statistics, University of Ibadan, Ibadan, Nigeria
2Department of Statistics, The Polytechnic of Ibadan, Ibadan, Nigeria
*Correspondence to: Tayo P. Ogundunmade, PhD, Department of Statistics, University of Ibadan, Oduduwa Road, Ibadan, Oyo 200132, Nigeria; Email: ogundunmadetayo@yahoo.com
DOI: 10.53964/mem.2025004
Abstract
Introduction: There are many different energy distribution companies (DisCos) in Nigeria's power sector. The distribution of power to millions of customers nationwide is the responsibility of these companies. These companies frequently encounter major inventory management challenges despite the enormous demand for power. Such inefficiencies have a detrimental effect on these companies' overall profitability since they can lead to both monetary losses and operational disruptions.
Objective: This study investigates the impact of inventory management on operational costs, revenue generation, and overall financial sustainability.
Method: The dataset consists of three DisCos that were chosen to represent the energy sector in Nigeria. Among the businesses are Abuja Electricity Distribution Company, Ibadan Electricity Distribution Company, and Eko Electricity Distribution Company. Key factors required for evaluating inventory management procedures and their effect on profitability in the Nigerian oil sector are included in the dataset. The variables employed are location, revenue, cash flow, capital cost, year, city, and operational cost. Using a variety of quantitative methods, the examination of inventory management and its effect on profitability in the Nigerian energy sector was carried out. Regression analysis, sensitivity analysis, break-even analysis, and data envelope analysis (DEA) are some of these techniques.
Results: According to the break-even analysis, some Nigerian power companies would find it difficult to turn a profit if revenue growth is not matched by rising capital and operating expenses. According to the DEA ratings, several businesses were performing well regarding revenue creation, capital use, and operational cost control. In contrast, some companies were discovered to be inefficient.
Conclusion: These findings suggest that as power DisCos experience revenue growth, they are often required to increase their investment in infrastructure, equipment, and other capital expenses.
Keywords: distribution, generation, power, electricity, inventory management
1 INTRODUCTION
The energy sector plays a pivotal role in the economic development of any nation. In Nigeria, it is no different. The power distribution sub-sectors form the backbone of the country's industrialization, economic growth, and social well-being. However, the sector has faced numerous challenges in ensuring efficient energy delivery and profitability, with inventory management being one of the key areas affecting financial performance.
Inventory management is a crucial aspect of the operations of any industry, but its importance is even more pronounced in the energy sector, where it directly impacts supply chain efficiency, cost control, and overall profitability. In power DisCos, inventory includes the materials, equipment, and spare parts necessary for generating and distributing electricity. This inventory is essential for the smooth operation of the energy infrastructure, ensuring that plants are operational and that distribution networks function without disruptions.
The Nigerian power sector comprised of numerous electricity distribution companies (DisCos). These companies are responsible for distributing electricity to millions of consumers across the country. Despite the immense demand for power, these companies often face significant obstacles related to inventory management. These challenges include poor stock control, inefficient procurement practices, inadequate storage facilities, and lack of real-time data to track inventory levels. Such inefficiencies can result in both financial losses and operational disruptions, negatively impacting the overall profitability of these firms.
The Nigerian power sector has undergone various reforms, especially since the privatization of the electricity distribution and generation companies in 2013. The aim of these reforms was to improve the operational efficiency of the sector and make it more attractive to private investors. However, despite these efforts, the sector continues to struggle with persistent inefficiencies and challenges. These include inadequate infrastructure, a growing demand for electricity, financial instability, poor technical capabilities, and weak regulatory frameworks.
As reported[1], the Power Holding Company of Nigeria operated in a maintenance-like environment that was primarily concerned with providing continuous support for the operations of a single unit, plant, or fleet or group of components, as well as ensuring that operational requirements were met. Inventory control was clearly a critical component of maintenance activities that necessitated the use of spare parts demand forecasts, as was evident. The result was that both Capital and Operational Spare parts had to be kept on hand in order to protect the operations from unwelcome, and sometimes costly, stock outs. In the majority of situations, the inability to obtain spare parts resulted from a lack of a good maintenance culture or from unanticipated outages, which prolonged the downtime of the equipment. The cause of irregular power supply outages may be due to deteriorating infrastructure or failures in power generating plants, but it has been highlighted that inadequate inventory management is a significant contributor to the problem due to the rising fluctuation of demand. This will result in the need for greater safety stock and insurance spares in order to maintain a minimum needed service level, necessitating the use of a well-planned, reliability-centered inventory.
For the purpose of checking the stochastic demand for spare parts and inventory optimization in order to determine the average number of backorders, a decision support simulation model has been constructed. In order to develop a general simulation life cycle, which included the Intelligence Phase, the Managerial Phase, the Development phase, the Quality Assurance phase, the Implementation Phase, and the Operation/Maintenance/Archival Phase, it was necessary to first define what a simulation life cycle was. It is critical that a Reliability Centered Maintenance Strategy be implemented, which includes tools such as Failure Mode, Effects and Criticality Analysis, optimization studies, Reliability/Availability and maintainability studies, Root Cause Analysis, and other similar techniques, in order to determine the need for Consumables, Capital, and Operational Spare Parts inventory management and stock levels.
According to Ayansola OA et al[2], who looked at how inventory management techniques affected the business operations of flour milling companies in Nigeria, "there have been cases of materials overstocking which eventually became expired or out of date, understocking, a lack of stock-taking, theft of materials by workers, and a delay in the delivery of materials into the organizations, among other things." It found that working capital, which includes inventories, accounts for approximately 50% of the total assets of a majority of manufacturing firms[3-5]. When such a large amount of working capital is invested in inventory, it has a negative impact on the company's operational performance and profitability. If you look closely, you will see that some Business Managers lack the necessary skillsets or technical knowledge to ensure efficient Inventory Management. There is a requirement for organizations to maintain minimum, ordering, hastening, and maximum stock levels at their facilities[6,7]. According to Kaitafi AI[8], the majority of Nigerian manufacturing enterprises were still relying on outdated methods of inventory control and valuation, which were deemed ineffective and unsophisticated.
When it comes to inventory carrying costs in the electric and gas utility industry, Scott Madden Management Consulting believes that management's responsibility includes optimizing actual shareholder return on assets and ensuring that such regulated revenue is not earned on unnecessary or obsolete assets. Also confirmed is that inventory in excess of that required to meet a defined "level of service" is "surplus" inventory and should be deleted because holding such inventory diminishes actual revenue. For a number of reasons, such as establishing economic order quantities, figuring out lot sizes, conducting price break analysis, deciding whether to manufacture to order or produce to stock, analyzing lifetime buys, assessing supplier promotional offers, assessing vendor-managed inventory opportunities, conducting inventory risk analysis, and calculating inventory carrying costs, it is crucial to create a calculation of inventory carrying costs.
The goal of inventory replenishment is to guarantee that there is enough product on hand to fulfill predicted demand while maintaining a defined level of service. The level of service specifies the minimum amount of inventory availability that must be maintained. In most cases, this is expressed as a percentage of the time the part is available for usage when it is required. Inventory is said to be optimized when it is kept on hand at all times to the extent that it is only necessary to meet the defined service level requirements. As a result of this viewpoint, inventory reduction is not a desirable goal in and of itself. Inventory optimization, on the other hand, is important.
Inventory holding costs differ significantly from industry to industry. Estimates for median carrying costs ranged from 21.8 percent to 12.3 percent of total inventory value, with the average carrying cost estimated at 12.3 percent. Scott Madden's extensive experience working with utilities, as well as its comprehensive understanding of the main performance levers in the supply chain, provide us with a clear lens through which to examine efficiency and effectiveness. Carrying costs in the range of 10 percent to 15 percent are more prevalent in the utility industry, according to our experience. My belief is that a number of issues are contributing contributors to the increase in inventory. Inventory Complexity, Warehouse Space and Staffing, Turnover Rate, and a slew of other intriguing topics will be considered in this analysis.
The impact of the MYTO Tariff Review on the flow of private investment into the Nigerian electricity supply industry was examined by Ado A[9]. The study looks at how MYTO affects the flow of private capital to NESI. Data from a sample of respondents was gathered using questionnaires. The study made use of primary data. The study employed simple regression analysis.
Ado A et al looked into the evaluation of Nigeria's private sector funding of electrical infrastructure[10]. The study aimed to identify the causes of the industry's sluggish private sector investment flow. The study generated data for analysis by distributing Likert scale structured questionnaires to top management of privately licensed companies. For data analysis, several regressions were employed. Bongani K et al looked into the function of regulation in South Africa's capital infrastructure investment in electricity distribution[11]. Both primary and secondary data are used in the investigation. 16 Energy Regulator officials who are in charge of evaluating and approving applications for electricity distributor tariffs were interviewed in order to gather primary data for the study. Using a sample of 112 South African energy distributors, secondary data was gathered and examined. The study used correlation analysis to examine the relationship among the variables. Stenner K et al Investigated Australian consumers likely response to cost-reflective electricity pricing. Logic of research techniques was used by the researchers[12]. A sample and survey procedure were used to collect the primary data.
Adeoye S investigate cost-reflective pricing and governance in the energy sector in West Africa. The descriptive statistical method was employed[13]. The regulator provided the secondary data that was used. There is no need to estimate parameters or use inferential statistical techniques to test the hypothesis because this methodology is deemed appropriate based on actual electricity supply costs and income data from the Nigerian Electricity Supply Industry. The marginal cost of delivering one kWh of energy to end customers is known as the unit cost of electricity provision. In the Nigerian electricity supply industry, this cost varies by region and for each DisCo. The study used descriptive statistical technique. Hiroaki N investigated the liberalization models and electric power pricing in developing nations[14]. To estimate the effect of the liberalization model on the price of electric power, he employed an instrument variable technique. The simultaneity bias issues between the chosen liberalization models and the price of electricity were resolved by this method. Panel data from 78 nations across four regions developed countries, Asian developing countries, the former Soviet Union and Eastern Europe, and Latin America during the years 1985–2003 were used to create these econometric models.
Timothé B carried out a study on Assessing the impact of residential load profile changes on electricity distribution utility revenues under alternative rate structures the researcher used descriptive analysis technique[15]. Secondary data were employed for the study. Using data from a comparative example in the electricity industry, Susana AB investigate the disparate effects of revenue increases and cost reductions on investors' assessment of growth prospects[16]. In order to accomplish this goal, they examine how stock prices are affected in a comparative instance of direct foreign investment that involves the purchase of two distinct growth alternatives, the value of which has previously been thoroughly examined in earlier research. The investigator employed descriptive methods.
Namrata C carried out research on one price do not fit all. An analysis of the variations in home electricity pricing elasticity in India[17]. The Ministry of Statistics and Program Implementation's National Sample Survey Office conducted household consumer spending surveys that the researcher used, Government of India (National Sample Survey Office, 2017) for data on electricity use and the household characteristics. The NSS are nationally representative surveys based on a multi-stage, stratified sampling design in which villages or urban blocks are systematically sampled from Census enumeration areas. Anosike NB carried out research on the analysis of the Nigerian Electricity Generation Pricing Model[18]. To supplement the limited information on power plant performance and operation in Nigeria, thermodynamic modeling and simulation of an open cycle gas turbine were conducted. A probabilistic approach based on Monte Carlo simulation performed in commercial software was used to do sensitivity analysis. The analysis was conducted using secondary data.
In South Africa, Maphosa M investigated the trade-offs between cost-reflective and pro-poor tariffs[19]. One important point that the study aims to address is how the electrical industry can effectively draw in both domestic and global investors without necessarily compromising governmental goals like universal access to electricity. The study employed descriptive analysis. The study made use of both primary and secondary data.
Research was done by Robert P on creating demand-charged power network rates that are more cost-reflective[20]. The first step in their analysis is a visual evaluation of the cost-reflectiveness of a certain demand charge network tariff. In terms of matching customer bills with their contribution to network peak demand, they find it to have low cost-reflectivity when applied to a typical demand charge network tariff proposal within the Australian National Electricity Market and actual consumption data from 3,876 households in Sydney.
Sanusi O looked at cost analysis and spatial planning for extending access to power for everyone in Nigeria[21]. This study presents cost estimates for attaining universal energy access in Nigeria by 2030 and determines the most cost-effective electrification supply option (grid, mini-grid, and/or off-grid) using a spatial power planning model known as the "Network Planner (NP)".
This study will also investigate the impact of inventory management on operational costs, revenue generation, and overall financial sustainability. It will consider how poor inventory control affects the companies’ operational efficiency, increases costs, and diminishes revenue opportunities. Furthermore, the study will assess the relationship between inventory practices and the companies’ ability to respond to fluctuations in demand and supply chain disruptions, which are common in the Nigerian energy sector.
2 METHODS AND MATERIALS
2.1 Data
The dataset includes three companies (three DisCos) selected to represent the Nigerian energy sector. The companies include Eko Electricity Distribution Company, Ibadan Electricity Distribution Company and Abuja Electricity Distribution Company. The dataset underwent rigorous cleaning and validation processes to ensure accuracy, consistency, and reliability.
The data used for this study were collected from secondary sources, including publicly available financial reports, industry publications, and databases relevant to the Nigerian power distribution sectors. These sources provided comprehensive information on the operational and financial performance of three power DisCos over the period from 2017 to 2022. The dataset comprises key variables necessary for assessing inventory management practices and their impact on profitability within the Nigerian energy sector. The variable used are Year, City, Capital Cost, Cash Flow, Revenue, Operational Cost, and Location. The comprehensive dataset forms the foundation for the exploratory data analysis, modeling, and interpretation of results in this study, enabling a detailed examination of the relationship between inventory management practices and profitability in the Nigerian energy sector.
2.2 Methods
The analysis of inventory management and its impact on profitability in the Nigerian energy sector was conducted using a combination of quantitative techniques. These methods are the regression analysis, sensitivity analysis, break-even analysis and Data Envelopment Analysis (DEA). These methods provided comprehensive insights into the relationships between variables, efficiency levels, and profitability trends. The following analytical methods were employed.
2.2.1 Regression Analysis
Regression analysis is used to examine the relationship between dependent and independent variables. In this study, multiple regression models are employed to analyze the impact of various factors such as revenue, operational cost, and cash flow on capital cost. Specifically, regression analysis helps to determine how changes in these independent variables are likely to affect the capital cost, which is a key measure of profitability for power generation and DisCos. By quantifying these relationships, regression analysis allows for the prediction of capital costs based on changes in key financial indicators.
2.2.2 Sensitivity Analysis
Sensitivity analysis assesses how the uncertainty in the output of a model can be attributed to changes in the input variables. In the context of this study, sensitivity analysis is employed to determine how sensitive capital costs are to variations in key financial variables such as revenue, operational costs, and cash flow. By adjusting one variable at a time while holding the others constant at their mean, the study evaluates the effect of these fluctuations on capital costs.
For example, when predicting capital costs, the study examines how increasing revenue or cash flow impacts capital expenditures and whether these changes positively or negatively influence financial performance. Sensitivity analysis is particularly useful for understanding the potential risks associated with fluctuations in these variables and provides insights into the stability of capital cost predictions under different scenarios. It enables the identification of critical factors that should be closely monitored for effective inventory management and financial planning.
2.2.3 Break-Even Analysis
Break-even analysis is a financial tool used to determine the point at which a company's total revenue equals its total costs, meaning there is no profit or loss at this stage. This analysis identifies the minimum level of output or sales needed to cover the company's fixed and variable costs. In this study, break-even analysis is used to assess the relationship between capital costs and revenue generation in Nigerian power companies, helping to identify the sales volume or operational scale required to avoid losses.
The break-even point is calculated by examining the fixed and variable costs associated with inventory management and the revenue generated by the companies. This method is particularly important for assessing the profitability thresholds that companies must meet to sustain operations. By conducting break-even analysis, the study can highlight the financial risks associated with low revenue or high operational costs and offer recommendations for achieving financial stability through better inventory management practices.
2.2.4 Data Envelopment Analysis
DEA is a non-parametric method used to assess the relative efficiency of decision-making units (DMUs) such as companies or departments. DEA compares the performance of multiple companies based on various input and output variables. In this study, DEA is applied to evaluate the efficiency of power generation and DisCos in managing their inventory. The method uses multiple inputs, such as operational cost and cash flow, to assess the output, which is typically measured in terms of profitability and revenue generation.
DEA calculates an efficiency score for each company, identifying those that are performing optimally and those that may be underperforming. Companies that operate on the "efficient frontier" are considered to be using their resources in the most effective manner, while those that are not on the frontier may have room for improvement in inventory management practices. By identifying inefficient practices, DEA helps in benchmarking the performance of different companies and offers insights into how underperforming companies can optimize their inventory and operational strategies to improve profitability.
3 RESULTS AND DISCUSSIONS
EDA is an essential step in understanding the underlying patterns, relationships, and distributions within a dataset. For this study on the assessment of inventory management for profitability in the Nigerian energy sector, several EDA techniques were employed to gain insights from the data and inform further analysis. The following types of EDA were performed.
3.1 Descriptive Statistics
Descriptive statistics were computed for each of the key variables in the dataset. This provided basic insights into the central tendency (mean, median), variability (standard deviation, range), and distribution of the variables. A summary table was created to present these statistics, allowing for a quick understanding of how variables such as Revenue, Operational Cost, Capital Cost, and Cash Flow behave across the different companies and years (Table 1).
Table 1. Descriptive Statistics for DisCos
Variables |
Mean |
Median |
St. Dev. |
Min |
Max |
Capital Cost |
240,461,352,444.000 |
171,529,673,500 |
173,111,493,515.000 |
88,899,991,000 |
604,537,204,000 |
Cash flow |
12,341,234,833.000 |
10,380,923,500 |
7,404,056,282.000 |
1,544,730,000 |
30,020,399,000 |
Revenue |
124,396,533,222.000 |
132,598,463,500 |
50,422,503,616.000 |
65,715,312,000 |
255,987,711,000 |
Operational Cost |
112,044,846,000.000 |
116,543,880,000 |
34,976,601,931.000 |
35,535,546,000 |
186,384,954,000 |
The capital cost for the power DisCos averages 240.46 billion Naira, with a high standard deviation of 173.11 billion Naira, indicating significant variability in capital investments across the years. The median value of 171.53 billion Naira is lower than the mean, which points to a right-skewed distribution where the higher values of capital cost are pulling the mean upward. This suggests that certain years witnessed large capital expenditures, affecting the overall average.
For cash flow, the average of 12.34 billion Naira, with a standard deviation of 7.4 billion Naira, reveals considerable fluctuation in the financial performance of the DisCos. The range, from a minimum of 1.54 billion Naira to a maximum of 30.02 billion Naira, further highlights the wide disparities in the financial conditions of the companies over the study period. The median value of 10.38 billion Naira being close to the mean suggests a relatively symmetrical distribution of cash flow across the years.
Revenue for DisCos averages 124.4 billion Naira, with a standard deviation of 50.42 billion Naira, indicating that the revenue generation is subject to significant variability. The range, from 65.72 billion Naira to 255.99 billion Naira, highlights the large differences in revenue generation across the years. The median value of 132.6 billion Naira being higher than the mean suggests that the distribution of revenue is skewed to the left, with a few years of low revenue pulling the mean downward.
Operational costs for DisCos average 112.04 billion Naira, with a standard deviation of 34.98 billion Naira, indicating that operational expenses exhibit moderate fluctuations. The range from 35.54 billion Naira to 186.38 billion Naira further reflects the variability in operational efficiency and management of expenses across the years. The median operational cost of 116.54 billion Naira being slightly higher than the mean suggests a left-skewed distribution, where a few years with significantly higher costs influence the average.
3.2.1 Power DisCos
The Figure 1 depict trends in Capital Cost, Cash Flow, Operational Cost, and Revenue for Abuja Electricity Distribution Company, Eko Electricity Distribution Company, and Ibadan Electricity Distribution Company from 2017 to 2022. These trends provide insights into their financial performance and operations during the period.
|
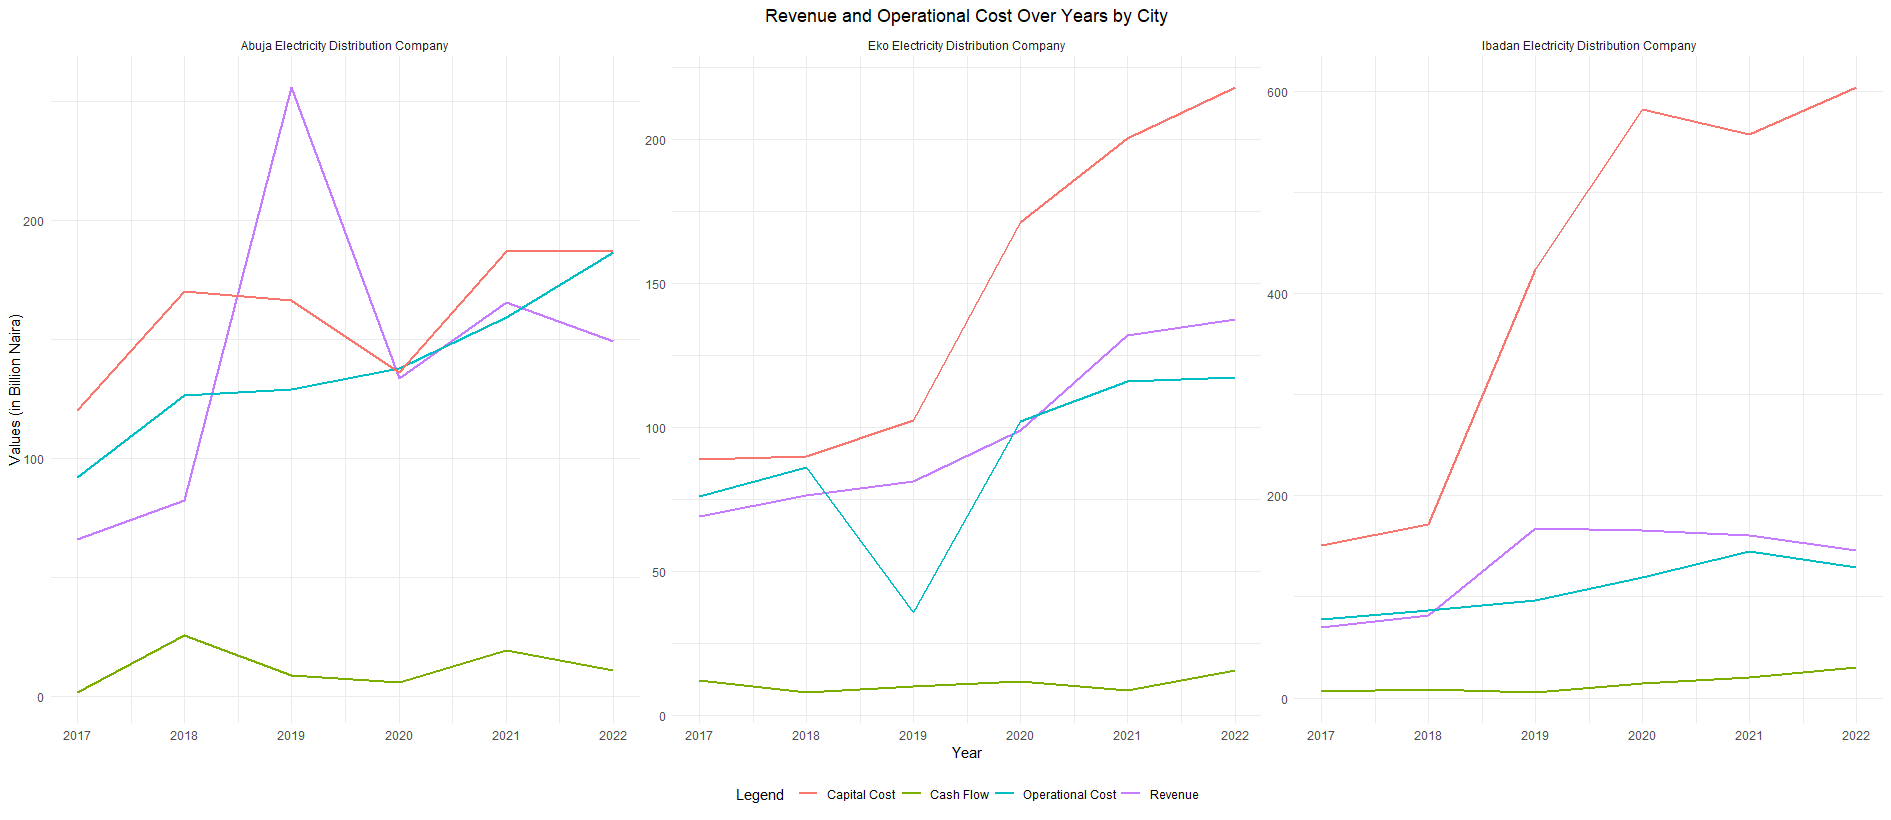
Figure 1. Trend Plots for the DisCos.
3.2.2 Abuja Electricity Distribution Company
The financial performance of Abuja Electricity Distribution Company reflects notable variability over the study period. Capital cost rose steadily from 2017 to 2019, indicating consistent investment in infrastructure and development during this time. However, a sharp drop in 2020 suggests a reduction in investment activities, potentially due to external disruptions or strategic realignment. By 2022, capital costs recovered to their previous levels, signaling a renewed focus on infrastructure upgrades or expansion. Cash flow remained relatively low and stable throughout the period, with only minor fluctuations, highlighting limited improvements in liquidity. Operational costs, on the other hand, followed a consistent upward trajectory, indicating rising expenses for maintenance, operations, or inflationary impacts. Revenue peaked sharply in 2019, likely reflecting operational efficiency or favorable market conditions during that year. However, the significant drop in revenue in 2020, followed by gradual recovery through 2022, underscores potential market or operational disruptions, such as regulatory changes or economic downturns.
3.2.3 Eko Electricity Distribution Company
Eko Electricity Distribution Company exhibited a pattern of steady financial growth and sustained investment. Capital cost showed a continuous upward trend from 2017 to 2022, reflecting consistent investment in infrastructure or capacity expansion. This trend suggests a long-term strategy focused on enhancing service delivery and operational efficiency. Despite these investments, cash flow remained low and steady, with only minimal increases over the years, potentially pointing to challenges in converting revenue into liquid assets. Operational costs also rose gradually, mirroring the growth in capital cost and reflecting the rising expenses associated with maintaining and operating expanded infrastructure. Revenue, aligned with these trends, followed an upward trajectory, peaking in 2021 and stabilizing in 2022. The steady increase in revenue indicates sustained growth in income generation, even as costs increased. These patterns suggest a balanced approach to investment and revenue generation, albeit with limited cash flow improvements.
3.2.4 Ibadan Electricity Distribution Company
The financial performance of Ibadan Electricity Distribution Company was marked by significant investment and subsequent revenue challenges. Capital cost experienced a dramatic increase between 2018 and 2020, stabilizing at a high level through 2022. This surge points to substantial investments in infrastructure or equipment, likely aimed at enhancing operational capacity. Despite these investments, cash flow remained flat and low, with only slight increases in recent years, highlighting inefficiencies in liquidity management or revenue realization. Operational costs steadily rose over the period, reflecting the growing expenses associated with expanded operations or inflationary pressures. Revenue peaked in 2020, coinciding with the period of high capital investment, but declined slightly in subsequent years and then stabilized. This post-2020 decline may indicate challenges in sustaining revenue growth, possibly due to market saturation, operational inefficiencies, or external factors affecting the electricity distribution market.
3.3 Average Financial Metrics of Power DisCos
Overall, the table reveals variations in financial strategies and resource allocation among the three companies. While Egbin Power PLC exhibits strong revenue performance, Transcorp Power Limited appears to excel in cost efficiency. In contrast, Mainstream Energy Solutions faces challenges in aligning its revenue with operational costs, which may require closer attention to expense management and revenue optimization.
Capital cost exhibits a moderate positive correlation with cash flow (0.52), indicating that higher capital investments are associated with an increase in cash flow in Table 2. This suggests that capital investments, possibly in infrastructure or equipment, enhance financial liquidity. The correlation between capital cost and revenue (0.46) is also moderate, highlighting that capital expenditure plays a role in revenue generation. However, the weaker correlation with operational cost (0.31) suggests that capital investment is not a significant driver of operational expenses.
Table 2. Correlation Matrix of Key Financial Variables of Distribution Company
Variable |
Capital Cost |
Cash Flow |
Revenue |
Operational Cost |
Capital Cost |
1.0000 |
0.5196 |
0.4593 |
0.3135 |
Cash Flow |
0.5196 |
1.0000 |
0.1692 |
0.3912 |
Revenue |
0.4593 |
0.1692 |
1.0000 |
0.5945 |
Operational Cost |
0.3135 |
0.3912 |
0.5945 |
1.0000 |
Cash flow shows a moderate correlation with capital cost (0.52) and operational cost (0.39). This indicates that liquidity is influenced by both investments and operational expenses. The weak correlation with revenue (0.17) suggests that cash flow does not directly translate into revenue, pointing to potential inefficiencies or external factors affecting revenue generation.
Revenue demonstrates a strong positive correlation with operational cost (0.59), implying that higher operational expenses are closely linked to revenue generation. This relationship underscores the cost-intensive nature of operations in the energy sector. The correlation with capital cost (0.46) is moderate, suggesting that capital investments contribute to revenue but are less impactful compared to operational expenditures.
Operational cost shows a strong correlation with revenue (0.59), reflecting the importance of operational efficiency in driving income. Its moderate correlation with cash flow (0.39) indicates that operational spending influences liquidity, but other factors may also play a role. The weak correlation with capital cost (0.31) suggests that operational costs are less tied to long-term investments (Figure 2).
|
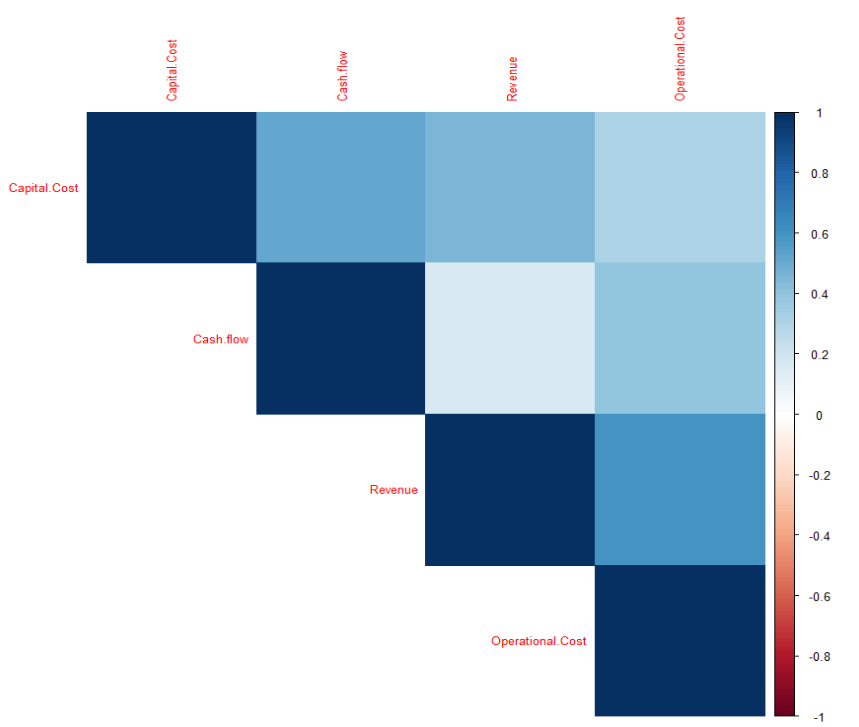
Figure 2. Correlation Plot.
The Table 3 provides a detailed breakdown of revenue statistics—minimum, median, mean, and maximum for three electricity DisCos: Abuja Electricity Distribution Company, Ibadan Electricity Distribution Company, and Eko Electricity Distribution Company. This analysis highlights the revenue distribution and performance variability across these companies.
Table 3. Revenue Statistics of Electricity DisCos
City |
Min Revenue (₦) |
Median Revenue (₦) |
Mean Revenue (₦) |
Max Revenue (₦) |
Abuja Electricity Distribution Company |
65,715,312,000 |
141,164,000,000 |
141,929,673,833 |
255,988,000,000 |
Ibadan Electricity Distribution Company |
70,182,887,000 |
153,728,500,000 |
132,175,334,333 |
167,806,000,000 |
Eko Electricity Distribution Company |
69,065,249,000 |
90,045,471,000 |
99,084,668,500 |
137,444,000,000 |
Abuja Electricity Distribution Company recorded the highest maximum revenue among the three companies at ₦255.99 billion, indicating its ability to generate substantial income in its best-performing year. Its mean revenue of ₦141.93 billion is close to the median revenue of ₦141.16 billion, suggesting a relatively consistent revenue performance over the observed period. However, its minimum revenue of ₦65.71 billion highlights significant variability between its best and worst revenue years.
Ibadan Electricity Distribution Company demonstrated a median revenue of ₦153.73 billion, the highest among the three companies, reflecting its consistent ability to maintain strong mid-range revenue performance. Its mean revenue of ₦132.18 billion, slightly lower than the median, indicates some downward influence from lower-performing years. With a minimum revenue of ₦70.18 billion and a maximum of ₦167.81 billion, the company shows narrower revenue fluctuations compared to Abuja Electricity Distribution Company.
Eko Electricity Distribution Company had the lowest mean revenue at ₦99.08 billion and the lowest maximum revenue at ₦137.44 billion among the three companies. The median revenue of ₦90.05 billion, which is closer to the minimum revenue of ₦69.07 billion, suggests a more constrained revenue range. While Eko Electricity Distribution Company appears to have lower revenue variability, its performance is significantly lower than its peers in terms of both average and peak revenue.
In summary, Abuja Electricity Distribution Company stands out for its ability to generate the highest maximum revenue but also exhibits significant revenue variability. Ibadan Electricity Distribution Company demonstrates strong and consistent revenue performance, with the highest median revenue. In contrast, Eko Electricity Distribution Company shows the lowest revenue figures across all metrics, reflecting a need for improved revenue-generating strategies to match the performance of its counterparts.
4.1 Regression Analysis
Interpretation of Regression Results : The regression model in Table 4 aimed to examine the relationship between Revenue and Capital Cost. The model shows that Revenue has a positive relationship with Capital Cost, with a coefficient of 1.577. This indicates that for every unit increase in Revenue, Capital Cost is expected to increase by approximately 1.577 units. However, the relationship is marginally significant with a p-value of 0.0551, just above the typical 0.05 significance threshold, suggesting that the evidence for this relationship is weak but still noteworthy.
Table 4. Regression Results - Capital Cost vs. Revenue (DisCos)
Statistic |
Value |
Residuals |
|
Minimum |
-2.818e+11 |
1st Quartile |
-7.347e+10 |
Median |
-3.597e+10 |
3rd Quartile |
-1.838e+09 |
Maximum |
3.297e+11 |
Coefficients |
|
Intercept Estimate |
4.428e+10 |
Intercept Std. Error |
1.019e+11 |
Revenue Estimate |
1.577 |
Revenue Std. Error |
0.7624 |
Revenue t-value |
2.069 |
Revenue p-value |
0.0551 |
Model Summary |
|
Residual Standard Error |
1.585e+11 |
Degrees of Freedom (Residual) |
16 |
Multiple R-Squared |
0.211 |
Adjusted R-Squared |
0.1617 |
F-statistic |
4.279 |
F-statistic p-value |
0.05515 |
Key Findings : (1) The intercept of the model is 4.428e+10, but with a p-value of 0.6698, this is not statistically significant. This suggests that when Revenue is zero, the estimated Capital Cost is not a reliable predictor.
(2) The coefficient for Revenue is 1.577, meaning that Revenue is positively associated with Capital Cost. A higher Revenue tends to lead to a higher Capital Cost. Despite the marginal significance, this relationship suggests that companies investing more revenue into their operations may experience higher capital expenditures.
(3) The residual standard error is 1.585e+11, indicating that there is a considerable amount of variability in the data that is not explained by the model. This suggests that Revenue alone does not fully account for the changes in Capital Cost, and other variables may be influencing Capital Cost that are not captured by the model.
Model Evaluation: (1) The Multiple R-squared value of 0.211 indicates that Revenue explains only about 21.1% of the variance in Capital Cost, suggesting that the model's explanatory power is relatively low. The Adjusted R-squared value of 0.1617 further reinforces this, indicating that after accounting for the number of predictors, the model explains approximately 16.17% of the variance.
(2) The F-statistic of 4.279 with a p-value of 0.05515 shows that the overall model is marginally significant, suggesting that Revenue does have a relationship with Capital Cost, but the model's ability to explain this relationship is limited.
In summary, while Revenue appears to have a positive but weak relationship with Capital Cost, the model's explanatory power is limited, and the significance of the results is marginal. Other factors likely contribute to Capital Cost that are not captured in this model. The model provides some indication that higher revenue is associated with increased capital expenditures, but additional predictors may be needed to improve the model's accuracy and explanatory strength.
The regression model in Table 5 aimed to predict Capital Cost based on three independent variables: Revenue, Operational Cost, and Cash Flow. The model's Multiple R-squared value of 0.4271 suggests that approximately 42.71% of the variance in Capital Cost is explained by the predictors. The Adjusted R-squared value of 0.3043 indicates that after adjusting for the number of predictors, the model still explains about 30.43% of the variance, which suggests a moderate fit.
Parameter |
Estimate |
Std. Error |
t value |
Pr(>t) |
Intercept |
-1.54E+10 |
1.21E+11 |
-0.127 |
0.9005 |
Revenue |
1.619 |
0.867 |
1.867 |
0.0829. |
Operational Cost |
-0.811 |
1.338 |
-0.606 |
0.5541 |
Cash Flow |
11.78 |
5.158 |
2.284 |
0.0385* |
Residuals |
Model Summary |
|||
Statistic |
Value |
Metric |
Value |
|
Minimum |
-2.301e+11 |
Residual standard error |
1.444e+11 |
|
1st Quartile (1Q) |
-8.311e+10 |
Degrees of freedom (df) |
14 |
|
Median |
-1.866e+10 |
Multiple R-squared |
0.4271 |
|
3rd Quartile (3Q) |
7.281e+10 |
Adjusted R-squared |
0.3043 |
|
Maximum |
2.570e+11 |
F-statistic |
3.478 |
|
|
|
p-value |
0.04489 |
|
Key Findings: (1) The intercept of the model is -1.542e+10, but it is not statistically significant (p-value=0.9005), meaning the model's baseline is not reliable when no predictors are included.
(2) The coefficient for Revenue is 1.619, indicating that for every unit increase in Revenue, Capital Cost increases by approximately 1.619 units. However, this relationship is marginally significant (p-value=0.0829), suggesting a weak but potentially meaningful association. The result indicates that as Revenue increases, Capital Cost tends to rise, although the evidence is not strong enough to confirm this with high confidence.
(3) The coefficient for Operational Cost is -0.811, which suggests a negative relationship between Operational Cost and Capital Cost. However, the p-value of 0.5541 indicates that this relationship is not statistically significant, and thus no strong conclusion can be drawn about its impact on Capital Cost.
(4) The Cash Flow coefficient is 11.78, and it is statistically significant (p-value=0.0385), meaning that Cash Flow has a positive and significant effect on Capital Cost. This suggests that higher cash flows are associated with higher capital expenditures, and this relationship is robust enough to be trusted.
Model Evaluation: The F-statistic of 3.478, with a p-value of 0.04489, indicates that the overall model is statistically significant at the 5% level, meaning that at least one of the predictors is significantly related to Capital Cost. However, the relatively low R-squared value and the insignificant relationship with Operational Cost imply that while the model provides useful insights, it may not fully capture the complexity of the factors affecting Capital Cost. Furthermore, the residual standard error of 1.444e+11 suggests considerable variability in the data, implying that predictions made by the model may have a significant error margin.
In conclusion, while the model identifies that Revenue and Cash Flow have some level of impact on Capital Cost, the results are not entirely conclusive. More data or additional predictors may be required to enhance the model's explanatory power.
The sensitivity analysis is a critical component of this study, as it helps to examine how the changes in key financial variables impact Capital Cost. By holding certain variables constant and varying others, this analysis aims to provide a clearer understanding of the relationships between Capital Cost and other factors such as Revenue, Operational Cost, and Cash Flow. This approach allows for a detailed exploration of how each factor independently influences capital expenditures, providing valuable insights into the financial dynamics within the power generation and distribution sectors.
In this analysis, the variables of interest Revenue, Operational Cost, and Cash Flow are isolated to determine their individual effect on Capital Cost. The results of the sensitivity analysis will be visualized through graphs that show predicted Capital Cost in relation to each independent variable, with all other factors held constant at their mean values. This method enables the identification of the strength and direction of each relationship, helping to quantify how changes in these factors could influence Capital Cost decisions in the companies under study.
Ultimately, the findings of the sensitivity analysis offer a more nuanced understanding of the financial strategies employed by these companies and serve as a foundation for making informed decisions about capital investment and financial planning in the energy sector.
4.2.1 Capital Cost vs Revenue
In this section, the relationship between Capital Cost and Revenue is examined. The analysis holds Operational Cost and Cash Flow constant at their mean values, while varying Revenue. The resulting graph demonstrates a positive slope, indicating that as Revenue increases, Capital Cost also increases. This suggests a direct relationship between Capital Cost and Revenue, where higher revenues lead to higher investments in capital. This could reflect a business strategy where increased revenue enables more significant capital expenditures, possibly for expansion or reinvestment in infrastructure. This is shown in Figure 3.
|
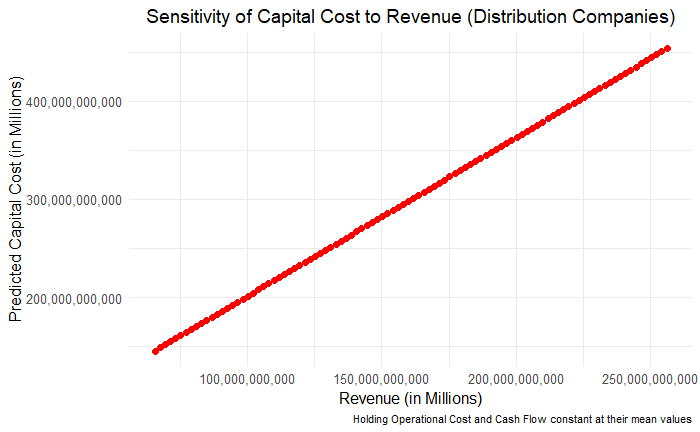
Figure 3. Sensitivity Plot of Capital Cost to Revenue.
4.2.2 Capital Cost vs Operational Cost
The second part of the sensitivity analysis investigates the effect of Operational Cost on Capital Cost. Here, Revenue and Cash Flow are held constant at their mean values, while Operational Cost is varied. The analysis reveals a negative slope, indicating that as Operational Cost increases, Capital Cost tends to decrease. This inverse relationship could imply that companies might manage operational efficiencies to offset higher operational expenses, potentially leading to reduced capital investments. This could reflect a strategy of controlling operational costs in order to prioritize more sustainable or strategic capital expenditures. This is shown in Figure 4.
|
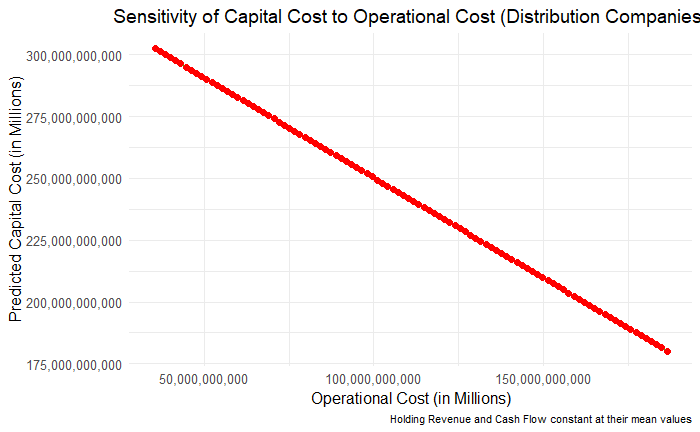
Figure 4. Sensitivity Plot of Capital Cost to Operational Cost.
4.2.3 Capital Cost vs Cash Flow
In the final section, Cash Flow is analyzed in relation to Capital Cost, with Revenue and Operational Cost held constant at their mean values. The Figure 5 produced in this analysis shows a positive slope, indicating that as Cash Flow increases, Capital Cost also increases. This suggests that companies with higher cash flow may have more flexibility and available funds to invest in capital projects, possibly for growth or upgrades to infrastructure. This positive correlation highlights the importance of strong cash flow in supporting capital expenditure decisions.
|
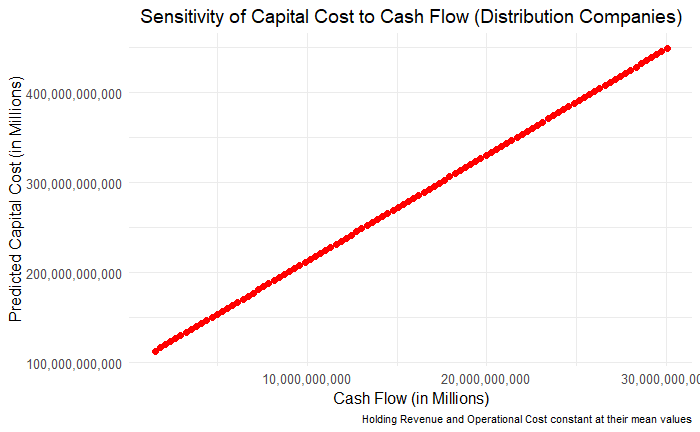
Figure 5. Sensitivity Plot of Capital Cost to Cash Flow.
In conclusion, by analyzing these three distinct relationships, the sensitivity analysis provides valuable insights into how changes in key financial factors impact Capital Cost. Understanding these dynamics can help decision-makers in the energy sector make more informed decisions regarding capital investment, financial planning, and resource allocation.
The break-even point is determined by analyzing the relationship between fixed costs (capital costs) and variable costs (operational costs), with revenue being the factor that covers both. This analysis assumes a constant sales price, making it easier to observe how changes in key financial variables impact the company's profitability.
The first aspect of the break-even analysis explores the relationship between Capital Costs and revenue. By calculating the break-even point for each company, we identify the level of revenue needed to cover fixed capital expenditures. If the revenue falls below this point, companies may not be able to sustain their capital investments, which could potentially affect their ability to grow or maintain operations.
The next section of the analysis looks at Operational Costs and how they interact with revenue to determine the point where these variable costs are fully covered. Operational costs, which include day-to-day expenses like wages, materials, and other running costs, must be managed efficiently to ensure profitability. The analysis reveals the revenue threshold at which a company can cover its operational expenses without incurring losses.
Finally, the break-even point considering both Capital Costs and Operational Costs together is calculated. This section evaluates the comprehensive financial performance needed for the company to be financially viable. The combined break-even point reflects the total amount of revenue required to cover both fixed and variable costs. This is particularly useful for understanding the company's overall financial health and identifying any potential risks related to cost overruns or underperforming revenues.
The break-even analysis in Figure 6 provides insights into the financial performance of the three electricity DisCos (Abuja, Ibadan, and Eko Electricity DisCos) over a period of six years (2017-2022). The focus of this analysis is to determine when each company's revenue surpasses its capital costs, operational costs, and the combined costs of both. The Break-Even Revenue is calculated as the sum of capital costs and operational costs.
|
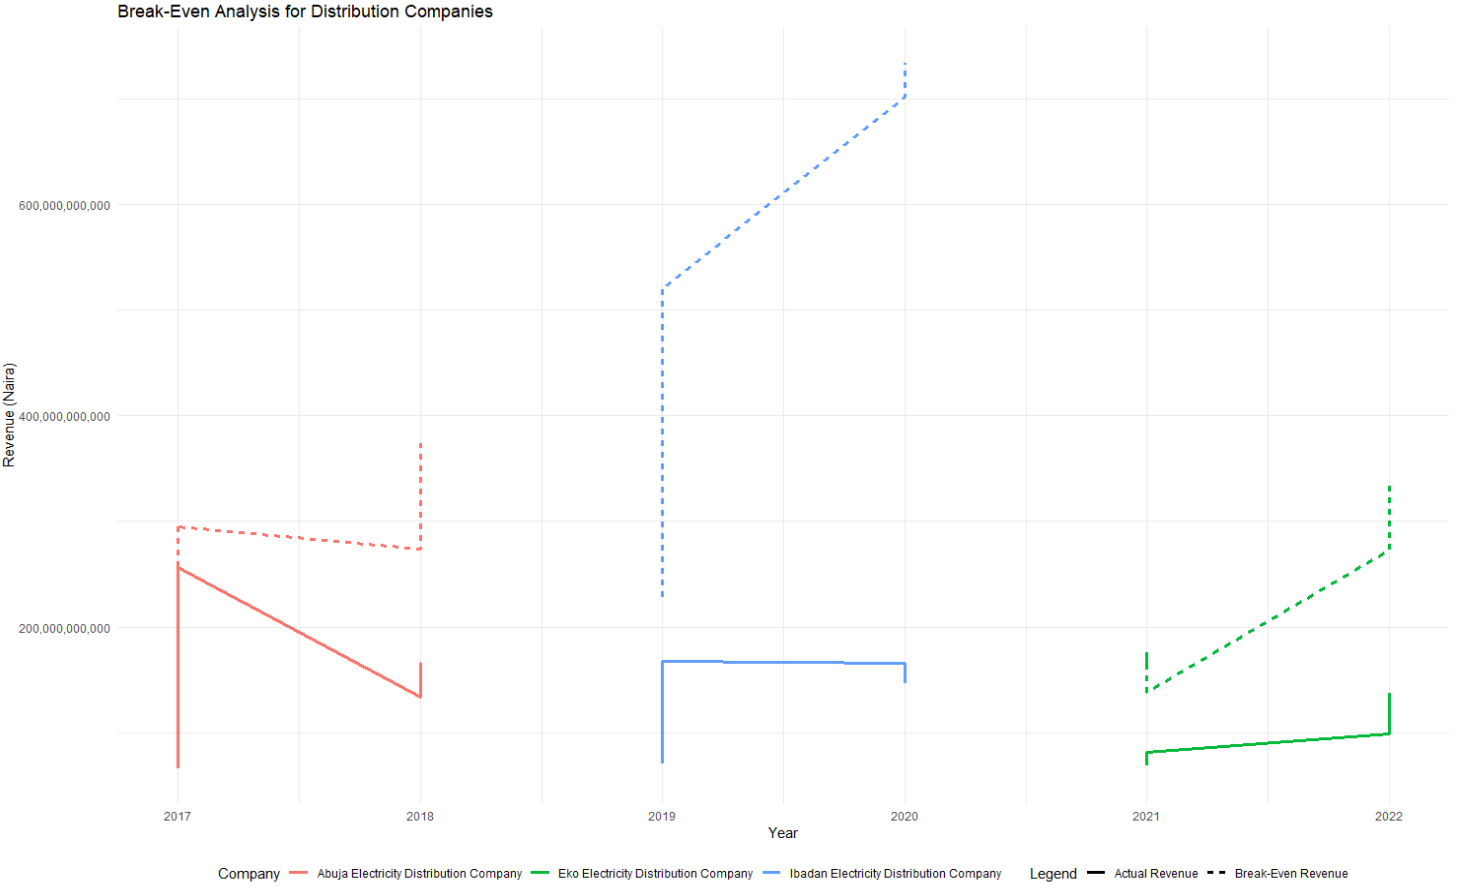
Figure 6. Break Even Plot.
In 2017, Abuja’s break-even revenue was approximately ₦212.1 billion, but actual revenue for that year was ₦65.7 billion, indicating a significant shortfall in covering both capital and operational costs. By 2020, Abuja’s break-even revenue grew to ₦373.6 billion, which surpassed its actual revenue of ₦146.2 billion. This shows that the company was not generating enough revenue to cover the increasing capital and operational costs. Despite the upward trend in actual revenue over the years, the gap between break-even and actual revenue remained substantial. This suggests that Abuja Electricity Distribution Company struggled with profitability during the study period, with ongoing operational inefficiencies and high capital costs.
In 2019, the break-even revenue for Ibadan surged to ₦519.9 billion, but the actual revenue of ₦167.8 billion fell far short. This trend continued into 2020, with the break-even revenue for that year rising to ₦733.9 billion, far surpassing actual revenues, indicating that the company was facing significant challenges in generating sufficient revenue to cover both fixed and variable costs. The company showed a gradual increase in revenue, but the break-even gap was a critical issue throughout the years under review, pointing to the need for operational adjustments or increased revenue generation.
For Eko Electricity Distribution, the break-even revenue in 2022 was around ₦335.3 billion. While this represented a more favorable trend compared to Ibadan and Abuja, actual revenue in 2022 (₦137.4 billion) was still below the break-even point, suggesting that the company was also struggling to meet its capital and operational cost requirements.
The gap between break-even and actual revenue for Eko indicates potential inefficiencies in cost management or underperformance in revenue generation, despite a consistent increase in both capital costs and operational costs.
4.4 DEA Results
The DEA was applied to a dataset from electricity DisCos, assessing their operational efficiency based on specified inputs and outputs. Efficiency scores were calculated to determine how effectively each firm utilized its resources relative to others in the sample. Firms achieving an efficiency score of 1.0 are considered fully efficient, operating on the efficiency frontier. Those scoring below 1.0 are deemed inefficient, indicating potential for operational optimization.
This section presents a detailed interpretation of the efficiency scores, efficiency ranges, and key takeaways from the DEA results.
Table 6. Efficiency Scores of Firms
Firm |
Efficiency Score |
1 |
0.7577 |
2 |
0.5628 |
3 |
1.0000 |
4 |
0.8376 |
5 |
0.6832 |
6 |
0.6446 |
7 |
0.6470 |
8 |
0.5793 |
9 |
0.8512 |
10 |
0.6807 |
11 |
0.5410 |
12 |
0.5432 |
13 |
1.0000 |
14 |
1.0000 |
15 |
1.0000 |
16 |
0.6154 |
17 |
0.5966 |
18 |
0.5631 |
Table 7. Efficiency Summary
Efficiency Range |
Number of Firms |
Percentage (%) |
0.5≤E<0.6 |
6 |
33.3 |
0.6≤E<0.7 |
5 |
27.8 |
0.7≤E<0.8 |
1 |
5.6 |
0.8≤E<0.9 |
2 |
11.1 |
0.9≤E<1.0 |
0 |
0.0 |
E=1.0 |
4 |
22.2 |
Table 8. Efficiency Statistics
Metric |
Value |
Minimum |
0.5410 |
1st Quartile |
0.5836 |
Median |
0.6639 |
Mean |
0.7280 |
3rd Quartile |
0.8478 |
Maximum |
1.0000 |
|
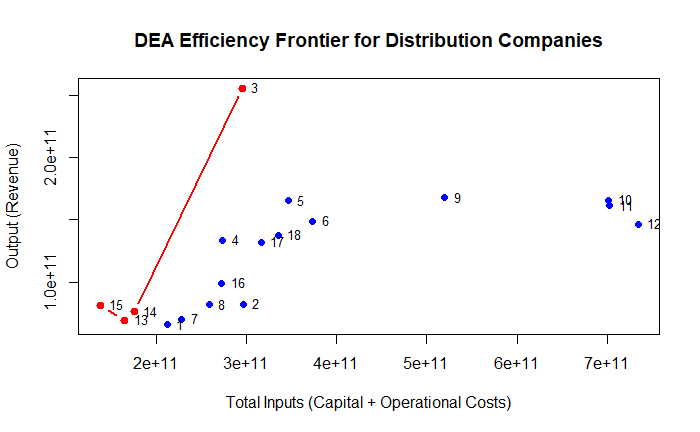
Figure 7. DEA for DisCos.
The DEA conducted in Tables 6-8 using the Variable Returns to Scale (VRS) technology and input-oriented approach reveals insights into the efficiency of 18 firms. Four firms, representing 22.2% of the sample, achieved an efficiency score of 1.0, indicating that they are fully efficient. These firms operate on the efficiency frontier, signifying optimal utilization of inputs to produce outputs. Conversely, the remaining 14 firms (77.8%) exhibit inefficiencies, with scores below 1.0, highlighting areas for improvement in their operations.
The efficiency scores range from 0.5410 to 1.0000, with an average score of 0.728. This suggests that, on average, firms are utilizing 72.8% of their potential efficiency, leaving room for a 27.2% improvement in input-output management. A significant proportion of firms (33.3%) fall into the lowest efficiency range of 0.5<=E<0.6, indicating critical inefficiencies in their operations. Additionally, 27.8% of firms scored within the 0.6<=E<0.7 range, while only 5.6% reached 0.7<=E<0.8, and 11.1% achieved 0.8<=E<0.9. Notably, no firms scored between 0.9<=E<1.0, emphasizing a considerable gap between the fully efficient firms and the rest.
The efficient firms with a score of 1.0 serve as benchmarks for the inefficient ones. By analyzing the practices of these top performers, inefficient firms can identify specific areas for improvement. For firms in the lowest efficiency range, efforts should focus on optimizing resource allocation, reducing operational costs, or enhancing output levels. Moderately efficient firms can benefit from targeted interventions, such as process improvements or adopting best practices from the benchmark firms.
Overall, the DEA results underscore a moderate level of efficiency across the firms, with significant opportunities for performance enhancement as shown in Figure 7. The findings suggest that systemic improvements are needed to address inefficiencies, particularly among the least efficient firms. By leveraging the insights from this analysis, managers can implement strategies to enhance operational efficiency, aligning their practices with those of the most efficient firms. These improvements can contribute to better resource utilization, increased productivity, and overall organizational performance.
5 RESULTS AND DISCUSSION
The analysis conducted in this study aims to provide insights into the relationship between various financial metrics such as revenue, operational costs, cash flow, and capital costs—in the context of inventory management for power generation and DisCos in Nigeria. The following key findings emerge from the statistical models and analyses performed:
The regression analysis reveals a positive relationship between revenue and capital costs. Specifically, the findings indicate that for every unit increase in revenue, capital costs tend to increase as well, with an estimated coefficient of 1.577. This suggests that companies in the Nigerian power sector are likely to incur higher capital expenditures when their revenue increases. While this relationship is statistically significant, with a p-value of 0.0551, it falls just outside the traditional threshold of 0.05, suggesting that the relationship is weakly significant.
The implication of this finding is that as power DisCos experience revenue growth, they are often required to increase their investment in infrastructure, equipment, and other capital expenses. This could be due to the need to expand operations or improve services to meet growing demand. However, since the relationship is only weakly significant, it implies that other factors may also play a significant role in determining capital costs, and revenue alone may not be sufficient to drive substantial changes in capital expenditures.
The relationship between operational costs and capital costs is less straightforward. The regression results show a weak negative relationship between operational costs and capital costs, with an estimated coefficient of -0.8113. This suggests that as operational costs rise, capital costs may decrease slightly. However, this relationship is not statistically significant, with a p-value of 0.5541, indicating that operational costs do not have a strong or meaningful impact on capital costs in the dataset used in this study.
This finding may imply that the companies in the study tend to keep capital expenditures stable, even when faced with higher operational costs. It could be that companies prioritize managing their operational costs more effectively or that they do not significantly alter their capital investments in response to fluctuations in day-to-day expenses. This insight points to the importance of differentiating between operational and capital expenditures in financial decision-making, as their relationship may not always be linear or predictable.
The analysis also highlights a positive and statistically significant relationship between cash flow and capital costs. The estimated coefficient for cash flow is 11.78, with a p-value of 0.0385, which indicates a strong and significant effect on capital costs. This suggests that as cash flow increases, companies in the power sector tend to invest more in capital projects and infrastructure.
This finding aligns with the expectation that companies with higher cash flow are better positioned to allocate funds towards capital expenditures. Healthy cash flow allows for the financing of large-scale infrastructure projects, technology upgrades, and other capital investments that can help to improve efficiency and expand operations. The positive relationship observed in the study underscores the importance of cash flow management in determining a company's ability to invest in long-term assets, which in turn impacts its profitability and growth prospects.
The overall fit of the regression model was assessed using the R-squared value, which was found to be 0.211, suggesting that approximately 21% of the variability in capital costs can be explained by the independent variables (revenue, operational costs, and cash flow). The adjusted R-squared value of 0.1617 indicates that the model's explanatory power decreases slightly when adjusting for the number of predictors in the model, suggesting that other unaccounted-for variables might be influencing capital costs.
While the model provides useful insights, the relatively low R-squared value indicates that the predictors included in the analysis are not sufficient to fully explain the variations in capital costs. This finding highlights the complexity of capital cost determination in the power sector, where many factors—such as regulatory changes, technological advancements, and market conditions—may also play a role. The model's relatively low explanatory power suggests that additional variables could improve the understanding of capital costs in the Nigerian power sector.
The sensitivity analysis provides further insights into the relationships between the variables and capital costs. In particular, the results show a positive slope for the predicted capital cost against revenue, with all other variables held constant at their mean. This reinforces the positive relationship observed in the regression analysis, suggesting that as revenue increases, capital costs are expected to rise. This finding supports the notion that revenue growth often leads to increased investments in infrastructure and expansion.
Similarly, the graph of predicted capital costs against cash flow also shows a positive slope. This further strengthens the conclusion that companies with higher cash flow are more likely to make higher capital investments. The positive relationship between cash flow and capital costs is consistent with the general financial principle that strong liquidity enables companies to fund capital expenditures, thereby fostering growth and operational efficiency.
The break-even analysis provides a critical perspective on the relationship between capital costs and revenue. By calculating the break-even point for each company, the study identifies the minimum revenue required to cover capital and operational costs. The break-even point varies across companies, with some companies requiring higher levels of revenue to cover their costs, particularly those with higher capital expenditures or operational inefficiencies.
The results of the break-even analysis reveal that some companies in the Nigerian power sector may struggle to reach profitability if revenue growth does not keep pace with increasing capital and operational costs. This underscores the importance of effective inventory management and cost control measures. Companies that fail to reach their break-even point may face financial instability, making it crucial for them to optimize their operational efficiency and ensure that capital investments are justified by corresponding revenue growth.
The application of DEA provided valuable insights into the relative efficiency of different power generation and DisCos. The DEA scores identified several companies that were operating efficiently in terms of capital utilization, revenue generation, and operational cost management. Conversely, some companies were found to be inefficient, indicating that there is room for improvement in their inventory management and overall operational strategies.
By comparing the performance of various companies, DEA highlights the best practices in the industry and provides benchmarks for companies to strive towards. This analysis suggests that companies can improve profitability by learning from their more efficient counterparts and implementing best practices in inventory management, cost control, and revenue generation strategies.
In conclusion, the key findings of this study offer valuable insights into the financial dynamics of the Nigerian power sector and provide recommendations for improving inventory management and profitability. By understanding the relationships between key financial variables and applying the appropriate analytical methods, companies can make more informed decisions and improve their financial performance in the long run.
The primary aim of this study was to analyze the impact of inventory management practices on the profitability of energy companies in Nigeria, specifically within the power generation and distribution sector. The results of the study provide significant insights into how various financial and operational factors, such as capital costs, cash flow, revenue, and operational costs, influence inventory management practices and overall profitability in the sector.
One of the key findings from the regression analysis is the positive relationship between capital cost and revenue. This indicates that, as revenue increases, capital expenditures tend to increase as well, suggesting that companies often reinvest their profits into expanding their infrastructure, thus increasing their capital costs. The positive relationship is crucial, as it suggests that an increase in financial returns could be used strategically for long-term growth and investments in infrastructure.
Conversely, the relationship between capital cost and operational cost was found to be negative. This implies that energy companies that incur higher operational costs may see diminishing returns in terms of capital expenditures, highlighting the importance of controlling operational expenses. Additionally, the sensitivity analysis demonstrated that changes in cash flow had a significant positive impact on capital cost, indicating that companies with stronger financial inflows are better equipped to handle the costs associated with infrastructure maintenance and upgrades.
The sensitivity analysis revealed that inventory management decisions are highly sensitive to fluctuations in revenue and cash flow. Specifically, the positive slope of the graph for predicted capital cost against revenue suggests that as companies experience higher revenues, their capital expenditure is likely to increase as well, reinforcing the notion that revenue is a key driver of investment in physical assets and infrastructure. Similarly, the positive slope for predicted capital cost against cash flow underscores the importance of maintaining healthy cash flow levels, as companies with better liquidity are more capable of making timely and strategic capital investments.
However, the negative relationship observed between predicted capital cost and operational costs highlights a significant challenge for companies in managing their cost structure. Excessive operational costs could impede a company's ability to invest in capital projects, thereby stalling long-term growth and affecting profitability.
The break-even analysis further emphasized the financial dynamics at play in the energy sector. It was revealed that the companies in the study required a specific level of revenue to cover both fixed and variable costs. This analysis serves as a useful tool for determining the minimum revenue levels needed to break even and avoid losses. It also demonstrated the importance of controlling costs, as lower operational costs could decrease the break-even threshold and allow companies to achieve profitability with lower revenue.
The analysis indicated that companies in the Nigerian energy sector are under significant pressure to manage costs effectively in order to remain profitable. Given the volatility of energy prices, fluctuations in demand, and regulatory changes, controlling costs is essential for sustaining operations and protecting margins.
Finally, the DEA provided an efficiency score for each company, comparing their relative performance against their peers. This allowed for an assessment of how efficiently companies were utilizing their resources, including capital investments, to generate revenue. The DEA results showed varying levels of efficiency across the companies, with some demonstrating more effective use of resources than others. The findings underscore the importance of benchmarking against industry standards and continuously improving operational efficiency to maintain a competitive edge in the sector.
This work hereby recommend implementing strong demand forecasting, using a Just-in-Time (JIT) approach, optimizing storage facilities, utilizing technology for real-time tracking, working with suppliers, and conducting routine inventory audits to minimize overstocking and ensure timely availability of critical components are all important strategies to improve inventory management and increase profitability for Nigerian power distribution asset companies. These strategies will ultimately lower costs and improve operational efficiency.
The authors hereby wish to thank the Tertiary Education Trust Fund (TETFUND) for the funding received for this research, under the category of Institutional Based Research (IBR).
Conflicts of Interest
The authors declared no conflicts of interest.
Data Availability
The datasets analyzed during the current study are available from the corresponding author on reasonable request.
Copyright and Permissions
Copyright © 2025 The Author(s). Published by Innovation Forever Publishing Group Limited. This open-access article is licensed under a Creative Commons Attribution 4.0 International License (https://creativecommons.org/licenses/by/4.0), which permits unrestricted use, sharing, adaptation, distribution, and reproduction in any medium, provided the original work is properly cited.
Author Contribution
Ogundunmade TP handled the writing, methodology, and conceptualization. The article was written, reviewed, and edited by Ganiyu KA. Yahaya TO wrote and curated the data. The submission was approved by all writers after they had read it.
Abbreviation List
DisCos, distribution companies
DEA, data envelopment analysis
DMUs, decision-making units
References
[1] AEMC. Power of choice review - giving consumers options in the way they use electricity. Sydney: Australian Energy Market Commission, 2012. Available at:[Web]
[2] Ayansola OA, Ogundunmade TP, Adedamola AO. Modelling Willingness to Pay of Electricity Supply Using Machine Learning Approach. Mod Econ Manag, 2022; 1: 9.[DOI]
[3] Bello SL. Evaluating the Methodology of Setting Electricity Prices in Nigeria. IAEE Energy Forum, 2013: 33-32.
[4] Amadi S. Absence of Cost Effective Tariff Led to the Failure of Power Sector – NERC. Royal Times, 2012.Available at:[Web]
[5] Chukwuka O, Joseph I, Precious CA. Electrification in Nigeria: Challenges and Way Forward. Abuja: Centre for the Study of the Economies of Africa (CSEA), 2017.
[6] Power Engineering International. Nigeria’s Egbin Power Highlights Thermal Power. 2019.Available at:[Web]
[7] Ayansola OA, Ogundunmade TP, Adedamola AO. Statistical Analysis of Cost Reflective Electricity Tariff and Distribution in Nigeria (A Study for Southwest States). Mod Econ Manag, 2023; 2: 5.[DOI]
[8] Kaitafi AI. Imperatives of Tariff/Tariff Setting and Subsidy in Nigerian Electricity Industry (NESI). Authoritative Journal of Power Holding Corporation of Nigeria, 2011; 8: 6-14.
[9] Ado A. Does MYTO Tariff Review Impact on the Flow of Private Investment to the Nigerian Electricity Supply Industry? IOSR J Econ Finance, 2013; 1: 50-55.[DOI]
[10] Ado A, Landi JH. Assessment of Private Sector Financing of Electricity Infrastructure in Nigeria. IOSR J Econ Finance, 2013; 1: 13-24.[DOI]
[11] Bongani K, Thilivhali N. Investment in electricity distribution capital infrastructure in South Africa: the role of regulation. S Afr J Econ Manag Sci, 2020; 23: 3413.[DOI]
[12] Stenner K, Frederiks E, Hobman EV et al. Australian Consumers’ Likely Response to Cost-Reflective Electricity Pricing. CSIRO, Australia, 2015.
[13] Adeoye S, Oladimeji TT. Power Generation In Nigeria: The Past, Present And The Future. J Earth Environ Sci Res, 2020; 2: 116.[DOI]
[14] Hiroaki N. Electric power sector reform liberalization models and electric power prices in developing countries. Energy Econ, 2009; 31: 463-472.[DOI]
[15] Timothé B, Pierre OP. Assessing the impact of residential load profile changes on electricity distribution utility revenues under alternative rate structures. Util Policy, 2019; 61: 100959.[DOI]
[16] Susana AB, Valentín AP, Gabriel de la FH. The differential effect of revenue rises and cost savings on investors' valuation of growth options. Span J Finance Account, 2013; 42: 319-340.[DOI]
[17] Namrata C, Nihit G. One price doesn't fit all: An examination of heterogeneity in price elasticity of residential electricity in India. Energy Econ, 2019; 82: 1-12.[DOI]
[18] Anosike NB, Dara JE, Ngwaka UC et al. Analysis of Nigerian Electricity Generation Multi Year Tariff Order Pricing Model. Energy Power Eng, 2017; 9: 541-554.[DOI]
[19] Maphosa M, Mabuza P. The trade-offs between pro-poor and cost-reflective tariffs in South Africa: A regulatory perspective. National Energy Regulator of South Africa, 2017.[DOI]
[20] Robert P, Navid H, Anna B et al. Designing more cost reflective electricity network tariffs with demand charges. Energy Policy, 2017; 109: 565-575.[DOI]
[21] Sanusi O. Expanding electricity access to all in Nigeria: a spatial planning and cost analysis. Energy Sustain Soc, 2015; 5: 8.[DOI]



 Copyright ©