Value Added Tax Compliance in Cigarette Industry in Pakistan: An Empirical Analysis
Muhammad Ashfaq Ahmed1, Nasreen Nawaz2*
1Federal Board of Revenue, Islamabad, Pakistan
2Directorate General of Revenue Analysis, Federal Board of Revenue, Islamabad, Pakistan
*Correspondence to: Nasreen Nawaz, PhD, Chief, Directorate General of Revenue Analysis, Federal Board of Revenue, Constitution Avenue, Islamabad, 44000, Pakistan; Email: nawaznas@msu.edu
DOI: 10.53964/mem.2025005
Abstract
Objective: Measuring tax compliance and evasion is particularly challenging because tax evaders have a strong incentive to conceal their actions. While assessing any crime presents similar difficulties, tax evasion is unique in that it lacks identifiable victims, meaning there are no victim reports or surveys to gather data from. However, unlike most crimes, changes in tax evasion can be observed through fluctuations in reported tax bases. The fear of punishment and potential social stigma makes many taxpayers reluctant to provide truthful responses, even in surveys conducted by organizations not affiliated with tax authorities. Consequently, almost all empirical studies on tax compliance and evasion, even the most reliable ones, lack an accurate measure of compliance and evasion. Voluntary tax compliance as a function of the tax rate is a critical determinant of tax revenue collection. As a result, a model and estimation methodology have been developed in this article to explore this relationship.
Methods: This research offers a novel methodology for estimating tax compliance and the underground consumption by theoretically introducing and empirically estimating a tax compliance function for the cigarette industry in Pakistan.
Results: In Pakistanʼs cigarette industry, the tax compliance rate is 11.53%, and 37.5% of cigarette consumption is underreported in surveys.
Conclusion: Fractional compliance is inversely related to the tax rate. Tax revenue initially increases with higher tax rates, reaching a peak before declining as the tax rate rises. On the other hand, gross domestic product (GDP) behaves oppositely to the tax revenue. The highest GDP occurs at either a 0% or 100% tax rate, where tax revenue is zero. As the tax rate rises, GDP decreases initially until it reaches a minimum, after which it begins to increase again, eventually reaching its peak at a 100% tax rate at a specific point in time. This contrasts with the Laffer Curve, which suggests that a decrease in the supply of goods leads to lower tax revenue as the tax rate increases. (JEL A14, H19, H83)
Keywords: voluntary tax compliance, tax rate, tax revenue, tax base, cigarette industry
Tax compliance involves adhering to and following tax laws and regulations by accurately reporting income, expenses, and other financial information to the appropriate tax authorities. It includes submitting tax returns on time and paying the proper amount of taxes. Tax compliance for an individual or a business has an associated cost and benefit, which they weigh against each other while deciding on the extent to which they would like to comply with their tax obligations. Businesses are legally required to adhere to the tax laws of the jurisdiction in which they operate. Whether intentional or not, failure to comply with these tax laws constitutes a violation of the law and may result in legal consequences such as penalties, fines, and, in some cases, imprisonment. Legal actions taken against a company for tax avoidance can damage its reputation, leading to a significant loss of trust among investors, vendors, and customers. This erosion of investor confidence may result in a decline in the influx of new capital into the company. Failure to comply with tax laws can lead to significant legal consequences, raising the cost of running a business. Tax authorities may confiscate company assets and freeze bank accounts. The expenses associated with defending against complex tax disputes in court can be extremely expensive, potentially disrupting the operations of smaller businesses. Therefore, adhering to tax regulations typically results in cost savings for companies. Each company has a responsibility to contribute to the societal objectives of the region it operates in. Voluntary tax compliance reflects a companyʼs dedication to its corporate social responsibilities, as the government utilizes tax revenue to support development programs. Consistently practicing voluntary tax compliance can help a company develop a dependable tax forecasting system, reducing unnecessary concerns about tax issues. In the long run, this approach supports business growth and enables smooth expansion into new markets. Tax compliance costs include time of citizens to fill out and submit tax returns along with payment of due taxes, and costs to individuals and businesses of new tax regulations. When explicit enforcement is weak (e.g., limited audits), the legitimacy of the law may decline, weakening taxpayersʼ inherent willingness to comply. People might choose to follow the law because they see it as fair, independent of their views on the governmentʼs authority to enforce it.
Voluntary tax compliance as a function of the tax rate is a crucial factor in determining tax revenue collection. Therefore, a model and estimation methodology have been developed in this article to address this relationship. Measuring tax compliance and evasion is particularly difficult because tax evaders have a strong incentive to hide their actions. While assessing any crime comes with similar challenges, tax evasion is unique in that it lacks identifiable victims, meaning there are no victim reports or surveys to gather data from. However, unlike most crimes, there are observable signs of changes in tax evasion, such as fluctuations in reported tax bases. The fear of punishment and potential social stigma leads many taxpayers to be reluctant to provide truthful responses, even to surveys conducted by organizations unrelated to the tax authorities. As a result, nearly all empirical studies on tax compliance and evasion, including the most reliable ones, lack a dependable measure of tax compliance and evasion. This research provides a novel methodology to estimate tax compliance through theoretically intoducing and empirically estimating a tax compliance function for cigarette industry in Pakistan. The hypothesis of the research is that as tax rate increases, voluntary tax compliance to pay the taxes decreases.
The structure of this paper is as follows: Section 2 presents literature review. Section 3 discusses the value-added tax gap. Section 4 presents materials and methods. Section 5 focuses on the cigarette industry in Pakistan. Section 6 provides the data analysis. Section 7 outlines the properties of the estimators. Section 8 offers an in-depth analysis based on the model. Section 9 compares the introduced model with the Laffer Curve. Finally, Section 10 summarizes the findings and concludes the paper.
For estimation of value added tax gap, various approaches are adopted in the literature. The “top-down” method is subtractive, i.e., first the potential tax is estimated and then the actual tax collected is subtracted to determine the tax gap. This contrasts with the “bottom-up” approach, commonly used for income taxes, where compliance and policy gaps are estimated directly from detailed micro tax record data. In that method, potential revenue is calculated additively, by adding the estimated gaps to the actual tax to find the potential tax. The Revenue Administration Gap Analysis Program (RA-GAP) is a program by the International Monetary Fund that helps countries improve their ability to analyze and estimate tax gaps. When applying the top-down approach, the RA-GAP model calculates three versions of potential VAT as follows:
The first version is the potential VAT based on the current tax structure, referred to as the Current Potential Collection. For simplicity, this is labeled as PV1.
The second version is the potential VAT based on a normative tax structure. In this context, the normative structure would involve taxing all supplies at the standard rate (with zero-rated exports) except for public goods, financial services, and life insurance, which would be exempt. This is referred to as PV2.
The third version is the potential VAT based on a comprehensive tax structure, referred to as Full Potential Collections. In this comprehensive VAT structure, all supplies are taxable at the standard rate. This is labeled as PV3.
With these three versions of potential VAT and data on actual VAT collections and assessments, all the components of the tax gap can be identified as follows: Tax gap=PV3-accrued VAT; Policy gap=PV3-PV1; Non-taxable gap=PV3-PV2; Expenditure gap=PV2-PV1; Compliance gap=PV1-accrued VAT; Assessment gap=PV1-VAT assessments; Collection gap=VAT assessments-accrued VAT.
Most top-down VAT gap models estimate the potential VAT base using: (1) Final consumption; (2) Plus, intermediate consumption used for exempt supplies, to determine the total potential taxable consumption-this is known as the “consumption approach”. Inputs for exempt supplies are treated as final consumption for VAT purposes.
The RA-GAP model employs a different method to determine the potential VAT base-a “value-added approach”-by considering: (1) Imports that would be subject to VAT; (2) Plus domestic output that would be subject to VAT (total output minus exports); (3) Less the inputs used in domestic production that would generate creditable input VAT (intermediate consumption plus investment).
The claim is that both approaches will result in the same potential VAT base.
As we know from our basic economics courses on national accounts that Gross Value Added, Y, in an economy is determined by: Consumption (C), plus Investment (I), plus Government (G) plus eXports (X) minus iMports (M). We also know that Gross Value-Added is also defined as being: Output (O) minus (iNtermedate Consumption). So, with these two identities (ignoring G for the moment) we can see that, in other words:
|
The potential VAT Base, which is equivalent to consumption, can also be expressed as imports plus output minus exports, minus intermediate consumption and investment.
Consumption data, denoted as C, is available by commodity, but VAT collections are not. Therefore, when employing a consumption-based approach, we cannot easily break down the VAT gap into its components.
VAT collections can be disaggregated by sector, and data for Y (domestic output), I (investment), X (exports), and M (imports) can also be determined on a sectoral basis. This allows the VAT gap calculated using the value-added approach (RA-GAP method) to be analyzed by sector. This breakdown is crucial, as it helps identify areas with compliance issues or potential changes in compliance, guiding efforts to address the gap effectively.
Moreover, while modeling the tax base may be simpler with the consumption method, the RA-GAP value-added approach makes modeling the tax itself easier-and the results are significantly more sensitive to variations in tax modeling than in tax base modeling. Under the value-added approach, itʼs easier to accurately model the tax because the tax base is essentially a scaled-up version of how VAT is calculated for individual taxpayers. A taxpayerʼs VAT liability is determined by the VAT paid to customs on imports, plus the net VAT assessed on their domestic supplies, minus the credits for VAT paid on inputs used in producing their taxable supplies.
The RA-GAP method for estimating potential VAT collections begins with the equation for the potential VAT base for each economic sector, as previously outlined:
|
where s denotes sector of activity.
The term accrued VAT to estimate the tax gap used in both consumption and value-added approaches is merely a theoretical concept and does not align with the amount of VAT collected by the tax authorities. Suppose a registered commercial importer A imports a commodity of value 100 units of currency and pays a VAT of the amount of 18 units of currency at a VAT rate of 18%. A sells to B, a manufacturer, who pays an input tax to the commercial importer, however, does not make any supplies in the same tax period. B will declare the total VAT accrued in the same tax period as minus 18, which he / she will carry forward to the next tax period. Now, the total accrued VAT from these two registered persons is zero in the first tax period, however, the VAT collected is 18 units of currency. Now suppose in the second tax period, B manufactures a product using the inputs bought in the first tax period and sells to a consumer at a value of 200 units of currency by charging a VAT of 36 units of currency at the rate of 18% without making any new purchases. In the second tax period, the accrued VAT is 36 units of currency, whereas the collected amount is just 18 units. To adopt the consumption and value-added approaches to have an unbiased estimate of VAT gap, one first needs to prepare a new data set to match the accrued VAT with the collection data by subtracting the collection of 18 units of currency in the first tax period and adding that to the second tax period. This exercise will have to be done for each registered taxpayer for all tax periods in a year, and one can imagine the quantum of labor and probability of error. Furthermore, through these accounting methods, one comes up with just a number for an estimate of tax gap without a statistical inference based on a statistical distribution for an estimator.
Another major problem with these methods, especially when used by the developing countries is that the reported macroeconomic data, e.g., gross domestic product (GDP), consumption, production, etc., lacks the components of the underground economy, which constitute a substantial part of economic activity going on, leading to severely biased estimates of tax gap.
A methodology which potentially overcomes the above-mentioned limitations has been proposed and adopted in this research.
4.1.1 Tax Revenue as a Function of Explanatory Variables
Amount of tax can be simply expressed as follows:
|
T=due tax amount; x=tax rate; t=tax base.
The previous statement outlines the core principle of taxation, where T represents the tax amount that a taxpayer is required to pay into the government treasury. The term “due tax amount” refers to the full tax liability as dictated by a countryʼs laws and regulations. However, the actual tax collected often falls short of this due amount. A key factor contributing to this discrepancy is voluntary tax compliance (Convery, McDonnell and Ferreira[14] suggests that extensive consultation with stakeholders can have a positive impact on tax acceptance and compliance). Voluntary tax compliance is defined as follows.
|
The concept of fractional compliance has been introduced for clarity and is defined as follows Equation (4).
|
c=fractional compliance; y=actual tax collection.
Fractional compliance is influenced by the tax rate, with compliance decreasing as the tax rate rises, and increasing when the tax rate falls. By combining Equations (3) and (4), we can express it as:
|
This relationship can be extended to include n taxpayers, thereby applying it to the total tax collection for a country as follows:
|
The tax rate is fixed for a specific group of individuals, and since compliance is influenced by this rate, it will also remain constant for that particular tax rate. However, for different groups of individuals, the equation can be expressed as follows:
|
4.1.2 Basic Model and Boundary Conditions
The tax base refers to the segment of GDP that falls within the tax net, and it can thus be expressed as a function of GDP, i.e.
|
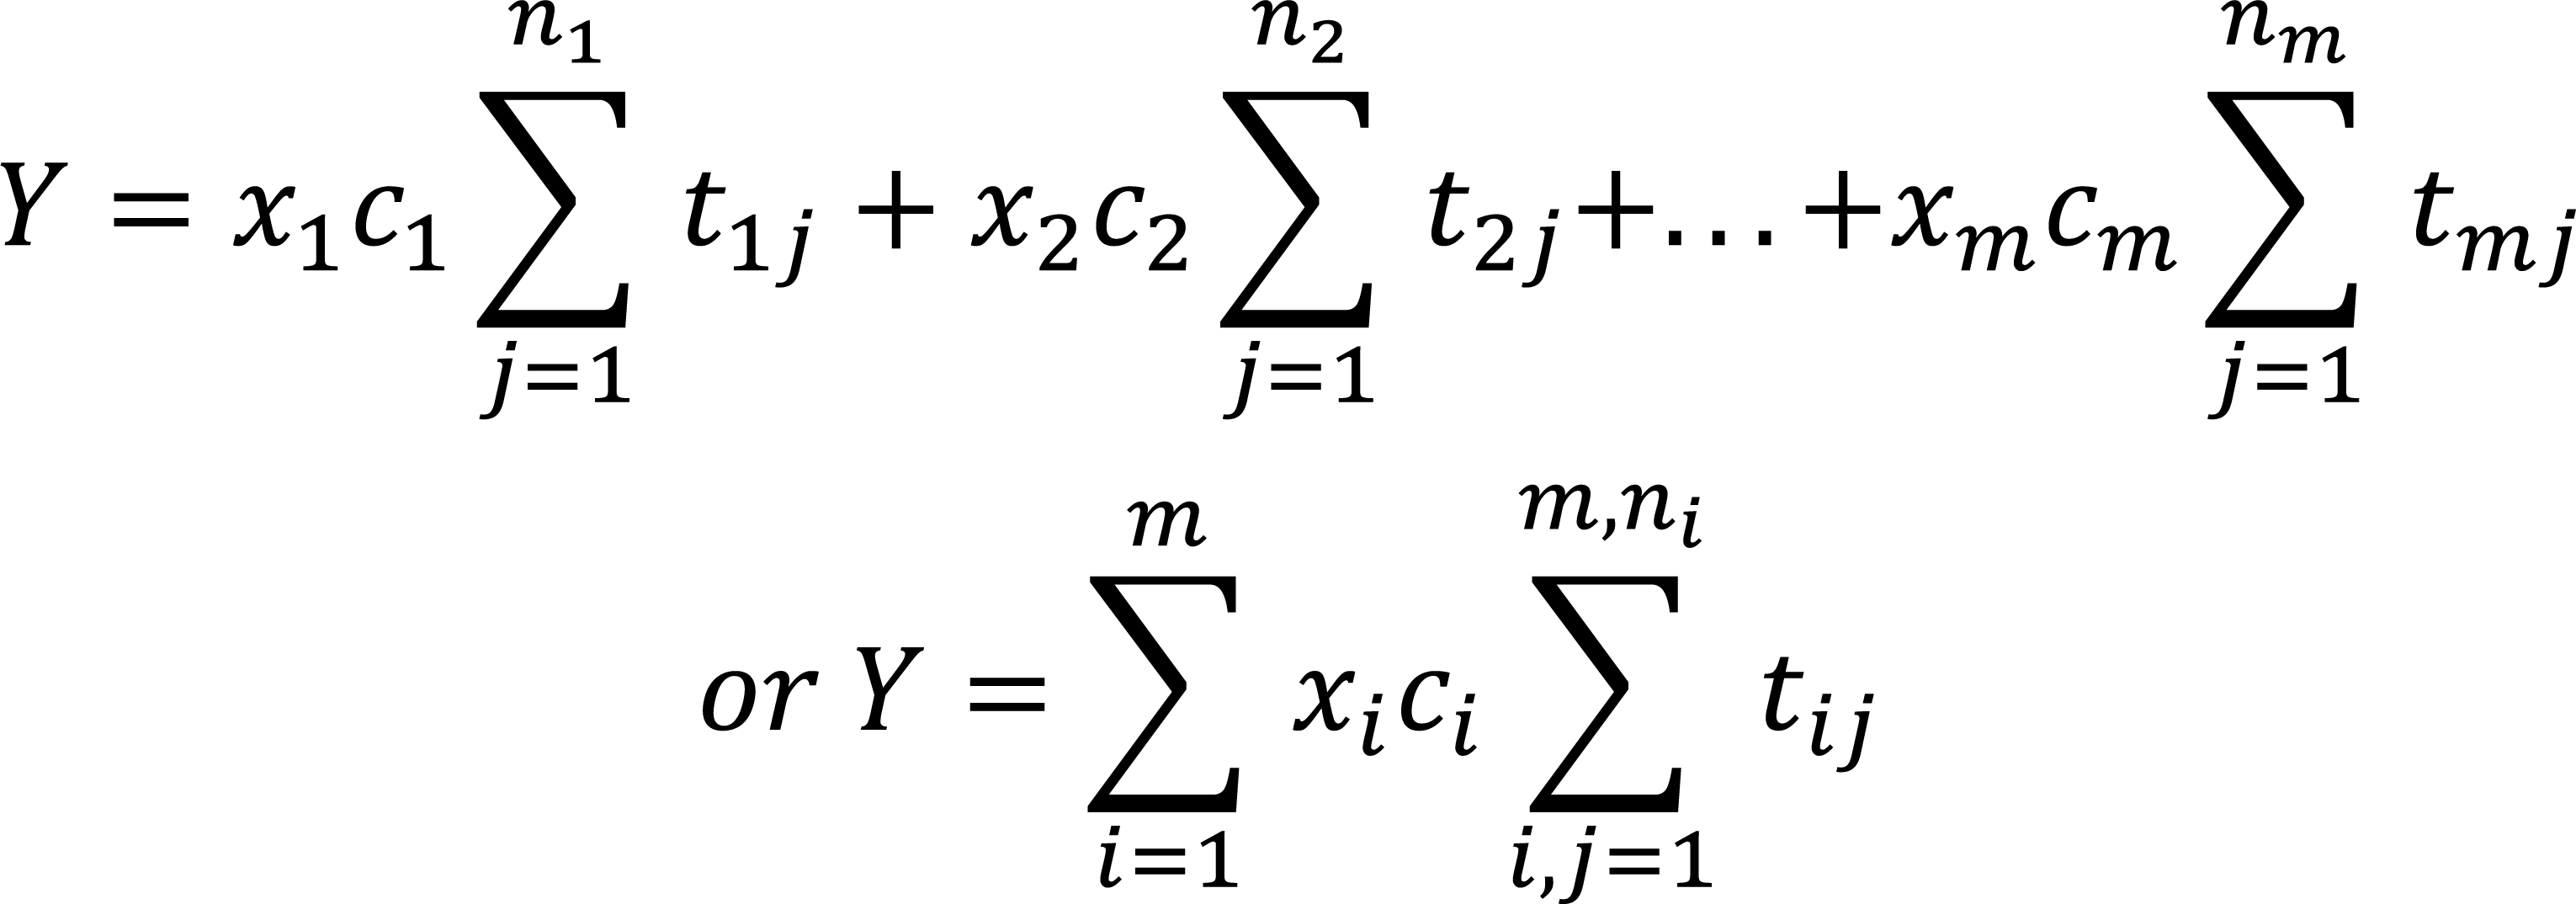
where G represents GDP. In the case of different groups of individuals with varying tax rates and bases, such as with income tax, the equation will be expressed as follows: the equation will take the form as follows:
|
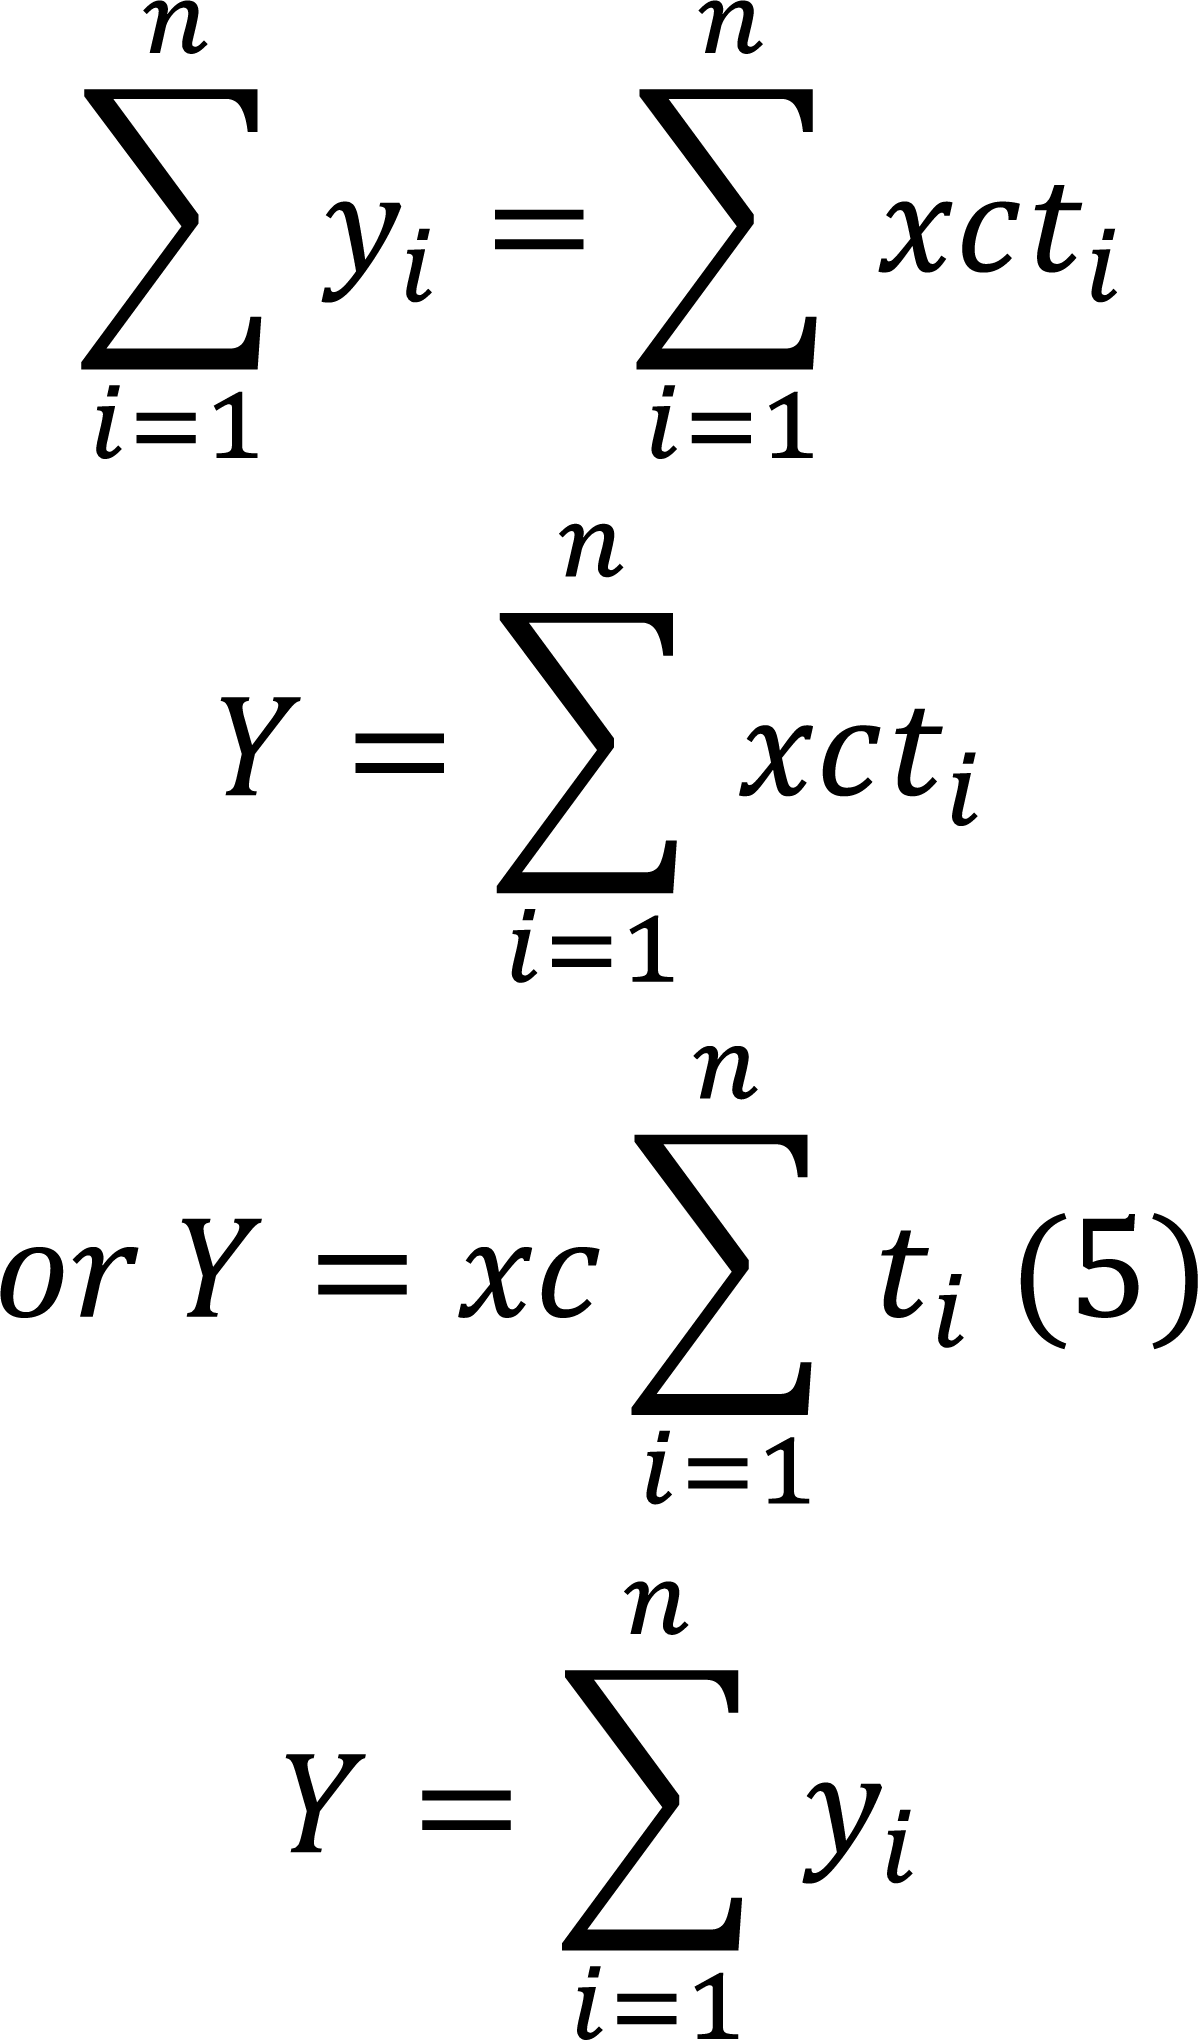
Equation (5) can be expressed as follows:
|
Tax revenue is positively correlated with GDP; as GDP rises, tax revenue also rises, and when GDP falls, tax revenue decreases as well. As previously noted, compliance is inversely related to the tax rate: when the tax rate increases, compliance decreases, and when the tax rate decreases, compliance increases. Compliance reaches its peak when the tax rate is at its lowest, which is zero, since tax rates cannot be negative.
Tax rate increases → compliance decreases, and tax rate decreases → compliance increases.
Fractional compliance ranges from zero to one, meaning it equals one at a zero percent tax rate. Conversely, at a one hundred percent tax rate, compliance drops to zero, as it is unreasonable to expect individuals to give up all their consumption / earnings without retaining anything for their own needs. Therefore, it is evident that tax revenue will be zero at both zero and one hundred percent tax rates. In other words:
|
where x is expressed in percentage terms. These boundary conditions allow us to choose a model of the following form:
|
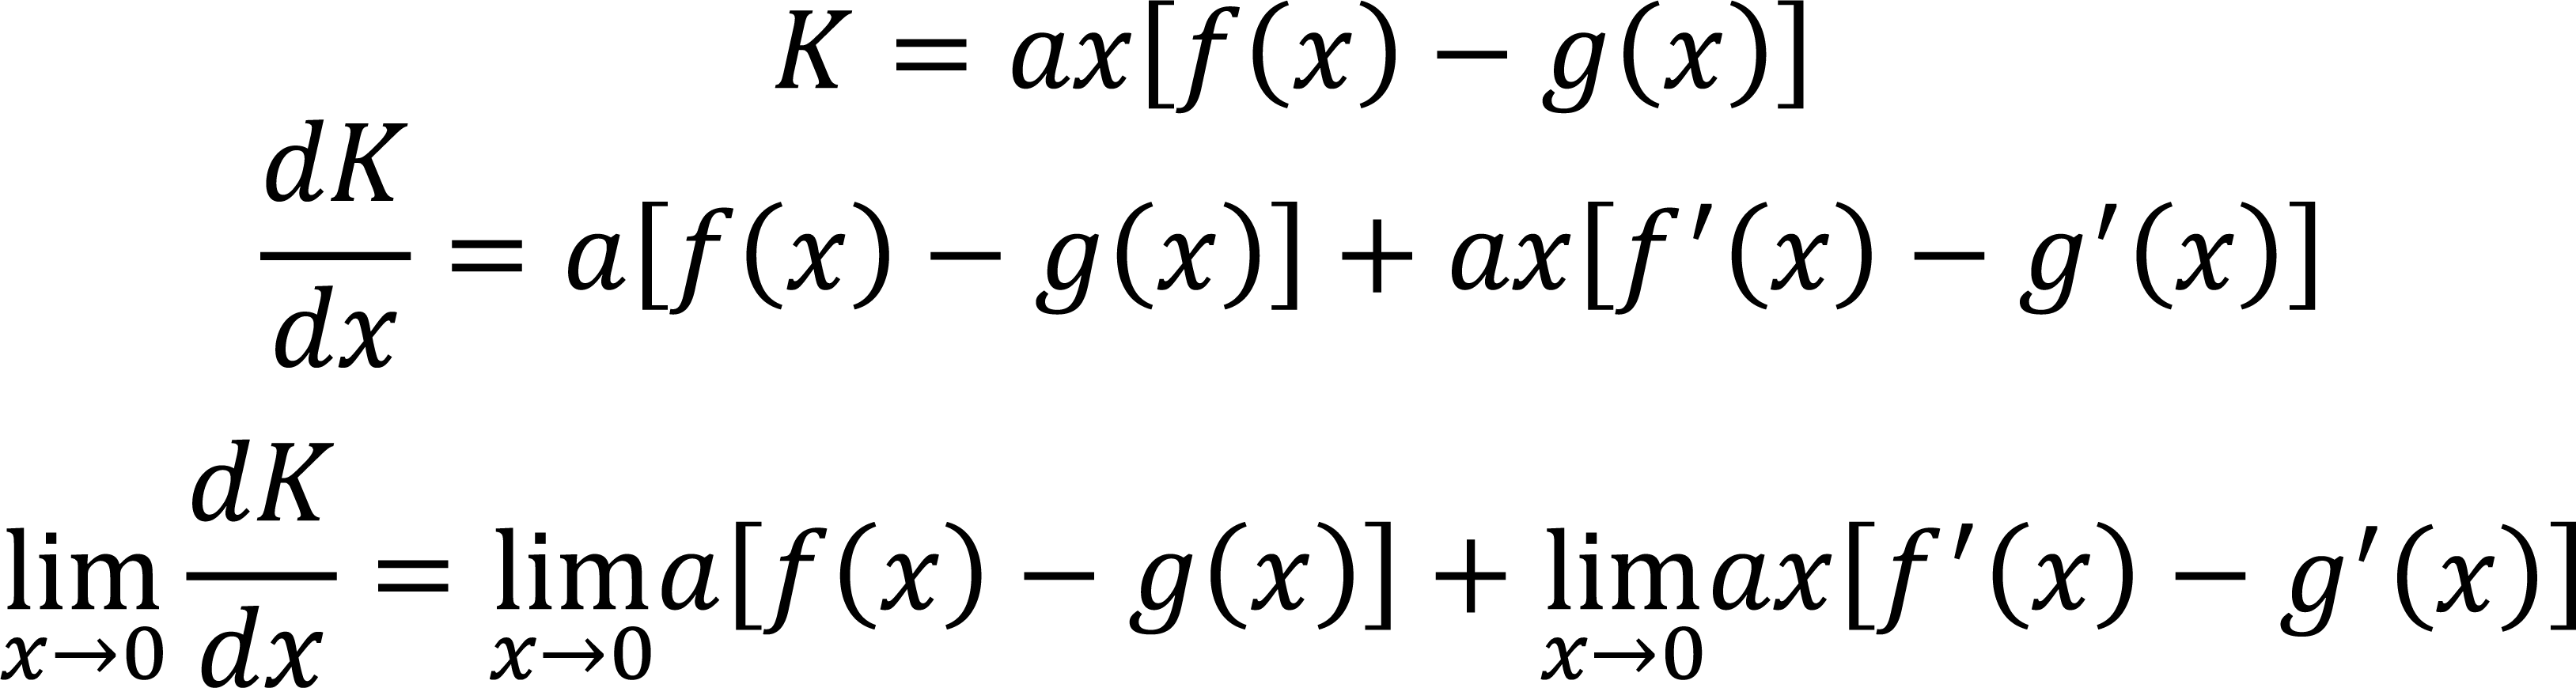
where c=f(x)-g(x). As x approaches one hundred percent, the difference between f(x) and g(x) approaches zero. Likewise, as the tax rate approaches zero, the term [f(x)-g(x)] should approach one. This indicates that:
|
5 CIGARETTE INDUSTRY IN PAKISTAN
The tobacco industry in Pakistan plays a significant role in the countryʼs economy, particularly in terms of employment and agricultural production. It contributes to various sectors, including farming, manufacturing, distribution, and retail, and generates an estimated Rs. 190 billion for the national treasury. Approximately 75,000 people are involved in tobacco cultivation nationwide, with more than 45,000 of them based in the province of Khyber Pakhtunkhwa. This region is the primary hub for flue cured virginia (FCV) tobacco production, contributing a substantial 98% of the total FCV tobacco grown in the country. The key tobacco-producing districts in Khyber Pakhtunkhwa include Swabi, Mardan, Charsadda, Buner, and Mansehra, where tobacco is cultivated on about 26,500 hectares of land. Annually, these districts produce between 70 to 75 million kilograms of FCV tobacco, which is the main raw material used in cigarette manufacturing. This high volume of production not only supports the local economy but also meets a significant portion of the tobacco industryʼs needs in Pakistan. The varieties of tobacco contributing to cigarette production are FCV with a production of 60 million kg, dark air cured virginia tobacco, 1.5 million kg, and Light Air-Cured Tobacco (Burley) with relatively lower production quantity. Area under different type of tobacco has been shown in Figure 1, and the detailed production data for different varieties has been presented in Figure 2. In the domestic market, the two leading players in the tobacco industry are pakistan tobacco company (PTC) and Philip Morris Pakistan, which collectively control about 60 percent of the market share. These companies dominate the manufacturing and distribution of tobacco products in the country, ensuring their strong presence in both the domestic and export markets.
|
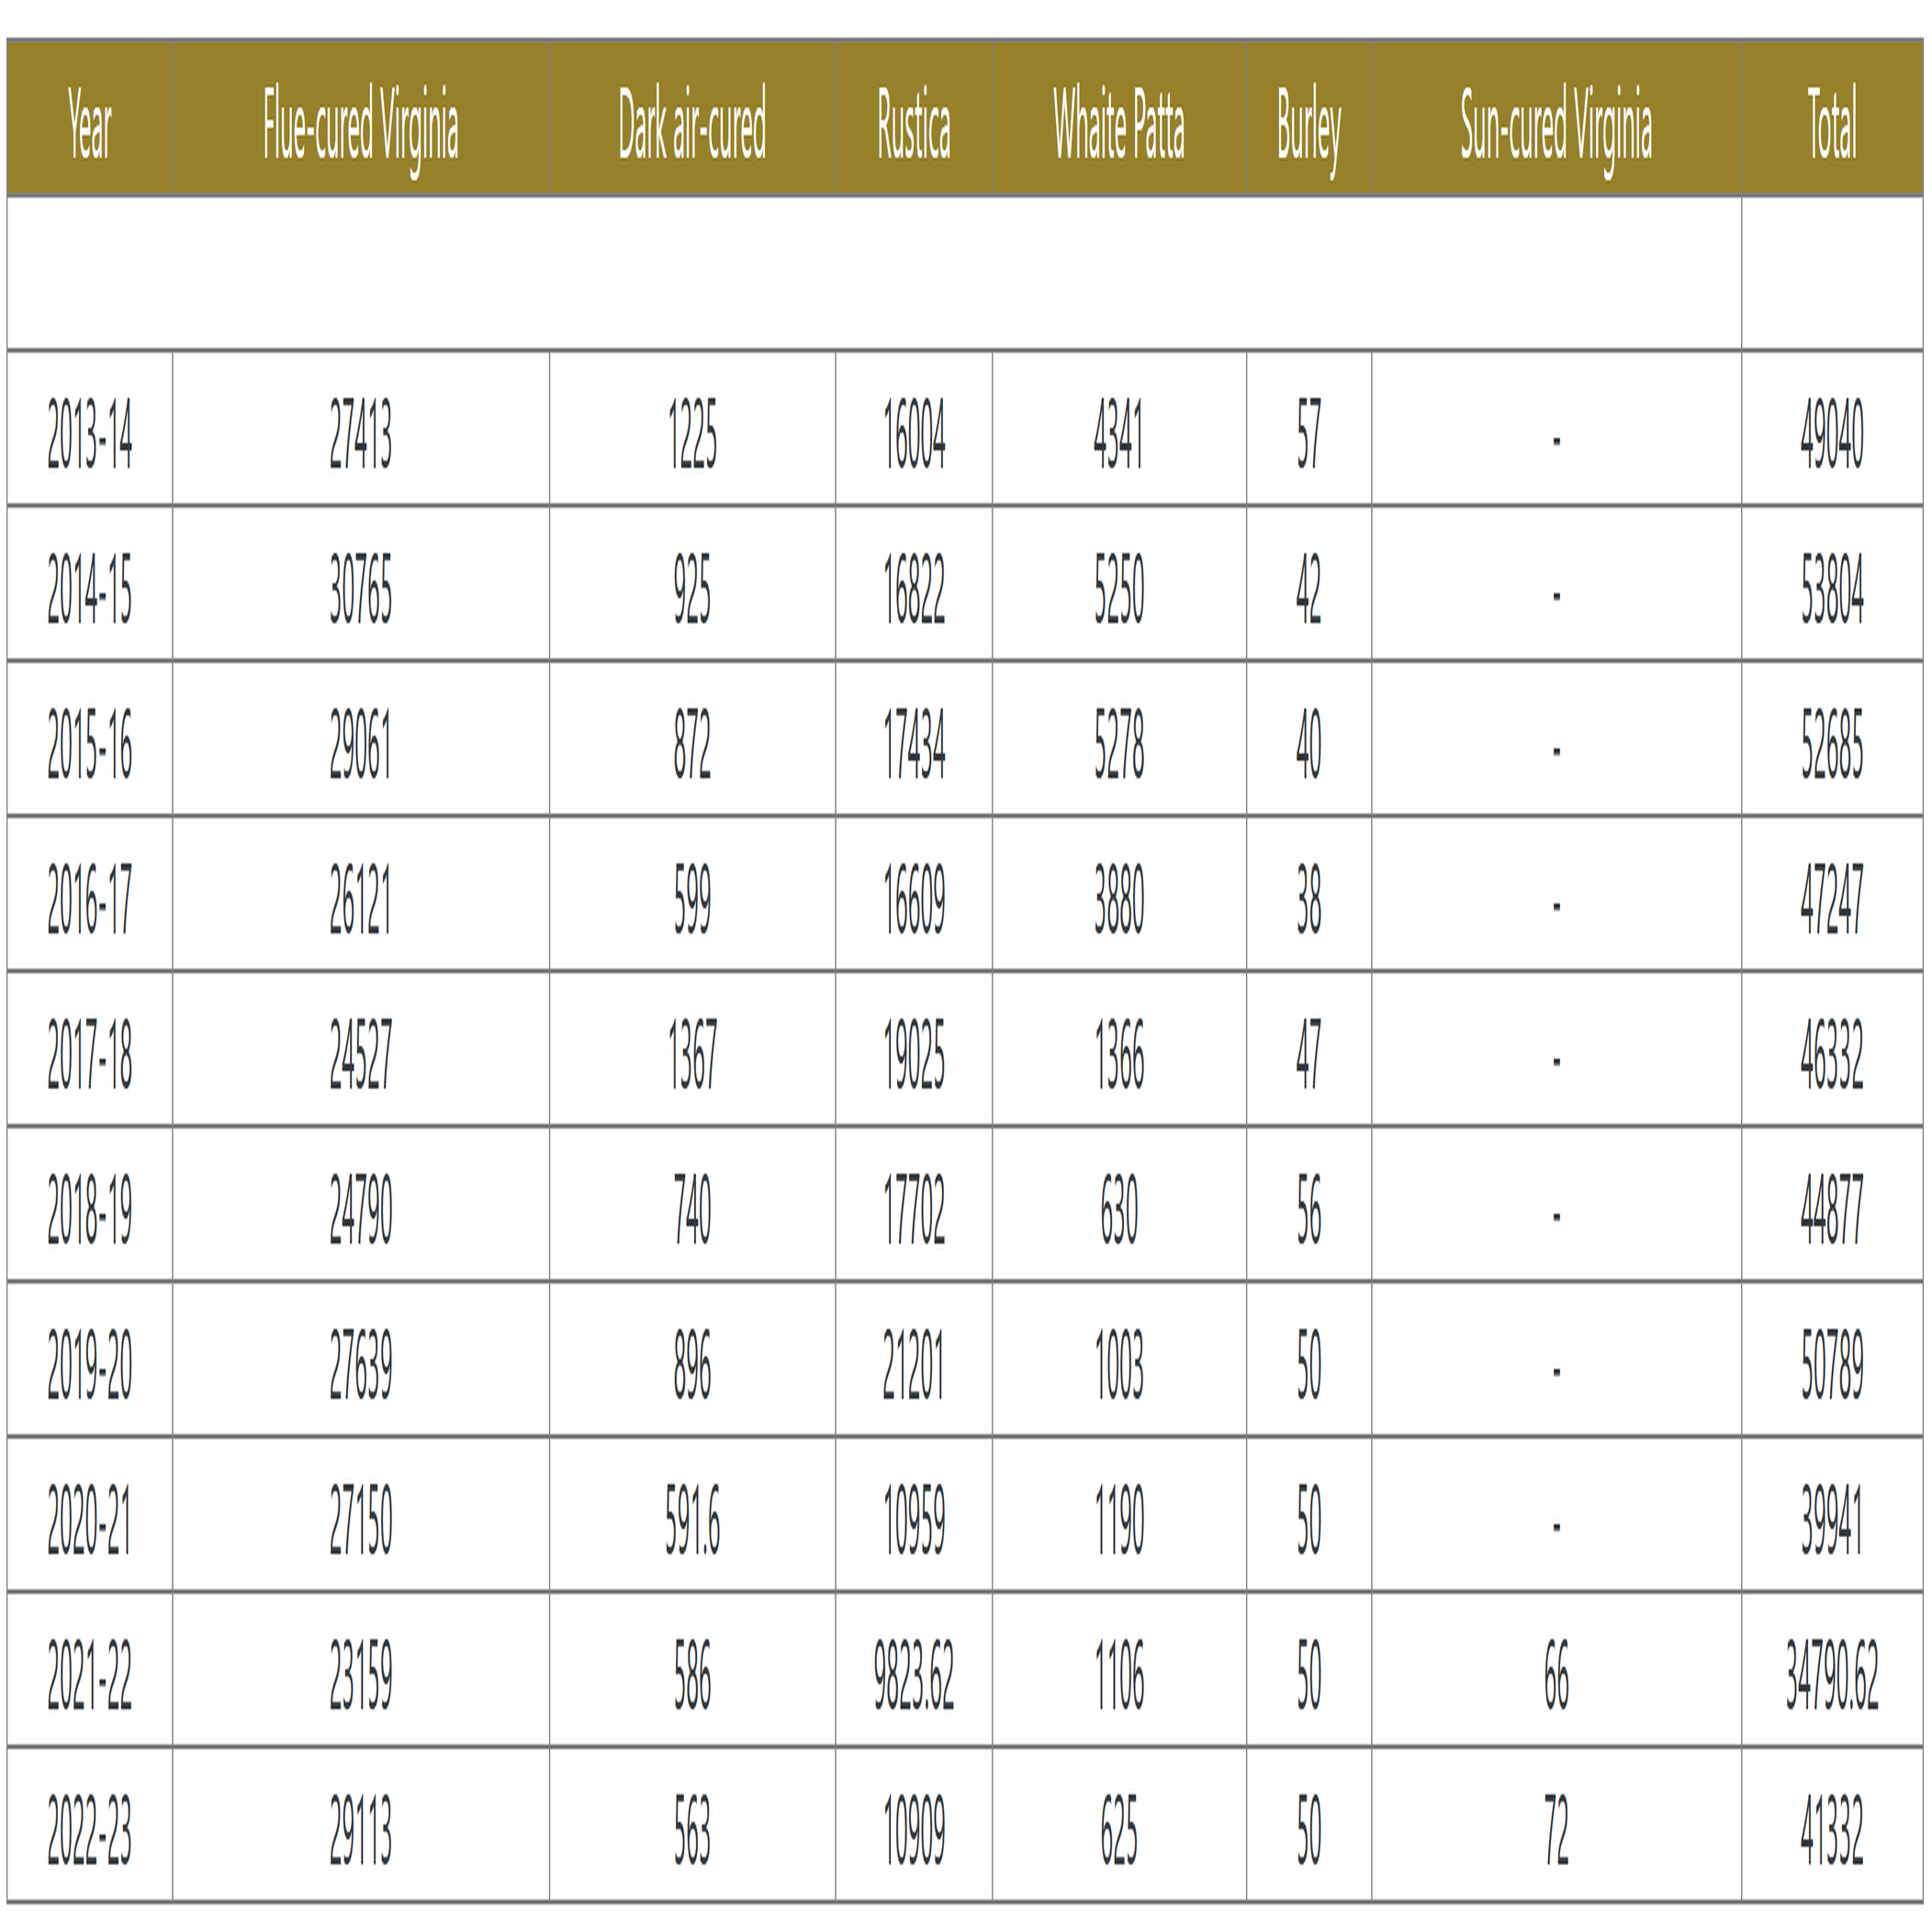
Figure 1. Area Under Differnt Type of Tobacco in Pakistan (HECTARES). Source: Pakistan Tobacco Board.
|
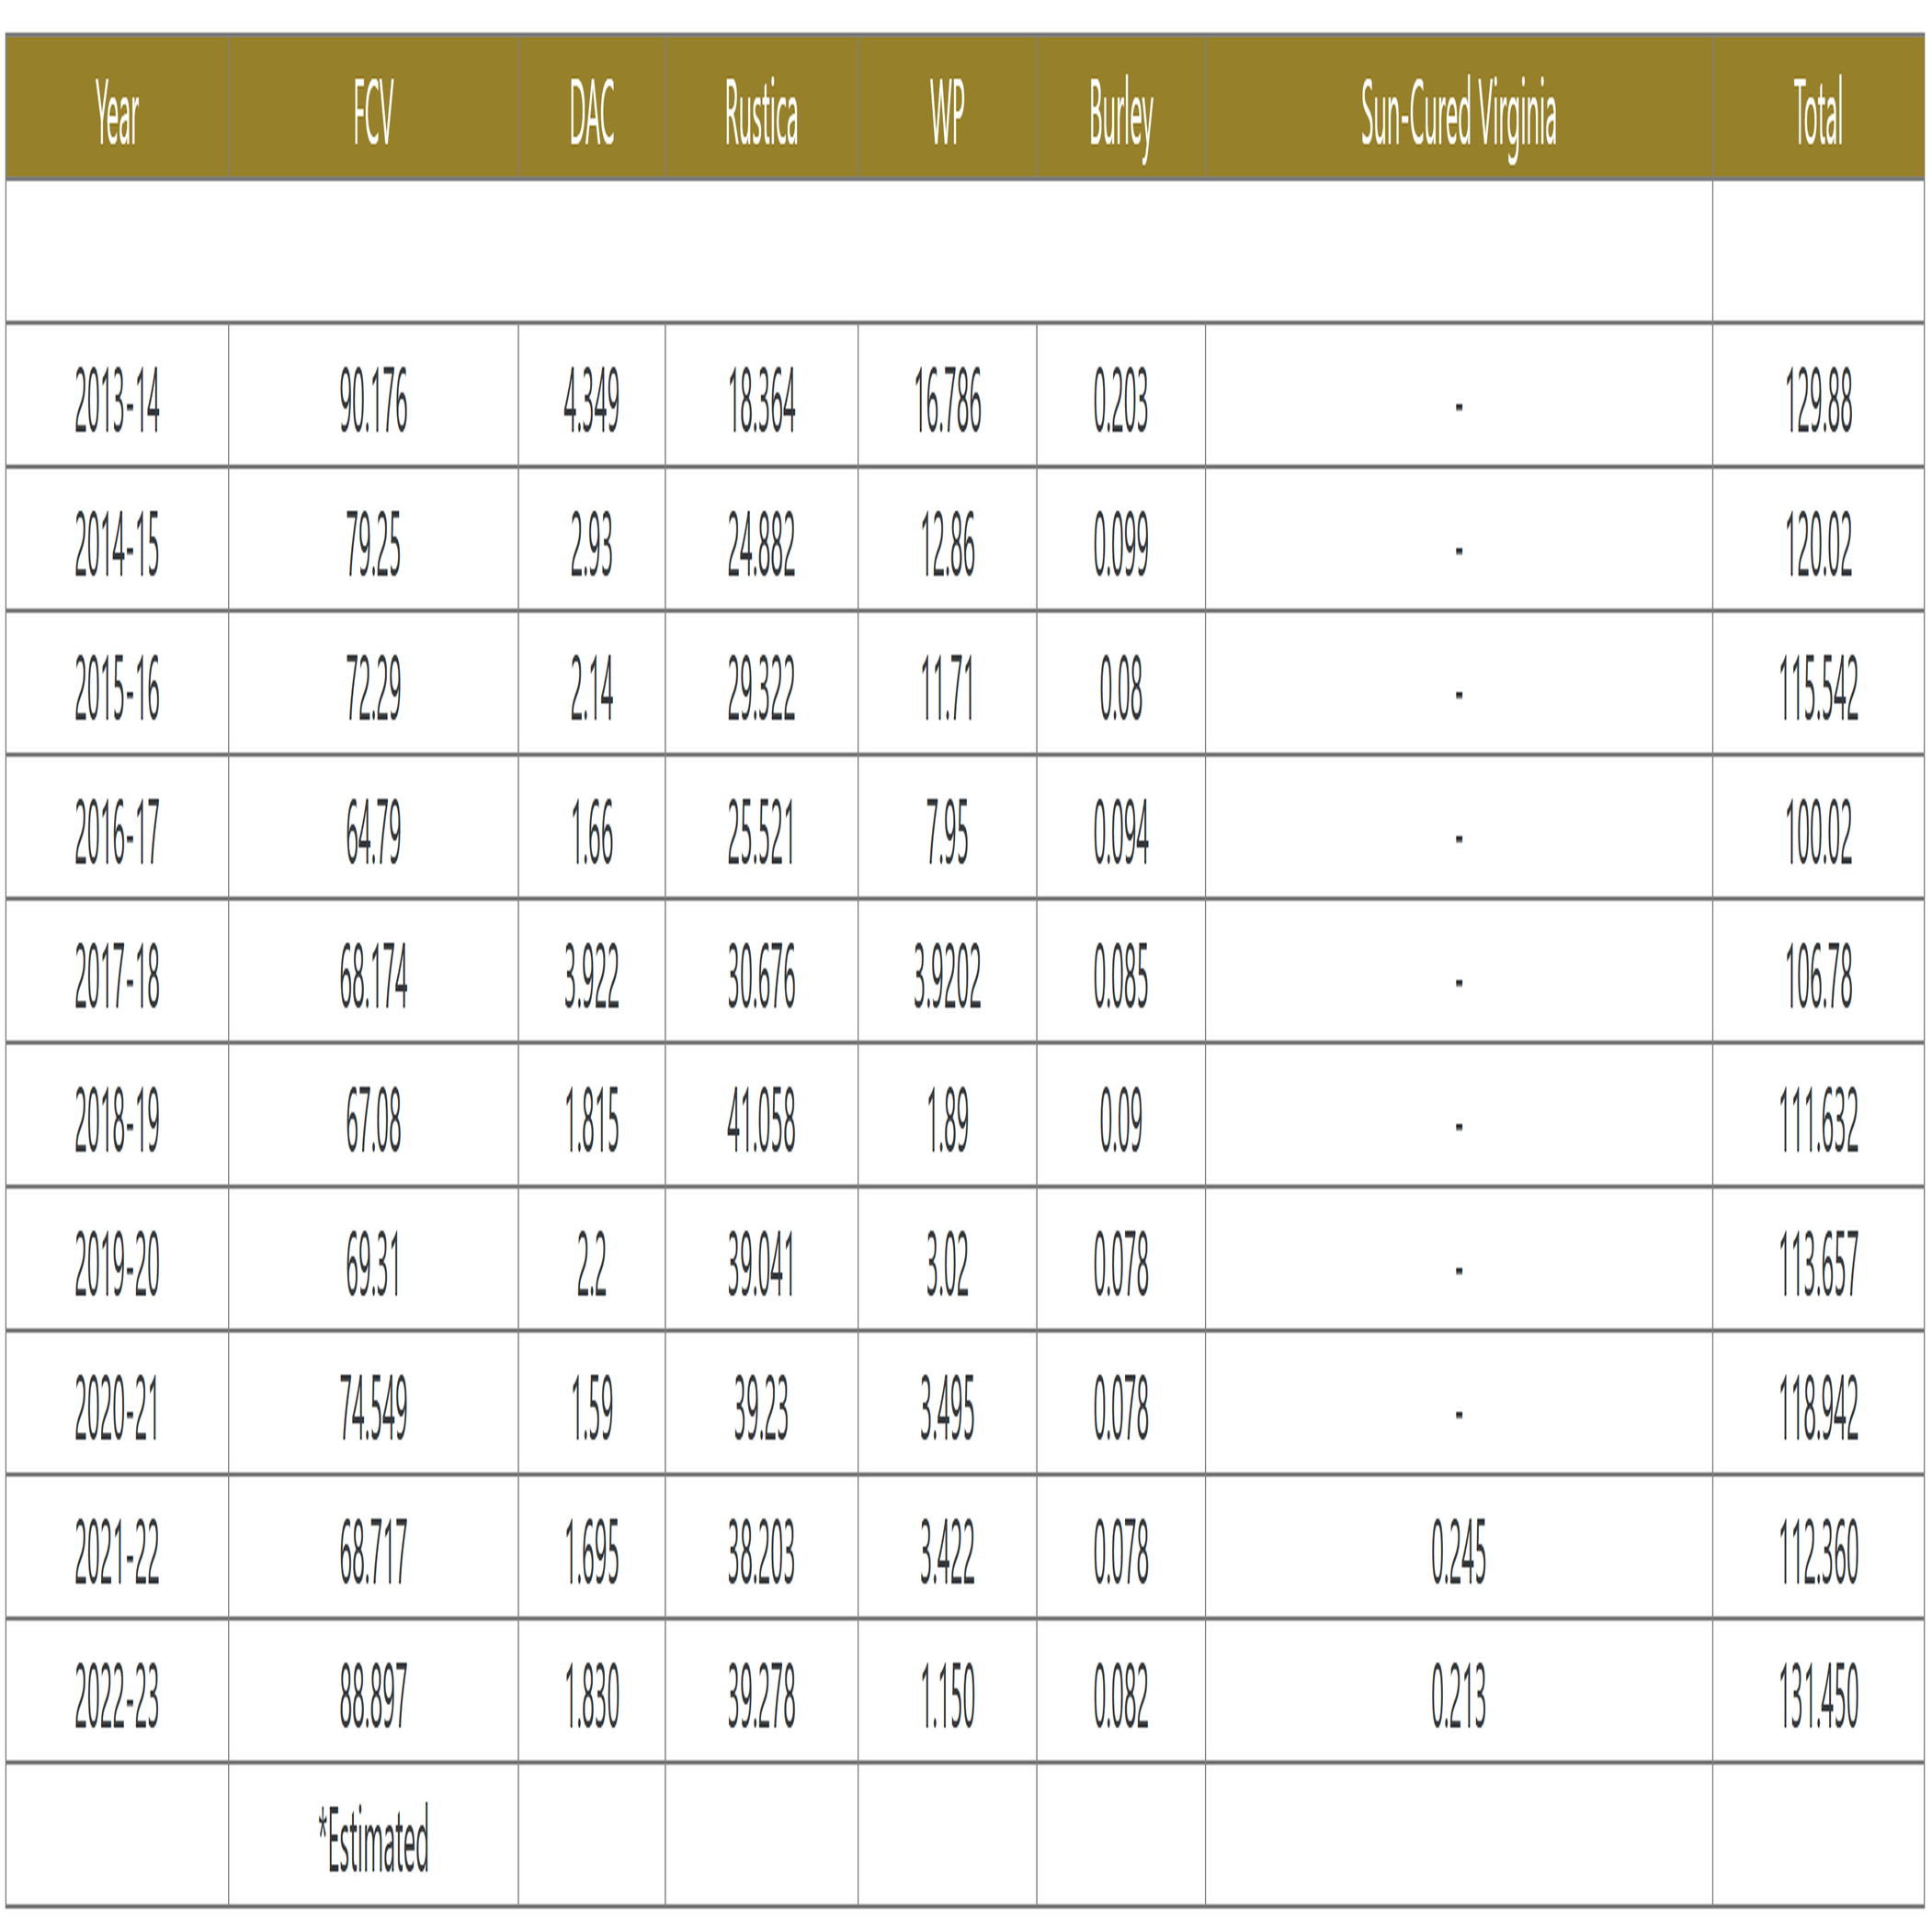
Figure 2. Production of Different Types of Tobacco in Pakistan (million kg). Source: Pakistan Tobacco Board.
Cigarette industry is one of the potential sectors for generating tax revenue due to being a production as well as a consumption sector in Pakistan. However, the dynamics of the country regarding poverty, low per capita income, low employment rate, etc., makes it quite difficult for people to afford expensive cigarettes when high tax rates are imposed, and due to inelastic consumption of cigarettes, a strong incentive is created for underground domestic production, smuggling and consumption of cheaper, low quality, and health hazardous cigarettes. Based on estimated consumption, import of cigarette filters alone (Figure 3), estimates of underground domestic production and smuggled quantity are shown in Figure 4. There might be slight variation in these estimates as there could be potential domestic underground production of cigarettes without filters as there is still abundant tobacco available even after accounting for other tobacco products and export quantity.
|
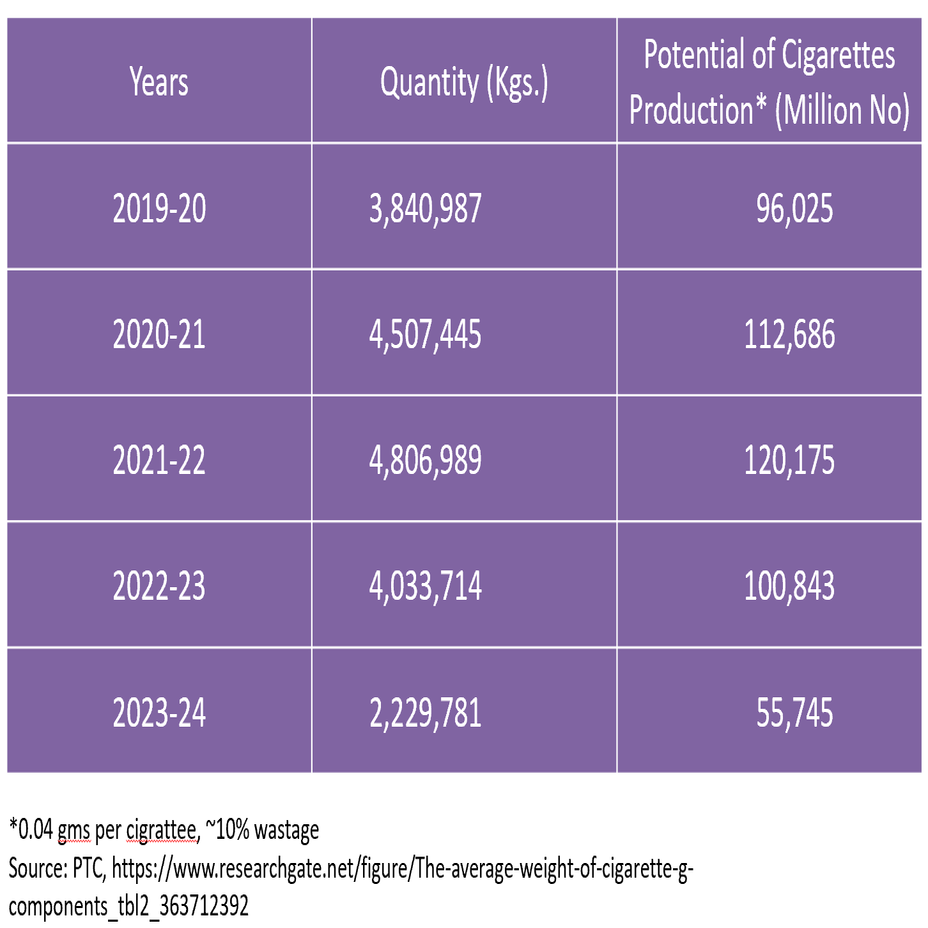
Figure 3. Import of Cigarette Filters in Pakistan. Source: PRAL, Federal Board of Revenue.
|
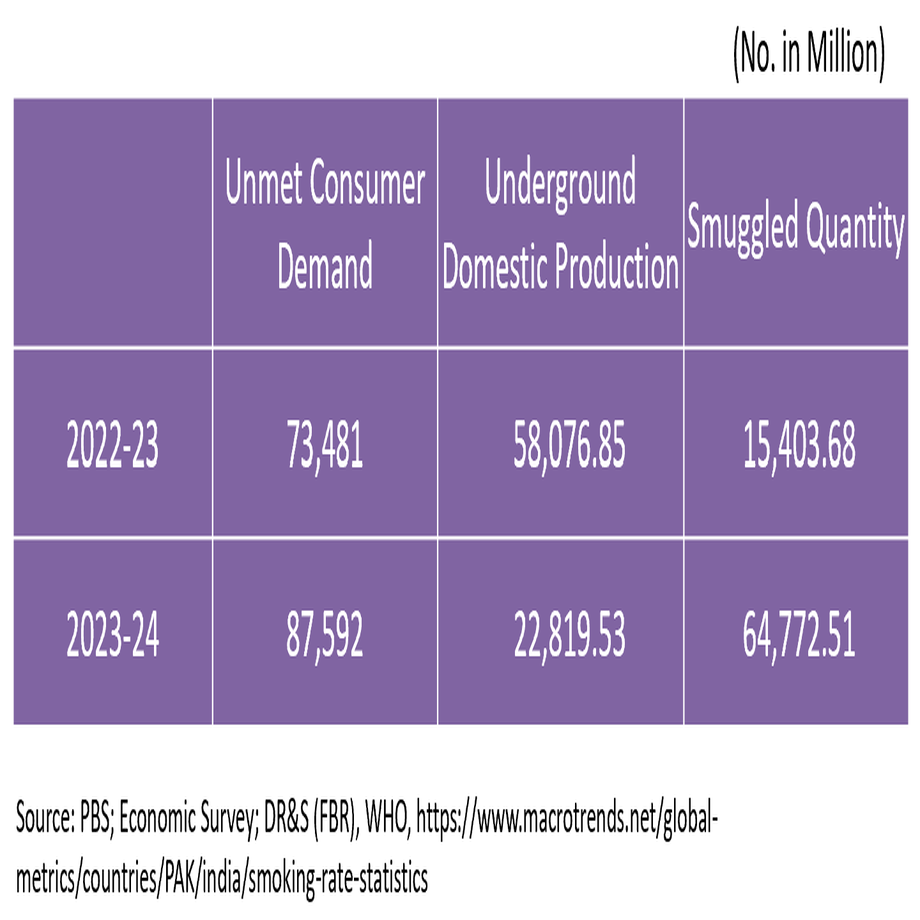
Figure 4. Estimates of Underground Domestic Production and Smuggled Quantity of Cigarettes in Pakistan.
There is a huge tax revenue leakage in cigarette industry in Pakistan as about two-thirds of the cigarette market is composed of illicit brands due to higher demand for cheaper cigarettes on account of affordability. Domestic market share of high end brands has drastically declined, i.e., 48 billion sticks in 2021-2022 to 26.8 billion in 2023-2024 according to the VAT returns data of the federal board of revenue. PTC and philip morris are contributing over 97% of the tax revenue from cigarette industry.
To begin with, data on VAT revenue from the cigarette industry and consumption of cigarettes at current market prices at a constant tax rate and compliance were selected and analyzed for the time period 2001-2024. Tests for the normality of tax revenue collection based on skewness and kurtosis have been done, which confirm that the data is normally distributed. Skewness is a measure of the asymmetry of the probability distribution of a random variable about its mean. It represents the amount and direction of skew. On the other hand, Kurtosis represents the height and sharpness of the central peak relative to that of a standard bell curve.
Plotting tax revenue against the corresponding consumption values at a constant tax rate and compliance, a linear relationship appeared to emerge. However, the possibility of a better fit was considered, and as a result, several models were considered and compared. Four different models were compared, with the mean squared percent error calculated and analyzed for each. Additionally, the error sum of squares, standard error, and mean absolute deviation were also compared across the four models. Among the four models, i.e., tax revenue versus consumption, log natural of tax revenue versus log natural of consumption, log natural of tax revenue versus consumption, and tax revenue versus log natural of consumption, the best fit turned out to be for tax revenue versus consumption without a constant. Therefore, we can write the function as follows (Table 1):
|
where C is consumption of cigarettes.
From Section 3, it is evident that
|
Table 1. Regarding Estimates of K for Different Tax Rates
VAT Collection |
K |
Std.Err. |
t |
P>|t| |
95% Conf.Interval |
C (x=0.15) |
0.0,432,158 |
0.0,010,619 |
40.70 |
0.000 |
[0.0,406,174, 0.0,458,143] |
C (x=0.17) |
0.0,363,385 |
0.00,223 |
16.29 |
0.000 |
[0.0,312,937, 0.0,413,832] |
The slope of the plot of K versus x as x approaches zero is equal to a. In other words, as x approaches zero, the rate of change of K with respect to x becomes a as follows.
|
Which implies that Equation (8).
|
The value of a from plot of K versus x as x→0 turned out to be 1.6, and also confirmed in non-linear regression presented later.
6.3 Compliance as a Function of Tax Rate
Based on the analysis of data, plot of K versus x and boundary conditions, the following function for compliance has been proposed.
|
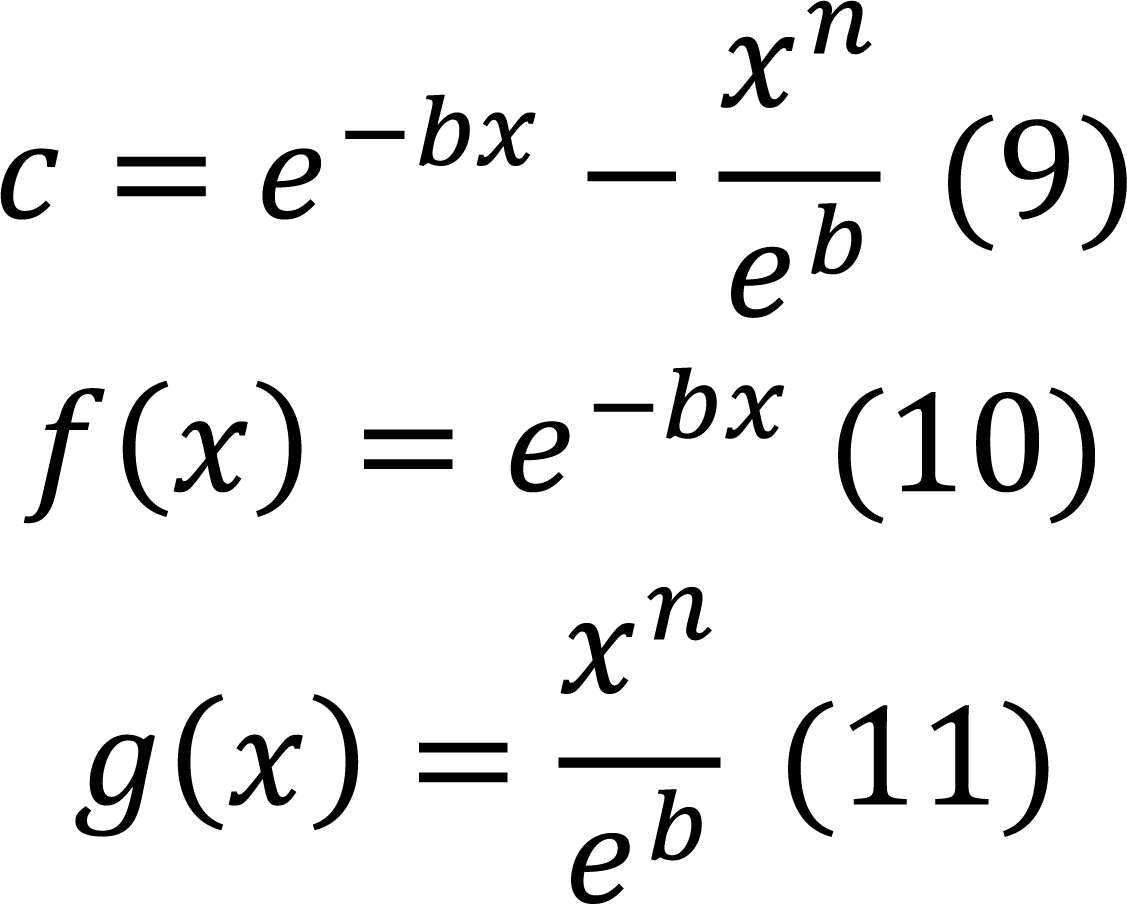
where x must be expressed in percentage terms, e.g., for a tax rate of 15 percent, x=0.15. n and b are country and time specific parameters, which depend on factors such as deterrence created by tax administration through effective monitoring, peopleʼs behaviors and attitudes, and the overall economic conditions of a country. The function above indicates that when the tax rate is zero, compliance equals one, and when the tax rate approaches 100 percent, compliance approaches zero, meaning the compliance value falls between zero and one. The values of b and n have been determined through an iterative process to best fit the practical data, with the final values listed as given below (Table 2).
Table 2. The Final Values of b and n
b |
n |
12 |
2 |
The parameters have been estimated through non-linear regression based on the following expression.
|
which for time series data can be expressed as follows.
|
where ϵt is noise with an unknown structure. The main parameters to be estimated in Equation (13) are a, b and n. The objective function and the moment conditions are as follows.
|
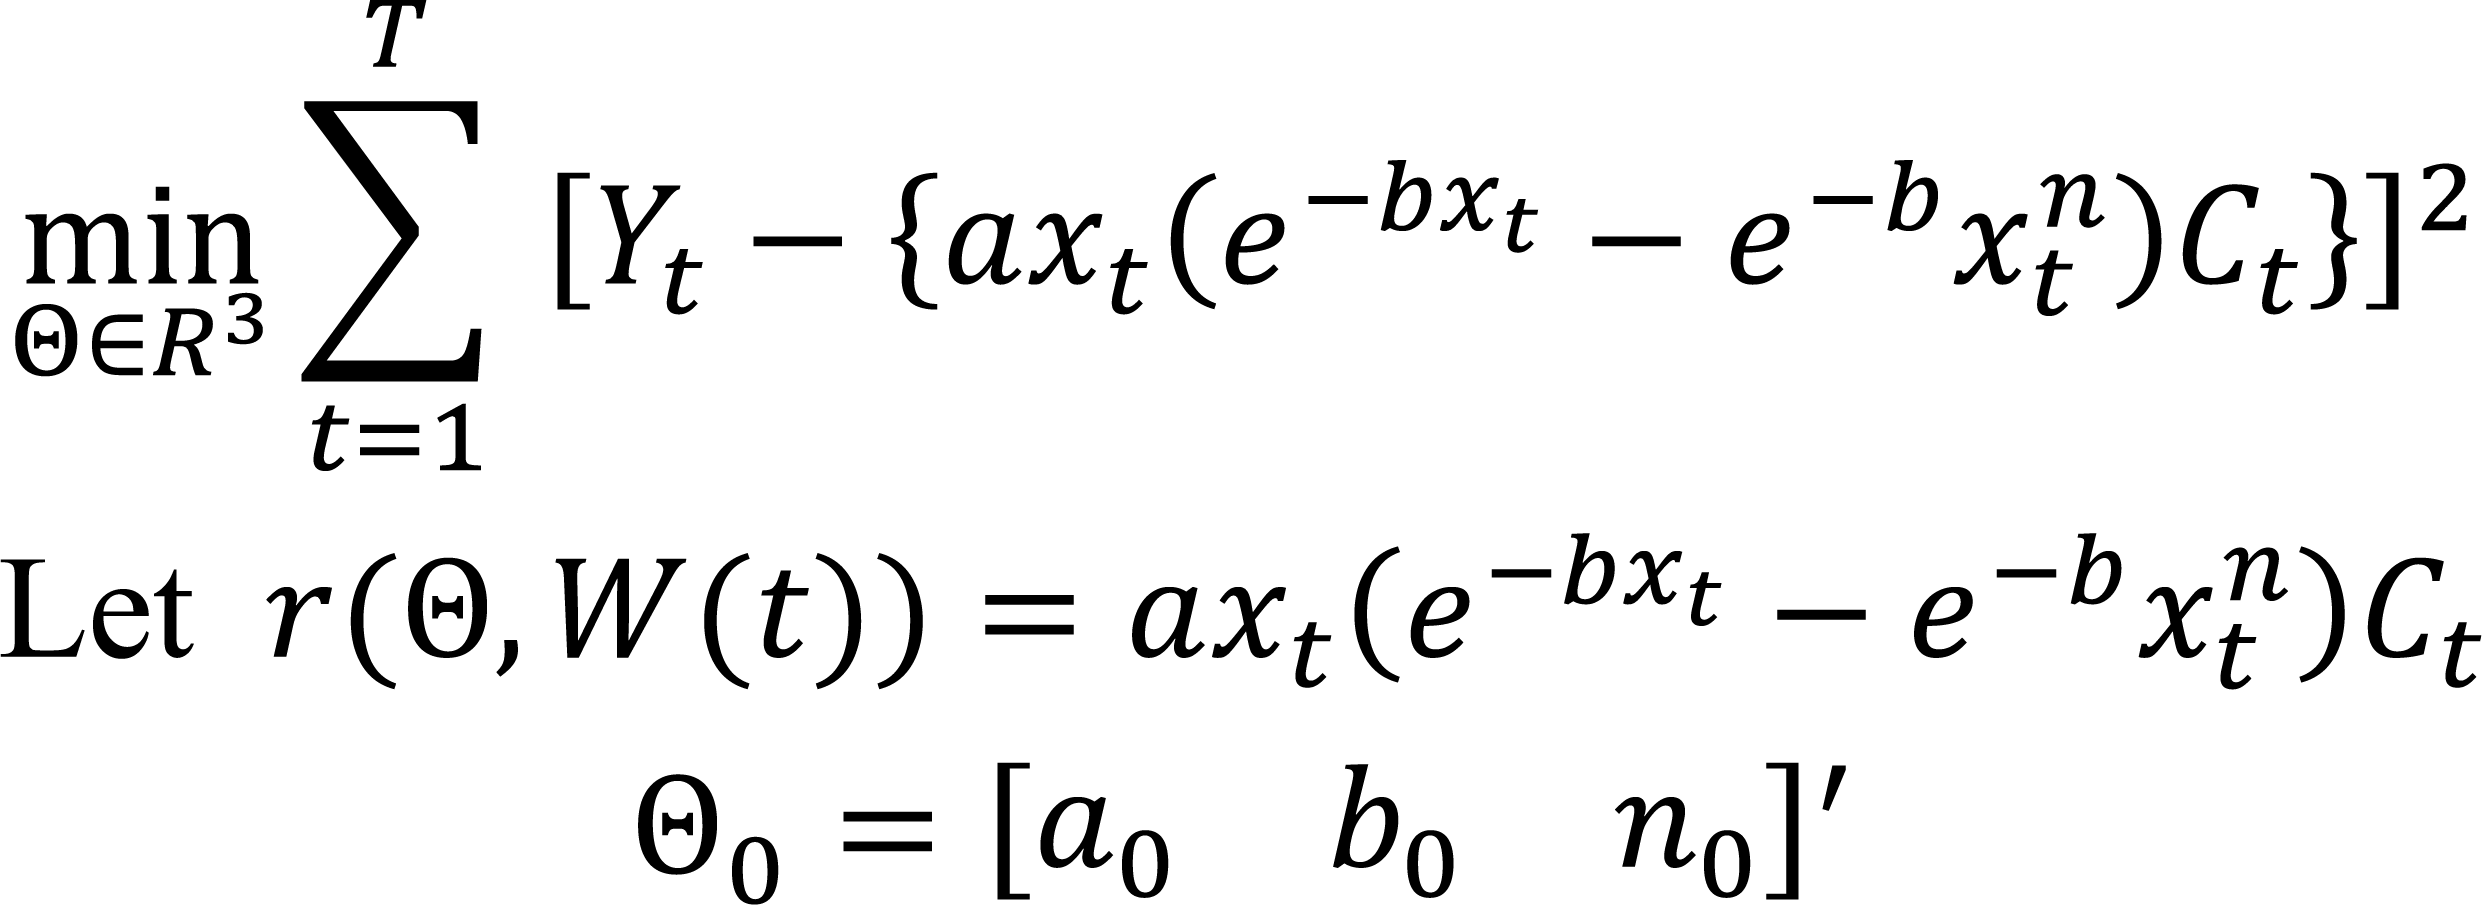
The parameter space is Θ=R3. We can write our problem in vector notation as follows.
|
The three moment conditions are given below.
|
The HAC Robust Standard Errors are based on Nawaz[15]. The estimate for VAT compliance is 0.115,324,922, i.e., around 11.53 percent, with a HAC robust standard error of 0.046,129 estimated through Delta method. Test for normality of residuals based on skewness and kurtosis, “sktest” in Stata shows the number of observations (which is 24 here) and the probability of skewness which is 0.8,035 implying that skewness is asymptotically normally distributed (p-value of skewness>0.05). Similarly, Pr (Kurtosis) indicates that kurtosis is also asymptotically distributed (p-value of kurtosis>0.05). Finally, chi (2) is 0.1,426 which is greater than 0.05 implying its significance at a 5% level. Consequently, the null hypothesis cannot be rejected. Therefore, according to the Skewness test for normality, residuals show normal distribution. The other test of normality is the Jarque Bera test. If the p-value is lower than the Chi (2) value then the null hypothesis cannot be rejected. Therefore residuals are normality distributed. The value of Chi (2) is 0.1,211 which is greater than 0.05. Therefore, the null hypothesis cannot be rejected. Moreover, there is no violation of the normal distribution assumption of error terms as the residuals are coming out to be normal. The potential tax base, i.e., final consumption of cigarettes is as follows (Table 3).
Table 3. The Estimates Along with Their Standard Errors
|
a |
b |
n |
|
1.6 |
12 |
2 |
Standard Error |
(0.64) |
(5.01) |
(1.25) |
Robust Standard Error |
(0.67) |
(5.83) |
(1.72) |
|
which provides an estimate of under reported consumption in various surveys. As the estimated value of a=1.6, this implies that the quantum of unreported consumption of cigarettes is 0.6 times the reported consumption, i.e., 37.5 percent of the consumption of cigarettes remains unreported in surveys.
For some Θ0∈Θ, E (Y)=r (Θ, W(t)) [holds by construction].
|
Θ0 solves the population minimization problem. The sample analog of the population problem is as follows.
|
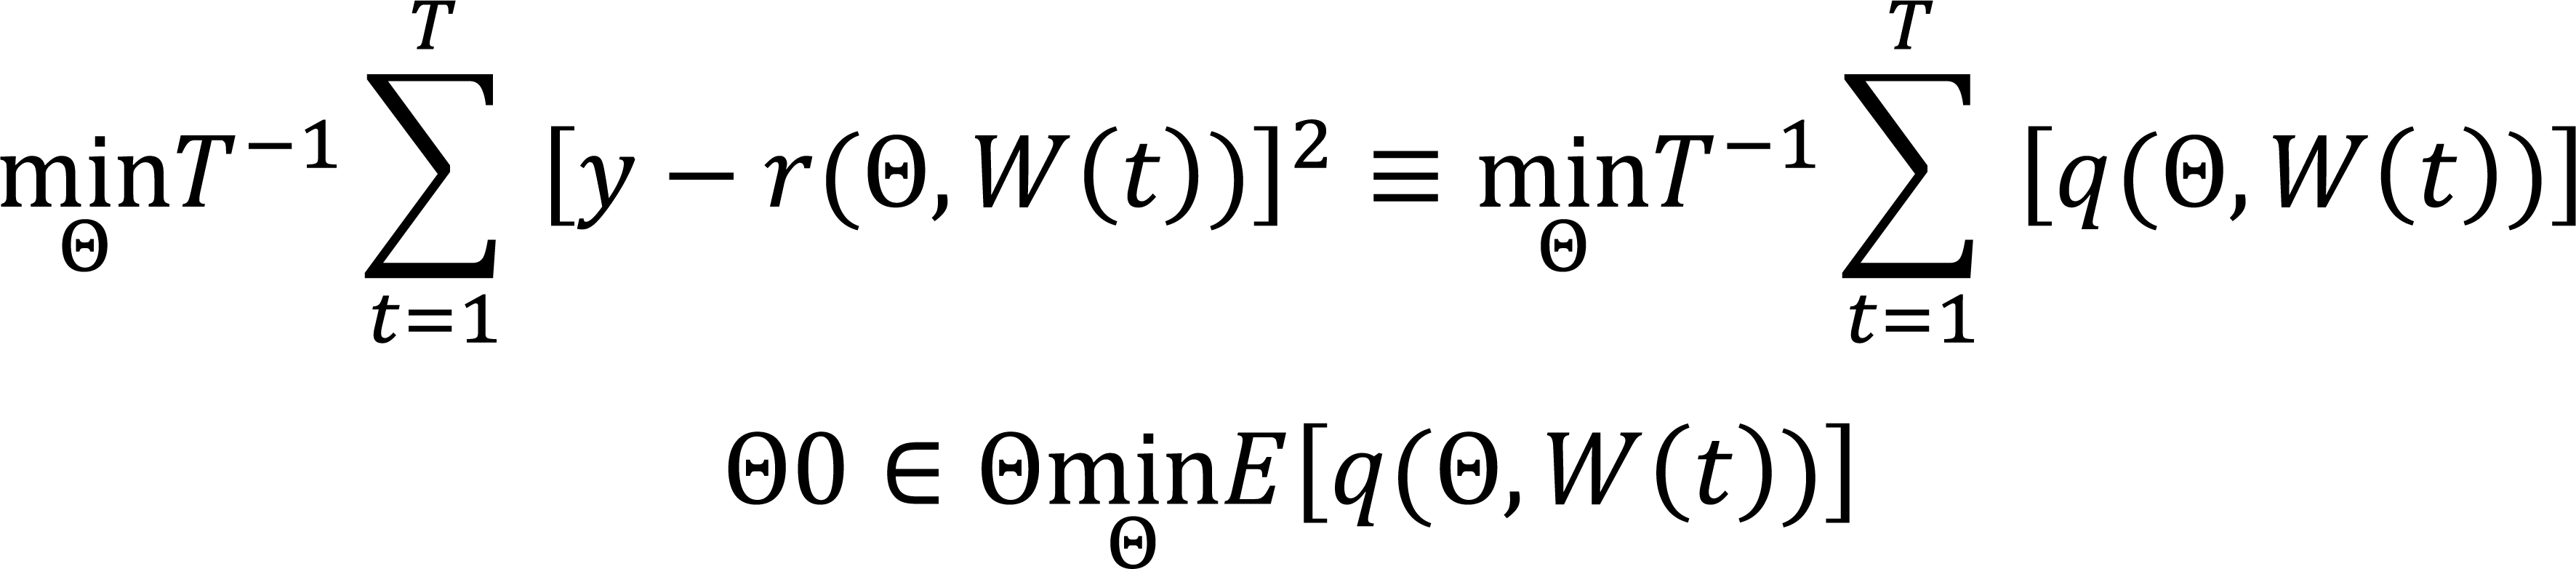
where q: Θ × Ť→ R is a real valued function of t and the parameter vector Θ. By the law of large numbers, for each Θ.
|
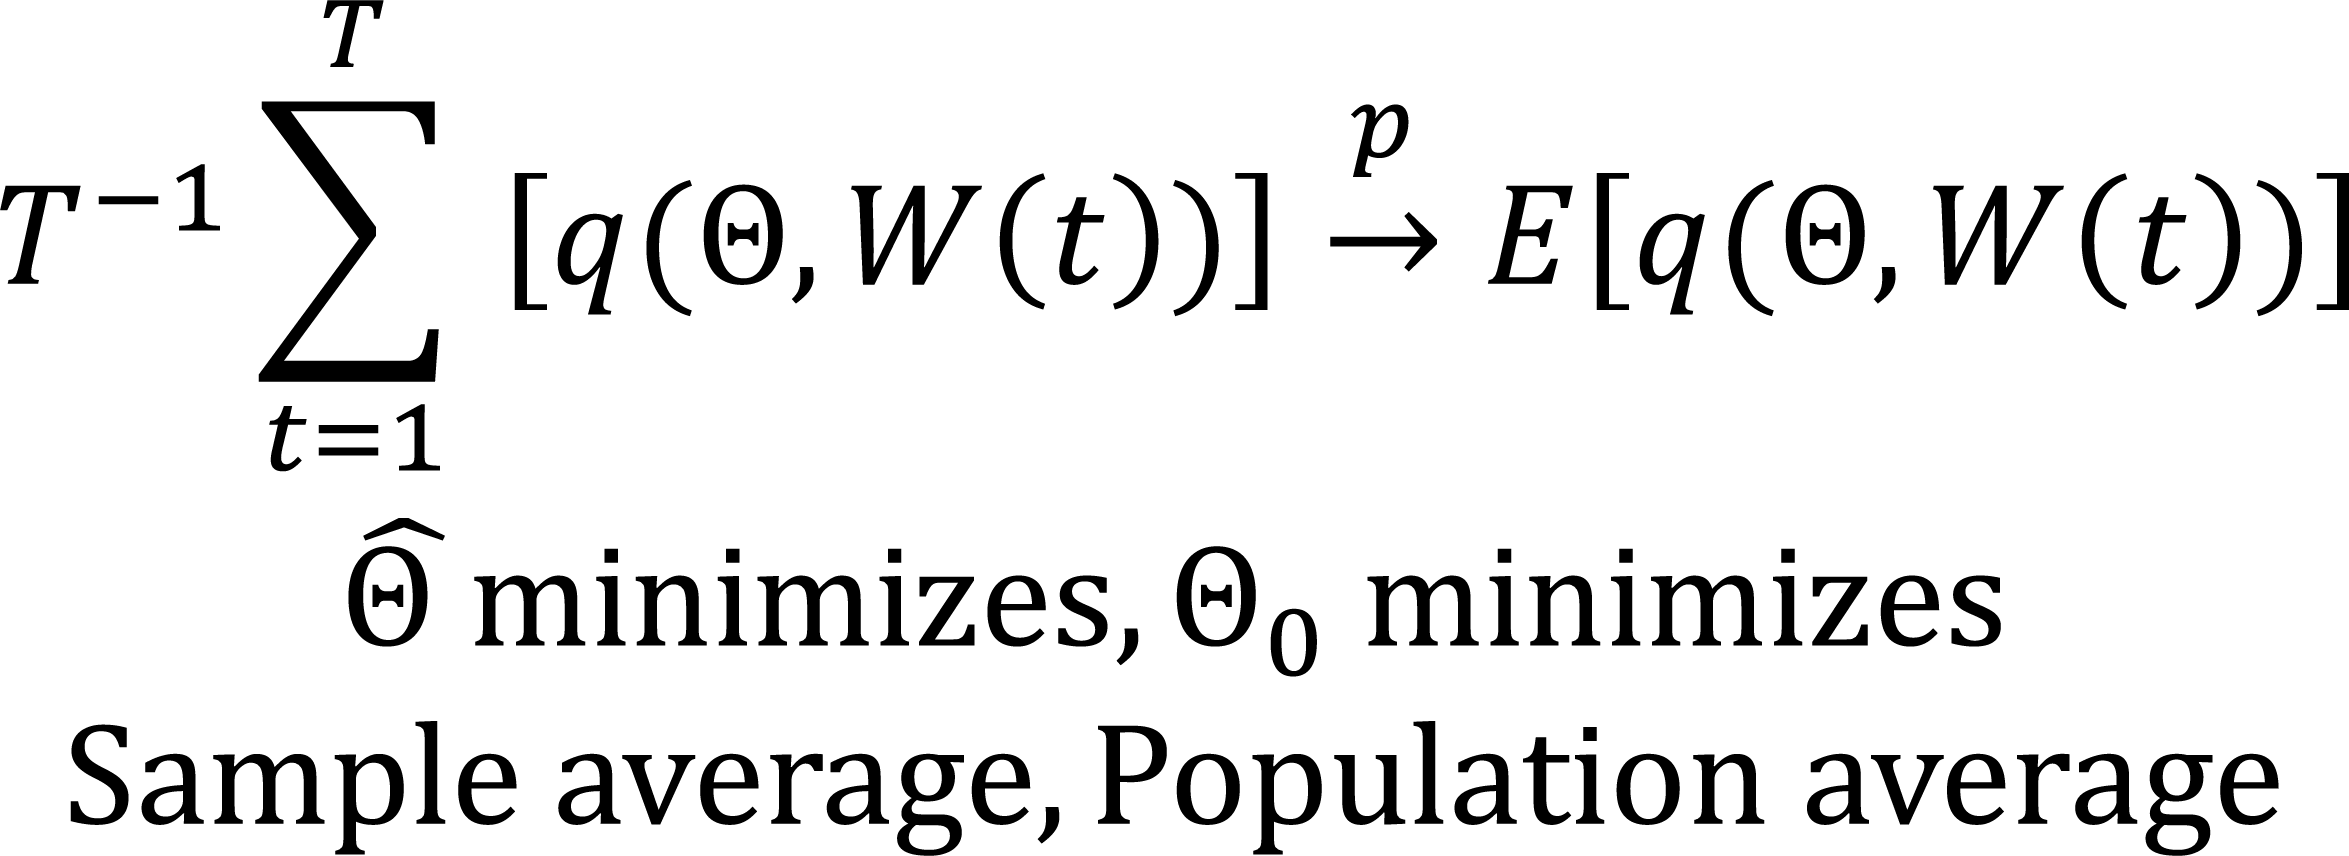
The point wise convergence of the sample objective function is not sufficient for consistency. A sufficient condition is “uniform convergence in probability”.
|
|
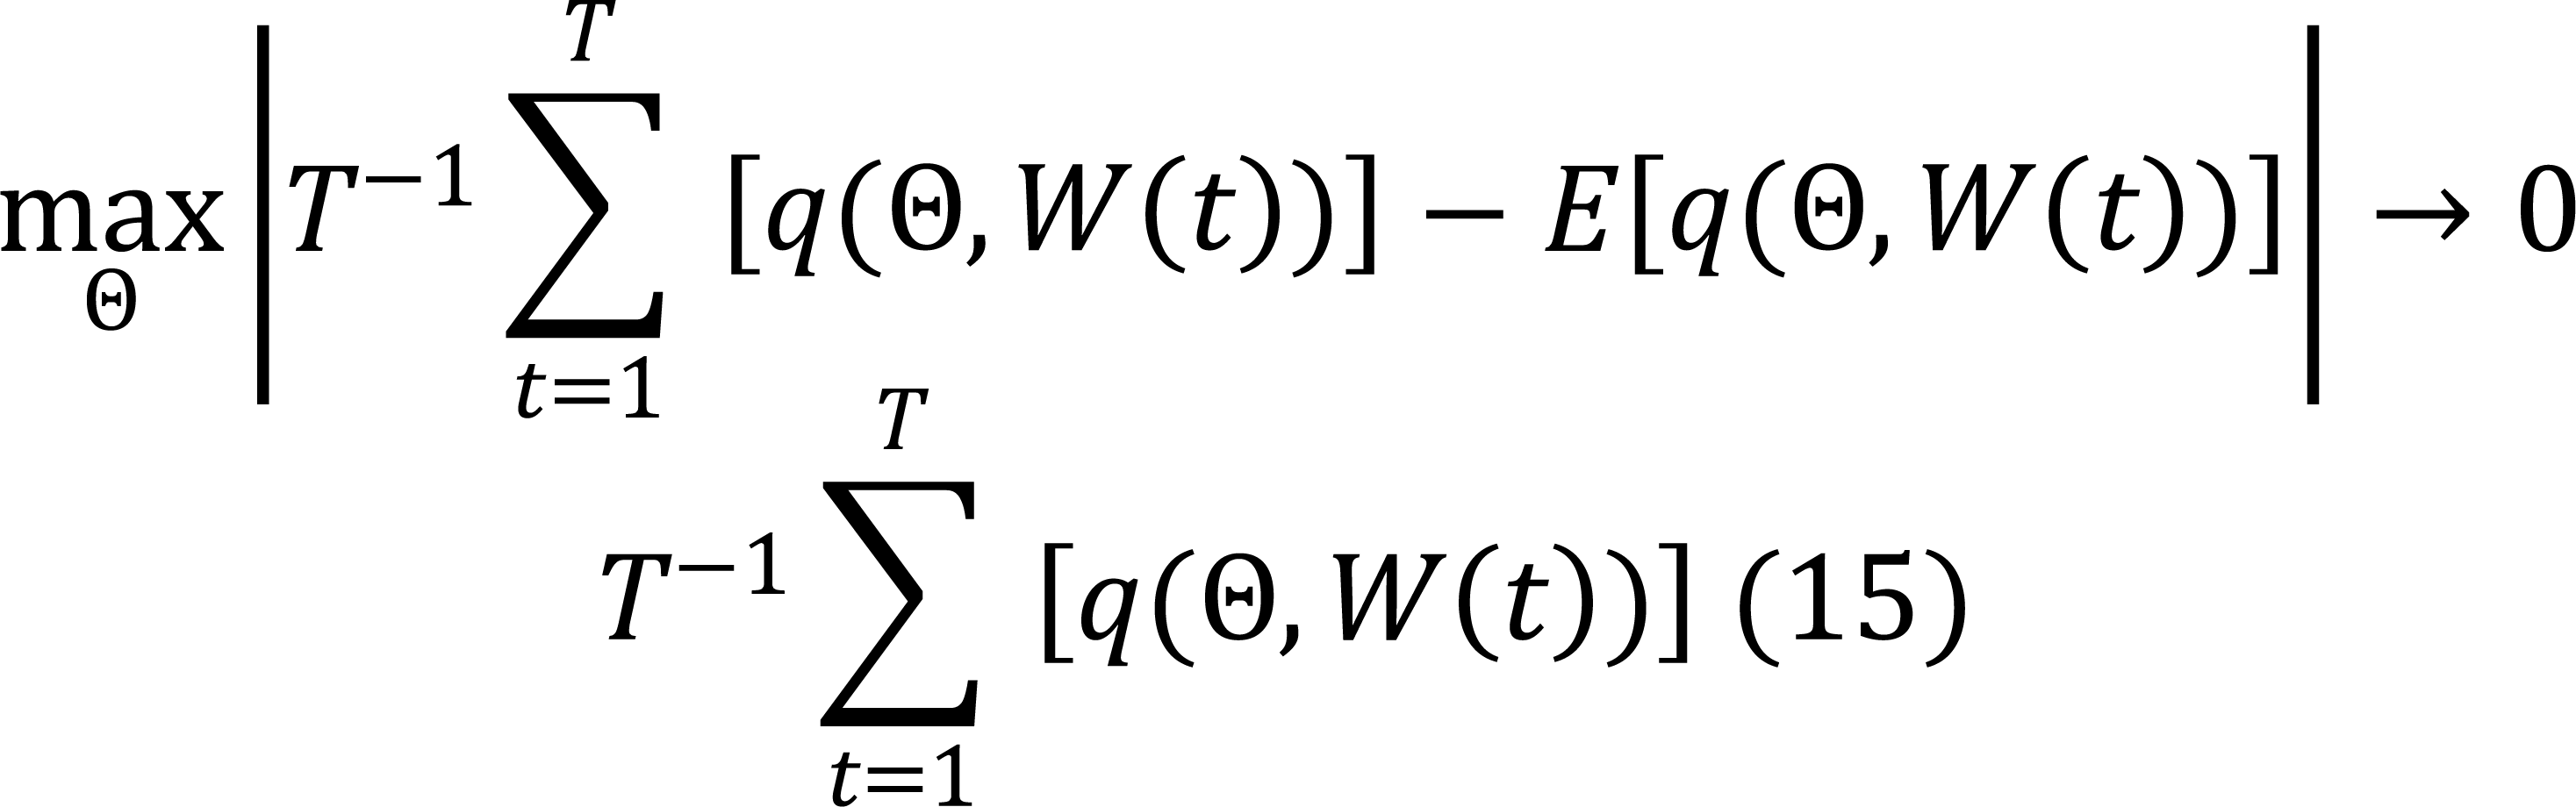
Which means that we can bound the distance between Equation (15) and its expected value by something that does not depend on Θ. In “regular”, cases the point wise law of large numbers translates into the “uniform law of large numbers”. Sufficient is that q (Θ, W (t)) is continuous on Θ, Θ is closed and bounded (compact) and |q (Θ, W (t))| ≤ b (t) for some function b (t) with E [b (t)]<ꝏ. It can be easily seen that all these conditions are satisfied by q (Θ, W (t)) defined in Equation (14). Other than regularity conditions-continuity of q (Θ, W (t)) and finite moments, the key consistency assumption is identification. Namely, Θ0 is the unique solution to the population problem.
|
The above mentioned condition is satisfied as E [q (Θ, W (t))] is a convex function. This can be easily verified from the Hessian of E [q (Θ, W (t))] as follows.
|
The third column of the above matrix is as follows.
|
The determinants of the principle minors are Equations (16-18).
|
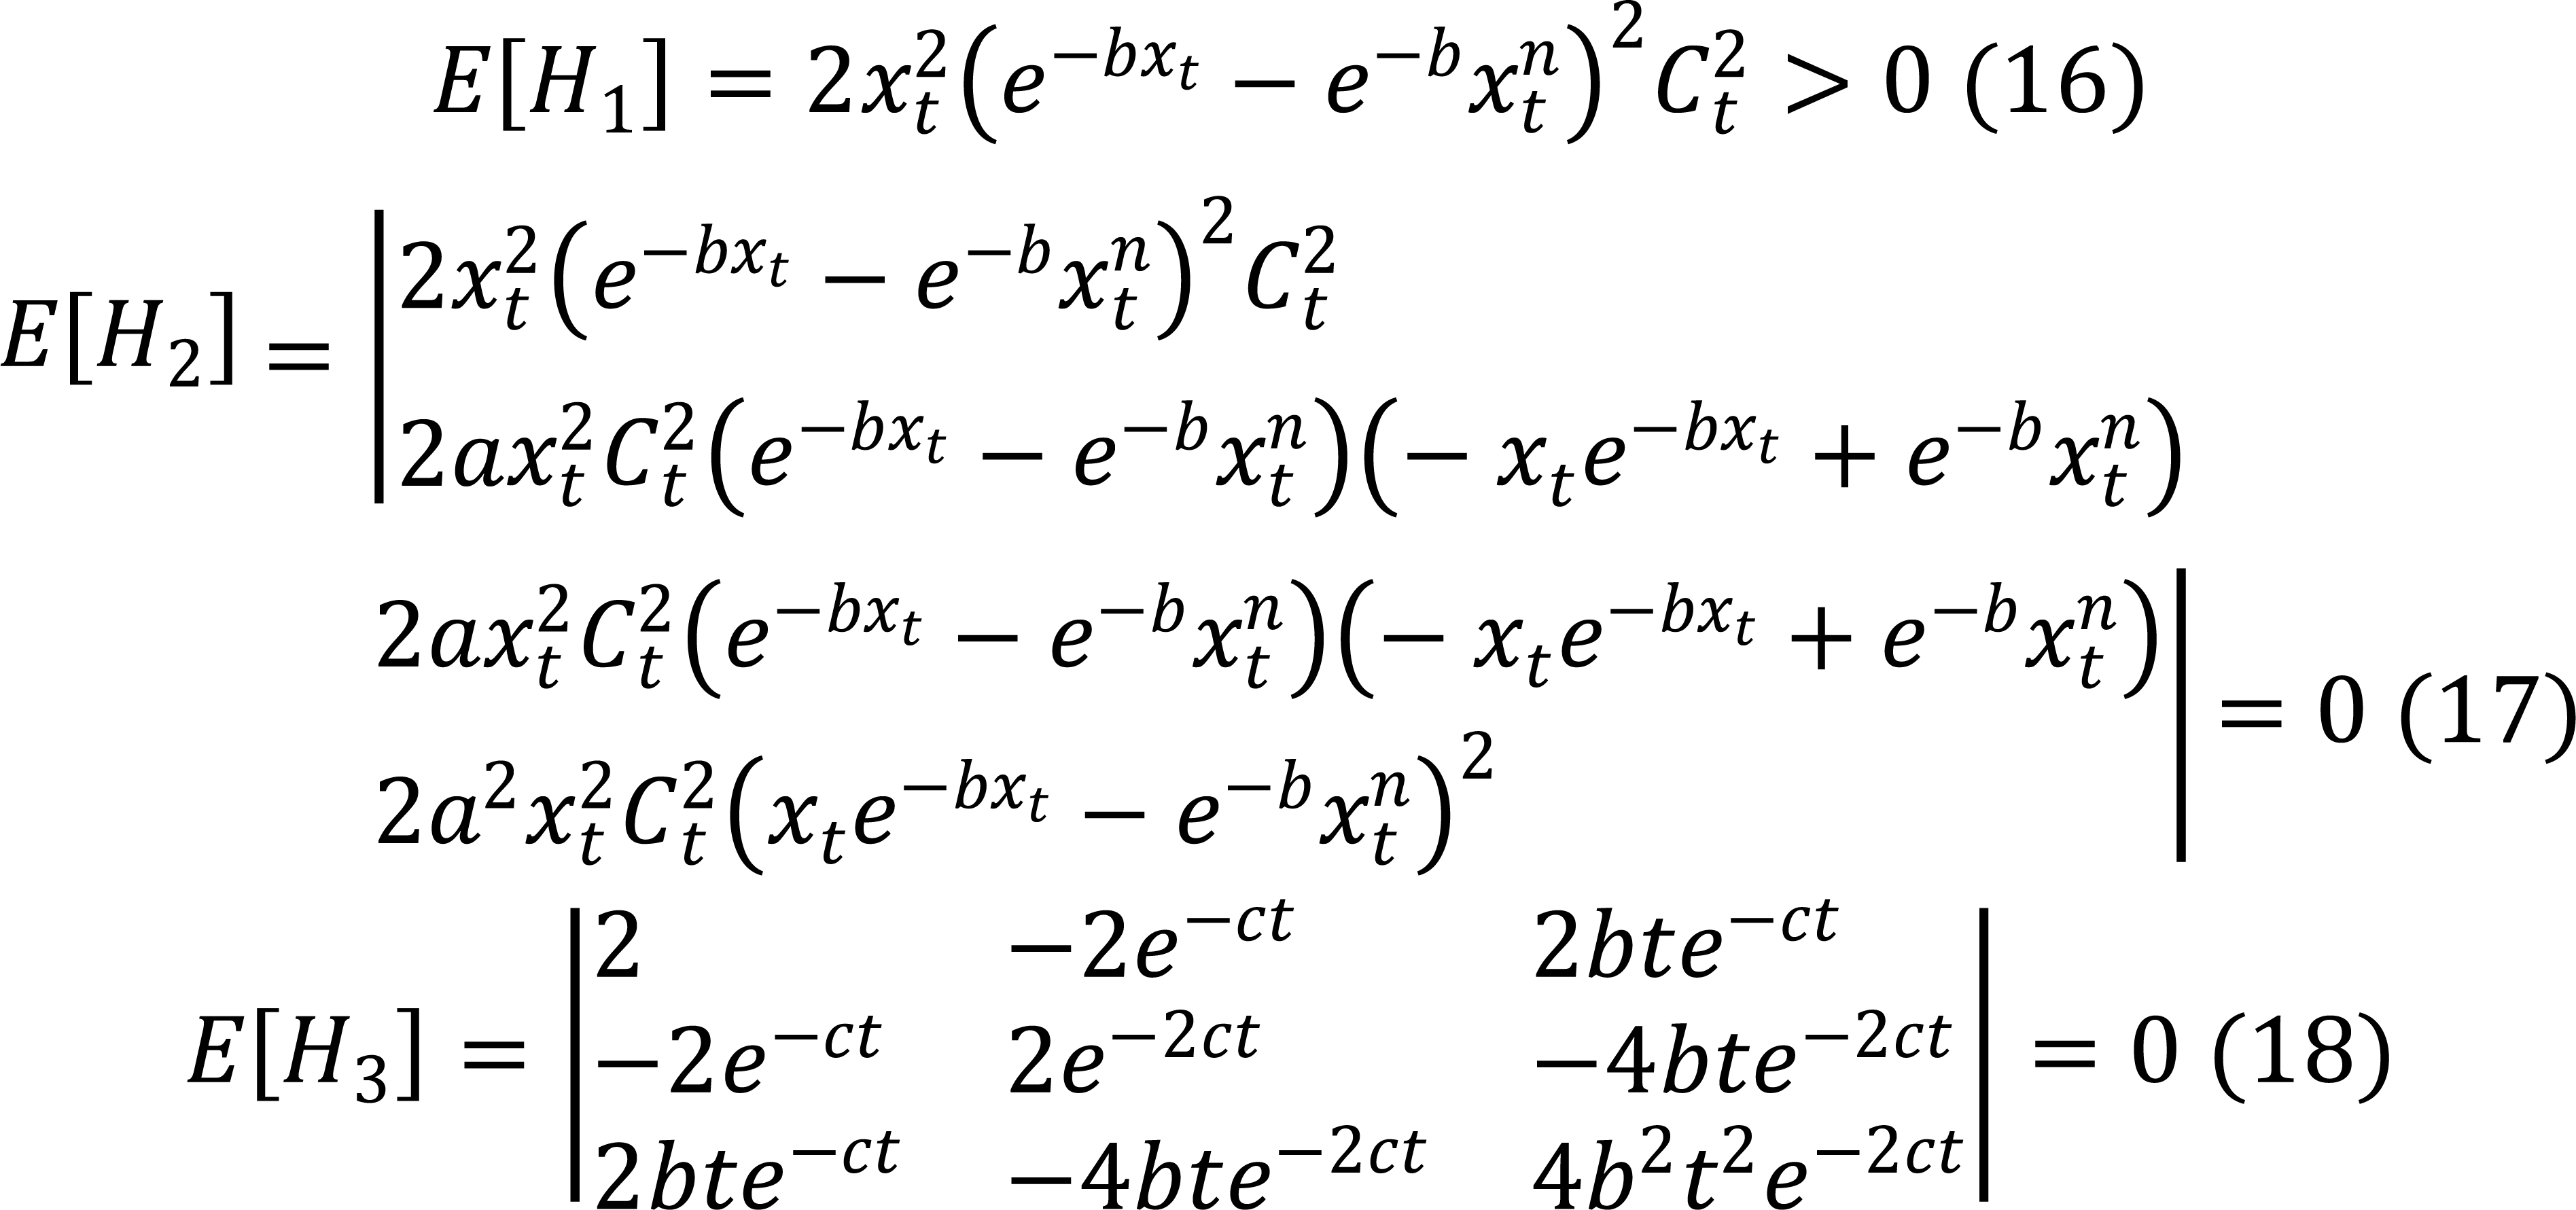
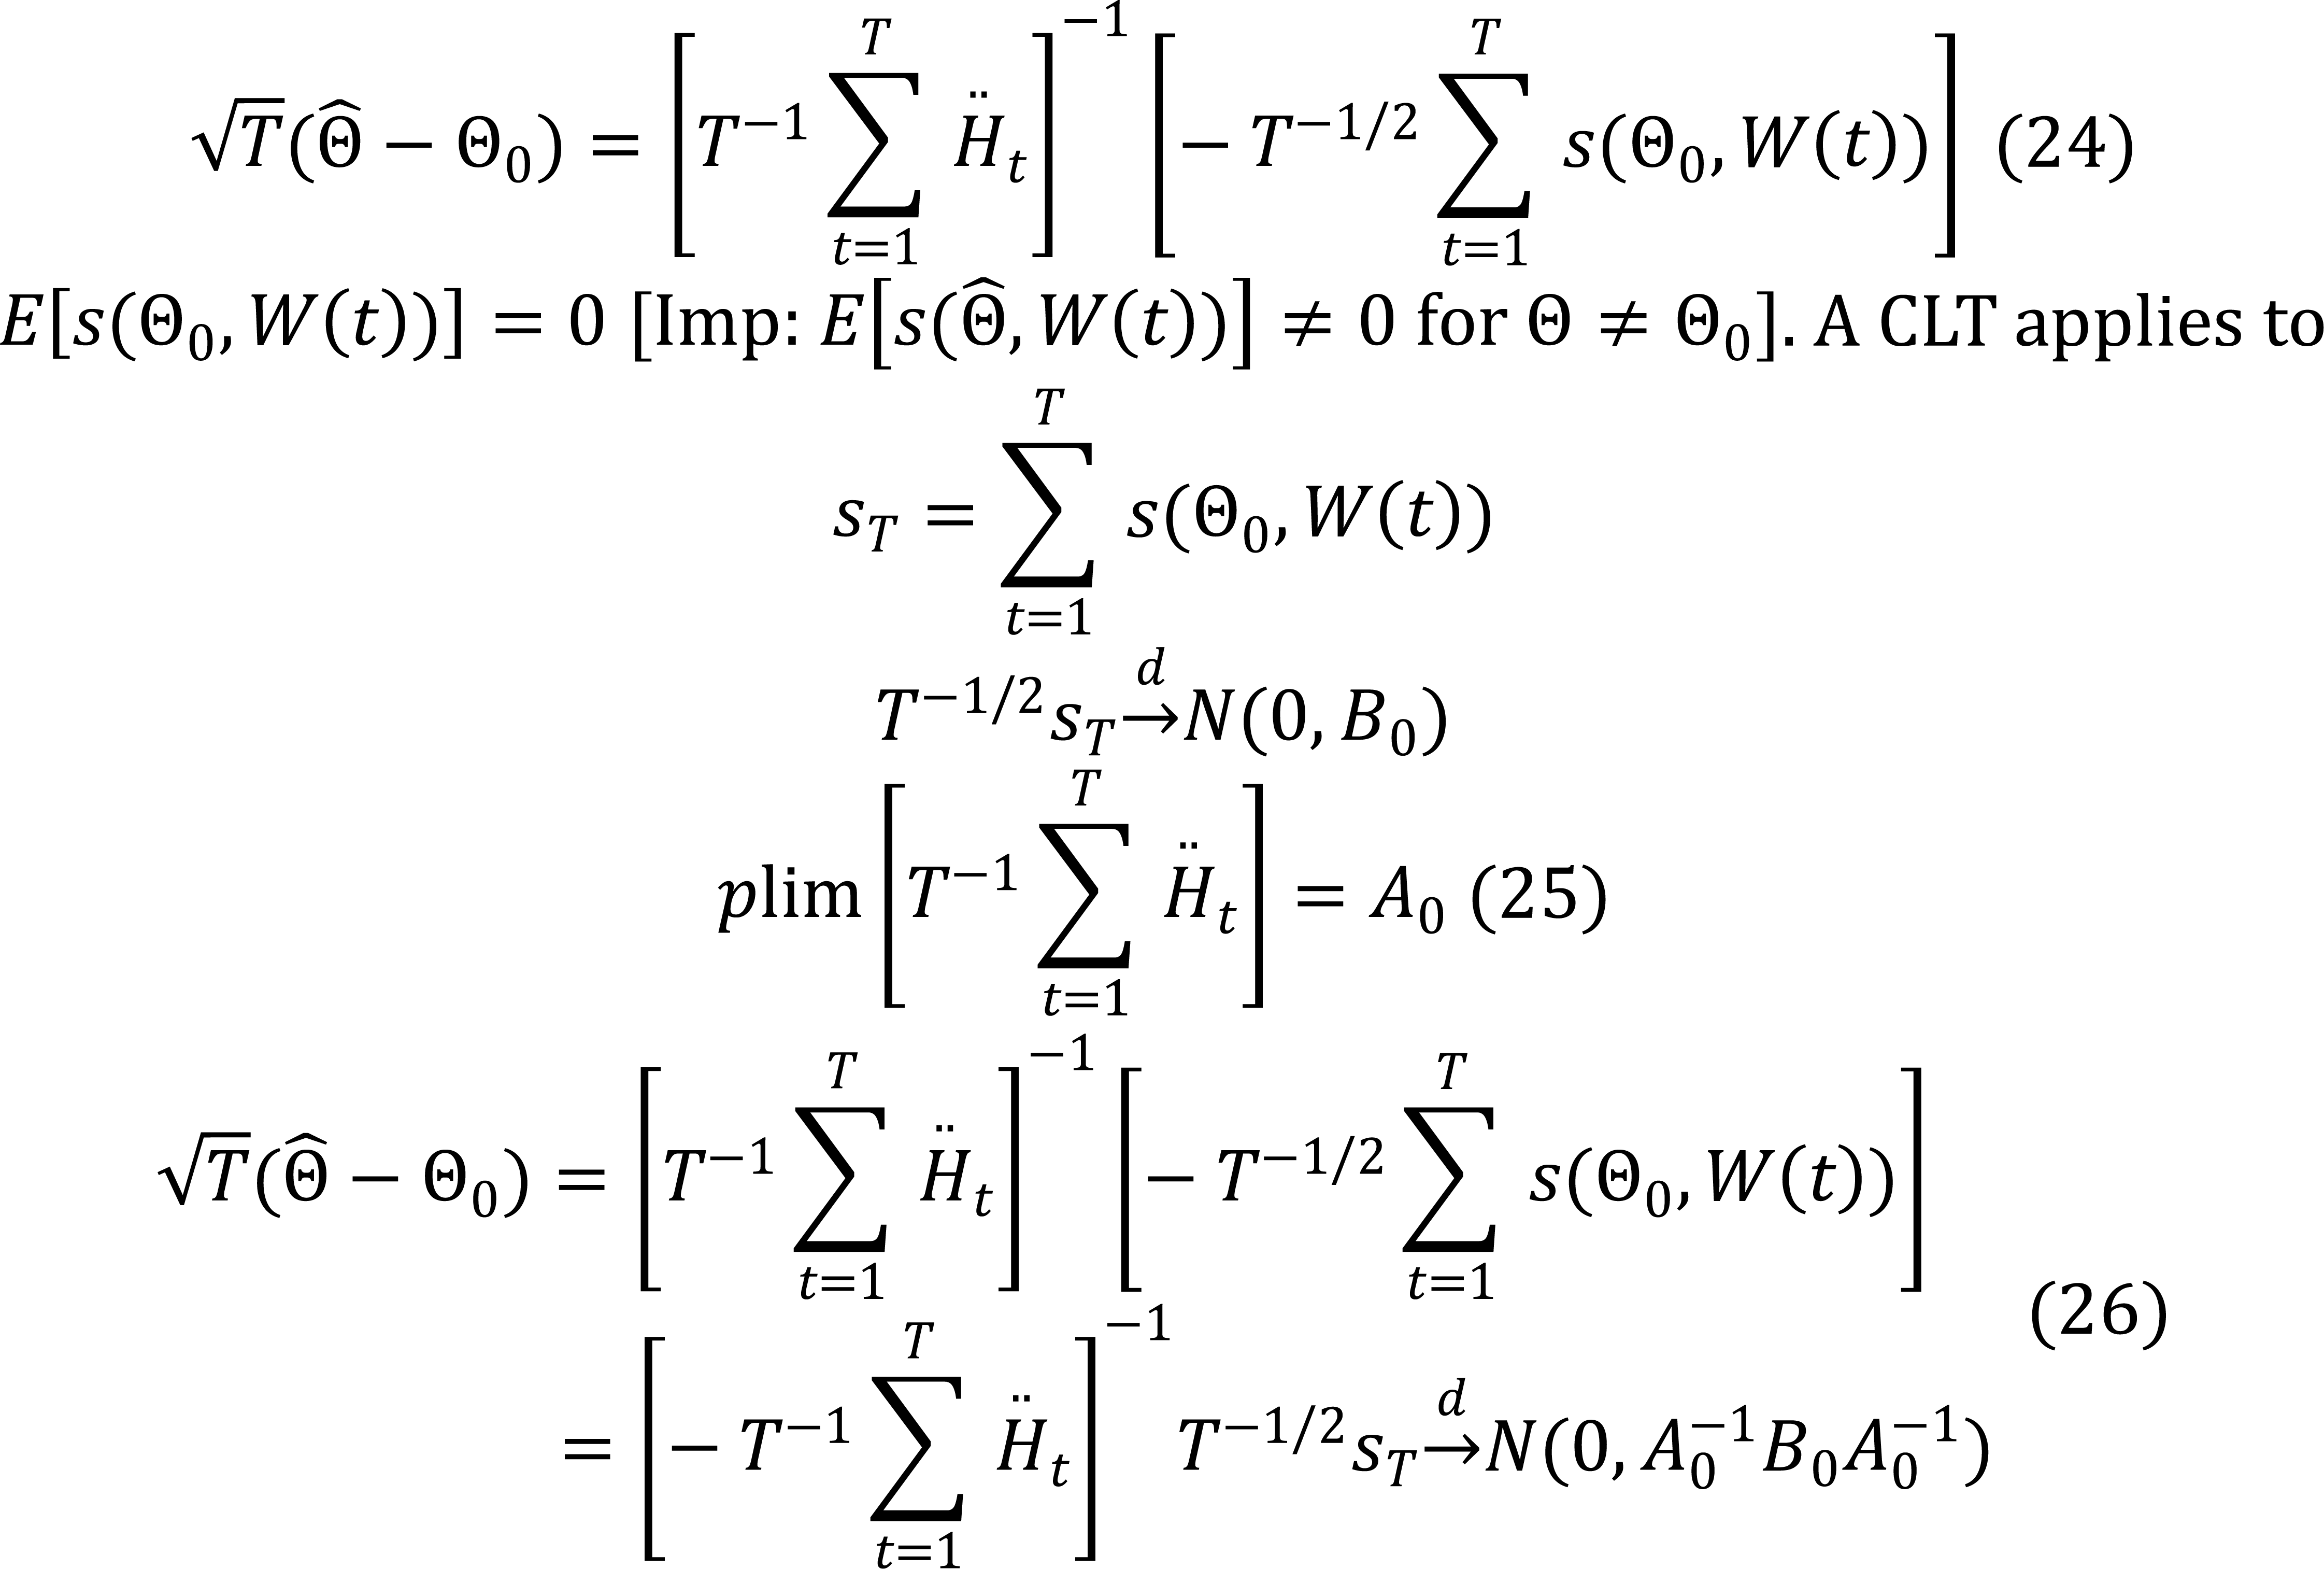
So the Hessian of E [q (Θ, W (t))] is positive semi-definite for all Θ ϵ Θ. This implies that E [q (Θ, W (t))] is convex over Θ. Now let us derive the asymptotic distribution of the estimators as follows.
q (Θ, W (t)) is twice continuously differentiable on int (Θ). Further assume Θ0 is in the interior of the parameter space: Θ0 ϵ int (Θ).
Finite moment conditions are used too. The gradient of q (Θ, W (t)) defined on int (Θ), is the 3×1 column vector as follows.
|
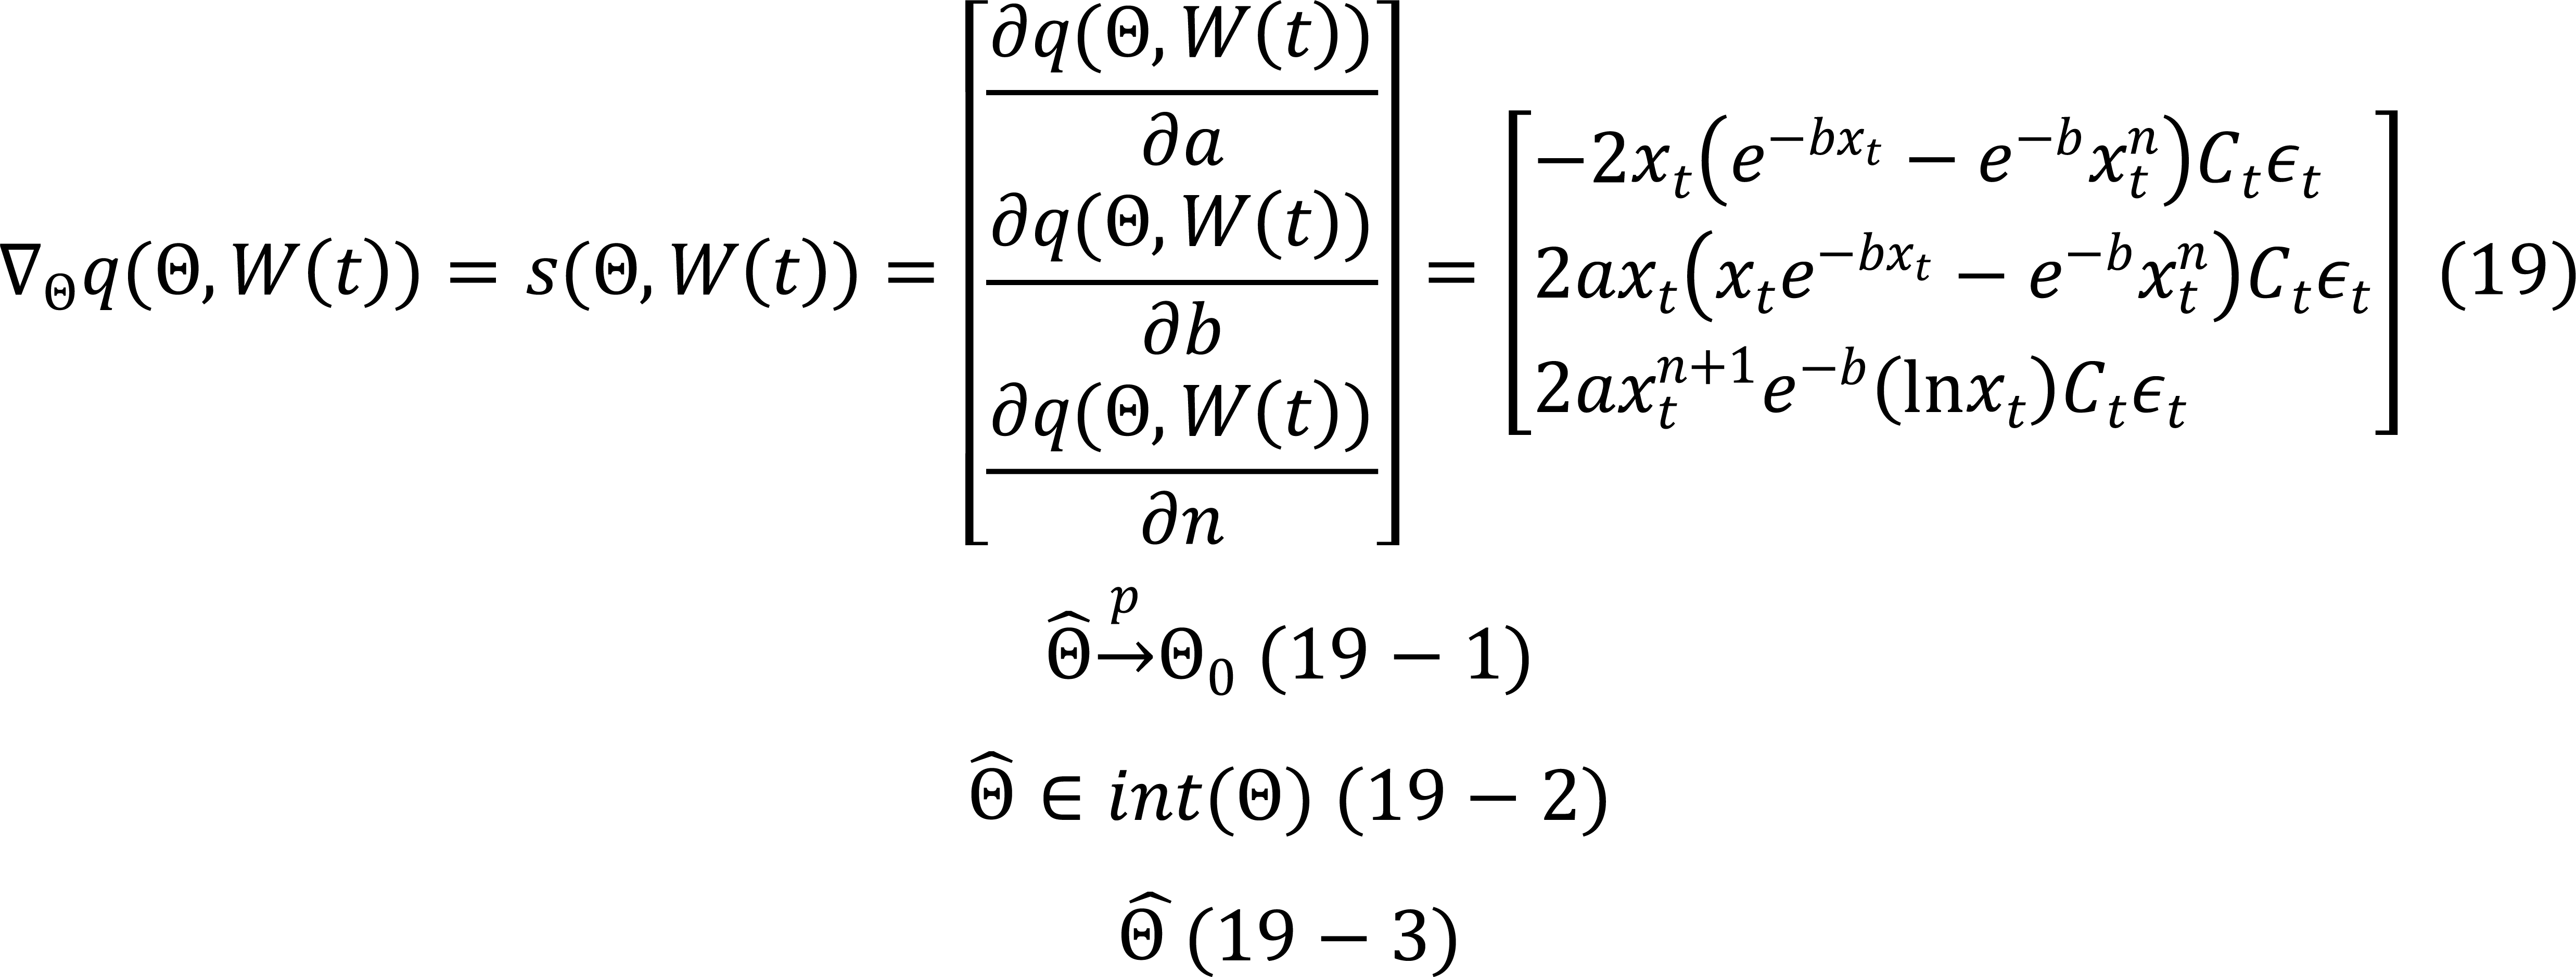
Now as Θ0 is in the interior of Θ and Equation (19-1) we know Equation (19-2) with probability approaching one. As Equation (19-3) minimizes the sample objective function and is an interior solution, Equation (19-3) solves, a set of three equations in three unknowns.
|
As q (Θ, W (t)) is twice continuously differentiable, each sl (Θ, W (t)), l=1,2,3 is continuously differentiable. By the mean value theorem (for each element of the score),
|
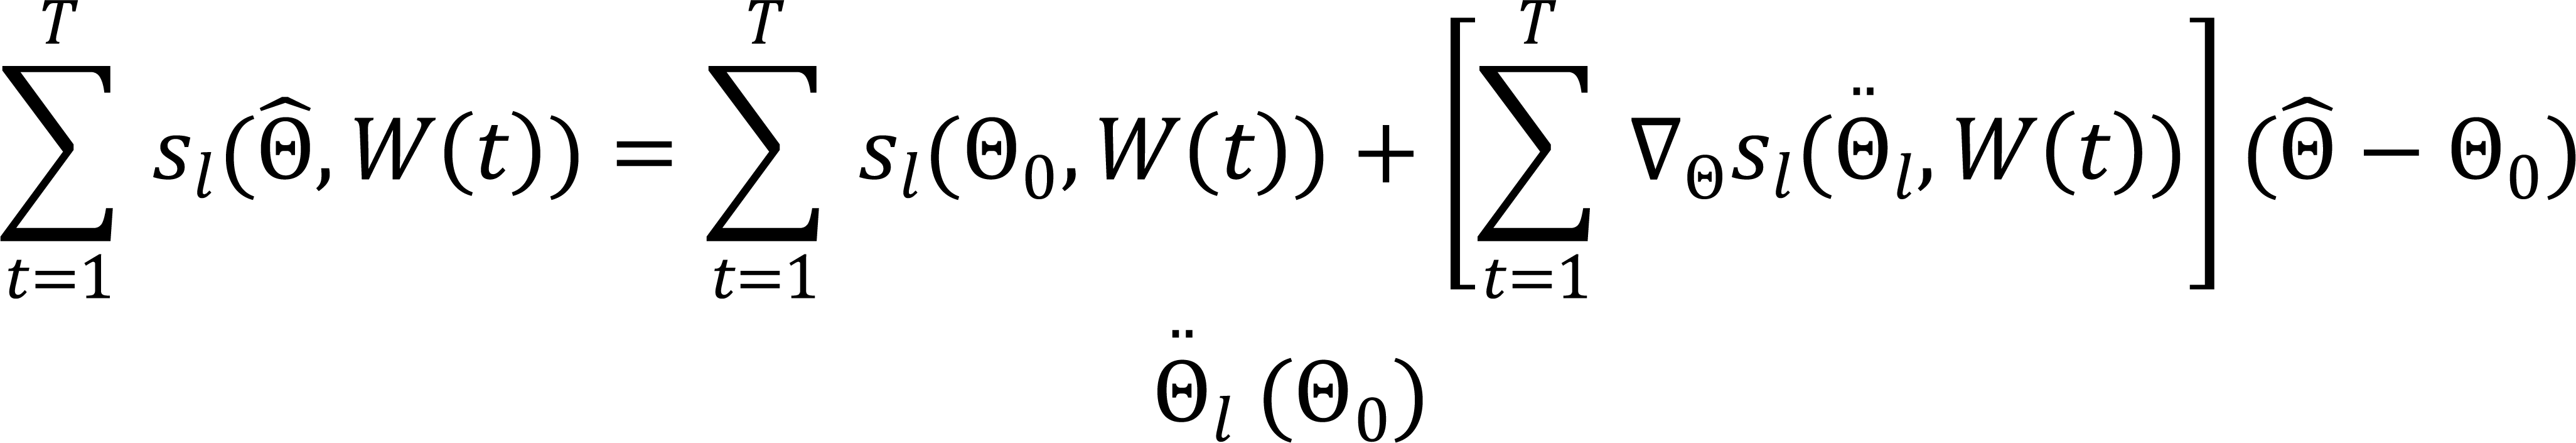
Where Equation (Θ0) is on the line segment between Equation (18) and Θ0 for l=1,2,3.
|
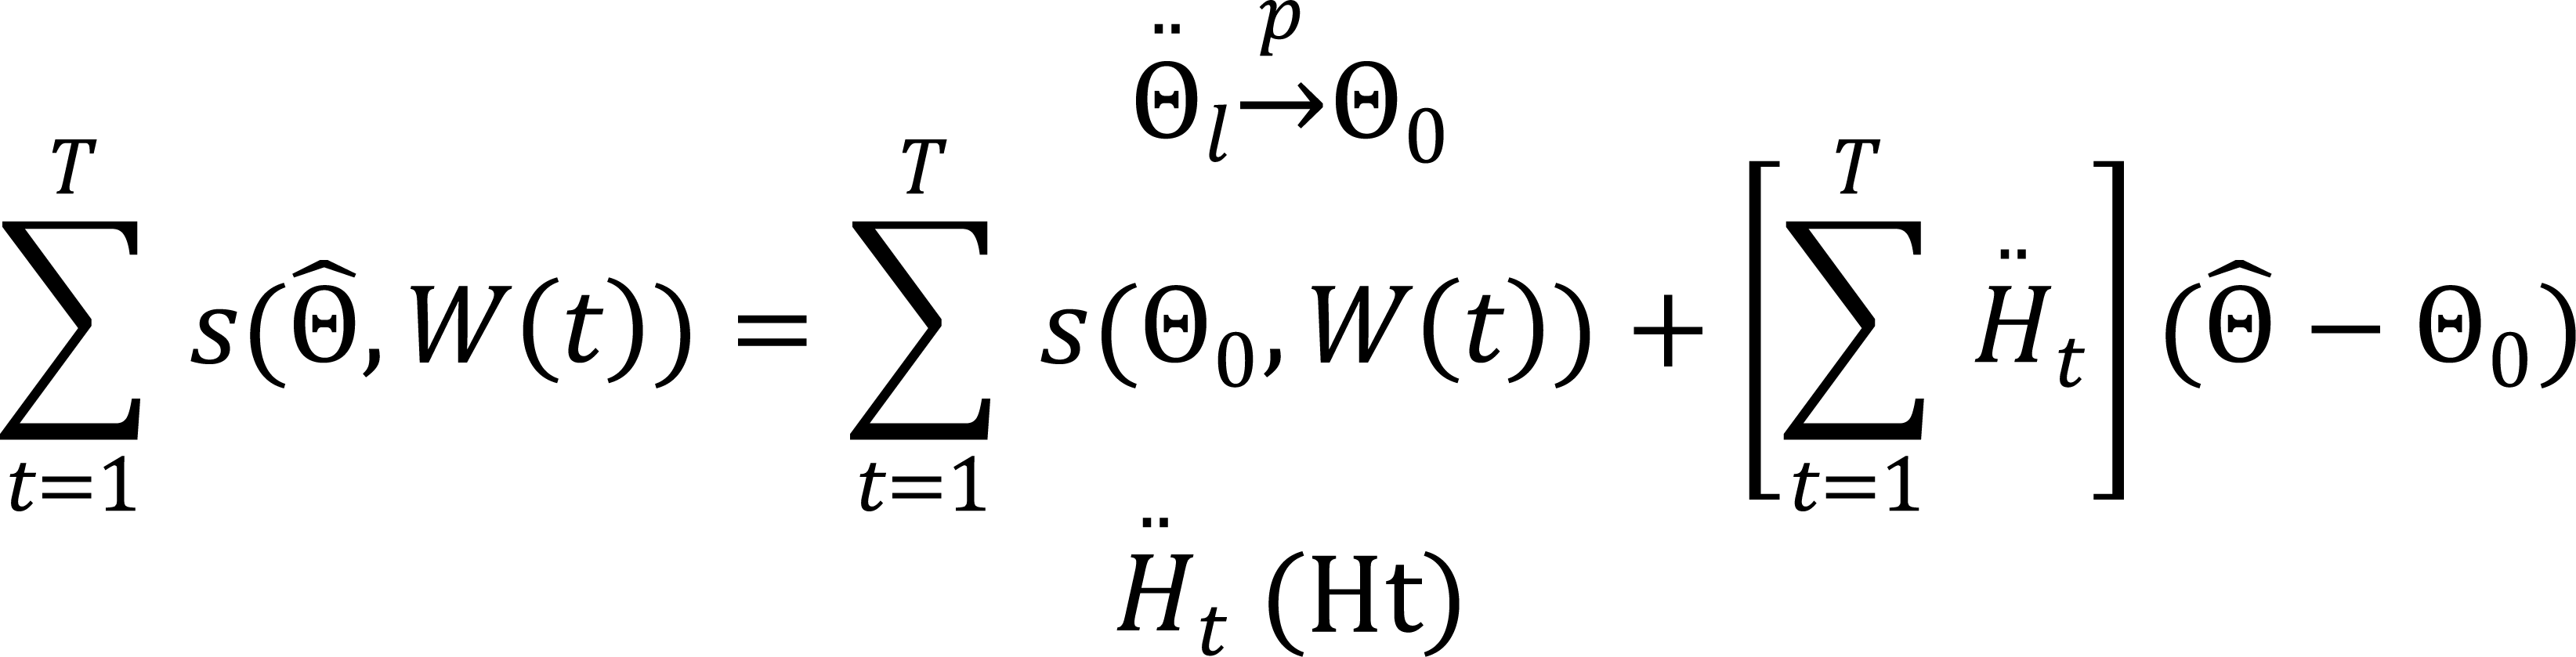
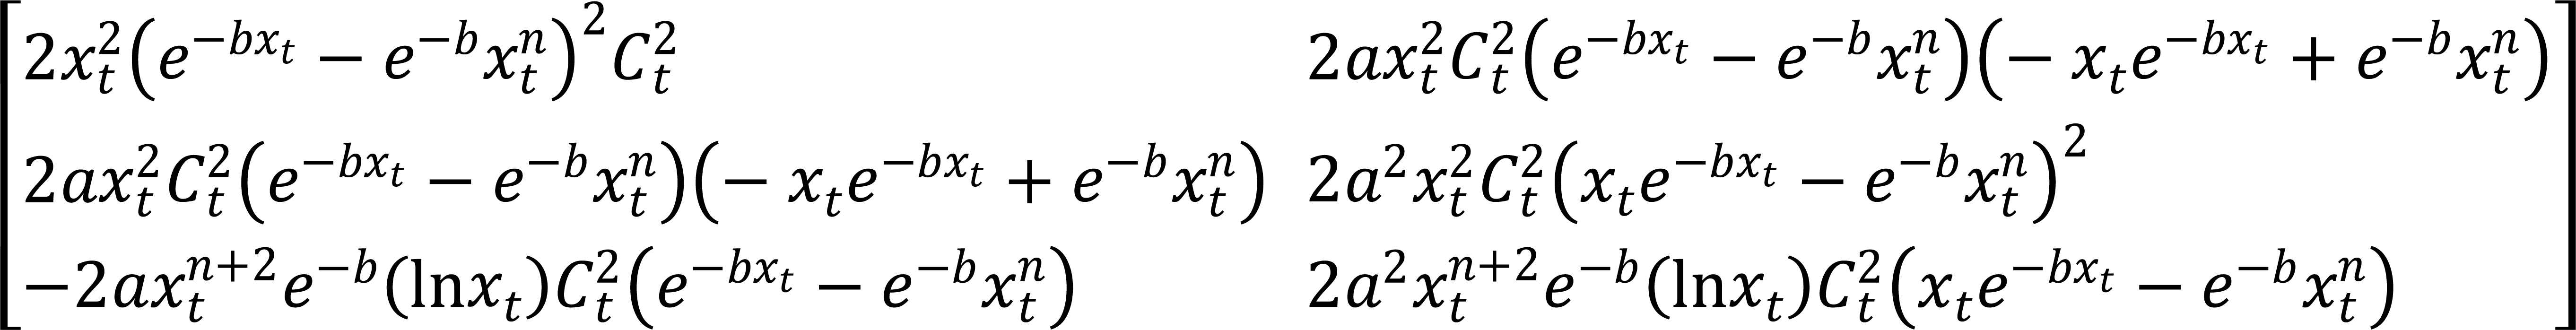
where Equation (Ht) is 3×3 Hessian of q (Θ, W (t)), i.e.
|
|
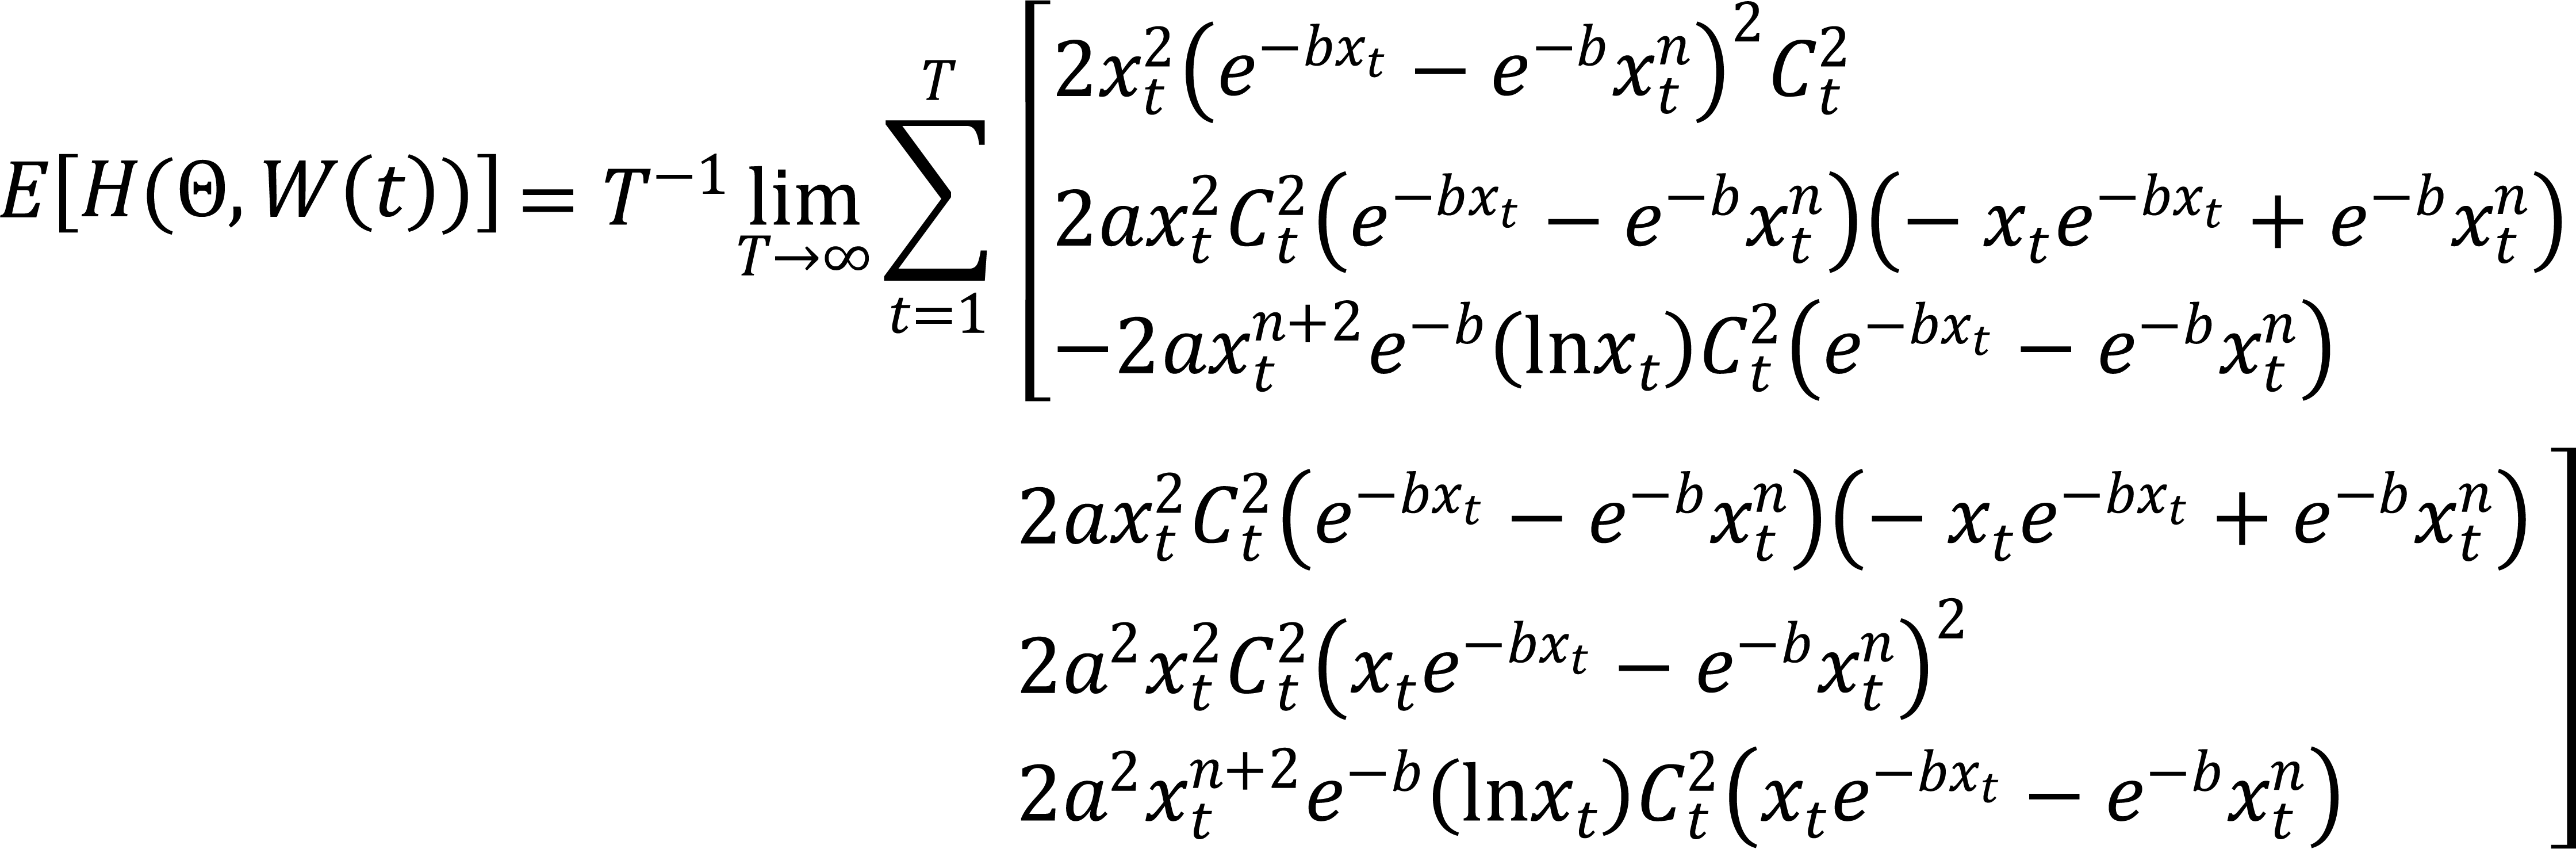
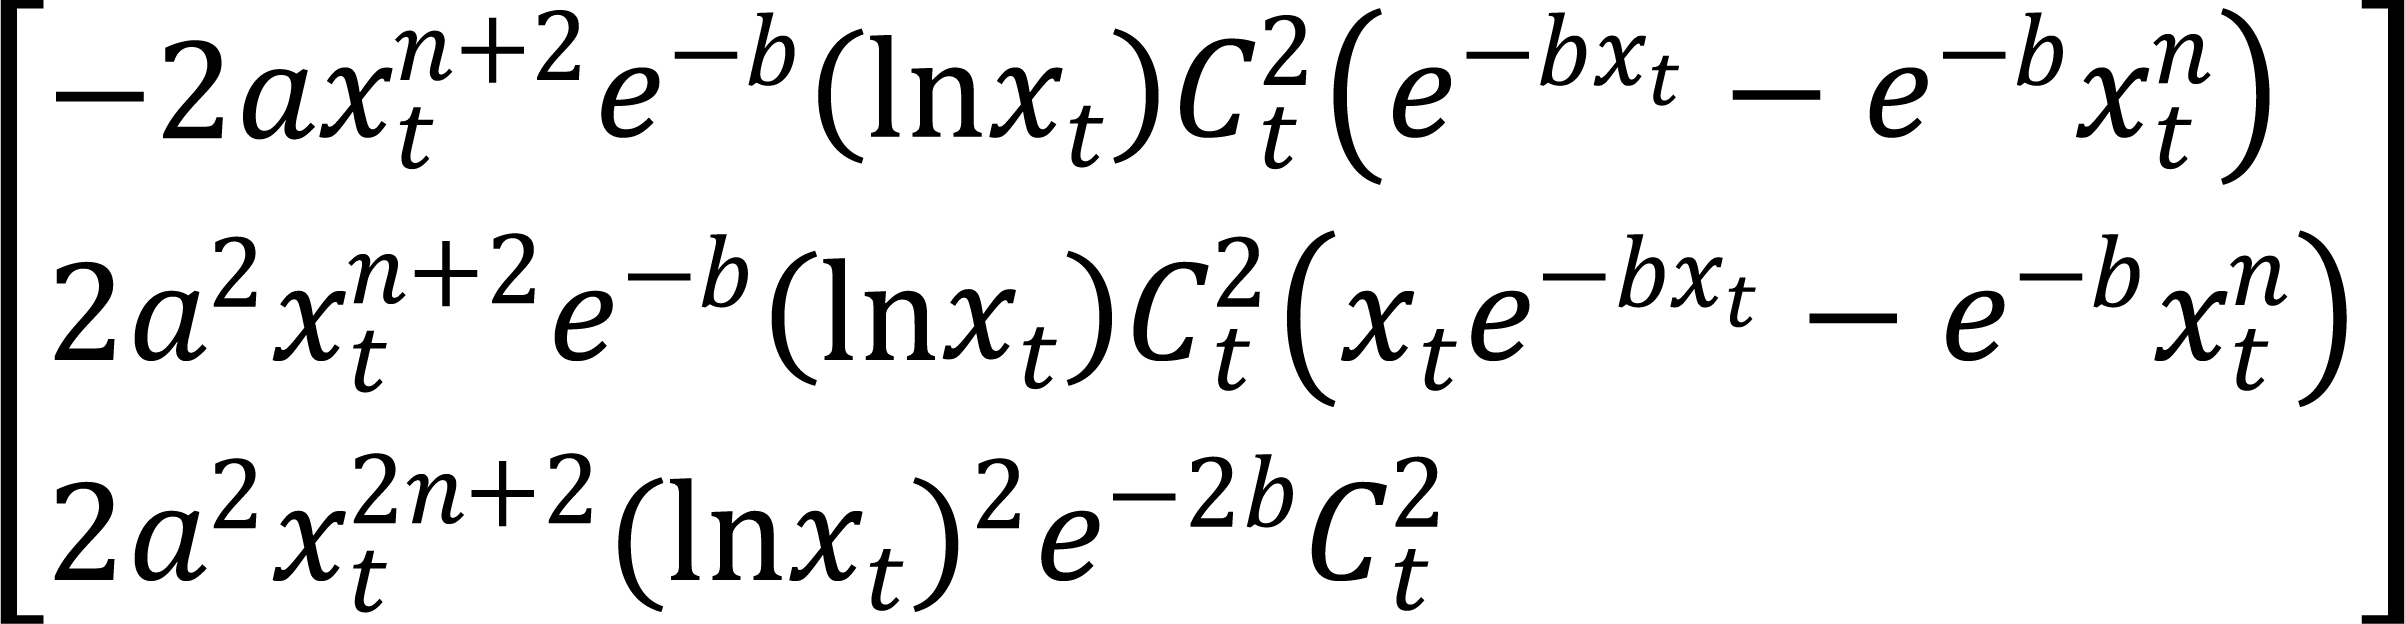
The third column of the above matrix is as follows:
|
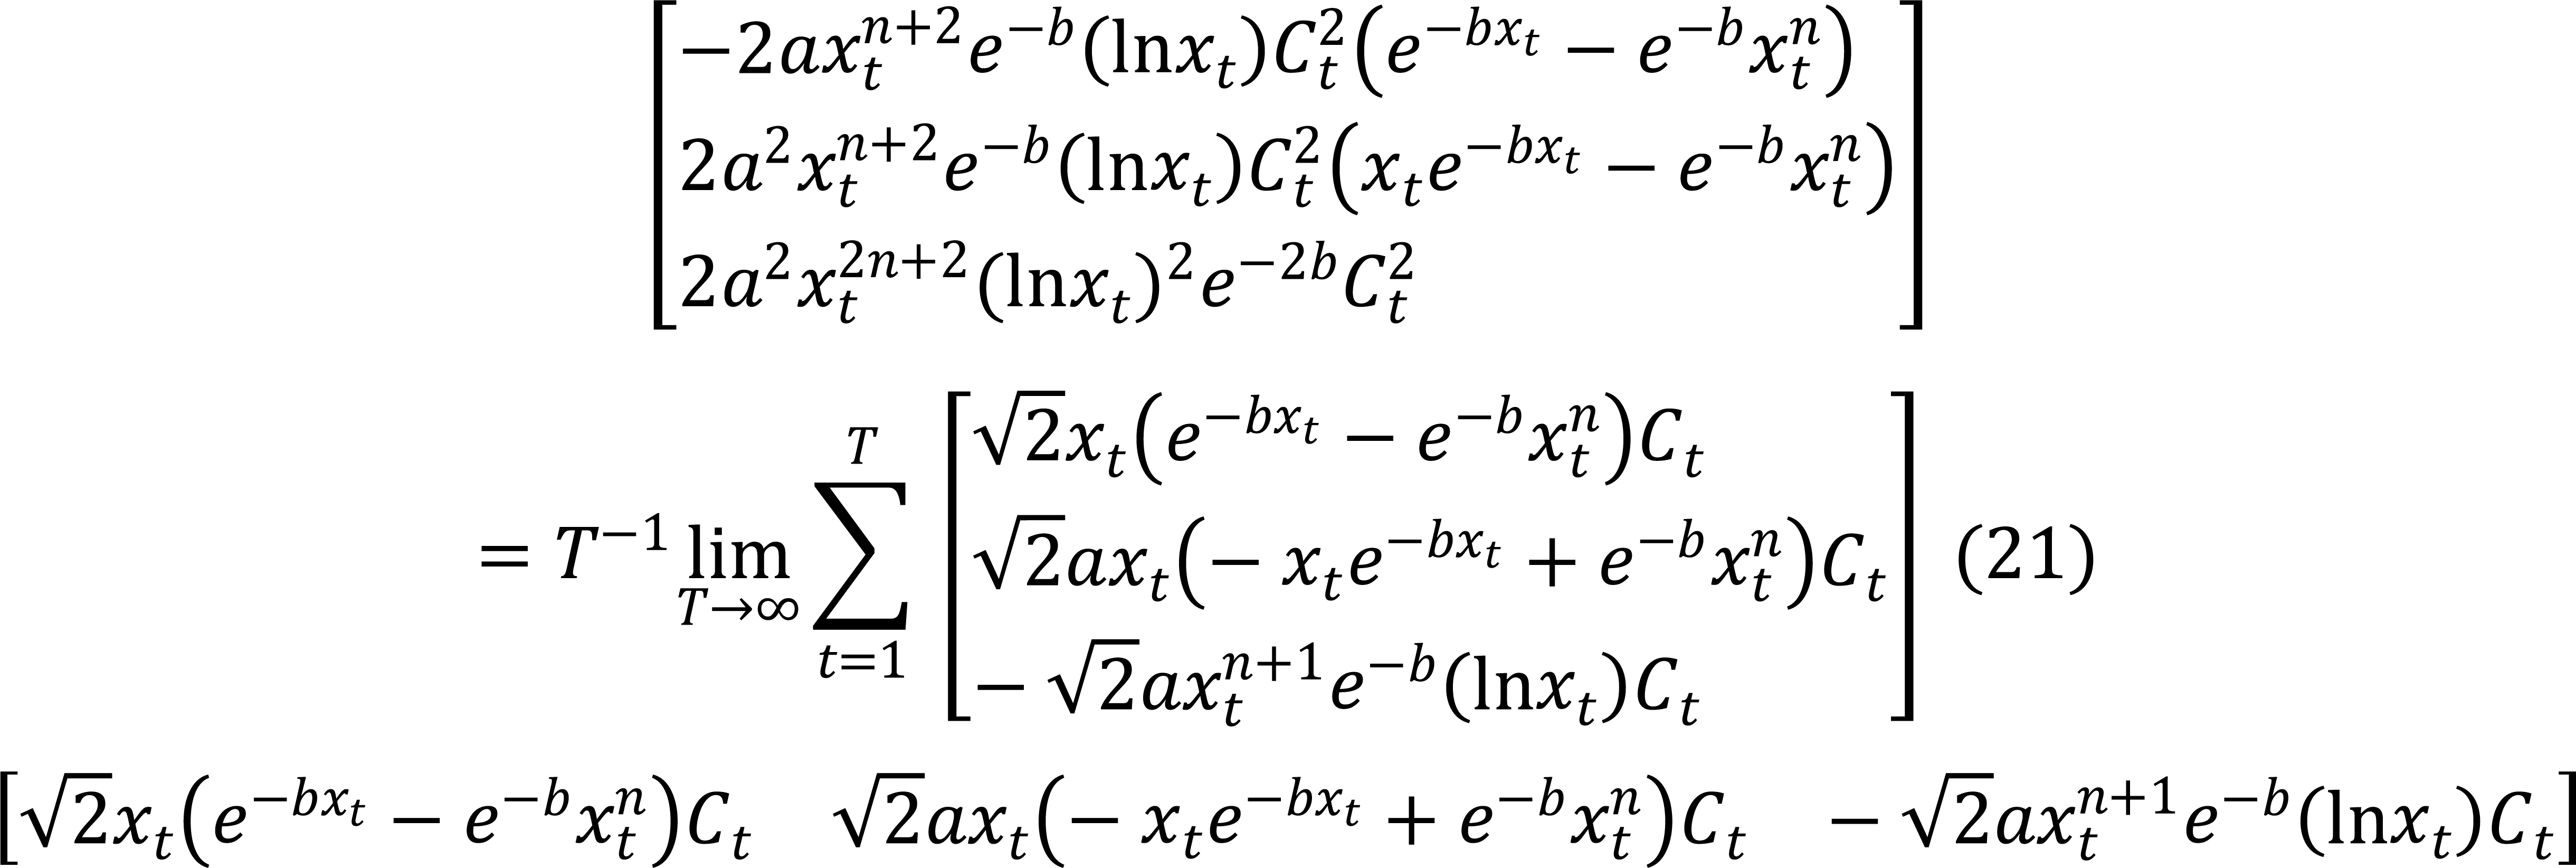
In the matrix of E [H (Θ, W (t))], all terms are convergent, therefore the expectation of the Hessian matrix is convergent and we denote it as follows:
|
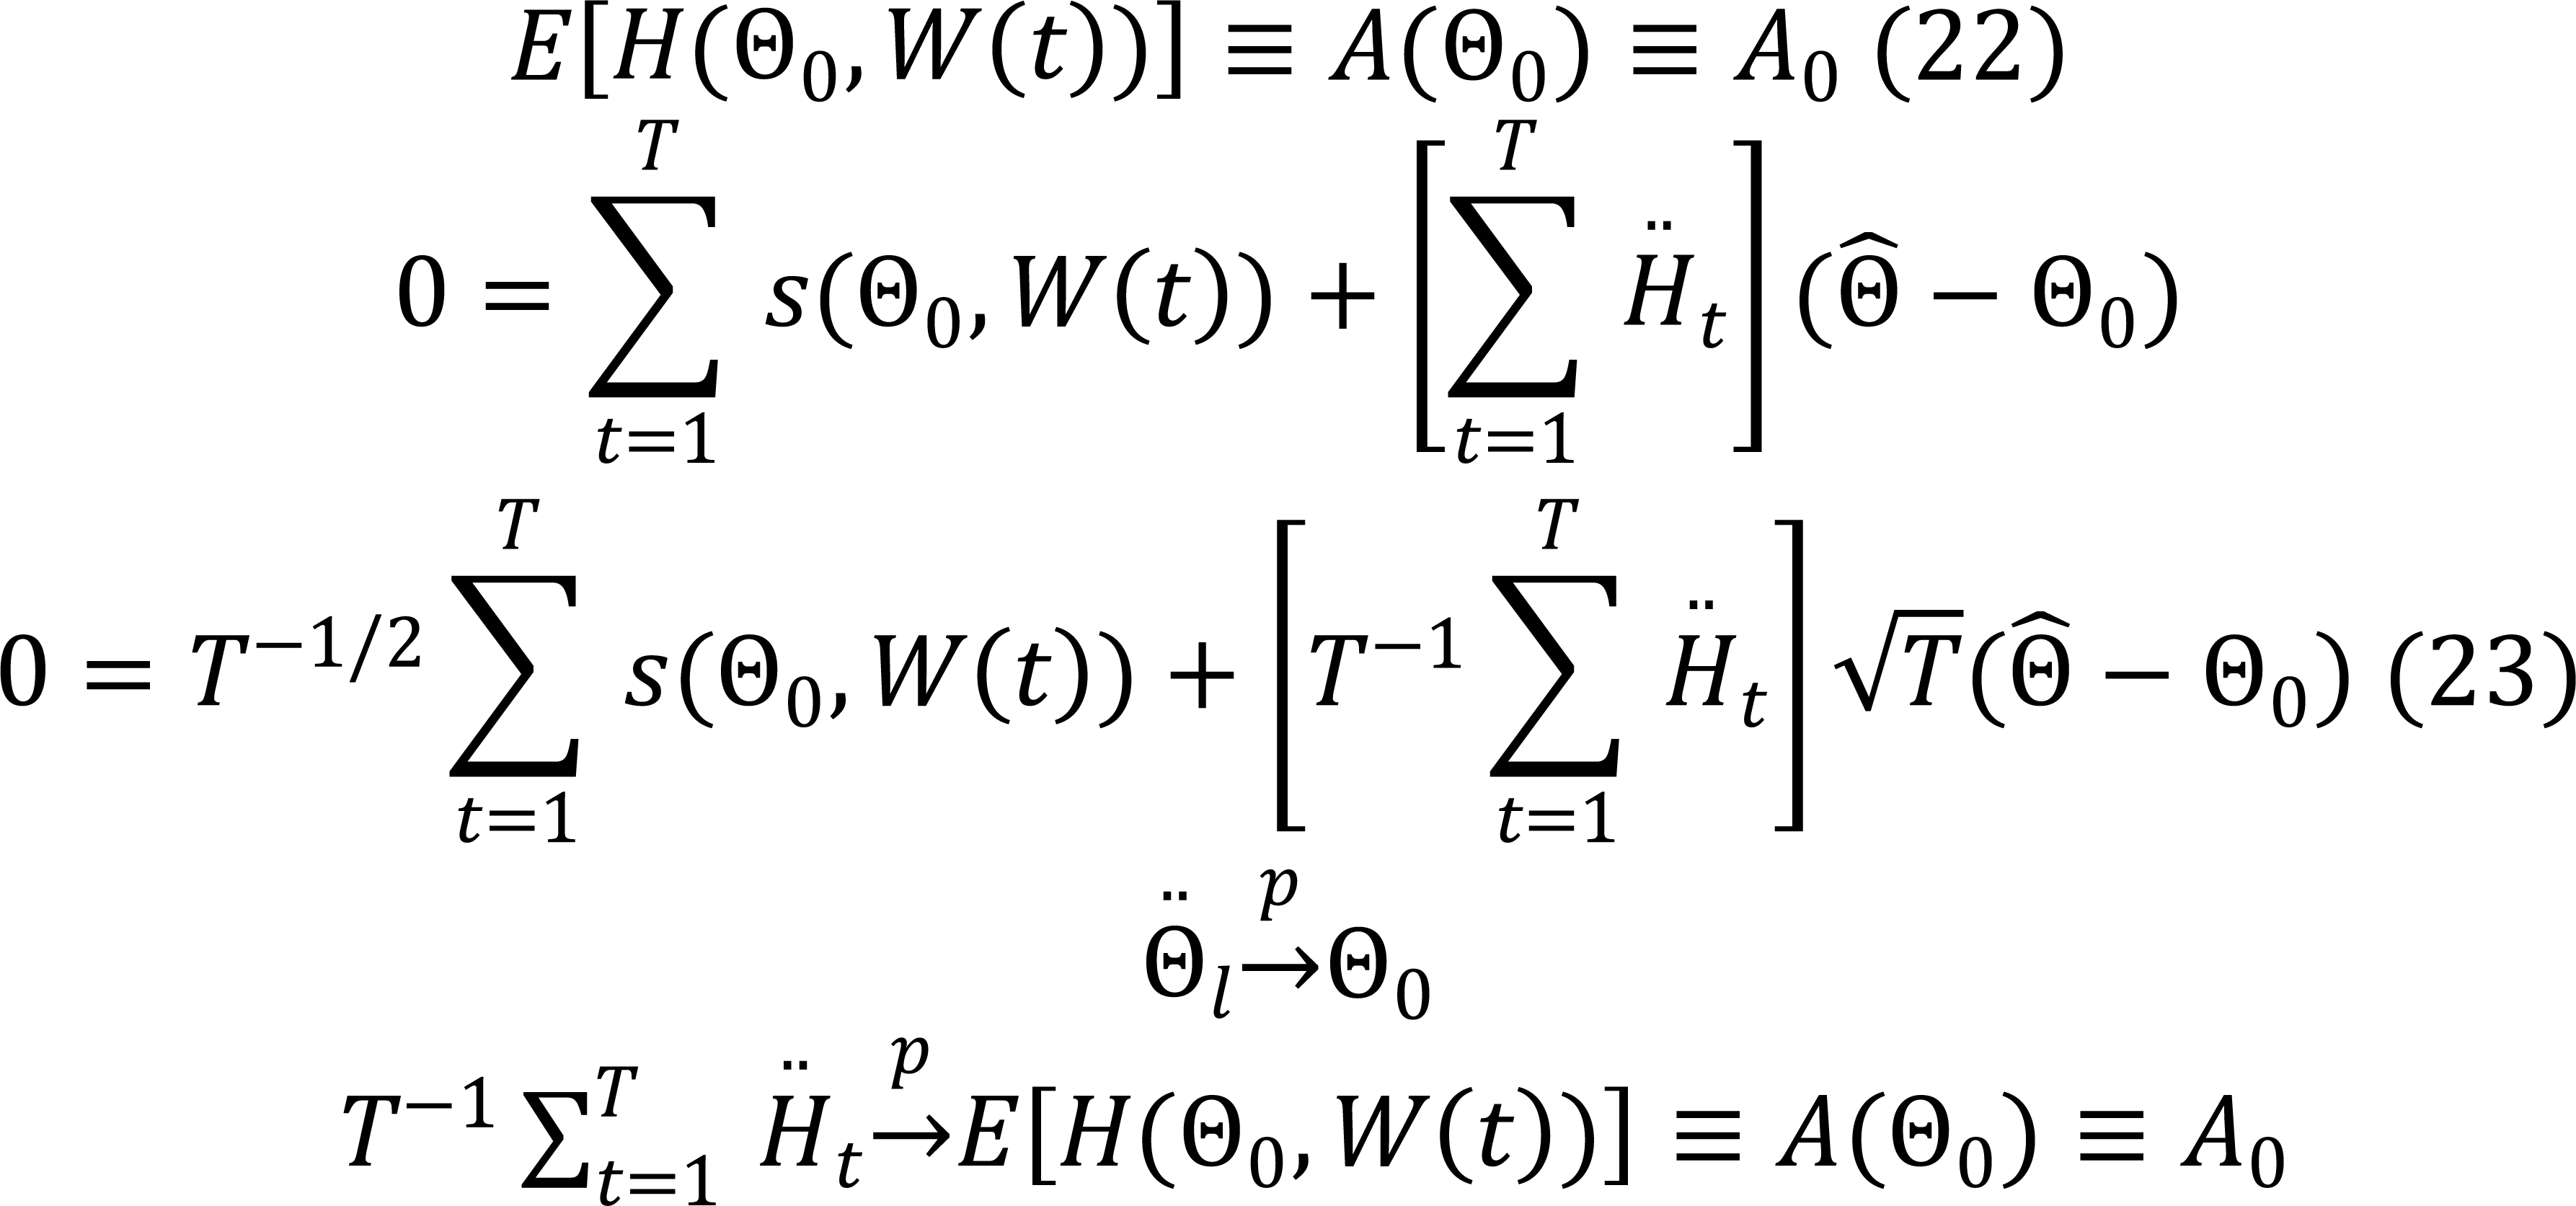
Which is positive definite, therefore it follows that:
|
8 ANALYSIS BASED ON THE MODEL / DISCUSSION
8.1 Tax Revenue Versus Rate of Tax
The plot of tax revenue versus tax rate in Equation (12), shown in Figure 5, illustrates the relationship between the two variables. It demonstrates that when the tax rate is zero, tax revenue is also zero, and similarly, when the tax rate reaches hundred percent of the tax base, the tax revenue is again zero. As the tax rate increases from zero, tax revenue rises, but the rate of increase slows down, indicating that the additional revenue generated from further tax rate increases diminishes until the slope reaches zero, which corresponds to the point of maximum tax revenue. Beyond this point, as the tax rate continues to rise, tax revenue begins to decline, and the slope becomes negative. Therefore, the model in Equation (12) suggests that the government should adopt an optimal tax rate to maximize revenue, as setting the rate too high may result in a decrease in tax revenue.
|
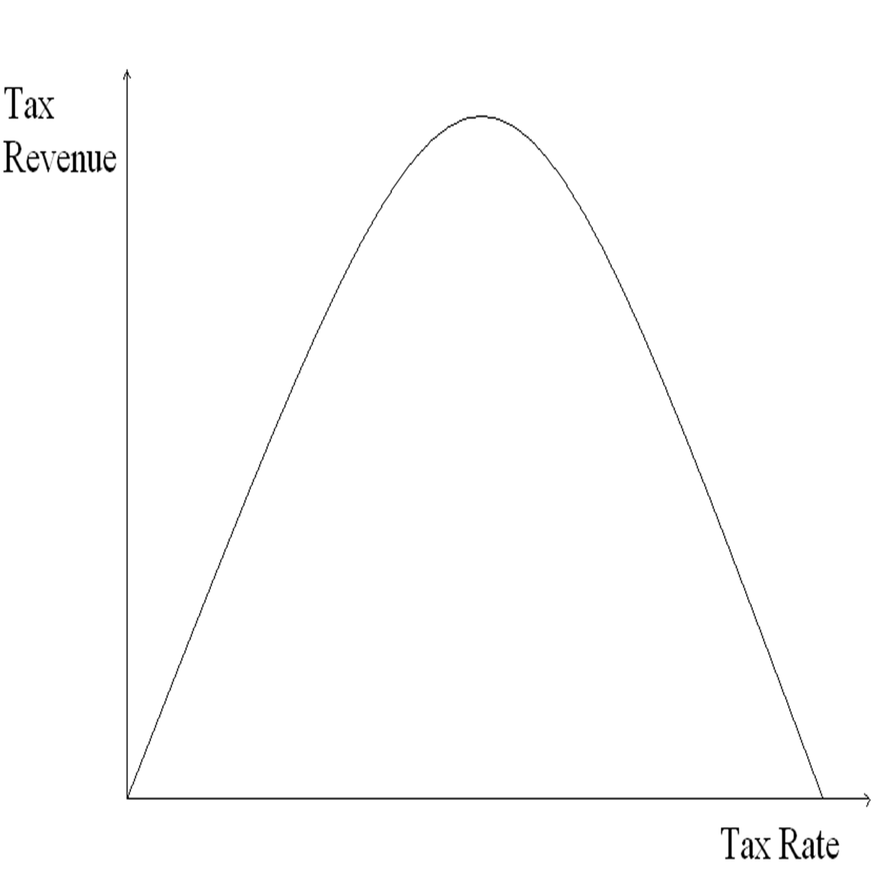
Figure 5. Tax Revenue Versus Tax Rate.
8.2 Compliance Versus Tax Rate
As we have previously observed, tax compliance in Equation (9) can be expressed as.
|
Differentiating the above equation with respect to x gives us.
|
Multiplying both sides by x / c, we obtain.
|
The equation above represents the percent change in tax compliance relative to a percent change in the tax rate. For specific values of b and n for a particular country and a given tax rate x, we can determine the percent change in the tax compliance level for a certain type of tax in that country in response to a percent change in the tax rate. Figure 6 displays the plot of compliance versus tax rate.
|
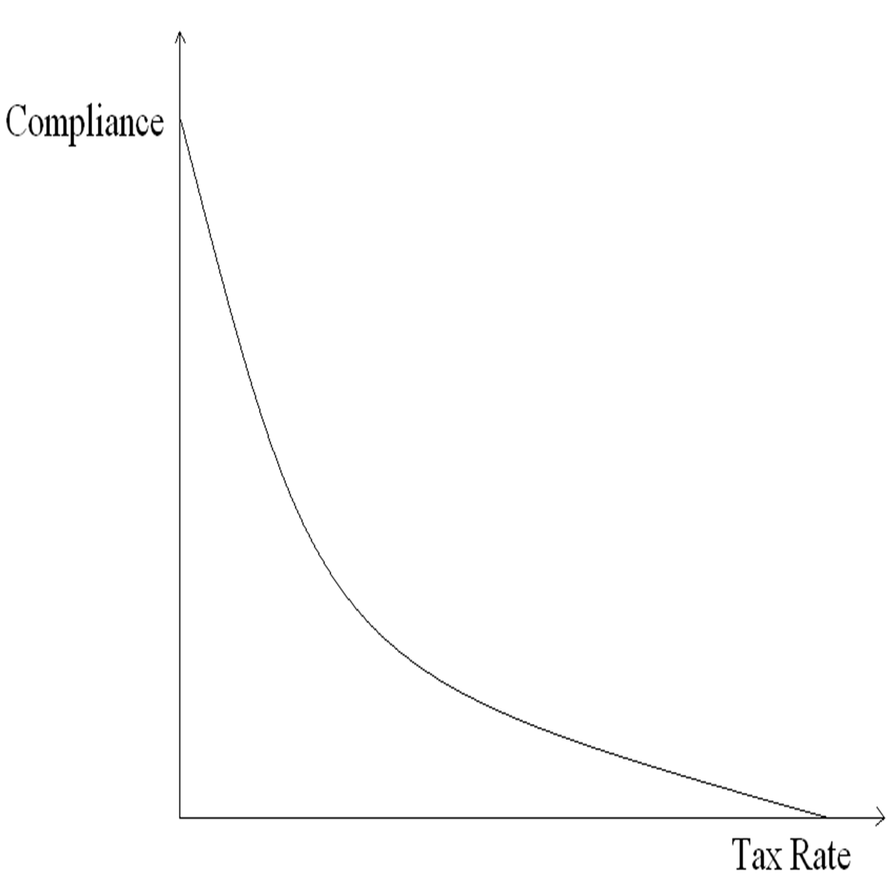
Figure 6. Compliance Versus Tax Rate.
The tax base is typically a fraction or function of GDP. Since the VAT base, which is final consumption, is a fraction of GDP, therefore expressing consumption in terms of GDP and rearranging Equation (12), we can express the relationship between GDP and the tax rate. The resulting expression is as follows.
|
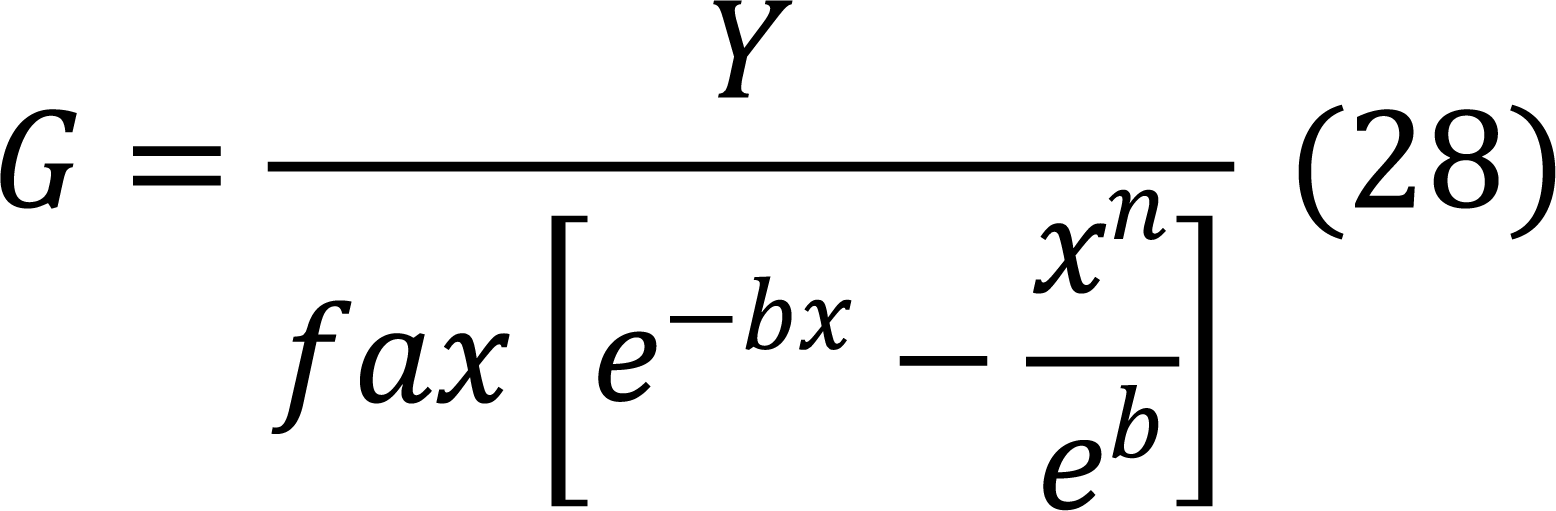
Where C=fG, consumption expressed as a fraction of GDP. Figure 7 illustrates a plot of GDP versus the tax rate.
|
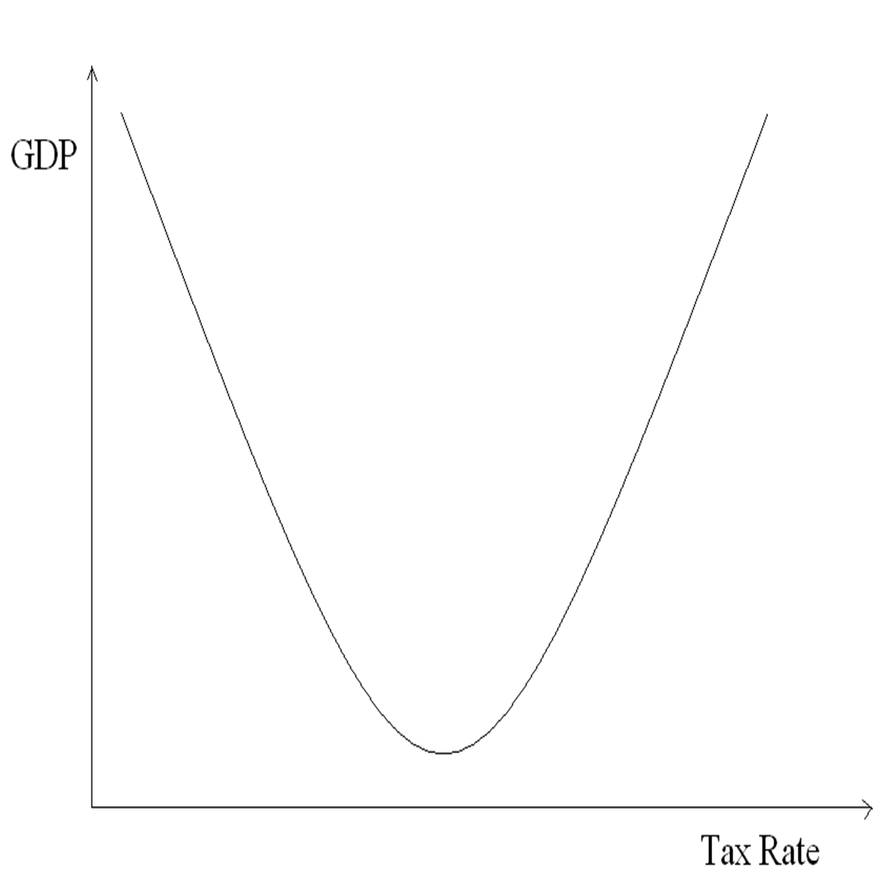
Figure 7. GDP Versus Tax Rate.
From Equation (28), we have the following expression.
|
From the above equation, different types of quantitative analysis can be performed. The partial derivative of Y with respect to x can be expressed as Equation (30).
|
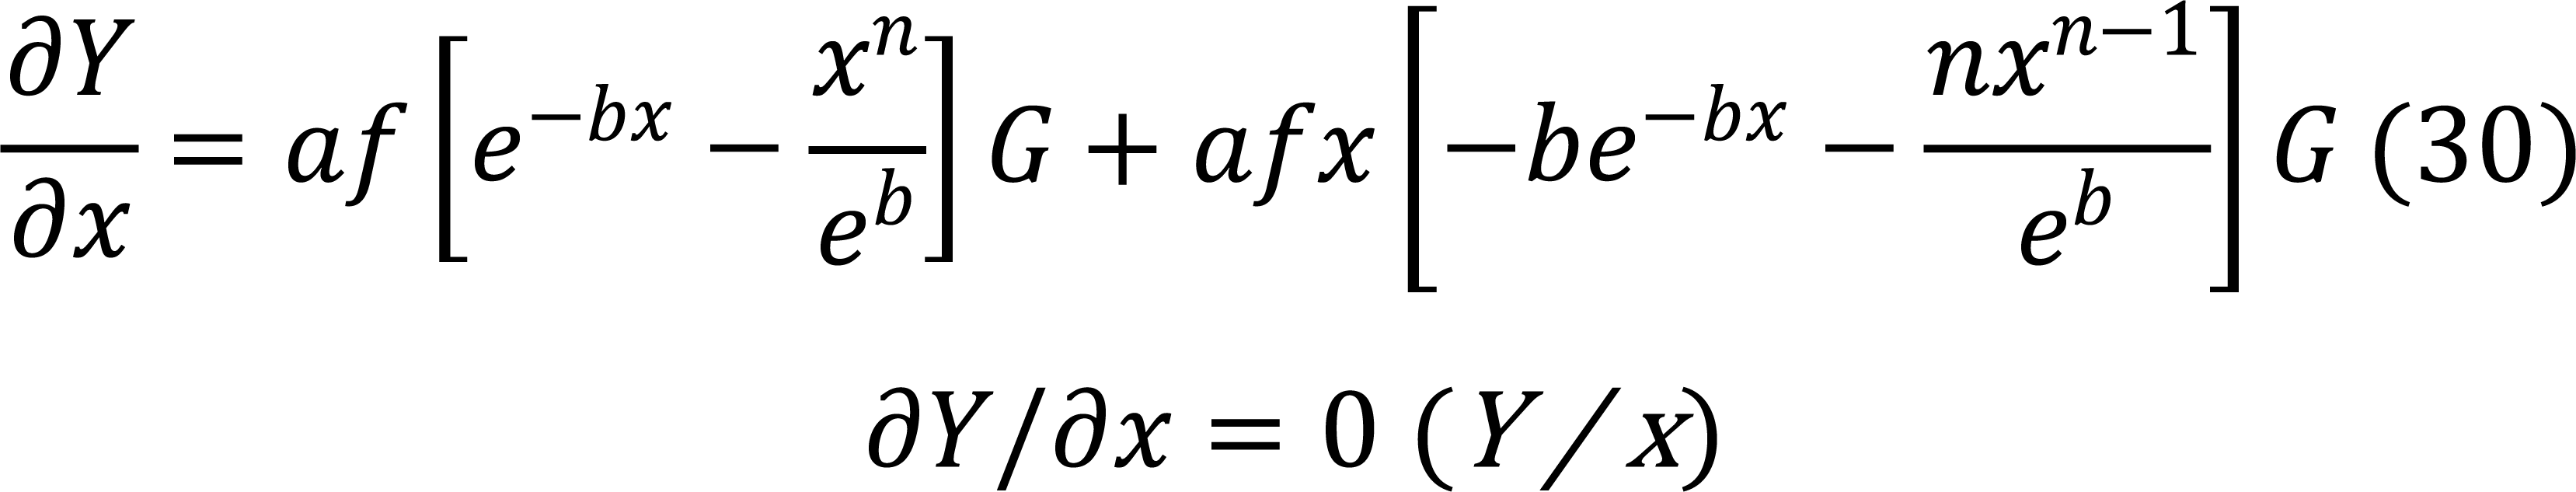
Now, Equation (Y / x) implies that, Equation (31).
|
For different values of b and n across various countries for certain types of taxes, the tax rates that result in the maximum and minimum tax revenue can be determined from the above expression. These tax rates can be identified by the following conditions.
|
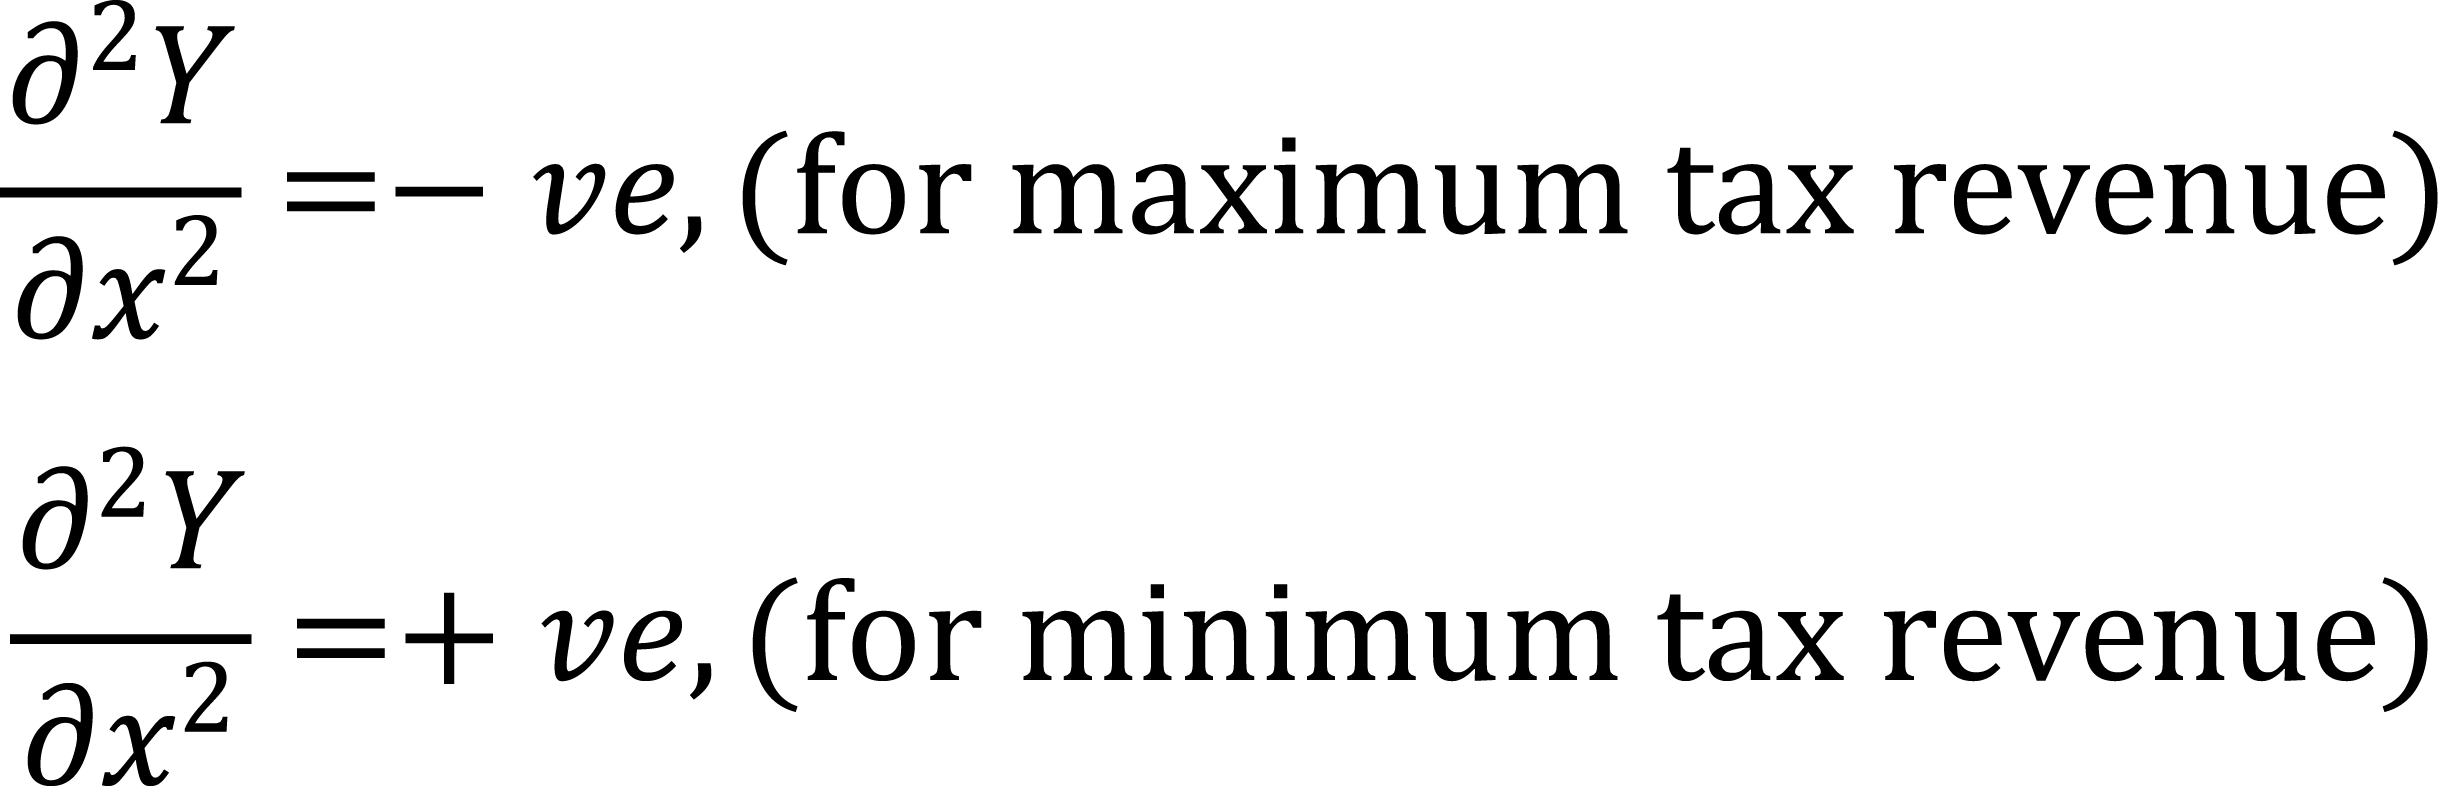
Since the tax rate cannot be negative, the above condition will only result in the maximum value. The minimum value of tax revenue occurs at a zero tax rate and a one hundred percent tax rate. Similarly, GDP can be expressed as a function of the tax rate, compliance, and tax revenue. The relationship is as follows.
|
Taking the partial derivative of G with respect to x, we obtain Equation (32).
|
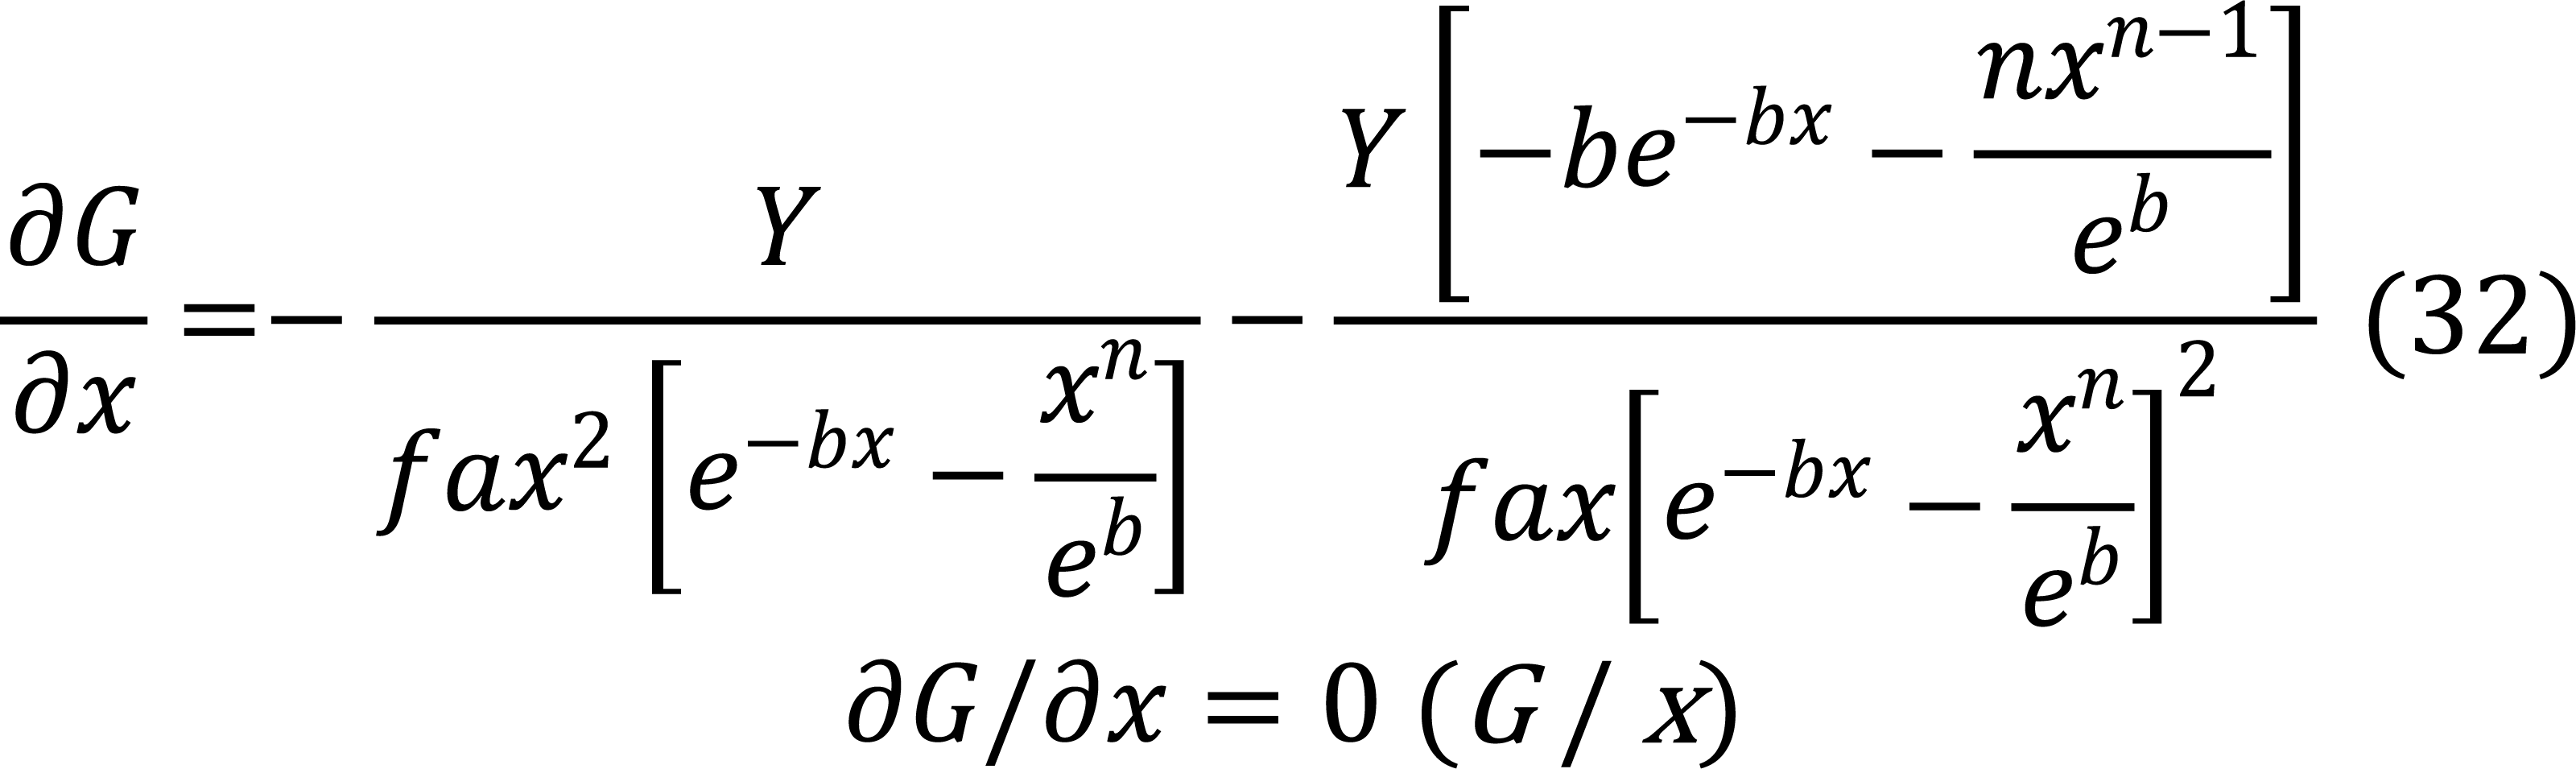
Setting Equation (G / x), we obtain Equation (33)
|
which implies that Equation (34).
|
From the above expression and the plots of tax revenue and GDP versus tax rate, it is evident that the tax rate that maximizes tax revenue at a constant GDP will minimize GDP at a constant tax revenue. Therefore, expression vide Equation (29) can serve as a quantitative tool to determine the optimal tax rate for a given combination of tax revenue and GDP, as selected by policymakers under different conditions across various countries.
Additionally, the analysis shows that fractional compliance is an inverse function of the tax rate. Tax revenue initially increases as the tax rate rises, up to a maximum point, after which it becomes an inverse function of the tax rate. In contrast, GDP behaves oppositely to tax revenue. The maximum GDP occurs at either a zero or 100 percent tax rate when tax revenue is zero. As the tax rate increases, GDP initially decreases until it reaches a minimum value. After that, it starts to rise with further increases in the tax rate, eventually reaching its highest value again at a 100 percent tax rate at a given point in time. It does not account for the dynamic effects that will arise from the use of tax revenue to boost GDP, including spending on development, infrastructure, education, health, and public goods and services.
9 A COMPARISON WITH LAFFER CURVE
The curve that illustrates the relationship between tax rates and tax revenues is called the “Laffer Curve”, as shown in Figure 8, named after the economist who popularized this concept in the early 1980s. According to Laffer, the relationship between tax revenue and the tax rate follows this curve. When the tax rate is zero, tax revenues are also zero; similarly, when the tax rate is one, tax revenue is again zero, since no goods will be supplied or demanded at such a high tax rate. As the tax rate increases, tax revenue initially rises, but eventually begins to fall. Lafferʼs explanation behind the curve suggests that at a certain point, when the tax rate is high enough, increasing the tax rate further will reduce tax revenue due to a decrease in the supply of taxed goods. Determining the optimal tax rate, where further increases lead to reduced tax revenue, involves simple elasticity calculations.
|
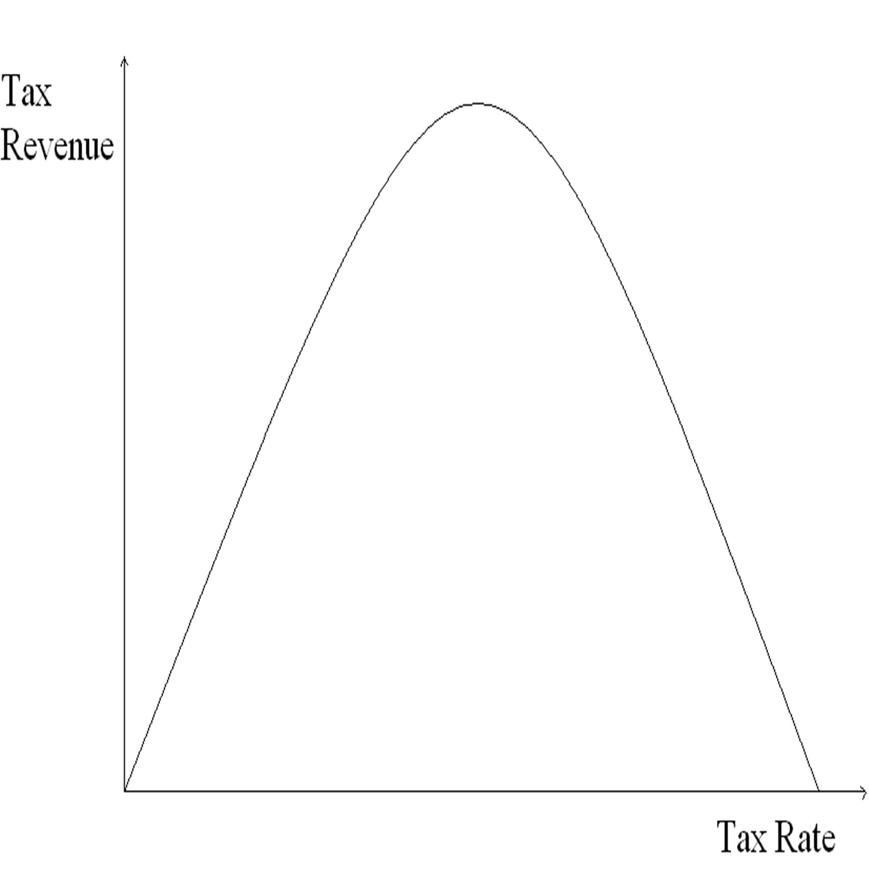
Figure 8. The Laffer Curve.
Consider a labor market model. Suppose the demand curve for labor is perfectly elastic, meaning it is flat at a given wage level. The equilibrium in this labor market is set by the intersection of the flat demand curve and the upward-sloping supply curve, as shown in Figure 9.
|
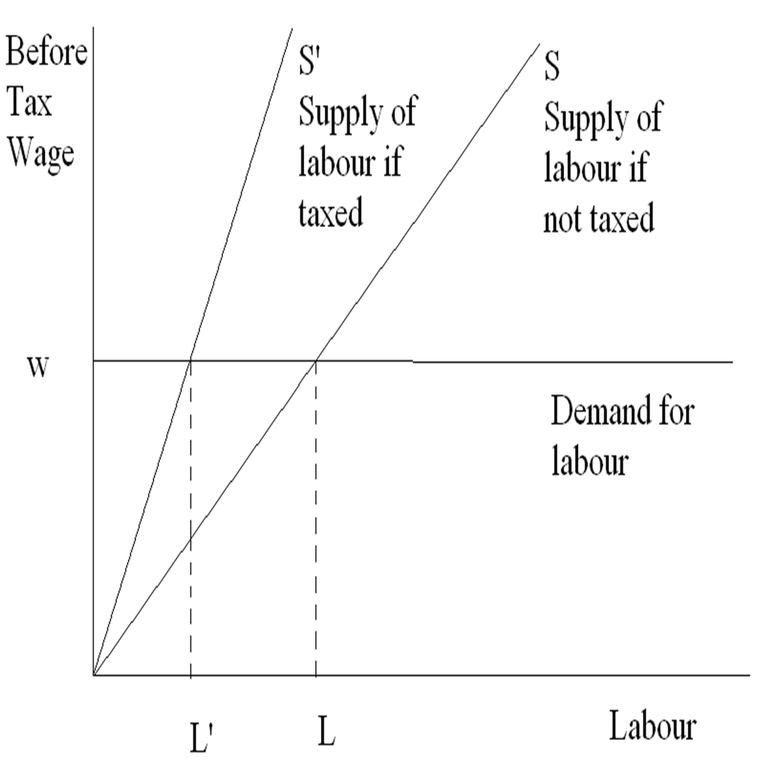
Figure 9. The Labor Market.
If labor is taxed at a rate of x, the worker will receive a wage of w=(1-x)w, where w is the amount paid by the firm. Due to the imposition of this tax, the supply curve shifts leftward, moving the equilibrium to the left. The tax revenue collected by the government is given by Equation (35).
|
Where g is labor supply and is a function of w. Differentiating Equation (35) with respect to x, we obtain Equation (36).
|
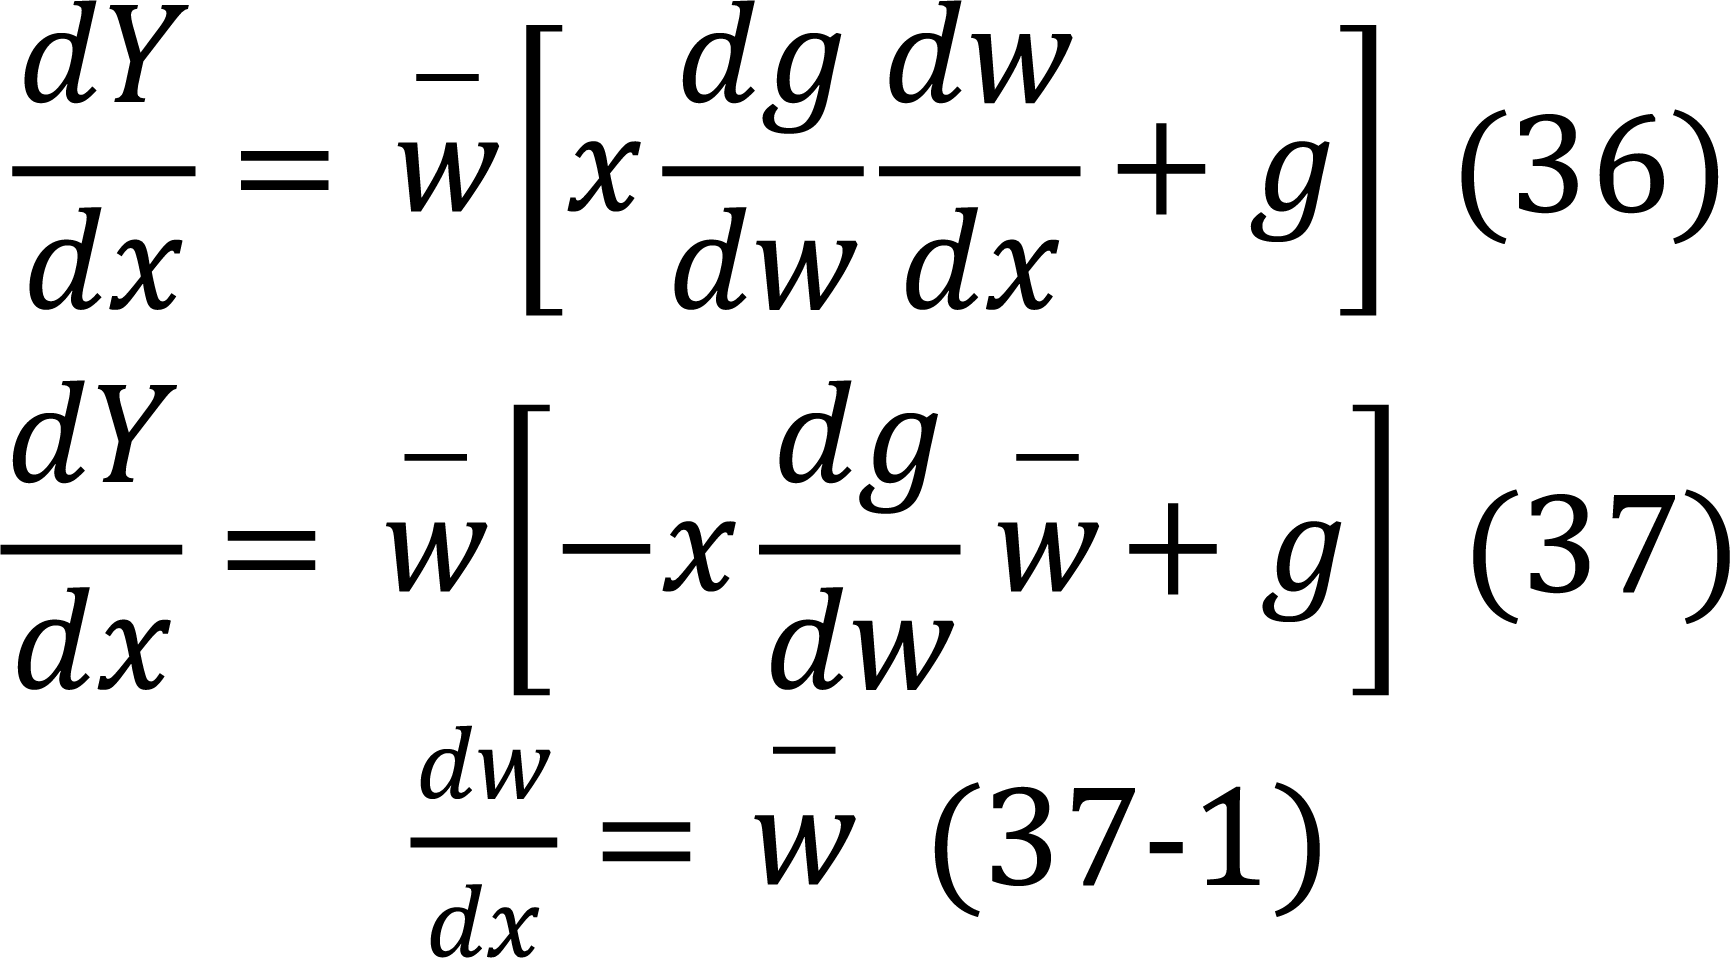
Revenues will decline with an increase in the tax rate when Equation (37)<0, meaning that the elasticity of the supply of labor (or taxed goods) is negative. In this case, further increases in the tax rate lead to a reduction in the labor supplied, ultimately causing a decrease in tax revenue.
|
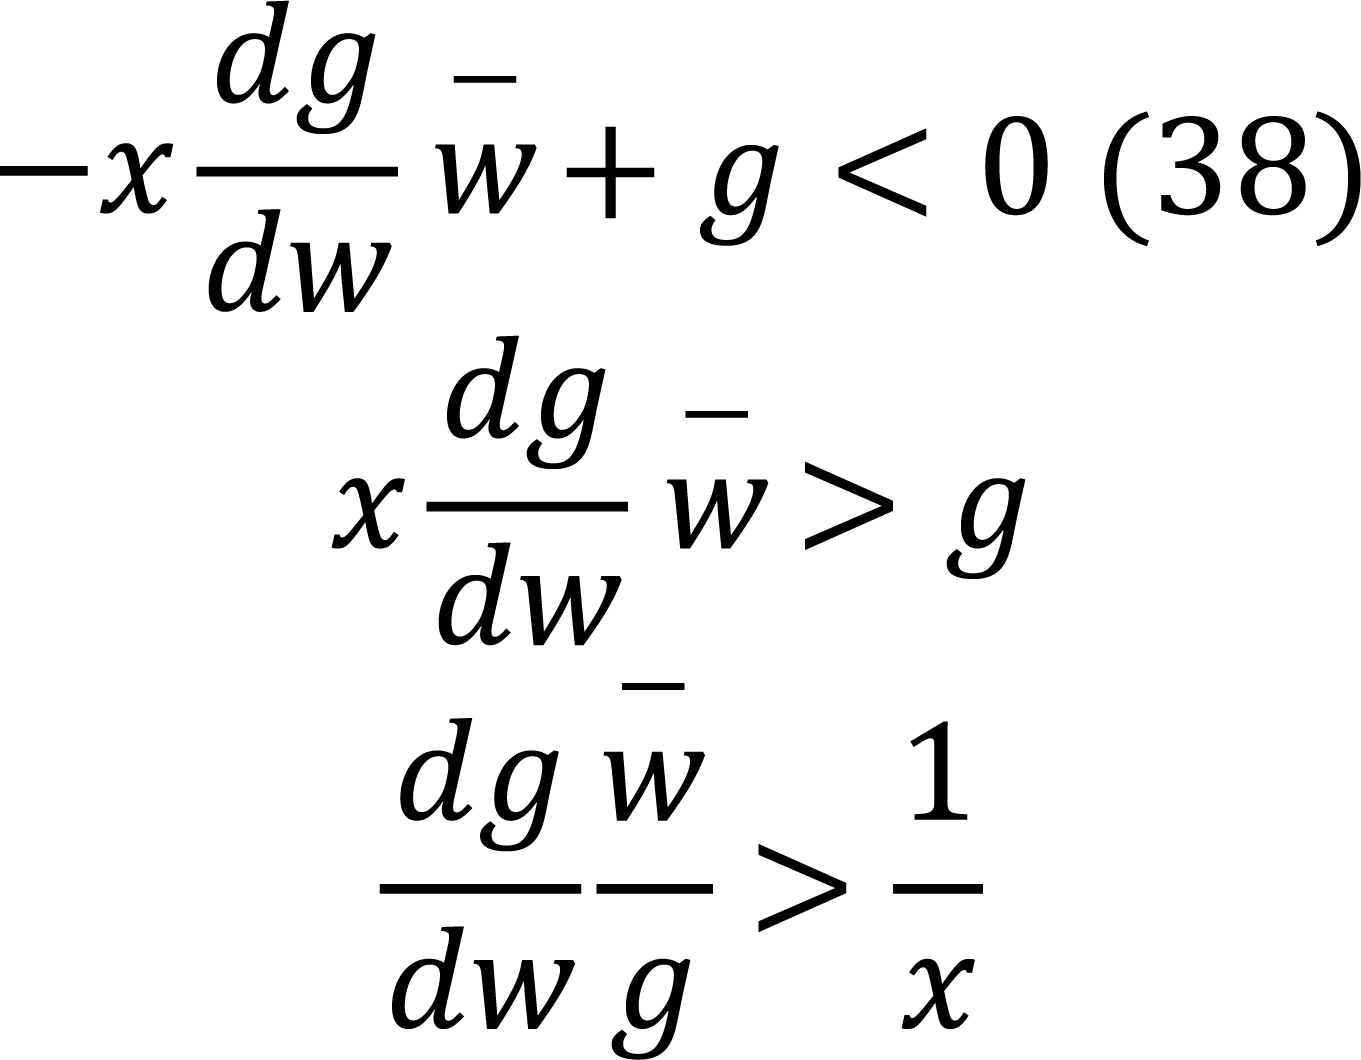
Substituting w=(1-x), in the above expression, we obtain Equation (39).
|
The left-hand side of the above expression represents the elasticity of labor supply. According to Lafferʼs theory, a decrease in tax revenue in response to an increase in the tax rate can only happen if the elasticity of labor supply is greater than 1-x / x. This implies that, for a tax rate of 50 percent, the Laffer effect would occur only if the elasticity of labor supply exceeds 1. In other words, a one percent reduction in the labor wage would need to lead to a more than one percent decrease in labor supply. According to econometric studies, the highest measured elasticity of labor supply is around 0.2. As a result, the Laffer effect is unlikely to take place.
From this discussion, it is clear that, according to Laffer, an increase in the tax rate can only result in decreased tax revenues if the supply of goods is highly elastic. This means that in order for the Laffer effect to occur, the supply of goods must significantly decrease when the tax rate increases.
Although both models, i.e., the one adopted in this article vide Equation (29) and the Laffer Curve illustrate similar relationships between tax revenues and tax rates, the underlying concepts are fundamentally opposed when it comes to the impact of tax rates on a countryʼs GDP. According to Laffer, when the tax rate is already high, further increases in the tax rate lead to a reduced supply of goods, which negatively impacts tax revenues. In contrast, Equation (29) incorporates three variables: the tax rate, tax compliance, and the supply of goods (i.e., GDP), all of which influence tax revenues. While this model aligns with Lafferʼs idea in that tax revenues initially increase with higher tax rates, it also suggests that as tax rates rise, the supply of goods in a country decreases, thereby negatively impacting the countryʼs GDP. However, despite this reduction in GDP, tax revenues continue to rise due to the higher tax rate.
According to both Laffer and Equation (29), although higher tax rates initially have a negative impact on the supply of goods, this effect is not significant enough to cause a reduction in tax revenues. However, when the tax rate reaches a sufficiently high level, further increases in the tax rate will lead to a decrease in tax revenues. At this point, a different interpretation of Equation (29), compared to Lafferʼs explanation, comes into play.
According to Laffer, when the supply of goods decreases sufficiently, it begins to negatively affect tax revenues as the tax rate increases. In contrast, Equation (29) introduces a new variable-voluntary tax compliance-which reflects the willingness of the public to pay taxes. It suggests that compliance has a negative relationship with the tax rate: as the tax rate rises, the level of tax compliance falls. Our model demonstrates that as the tax rate rises, tax compliance decreases, leading to higher levels of tax evasion. Initially, the effect of reduced compliance is not significant enough to reduce tax revenues; as a result, tax revenues continue to increase despite a declining supply of goods and lower compliance levels. However, once the tax rate reaches a certain threshold, further increases in the tax rate will cause compliance to drop so much that tax revenues will begin to decrease.
The Laffer Curve illustrates the relationship between tax revenues and tax rates, showing that tax revenues initially increase with rising tax rates but eventually decrease as the supply of goods continuously declines with higher taxes. On the other hand, the tax equation indicates that tax revenues can decrease even if the supply of goods remains constant. At a certain point, the compliance level drops so significantly that GDP can actually increase with higher tax rates, as depicted in Figure 7.
In Figure 10 and Table 4, the supply of goods is lower at point B than at point A. However, according to Equation (29) although the tax rate at point A is lower than that at B, the compliance level at A is higher, meaning that people are paying more taxes at A than at B. The lower tax payments at B, due to decreased compliance, will lead to a higher supply of goods at B than at A. However, at point B, people would be concealing their supplies and consumption from the government, contributing to a larger underground economy. This reduction in compliance and tax revenue will further weaken the overall system and governance structure, making public officials more susceptible to corruption and bribery, which could further diminish the level of tax compliance.
|
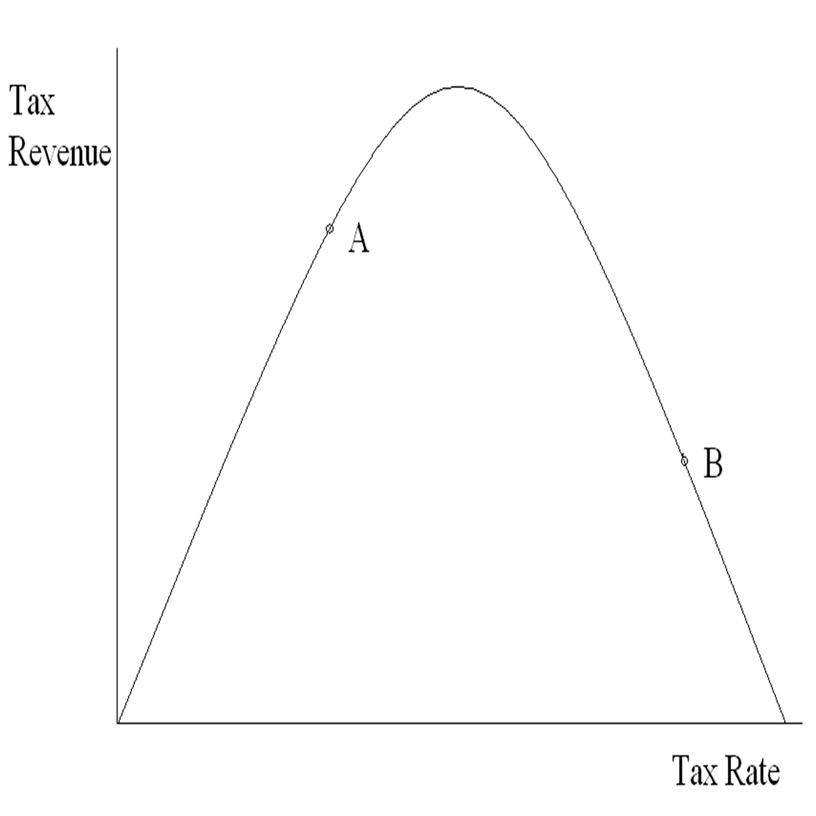
Figure 10. Equation 28 Versus Laffer Curve.
Table 4. The Supply of Goods about Point B and Point A
|
Equation 28 |
Laffer Curve |
Point A |
Compliance Higher, Supply Lower |
Supply Higher |
Point B |
Compliance Lower, Supply Higher |
Supply Lower |
Thus, up to a certain tax rate, both tax compliance and the supply of goods will decrease. However, beyond that point, further increases in the tax rate will lead to extremely low tax compliance and tax payments, causing an underground economy to thrive. According to Equation (29), before the Laffer effect takes hold, a compliance effect will occur, meaning people will not pay the full amount of tax they would under a hundred percent compliance level. Therefore, as the tax rate increases, the supply of goods initially decreases. But once a certain tax rate is surpassed, the continuously declining compliance level becomes so low that the supply of goods actually starts to increase, along with all the negative consequences of a growing underground economy.
Voluntary tax compliance, as a function of the tax rate, plays a crucial role in determining tax revenue collection, with compliance decreasing as the tax rate rises. In Pakistanʼs cigarette industry, the tax compliance rate is 11.53%, and 37.5% of cigarette consumption is underreported in surveys. The analysis shows that fractional compliance is inversely related to the tax rate. Tax revenue initially increases with higher tax rates, reaching a peak before declining as the tax rate rises. On the other hand, GDP behaves oppositely to tax revenue. The highest GDP occurs at either a 0% or 100% tax rate, where tax revenue is zero. As the tax rate rises, GDP decreases initially until it reaches a minimum, after which it begins to increase again, eventually reaching its peak at a 100% tax rate at a specific point in time. This contrasts with the Laffer Curve, which suggests that a decrease in the supply of goods leads to lower tax revenue as the tax rate increases. Equation (29) introduces a new factor-voluntary tax compliance-which reflects the publicʼs willingness to pay taxes. It indicates a negative relationship between compliance and the tax rate: as the tax rate rises, compliance falls. Our model shows that as the tax rate increases, tax compliance decreases, leading to higher levels of tax evasion. Initially, the reduction in compliance does not significantly impact tax revenue, so tax revenues continue to rise despite lower compliance and a reduced supply of goods. However, once the tax rate exceeds a certain threshold, the decline in compliance becomes substantial enough to reduce tax revenue.
Up to a certain point, both tax compliance and the supply of goods will decrease as the tax rate rises. However, beyond that threshold, further increases in the tax rate will result in significantly lower tax compliance and payments, fostering the growth of an underground economy. According to Equation (29), before the Laffer effect takes effect, a compliance effect occurs, meaning people will not pay the full amount of tax they would if compliance were at 100%. As a result, as the tax rate increases, the supply of goods initially decreases. However, once the tax rate surpasses a certain level, the ongoing decline in compliance becomes so severe that the supply of goods begins to rise again, accompanied by the negative consequences of a growing underground economy. The underground economy, also known as the shadow economy, can have various detrimental effects, such as:
Loss of government revenue: Unreported economic activities that should be part of the official gross national income are excluded, resulting in a loss of tax revenue for the government.
Harmful economic cycle: The shadow economy can create a damaging cycle where unrecorded transactions reduce economic income, prompting the government to raise taxes, which can negatively impact the public sectorʼs budget.
Erosion of societal cohesion: The underground economy can weaken social unity and trust within society.
It is therefore important for the government to choose a suitable fiscal policy depending on the objectives of the policy. If the objective is to achieve a higher long term economic growth in terms of GDP, the tax rates must be on the lower side, however, if the objective is to maximize tax revenues, then an optimal rate taking voluntary tax compliance into consideration must be opted for.
Acknowledgements
Not applicable.
Conflicts of Interest
The authors declared no conflict of interest.
Data Availability
All data generated or analyzed during this study are included in this published article and its supplementary information files.
Copyright Permissions
Copyright © 2025 The Author(s). Published by Innovation Forever Publishing Group Limited. This open-access article is licensed under a Creative Commons Attribution 4.0 International License (https://creativecommons.org/licenses/by/4.0), which permits unrestricted use, sharing, adaptation, distribution, and reproduction in any medium, provided the original work is properly cited.
Author Contribution
The author contributed to the manuscript and approved the final version.
Abbreviation List
FCV, Flue cured virginia
GDP, Gross domestic product
PTC, Pakistan tobacco company
RA-GAP, The revenue administration gap analysis program
VAT, Value added tax
References
[1] Feltham GD, Paquette SM. The interrelationship between estimated tax payments and taxpayer compliance. J Am Tax Assoc, 2002; 24: 27-45.[DOI]
[2] Tyler TR. Why people obey the law, Princeton university press. 2006
[3] Dhami S, Al-Nowaihi A.Why do people pay taxes? prospect theory versus expected utility theory. J Econ Behav Organ, 2007; 64: 171-192.[DOI]
[4] Feldman NE, Slemrod J. Estimating tax noncompliance with evidence from unaudited tax returns. Econ J, 2007; 117: 327-352.[DOI]
[5] Abdul-Jabbar H, Pope J. Exploring the relationship between tax compliance costs and compliance issues in malaysia. J appl law policy, 2008; 2008: 1-20.
[6] Durlauf SN, Nagin DS. Imprisonment and crime: Can both be reduced? Criminol Public Pol, 2011; 10: 13-54.[DOI]
[7] Alm J, McClellan C. Tax morale and tax compliance from the firm’s perspective. Kyklos, 2012; 65: 1-17.[DOI]
[8] Hurst E, Li G, Pugsley B. Are household surveys like tax forms? Evidence from income underreporting of the self-employed. Rev Econ Stat, 2014; 96: 19-33.[DOI]
[9] Dunbar GR, Fu C. Sheltered income: estimating income under-reporting in canada, 1998 and 2004, Technical report, Bank of Canada Working Paper. 2015
[10] Artavanis N, Morse A, Tsoutsoura M. Measuring income tax evasion using bank credit: Evidence from greece. Q J Econ, 2016; 131: 739-798.[DOI]
[11] Almunia M, Lopez-Rodriguez D. Under the radar: The effects of monitoring firms on tax compliance. Am Econ J-Econ Polic, 2018; 10: 1-38.[DOI]
[12] Batrancea L.Empirical evidence regarding the impact of economic growth and inflation on economic sentiment and household consumption. J Risk Financ Manag, 2021; 14: 336.[DOI]
[13] Batrancea LM, Balc MA, Akgüller Ö et al. What drives economic growth across european countries? a multimodal approach. Mathematics, 2022; 10: 3660.[DOI]
[14] Convery F, McDonnell S, Ferreira S. The most popular tax in europe? lessons from the irish plastic bags levy. Environ Resour Econ, 2007; 38: 1-11.[DOI]
[15] Nawaz N. Robust inference by sub-sampling. J Quant Econ, 2020; 18: 657-681.[DOI]


