Modelling E-commerce Data Using Pareto Principle
Tayo P Ogundunmade1*, Adedayo A Adepoju1
1Department of Statistics, University of Ibadan, Ibadan, Nigeria
*Correspondence to: Tayo P Ogundunmade, PhD, Department of Statistics, University of Ibadan, Oduduwa Road, Ibadan, Oyo, 200132, Nigeria; Email: ogundunmadetayo@yahoo.com
DOI: 10.53964/mem.2024011
Abstract
Background: Leveraging the Pareto Principle has become not just feasible but strategically crucial for businesses as the e-commerce field continues to grow with a multitude of products, customers, and marketing channels. By concentrating their efforts on the most important aspects of their business, organizations may enhance client experiences, increase returns on investment, and streamline procedures. In the cutthroat world of e-commerce, this strategy enables businesses to deploy resources more effectively, optimize returns on investment, and promote sustainable growth.
Objective: Consequently, the goal is to evaluate product performance in the e-commerce sector to pinpoint best-selling products and slow-moving inventory. The dataset used in this paper is sourced from a UK-based retail website containing a diverse range of products and orders.
Methods: The data were subjected to quantitative descriptive analysis, and the Pareto principle was applied to illustrate the differences in sales contributions among the top few countries.
Results: According to this study, the company’s sales are mostly influenced by a small number of important markets, with the contribution of other areas being comparatively insignificant. The UK is without a doubt the company’s main market.
Conclusion: The analysis indicates that there is room for growth in the present overseas commerce, and that the corporation can achieve significant sales growth by implementing focused marketing campaigns.
Keywords: e-commerce, sales, price, Pareto Principle, machine learning
1 INTRODUCTION
In today’s dynamic e-commerce landscape, where vast quantities of data are generated daily, organizations are increasingly employing the use of data analysis to extract valuable insights and inform strategic decisions. Amidst this deluge of data, the Pareto Principle, commonly known as the 80/20 rule, emerges as a powerful tool for companies seeking to optimize their strategies and resources. The Pareto Principle, which is inspired by the fact that 80% of effects results from 20% of causes, provides e-commerce companies with a valuable framework to identify and prioritize critical aspects of their business operations[1]. As the e-commerce space continues to expand with a myriad of products, customers, and marketing channels, leveraging the Pareto Principle has become not only practical but strategically essential for businesses. Organizations can optimize their returns on investment, improve customer experiences, and streamline processes by concentrating their efforts on the most impactful components of their business. This approach allows companies to allocate resources more efficiently, maximize returns on investment, and drive sustainable growth in the competitive e-commerce landscape[2].
This introduction discusses the significance, methodologies, and practical applications of the Pareto principle in the context of e-commerce data analysis. In today’s fiercely competitive digital marketplace, companies stiving for efficiency and effectiveness can leverage the Pareto Principle as a blueprint for various strategic initiatives, including product assortment, customer segmentation, marketing optimization and inventory management.
A hybrid technique called K-prototype clustering was suggested by Sunil and Mahendira[3]. to cluster both numerical and categorical data. They used data from an Indian e-commerce website, with 1,500 rows, 10 column features, and pre-processed data using pandas. They employed the Knee Locator to determine the ideal K value and the elbow’s formation point, as well as the elbow method to determine the ideal number of K. Three other algorithms were used in the study to compare their respective performances: K-Modes Clustering, Hierarchical Agglomerative Clustering, and DBSCAN algorithm. They revealed that K-prototype clustering outperforms other techniques in handling mixed data and huge datasets. Although, the challenge posed by categorical data makes it difficult to calculate a silhouette score, the study underscores the potential for development. By focusing on distinct dynamic clusters, the business gleaned insights into customer preferences and forecast future earnings for different product / service categories, and sections of their online platform. For example, recognizing evolving trends or preferences within dynamic clusters could help the business make more informed strategic choices and improve its capacity to customize its products to meet the needs of its clients.
Andra and Baizal provide an e-commerce product recommendation system based on collaborative filtering with principal component analysis (PCA) and K-Means clustering in order to improve recommendation systems[4]. While PCA is used to minimize data dimensionality and enhance K-Means clustering efficiency, K-Means Clustering is used to overcome sparsity issues and generate user clusters to limit the amount of data requiring being processed. System performance was assessed using Mean Absolute Error and Root Mean Square Error (RMSE) on the sports product data from the Olist e-commerce show. The findings indicate that when compared to alternative approaches, the suggested system has a lower RMSE value.
Nainggolan and Eviyanti used the K-Means clustering algorithm to tackle the challenge of clustering product reviews sourced from online shops[5]. Initially, they gathered information on product reviews from an internet retailer. Subsquently, they pre-processed the data by converting it into a numerical representation, eliminating stop words, and stemming the words. Using the K-Means clustering algorithm, the authors grouped the reviews into clusters applied to the dataset. The Clustering algorithm was employed by the authors to select a subset of features from the dataset. Two clusters of product reviews one with favourable ratings and the other with negative reviews were successfully formed by the authors. Of the product reviews, 159 (18%) were in the cluster of negative reviews, whereas 729 (82%) were in the cluster of good reviews. The authors show that the K-Means clustering technique prove valuable in organizing product reviews from online shops into distinct groups. Furthermore, they propose that potential buyers can leverage on the s findings from the study to make more informed decisions regarding which products to purchase.
Kusrini conducted a study on collaborative filtering techniques, highlighting their applicability in e-commerce and their potential in solving specific problems in this field[6]. The paper underscores the practical application of these techniques in real-world scenerios making it an invaluable tool for both data science and e-commerce professionals alike.
According to Wu et al.[7], it is possible to accurately identify the value of customers by categorizing them based on various attributes and traits. Such categorisation enables online retailers in creating individualized marketing campaigns for their clientele, a process that involves incorporating behavioural data into the conventional RFM model and resolving the artificial K-value setting issue with the K-medoids algorithm.
Shaik et al.[8] introduced a probability density function to provide an improved initial centre selection approach. The outcome of the experiment shows that the enhanced algorithm offers clear advantages compared to the original K-medoids algorithm.
Vishal and Reddy[9] used customer purchase behaviour data and the K-Means clustering method to address the crucial challenge of enhancing marketing strategies and boosting sales. Their objective was to put their clientele into discrete groups based on common traits, specifically focusing on the patterns of customer purchase behaviour. The study used a Malaysian e-commerce dataset to segment consumers using K-Means clustering. Sixty percent of the data was used for testing, while the remaining forty percent was used for training. To assess the performance of their prediction models, they employed Mean Squared Error (MSE) and Coefficient of Determination (R²).
Dashboards and data visualization tools were utilized to illustrate brand preferences and the outcomes of customer segmentation. In addition to statistics on users’ interactions with various product brands, the dashboard presented the study’s visualization of brand popularity among online buyers. The model’s performance in predicting outcomes was assessed by R², while prediction errors were quantified using MSE. To show the robustness their method for consumer segmentation and prediction, the study compared it to multiple linear regression and support vector regression.
In order to determine data mining’s efficacy in customer acquisition and retention, Rezaeian et al.[10] suggested a new clustering approach that uses independent criteria for consumer segmentation, namely gender, recency, frequency, monetary value, and product classification. First, the authors processed the transaction data that they had gathered from a little Iranian internet retailer. The ideal number of clusters was determined using the silhouette score. Thereafter, RFM and K-Means algorithms were used to train the data. Their findings identified important clientele, which aided in more focused marketing tactics that improved website revenue and raised client satisfaction. According to their research, K-means is a very useful tool for solving related problems and is quite effective at increasing revenues for e-commerce businesses.
In Zhang et al.[11] analysis, the K-Means clustering technique was used to partition the data into four categories with different classification criteria. These categories were then named in descending order of importance to the enterprise. Additionally, the suggested behaviour of each category was examined. Zhang’s research demonstrated that customers are, more or less, internally oriented. According to his observations, e-commerce platforms have had a continuous impact on the traditional retail market in recent years due to their expansive product selections and flexible purchasing hours. In light of the COVID-19 pandemic, e-commerce has been severely impacted by package security, particularly for international purchases. Through his study, he has identified company marketing strategies that different user types can employ to enhance precision marketing efforts.
In order to implement marketing strategies, Lim proposed using the K-Means segmentation to discover significant clusters and distinct buying behaviours[12]. To get useful insights, the author conducts a K-Means segmented market basket analysis after conducting cluster analysis. They obtained the information they utilized from an online retailer with a UK address. The author’s findings revealed that, in terms of average sales and overall sales contribution, segments 3 and 6 of his data showed considerable promise. The author recommended focusing on these particular market niches in order to boost business revenues.
Tabianan et al.[13] used consumer purchase behaviour data to tackle the K-Means Clustering challenge of customer segmentation. They employed Malaysian e-commerce data from the MDEC repository using machine learning technique on the basis of consumer purchase behaviour. They combined the AP method and the K-Means clustering algorithm to create the enhanced K-Means clustering algorithm. Their findings revealed that outcome of the square error will be less if the Affinity Propagation Algorithm is used alone and the consumer groupings that were extremely profitable in a falling order. These findings can help both buyers and sellers make more informed decisions in the market. The authors suggest increasing investment and focusing marketing efforts on the profit-generating categories.
2 METHODS AND MATERIALS
The dataset used in this paper is sourced from a UK-based retail website and is accessible at https://www.kaggle.com/. For this study, only a portion of this enormous dataset was employed, comprising 541,910 rows and 8 feature columns with distinct values containing a diverse range of products and orders.
Furthermore, the dataset exhibits duplicates, missing values, negative values in both the Unit Price and Quantity columns. The data is made suitable for analysis by cleaning and modifying it. Features such as Invoice Number, Stock Code, Product Information, Quantity Purchased, Invoice Date, Product Price, Customer ID, and Customer Country are included in the data. The original data is accessible at https://www.kaggle.com/datasets/atharvaarya25/e-commerce-analysis-uk.
First, duplicate rows identified in the dataset were fixed as these duplicates could introduce biases and errors into the analysis. To ensure the integrity of the dataset, we utilized the pandas to locate and eliminate these duplicate rows. Subsequently, to prevent any gaps in our analysis, we proceeded to address the problem of missing data as the missing values in the dataset could affect the statistical qualities. Where necessary, the missing values are filled with pandas thereby ensuring a more complete dataset for the analysis. Additionally, the problem of rows containing improper values, particularly negative values was addressed. Such values can distort analysis, especially when dealing with financial data. Therefore, steps were taken to rectify these discrepancies to maintain the accuracy and reliability of our analysis. Negative debt-related values were found in this instance and eliminated from the data. More accuracy in the data representation is ensured by this procedure, especially in financial studies. Furthermore, cancelled orders were removed because they could have a significant impact on the sales analysis. Finally, a new column was created named entire, in which the quantity and price are multiplied and displayed as the entire amount received from an order.
2.2 Pareto Principle
The Pareto distribution is a continuous probability distribution named after the Italian economist Vilfredo Pareto. Itis characterized by a probability density given by:
|
otherwise, where:
k>0 is the shape parameter (also known as the Pareto index),
xm>0 is the scale parameter (the minimum possible value of x),
x≥xm is the domain of the distribution.
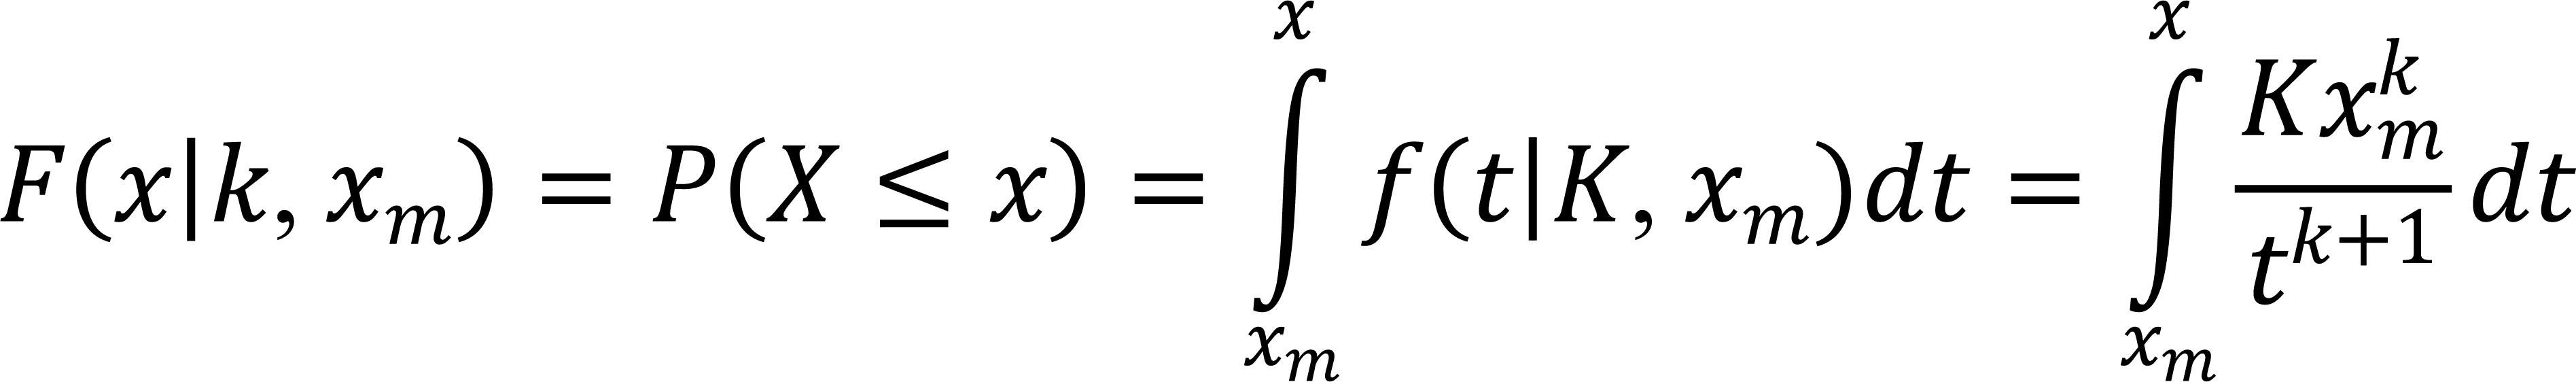
By considering the cumulative distribution function (CDF), which gives the probability that a random variable X is less than or equal to a certain value x:
|
For x<xm, F(x|k, xm)=0 since the distribution start from xm. For x≥xm,we have:
|
By integrating this function. Let u=t-(k+1), then du=-(k+1)t-k-2dt.
The integral becomes:
|
This results in the CDF of the Pareto distribution. The PDF can then be obtained by differentiating the CDF:
|
The UK retail dataset was analysed using a Python script for Pareto Analysis with rotated x-axis labels, with a focus on the “Total” metric for different “Countries”. The script manipulates data using the Pandas library and visualizes it using matplotlib. Sorting, calculating cumulative percentages, and creating bar charts are all included. The script rotates the x-axis labels for improved visibility in order to solve the problem of them overlapping. In addition to delivering practical Pareto Analysis support and flexibility for customizing data, the code prioritizes elements that significantly contribute to a specific metric.
3 RESULTS AND DISCUSSION
In this section, the descriptive statistics of two important dataset columns, namely, Quantity and Unit Price are obtained. These metrics provide crucial information about the pricing schemes and buying habits of our retail dataset, which are sourced from a UK-based retail website given above. The quantity of products purchased in each transaction is indicated in the “Quantity” column. By examining this variable, one can gain a thorough picture of consumers’ purchasing habits. Table 1 presents some important statistics.
Table 1. Descriptive Statistics of the Quantity and Price of Products
Descriptive |
Quantity |
Price |
Mean |
9.552249547 |
4.611113626 |
Standard Error |
0.296247683 |
0.131441352 |
Median |
3.000 |
2.0800 |
Mode |
1.000 |
1.25.00 |
Standard Deviation |
218.0811579 |
96.75985306 |
Sample Variance |
47,559.39141 |
9,362.469164 |
Kurtosis |
119,769.16 |
59,005.7191 |
Skewness |
-0.264076307 |
186.5069717 |
Range |
161,990 |
50,032.06 |
Minimum |
-80,995 |
-11,062.06 |
Maximum |
80,995 |
38,970 |
Sum |
5,176,450 |
2,498,803.974 |
Count |
541,909 |
541,909 |
Largest |
80,995 |
38,970 |
Smallest |
-80,995 |
-11,062.06 |
Confidence Level(95.0%) |
0.580636086 |
0.257620892 |
As seen in Table 1, every order comprises roughly 9.55 goods on average. At 218.08, the significant standard deviation, the number of goods shows considerable diversity. The range, which is between -80,995 and 80,995, shows that the number of products in each transaction varies greatly. Strong tails and a small leftward skew are indicative of a distribution with high kurtosis (119,769.16) and negative skewness (-0.26). The cost of every product is shown in the “Unit Price” column. To evaluate the pricing structure and spot possible outliers, it is essential to comprehend the unit price distribution. Key figures for “Unit Price” are as follows: The price per unit on average is 4.61. A comparatively large standard deviation of 96.76 indicates a high degree of price variability in units. The range, which is between -11,062.06 and 38,970, shows that prices vary greatly. Positive skewness (186.51) and high kurtosis (59,005.72) point to a distribution that is heavily skewed to the right and has large tails. By coordinating with peak purchasing periods, the efficient use of marketing tools can dramatically increase revenue. Weekly statistics provide a rapid snapshot, but it is important to explore the details, including considerations such as the time of the day. It is worth noting that Saturday sales are typically lower, but these are not conspicuously displayed in the dataset. Given that there are six values for each month, presenting a chart displaying sales for each weekday over 12 months may overwhelming. Figure 1 highlights the day in which the best sales are reported to improve visibility for better interpretation.
|
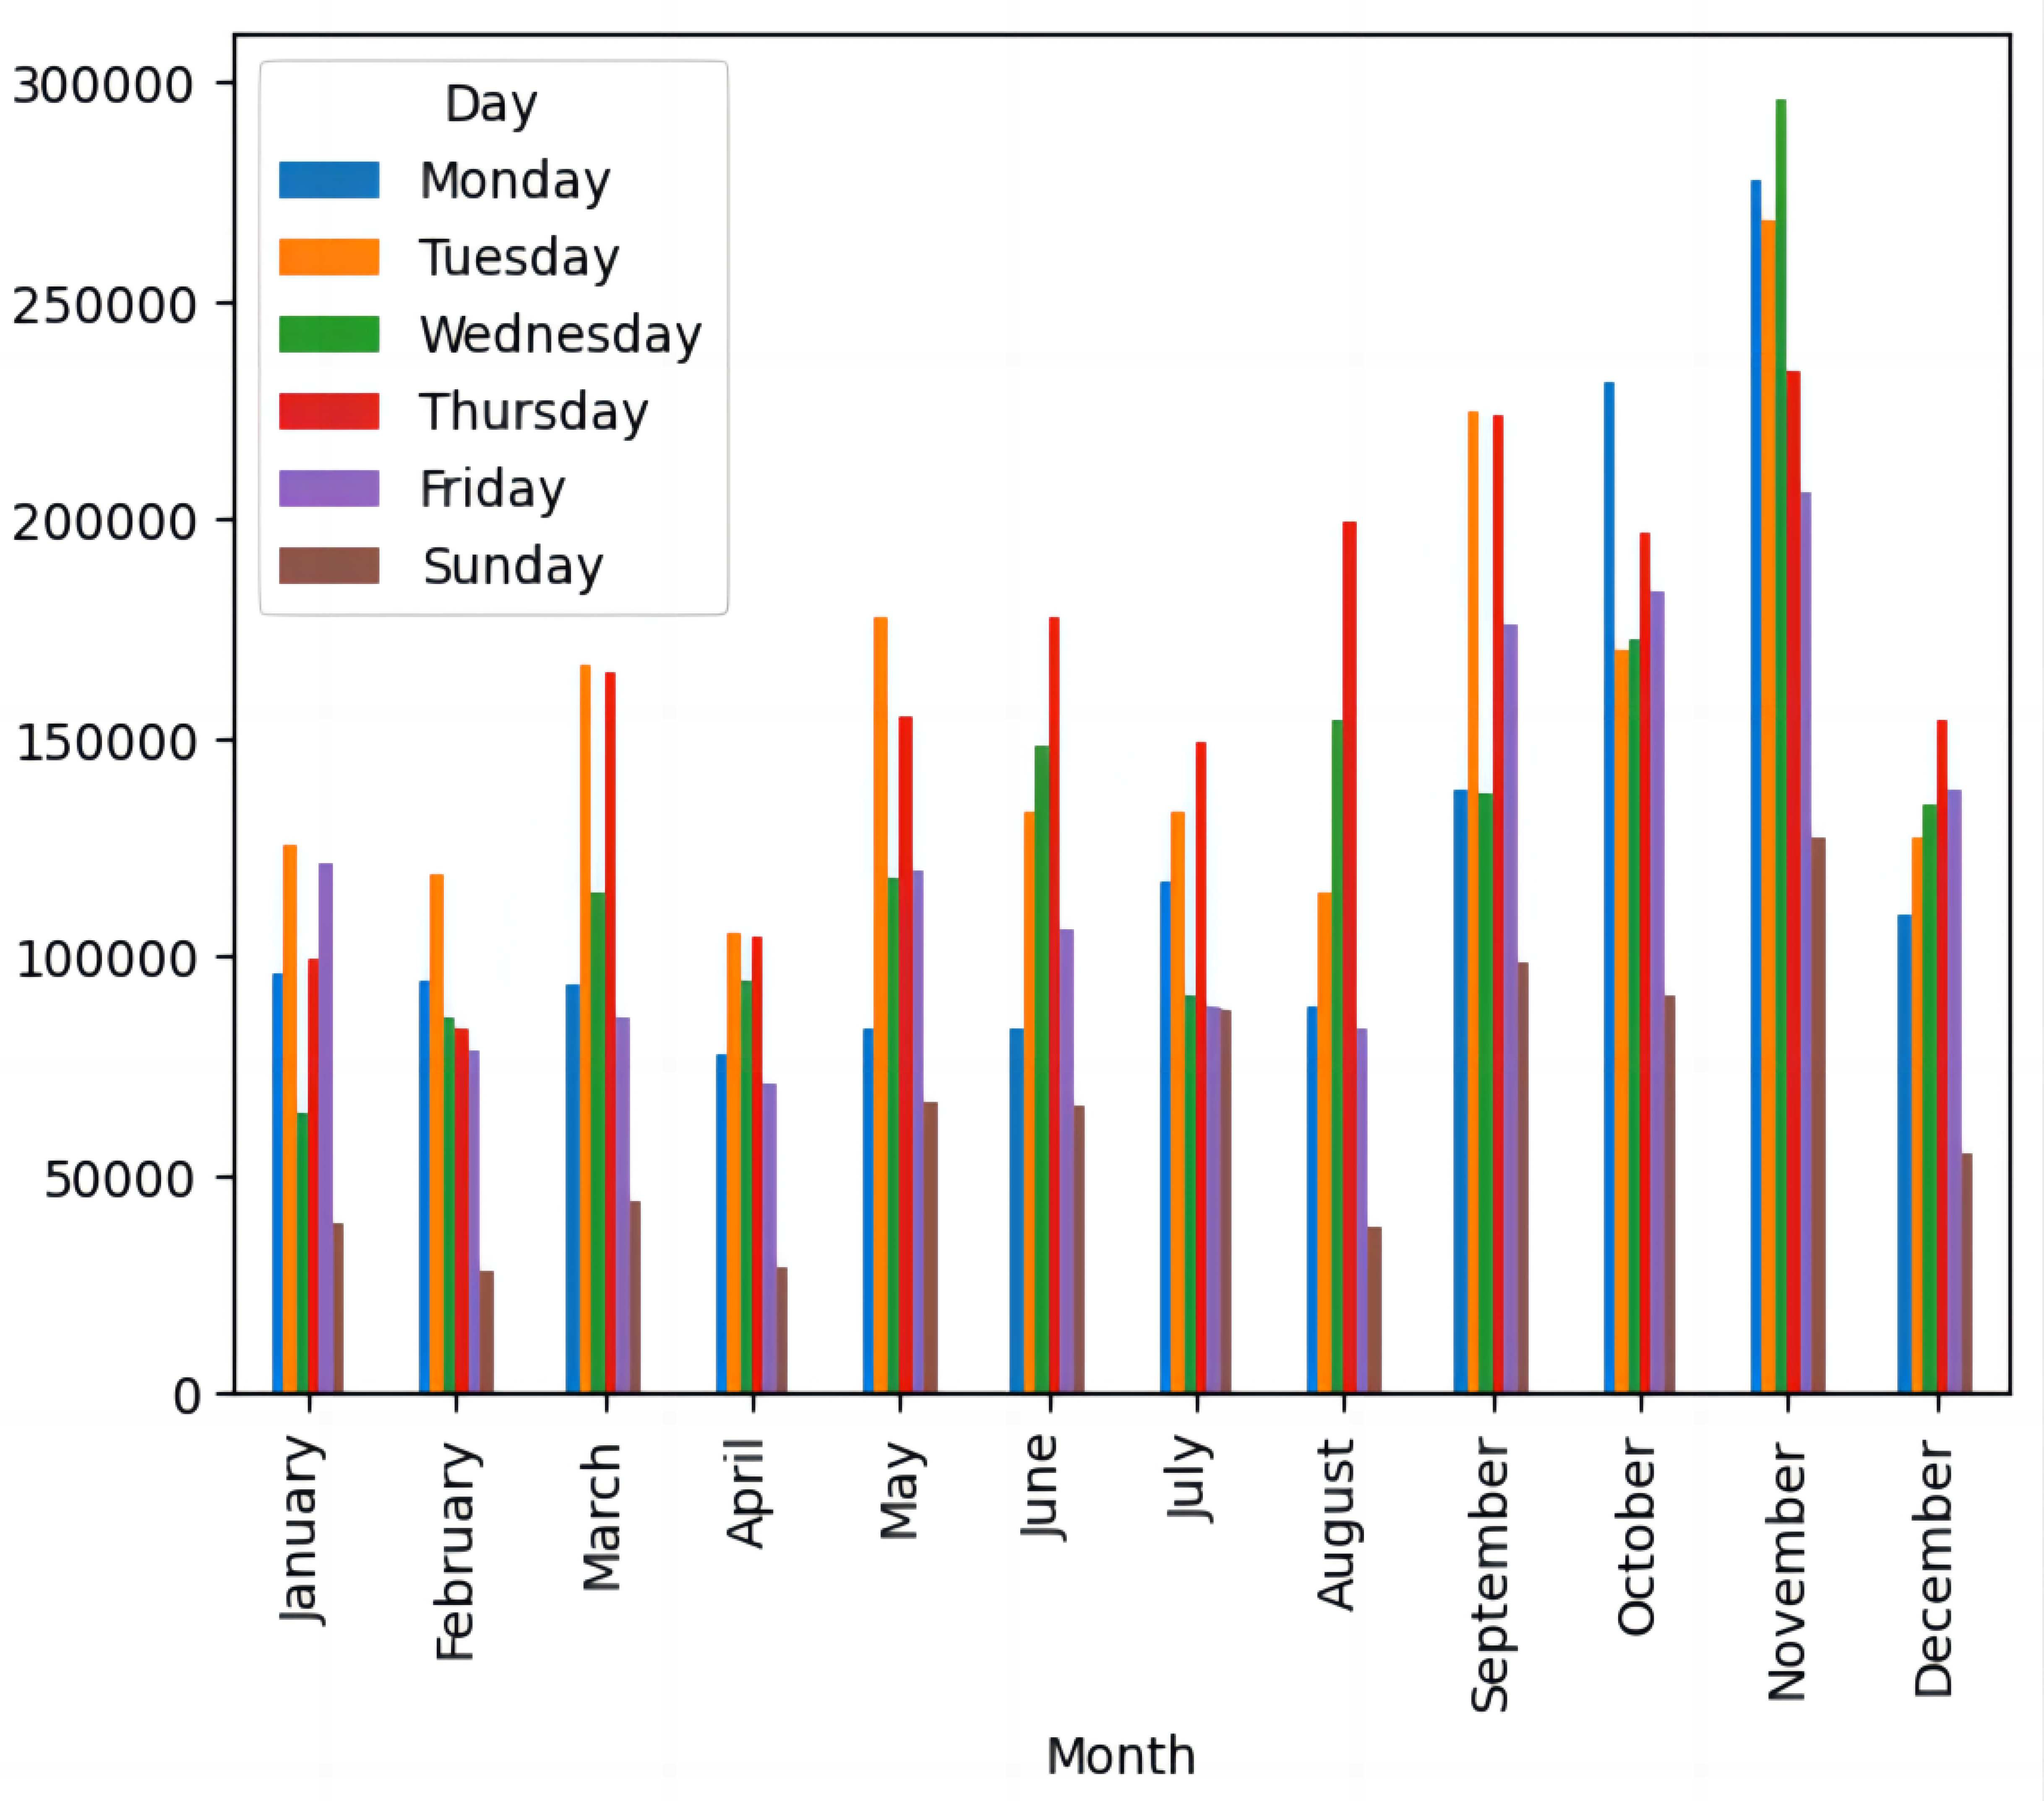
Figure 1. Sales details for weekdays.
While the United Kingdom accounts for the largest portion of the company’s sales figures, a broader examination of the overall expenditure reveals a number of other nations that, despite contributing at a much lower rate, these countries are not completely unimportant as they represent potential avenues for additional revenue should the company decide to expand their services into these markets. Figure 2 shows the total price spend by countries other than United Kingdom.
|
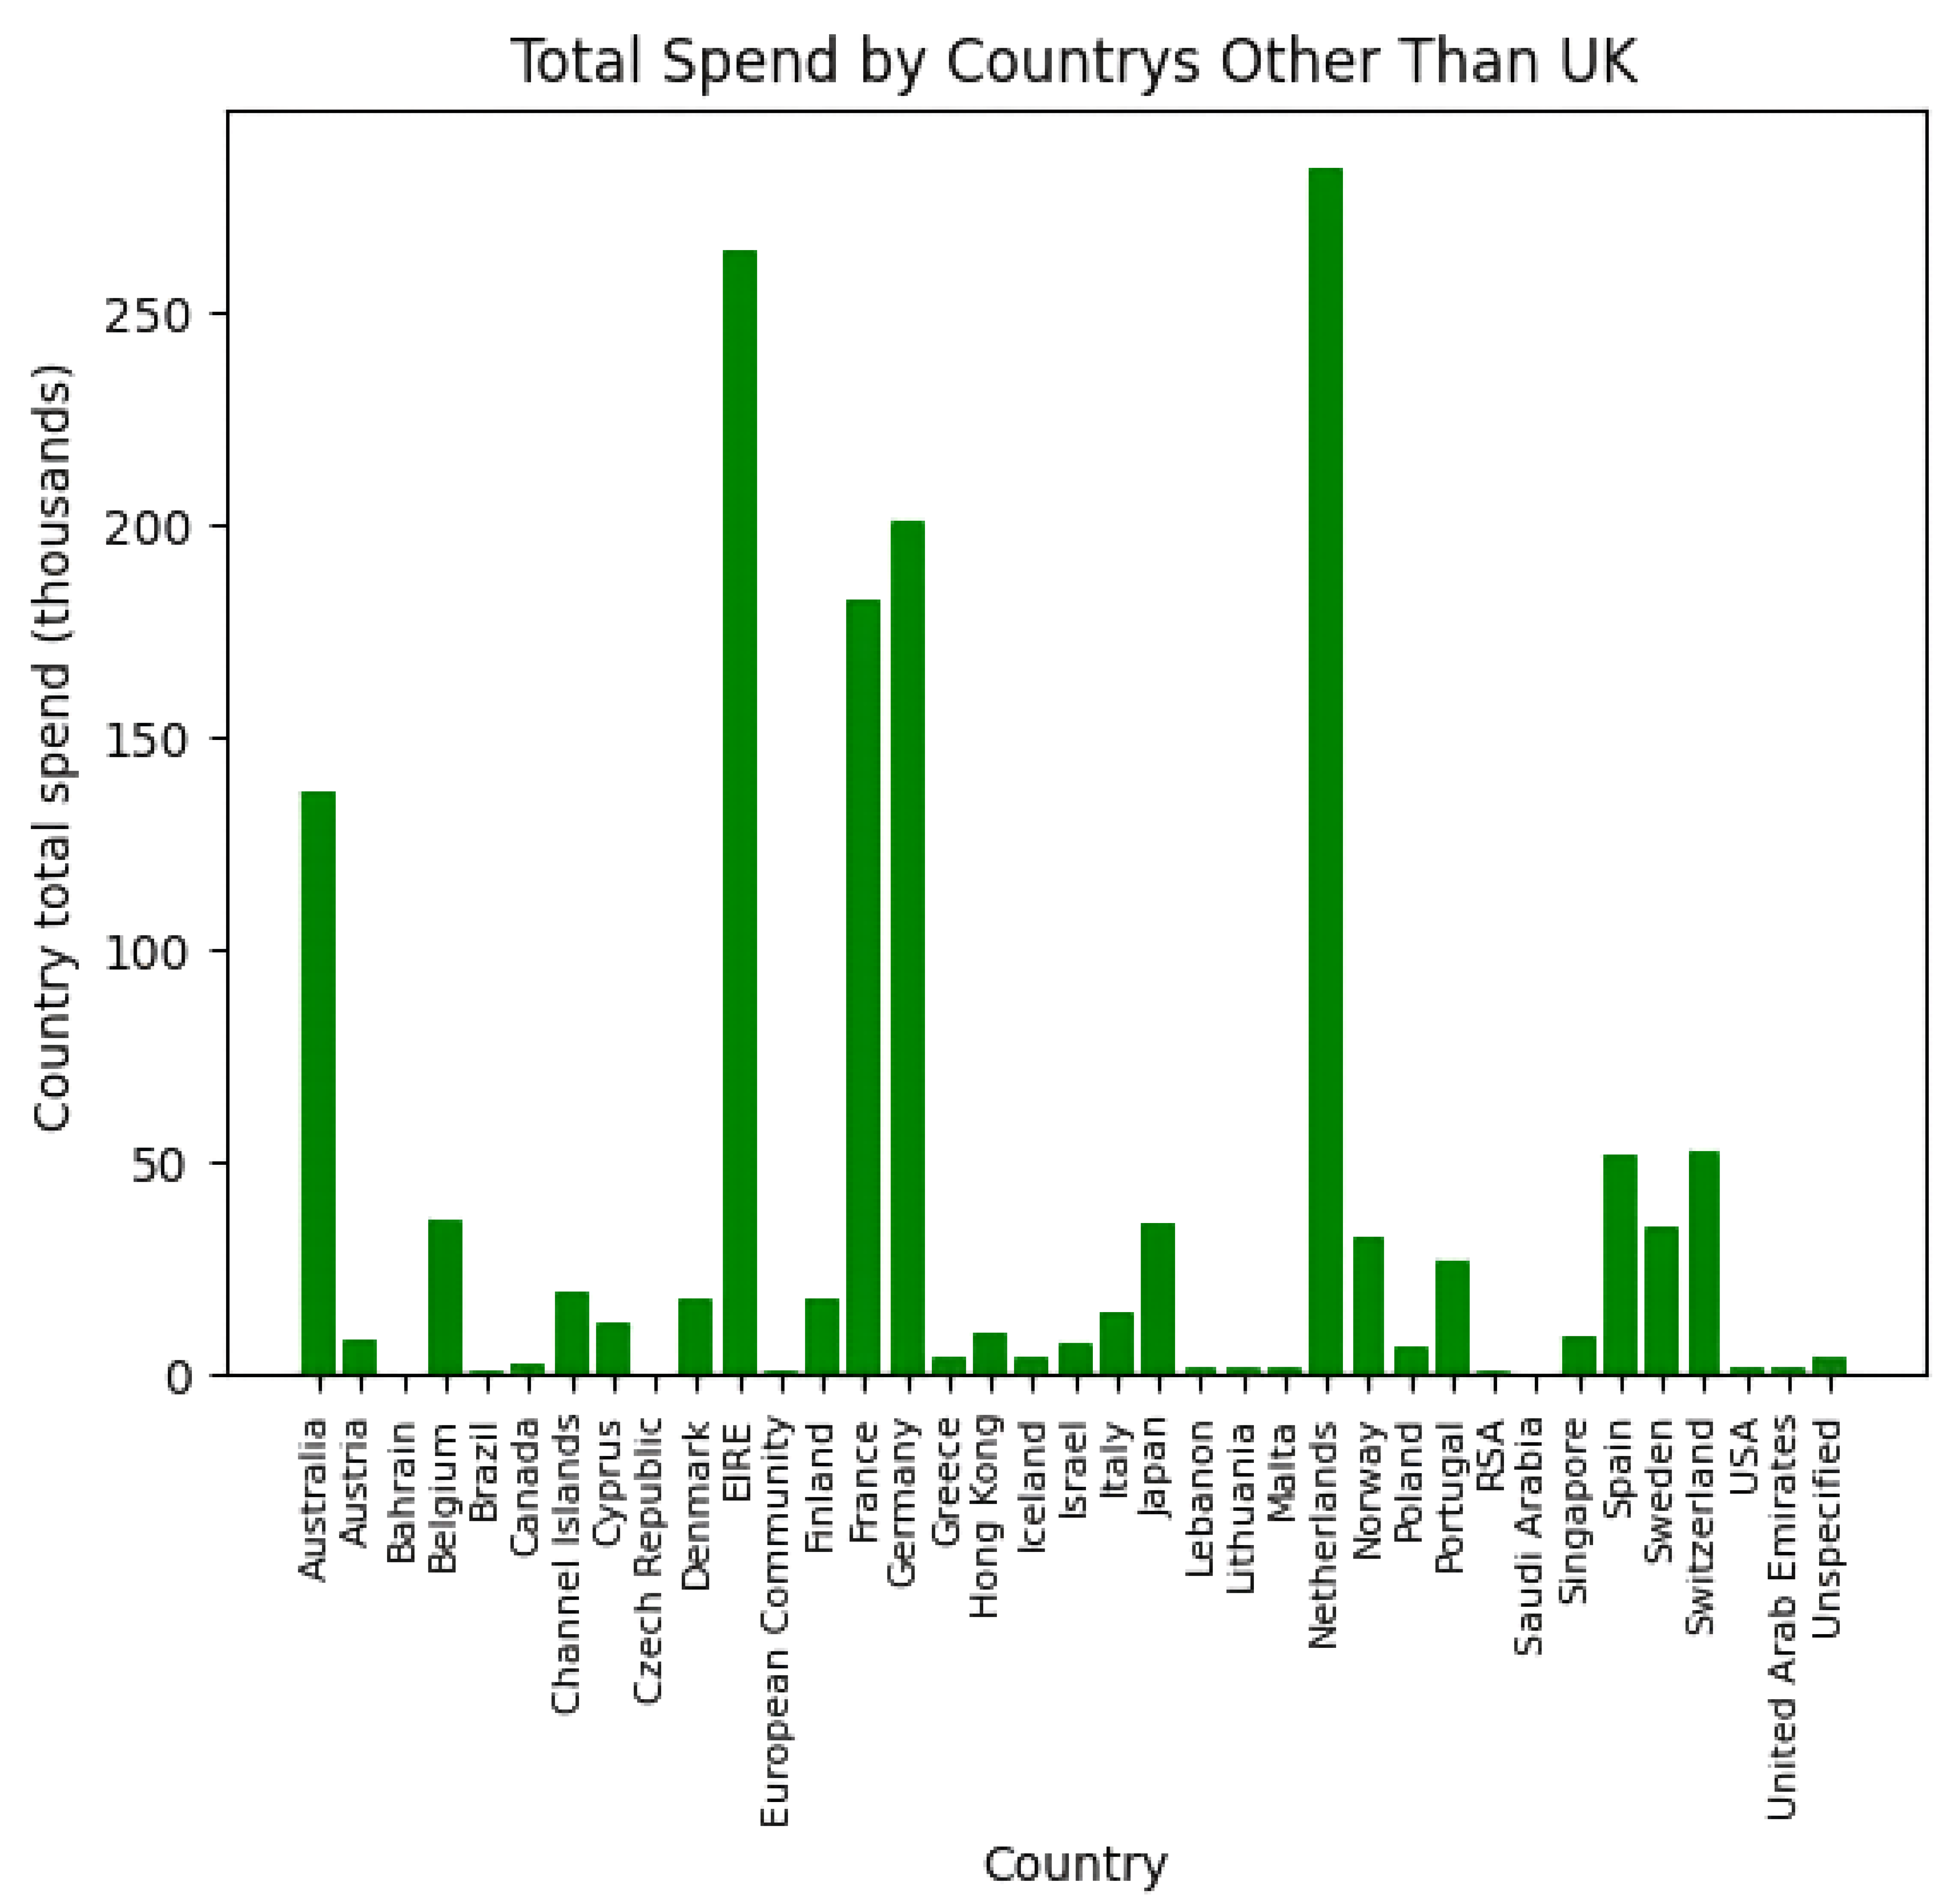
Figure 2. Total spend by countries other than United Kingdom.
According to the results presented in Table S1, nearly 80% of the company’s total revenues originate from the top 20% of nations in terms of sales contribution. This observation aligns with the Pareto principle, which suggests that approximately 20% of the causes (in this case, the countries) account for 80% of the effects (in this case, sales). The disparity in sales contributions between the top few countries and the remaining ones is substantial, indicating that some markets play a significant role in driving the company’s sales. The cumulative line graph shows that as new nations are added, the sales contribution increases rapidly, but then levels off. This suggests that a small number of key markets significantly contribute to the company’s sales, while the contribution from additional markets beyond the few becomes relatively minor. Undoubtedly, the UK stands out as the company’s primary market, as this study revealed. In terms of the proportion of total sales, the other markets may not be as significant, but the actual sales figures are unquestionably worth increasing. Figure 3 shows the Pareto analysis plot.
|
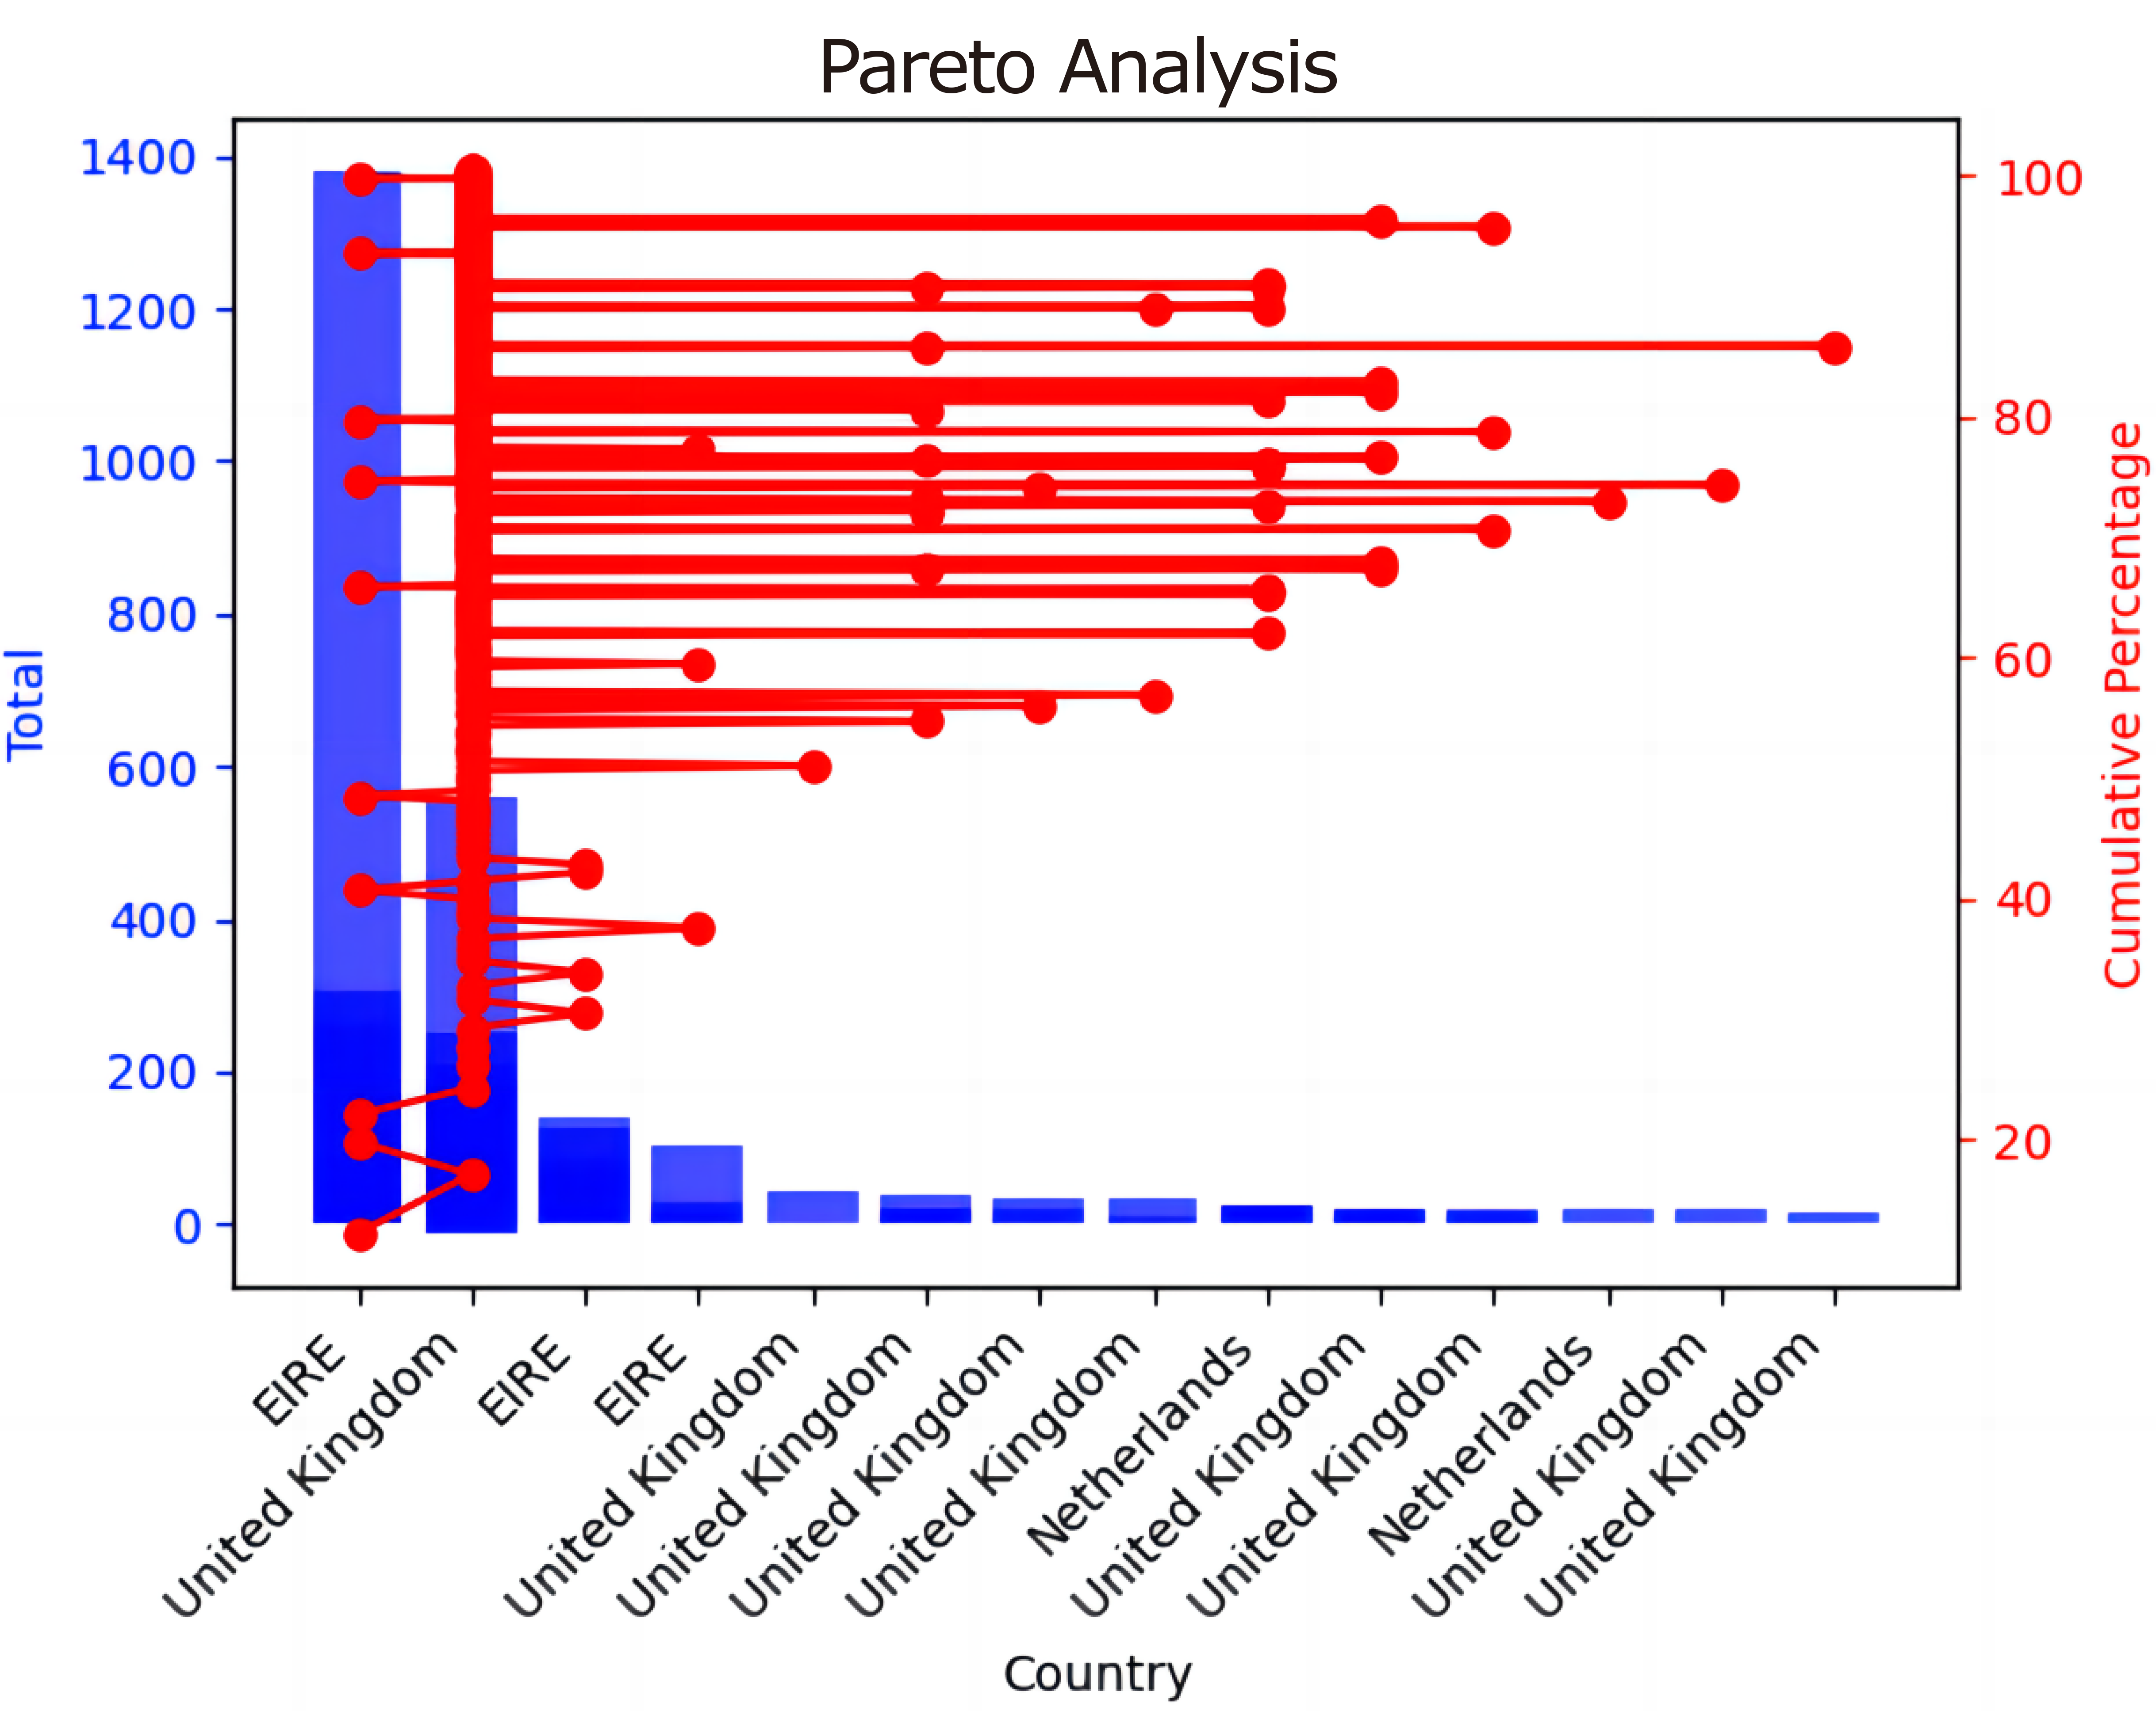
Figure 3. Pareto analysis plot.
3.1 Discussion of Results
In the light of these findings, several conclusions can be drawn, including:
(1) The Pareto chart highlights the top 20% of countries contributing the most to overall sales, revealing a significant reliance on a select few markets.
(2) This underscores the importance of these key markets while also highlighting the relatively small number of markets where the company operates successfully.
Given its geographical location, it is hardly a surprise that the UK dominates the company’s primary market. The UK has a disproportionate share of sales due to the natural benefits of domestic advertising, such as reduced expenses and increased effectiveness. There are still some dangers associated with focusing only on the UK market, particularly if a rival company acquires a substantial market share. An excessive reliance on one market may put the business at risk of losses. Expanding overseas sales becomes essential, and diversification is a wise strategy. Although the proportion of sales from markets outside the UK may be lower at the moment, the examination of emerging markets shows numerous nations have bright futures. Australia, Germany, France, Ireland, the Netherlands, and Ireland are few with significant growth potential. Putting money into other markets that will accept the company’s products well is a calculated move that will lessen reliance on the UK market. This reduces the possibility of rivals controlling the market and opens up new growth prospects in unexplored areas. The company may secure a resilient position in both the local and international markets and assure continued growth by carefully diversifying its market presence and sales channels.
Regarding the category of best-selling items, the data highlights the significance of the Rabbit night light and Jumbo bag red retro-spot, both featuring in the top 10 for quantity and overall sales. The Rabbit night light holds the fifth position in overall sales and the seventh position in the quantity sold, while the Jumbo bag red retro-spot ranks fourth in total sales and second in the number of units sold.
Finding methods to lower manufacturer or supplier costs could result in increased net profits for items in the total sales without compromising manufacturing quality. Higher output would be advised for products that perform well in the quantity sold, but not to the point where there is an excess supply compared to the demand.
The last section is an examination of the peak sales times of the company. Saturday is excluded from the chart with minimal or no sales on that day. The data highlights Tuesdays and Thursdays as the days with the highest sales, although the exact reason or this pattern remains unclear. November emerges as the month with the highest sales figures. It is possible to precisely pinpoint the exact hour of the day when which sales peak. By coordinating the release of marketing tools with periods of peak purchase, sales are increased. Since this may optimize the impact of promotions and thus result in better sales, these times are crucial, and more focused marketing deployment techniques should be geared toward them.
These findings suggest that there is significant potential for the company’s revenue to increase. By implementing these insights, the company may expect to increase the scale of operations more sustainably, experience a significant and steady increase in earnings, and gain a better position both domestically and internationally. It is recommended to conduct further research utilizing more recent and comprehensive data from the company to ensure the accuracy and relevance of the findings. Additionally, implementing more effective data collection techniques, such as real-time monitoring systems or automated data extraction tools, could enhance the quality and timeliness of the data gathered for analysis.
4 CONCLUSION
Based on the analysis, it is clear that there is untapped potential for the current foreign commerce to grow, and the company can substantially increase its sales through targeted marketing initiatives. The following actionable insights can be derived from the analysis:
(1) Identify High-Potential Regions: Highlight regions with potential for high sales contribution based on the Pareto analysis. Allocate resources and focus marketing efforts on these regions to maximize returns.
(2) Leverage Peak Buying Days: capitalize on peak buying days, such as Tuesdays and Thursdays. Adopt marketing strategies to capitalize on the days when customers are most likely to make purchases.
(3) Optimize Sales Timing: Further, analyse the time of day when purchases are made to identify the peak buying hours. Align promotional offers and product launches with these peak hours to drive sales and maximise revenue.
(4) Explore Deep Learning Models: Further work on deep learning models for more advanced analysis of e-commerce data can be carried out[14-22]. These models can provide deeper insights into customer behavior, preferences, and purchase patterns, enabling more targeted marketing strategies and personalized customer experiences.
By implementing these recommendations, the company can enhance its market penetration, increase sales revenue, and strengthen its competitive position in the e-commerce landscape.
Acknowledgements
Not applicable.
Conflicts of Interest
The authors declared no conflict of interest.
Author Contribution
Ogundunmade TP was responsible for designing this study and writing this article. Adepoju AA was responsible for revising the paper for intellectual content. The authors approved the final version.
Abbreviation List
CDF, Cumulative distribution function
MSE, Mean Squared Error
PCA, Principal component analysis
R², Determination
RMSE, Root Mean Square Error
References
[1] Gabaix X. Zipf’s Law for Cities: An Explanation. Q J Econ, 1999; 114: 739-767.[DOI]
[2] Terviö M. The difference that CEOs make: An assignment model approach. Am Econ Rev, 2008; 98: 642-668.[DOI]
[3] Sunil S, Mahendira TPM. E-COMMERCE USER SEGMENTATION. 2nd intemational Conference on innovative Research in Engineering and Technology (ICIRET-22), Vietnam, 15-16 July 2022.
[4] Andra D, Baizal AB. E-commerce Recommender System Using PCA and K-Means Clustering. Jurnal RESTI, 2022; 6: 57-63.[DOI]
[5] Nainggolan R, Eviyanti P. The Cluster Analysis of Online Shop Product Reviews Using K-Means Clustering. Data Sci: J Comput Appl Inform, 2020; 4: 111-121.[DOI]
[6] Kusrini K. Grouping of Retail items by using K-Means clustering. Procedia Comput Sci, 2015; 72: 495-502.[DOI]
[7] Wu Z, Jin L, Zhao J et al. Research on segmenting e-commerce customer through an improved k-medoids clustering algorithm. Comput Intel Neurosc, 2022; 2022: 9930613.[DOI]
[8] Shaik I, Nittela SS, Hiwarkar T et al. K-means clustering algorithm based on E-commerce big data. Int J Innov Tech Explor Eng, 2019; 8: 1910-1914.[DOI]
[9] Vishal, Reddy VK. K-Means Clustering approach based intelligent customer segmentation to increase sales using customer purchase behavior data. Eur Chem Bull, 2023; 12: 4174-4182.
[10] Rezaeian A, Shokouhyar S, Dehghan F. Measuring Customers Satisfaction of E-Commerce Sites Using Clustering Techniques: Case Study of Nyazco Website. Int J Manage Account Econ, 2016; 3: 61-74.
[11] Zhang J, Wu J, Gao C. Consumption Behavior Analysis of E-commerce Users Based on K-means Algorithm. J Netw Intell, 2022; 7: 935-942.
[12] Lim T. K-Means Clustering-Based Market Basket Analysis: U.K. Online E-Commerce Retailer. 2021 International Conference on Information Technology (ICIT), Amman, Jordan, 14-15 July 2021.
[13] Tabianan K, Velu S, Ravi V. K-Means Clustering Approach for Intelligent Customer Segmentation Using Customer Purchase Behavior Data. Sustain, 2022; 14: 7243.[DOI]
[14] Ogundunmade TP, Abidoye M, Olunfunbi OM. Modelling Residential Housing Rent Price Using Machine Learning Models. Mod Econ Manag, 2023; 2: 14.[DOI]
[15] Ogundunmade TP, Daniel AO, Awwal AM. Modelling Infant Mortality Rate using Time Series Models. Int J Data Sci, 2023; 4: 107-115.[DOI]
[16] Ogundunmade TP, Adepoju AA. Introduction: Predicting the Nature of Terrorist Attacks in Nigeria Using Bayesian Neural Network Model. In: Sustainable Statistical and Data Science Methods and Practices. Springer, Cham, 2023; 271-286.[DOI]
[17] Ayansola OA, Ogundunmade TP, Adedamola AO. Modelling Willingness to Pay of Electricity Supply Using Machine Learning Approach. Mod Econ Manag, 2022; 1: 9.[DOI]
[18] Ogundunmade TP, Adepoju AA, Allam A. Stock price forecasting: Machine learning models with K-fold and repeated cross validation approaches. Mod Econ Manag, 2022; 1: 1.[DOI]
[19] Ogundunmade TP, Adepoju AA. The performance of artificial neural network using heterogeneous transfer functions. Int J Data Sci, 2021; 2: 92-103.[DOI]
[20] Adepoju AA, Ogundunmade TP. Economic Growth and its Determinant: A cross country Evidence. Stat Trans New Ser, 2019; 20: 69-84.[DOI]
[21] Ogundunmade TP, Adepoju AA, Allam A. Predicting crude oil price in Nigeria with machine learning models. Mod Econ Manag, 2022; 1: 4.[DOI]
[22] Ogundunmade TP, Adepoju AA. Modelling Liquefied Petroleum Gas Prices in Nigeria Using Time Series Machine Learning Models. Mod Econ Manag, 2022; 1: 5.[DOI]
Copyright © 2024 The Author(s). This open-access article is licensed under a Creative Commons Attribution 4.0 International License (https://creativecommons.org/licenses/by/4.0), which permits unrestricted use, sharing, adaptation, distribution, and reproduction in any medium, provided the original work is properly cited.


