Modelling Residential Housing Rent Price Using Machine Learning Models
Tayo P Ogundunmade1*, Muyiwa Abidoye1, Oladapo M Olunfunbi1
1Department of Statistics, University of Ibadan, Ibadan, Nigeria
*Correspondence to: Tayo P Ogundunmade, PhD, Department of Statistics, University of Ibadan, Oduduwa Road, Ibadan, Oyo 200132, Nigeria; Email: ogundunmadetayo@yahoo.com
DOI: 10.53964/mem.2023014
Abstract
Background: Providing shelter and security through housing is a basic need for people. However, the housing market is frequently troubled by issues such as exorbitant rent pricing and a lack of transparency, posing challenges for both landlords and home renters.
Objective: This study examines the factors affecting residential housing rent in Ibadan City to thoroughly investigate the cost-effectiveness of rents. We looked into a number of variables, including neighborhood characteristics, property size, amenities, and location, aiming to pinpoint the essential elements significantly impacting rental costs.
Methods: Data were collected from two well-known real estate websites, privateproperty.com and propertypro.com. We built a rent prediction model and determined key features using regression analysis utilizing Ordinary Least Squares (OLS), and the Extreme Gradient Boosting (XGBoost) algorithm. The analysis revealed several factors with notable relationships to rent prices.
Results: The five variables with the highest correlation coefficients were identified as duplex (0.54), toilet (0.34), detached (0.31), flat (-0.3), and bedroom (0.29), indicating their substantial influence on housing rental rates. Furthermore, the study highlights specific neighborhoods as either relatively expensive or budget-friendly in terms of median rent prices. Notably, Agodi and Kolapo Ishola emerged as the most expensive areas, surpassing the overall median rent by significant margins (454.55% and 450%, respectively). Conversely, Sanyo, Moniya, and Academy recorded the lowest median rent prices, being 50% lower than the overall median.
Conclusion: This study provides valuable insights into the intricate factors governing residential housing rent in Ibadan City, offering a foundation for further research and practical applications in the real estate domain.
Keywords: house rent, OLS, XGBoost regression model, algorithms, machine learning
1 INTRODUCTION
Housing is a fundamental necessity, providing individuals with essential shelter and security. However, the housing market is often plagued by issues such as inflated rent prices and a lack of transparency. These issues pose considerable challenges for both landlords and house hunters. Some agents tend to set rent prices at excessively high levels, divorcing them from prevailing market rates and the actual value of the properties. This practice creates a noticeable gap between the true worth of housing units and the amount tenants are obligated to pay. As a result, landlords face difficulties in renting out their properties, as they lack accurate information on the market price. Simultaneously, house hunters encounter challenges in finding housing options that offer genuine value for money amid inflated rent prices.
The existing literature on predicting house rents has witnessed a range of studies employing various methodologies. One such study conducted by Dokmeci et al.[1] focused on analyzing rent data in Istanbul, Turkey, using the hedonic regression approach. The findings indicated that external factors such as size, number of rooms, bathrooms, balconies, and housing unit type significantly influenced rent prices.
The term “rental housing” is defined as property owned by someone other than the resident or by a legal entity, for which the resident pays periodic rent to the owner. In “pure” rental housing schemes, there is no obligation for the owner to sell, nor is there an obligation for the resident to buy the occupied unit. It is simply a formal or informal agreement between a tenant and a landlord to rent a dwelling for a certain period of time at a predetermined price[2,3].
In recent years, there has been a growing trend in utilizing more advanced algorithms for rent prediction. Ming et al.[4] explored rent prices in Chengdu, China using the Extreme Gradient Boosting (XGBoost) algorithm. Li et al.[5] utilized the Light Gradient Boosting Model, a more efficient variation of XGBoost, for modeling rent prices in China. Expanding on this trajectory, Kumar[6] incorporated the Random Forest Regressor and Extra Tree Regressor in their research. Alongside these advanced algorithms, traditional linear regression models have remained prevalent in recent studies. Tomal[7] investigated rent prices in Ames, Iowa, United States, utilizing both linear regression and ridge regression models. Similarly, Babalola et al.[8] employed Ordinary Least Squares (OLS) regression to model rent prices in Cracow, Poland. Notably, Tomal utilized Spatial Autoregressive and Geographically Weighted Regression models to assess the spatial heterogeneity of parameters and autocorrelation of housing rent. The outcomes of these studies consistently highlighted a close relationship between rent prices and factors such as housing structure, location, and neighborhood characteristics. Also, several studies have also explored the determinants of house rent prices in different contexts. Sebsbe et al.[9] examined key determinants of house rent and identified variables such as age, life span of the house, tenement rate charges by the local government, and the number of houses built in the university environment as significant influences on house rent prices. In Hawassa city, the number of rooms, the total area occupied by the house, the dummy variable for transportation or taxi availability, the accessibility of hospitals or clinics, and the categorical variable for housing typology (i.e., the categorical variable for housing typology being private and condominium house) were found to be statistically significant and positively affect rental house prices[9,10].
Chiwuzie et al.[11] examined the mean rental growth rates across selected residential property categories spanning from 2002 to 2017. Their findings revealed no significant differences in the mean rental growth rates during this period. This study contributes valuable insights to our understanding of long-term trends and stability in rental growth rates, which are crucial for assessing the dynamics of the rental market. In another investigation, Ivy and Ernest[12] investigated the housing market around university areas, shedding light on the reasons for house construction and rental demand in such areas. Their findings indicated that houses are built for rent in university areas due to higher rental prices. Simultaneously, students prefer renting houses in these areas due to factors such as enhanced security, proximity to school, and the availability of essential infrastructure like water and power supply. Oluseyi et al.[13] in their research on factors determining residential rental prices in Ghana, highlighted that location characteristics and apartment characteristics such as the number of bedrooms, the availability of amenities (water and electricity supply), sharing of apartment facilities, and availability of facilities (toilet and bathroom) are statistically significant in determining rental charges. Additionally, Azadeh et al.[14] conducted research on economic analysis of the housing rental market in both formal and informal built areas of Port Moresby, Papua New Guinea. Their findings emphasized that the most important predictors of house rent in formal areas were the availability of recreation areas, access to infrastructure, and the shared use of the same bathroom and toilet by different families. Wu et al.[15] conducted a study on the determinants of the market value of residential properties in Ibadan metropolis, Nigeria. The findings revealed that the major determinant factors influencing the rental value of residential buildings in the study area are the number of toilets, the existence of a burglar alarm, and the condition of the buildings. Additionally, the type of building and the number of toilets were identified as major determinant factors influencing capital value. These studies collectively contribute to the understanding of rent prediction by exploring various modeling techniques and factors influencing rent prices. This exploration encompasses both traditional linear regression models and advanced algorithms. The primary objective of this study is to address the knowledge gap concerning the rental market in Ibadan, Nigeria. Despite numerous studies examining house rent prediction and factors impacting rental rates in diverse contexts, there is a noticeable scarcity of research focusing on the rental market dynamics in Ibadan.
Our study aims to bridge this gap by using both traditional regression analysis methods and machine learning models to construct a reliable price prediction model for the rental market in Ibadan. The objective is to develop a predictive model capable of accurately anticipating housing rent costs based on relevant criteria unique to Ibadan. This involves a combination of traditional regression analysis and cutting-edge machine learning methods. Additionally, our study endeavors to gain a comprehensive understanding of the crucial elements significantly influencing house rent rates in Ibadan. Our overarching goal is to pinpoint the key elements that influence rental costs, which may include elements such as location, property size, amenities, neighborhood characteristics, and other pertinent factors. By developing a predictive model, we aspire to offer useful insights into the Ibadan rental market, aiding landlords, tenants, decision-makers, and other stakeholders in making informed choices. This study contributes to the existing body of knowledge on housing affordability and market dynamics in the city by illuminating the factors influencing rental pricing in Ibadan. The subsequent sections of the paper are structured as follows: The study's material and methods are covered in Section 2, the results are covered in Section 3, and the study's conclusion is covered in Section 4.
2 MATERIALS AND METHODS
2.1 Profile of the Study Area
Ibadan, a vibrant city in Nigeria, is located in the southwestern part of the country. Situated in the southwestern region of Nigeria, Ibadan serves as the capital of Oyo State. It holds a significant position within the country, being the third-largest city by population and a major economic and cultural hub. With a rich history and diverse population, Ibadan with a population of 4,004,316 according to world population review.com boasts a unique blend of traditional and modern elements.
Geographically, Ibadan is located at latitude and longitude coordinates of 7.3775oN, 3.9470oE and sits at an elevation of 230m above sea level. The city spans various neighborhoods and districts, offering a diverse array of residential areas, commercial centers, and cultural landmarks. The rental housing market within the city encompasses a mix of private rental houses, government reserved areas, and luxury estates.
2.2 Data of the Study
The data for this research was collected through web scraping from two prominent real estate listing websites, namely https://propertypro.com and https://www.privateproperty.com.ng. Python modules such as Requests and Beautiful Soup were used to carry out the website scraping. The pages of the websites were accessed during the scraping process, and the raw data was extracted and saved in a structured way. To enhance transparency and reproducibility in the data collection process, the whole web scraper created for this purpose has been openly shared on the GitHub repository at https://github.com/Muyiiwaa/Ibadan-Rent-prediction-app/blob/master/privateprop.ipynb.
Following the data acquisition phase, a thorough cleaning and structuring process was implemented. Python libraries, including NumPy and pandas, were employed to address data cleaning tasks. Issues such as missing values, outliers, and inconsistent data entries were systematically handled to ensure the quality and integrity of the dataset. These cleaning and structuring procedures played a crucial role in establishing a reliable and standardized dataset for further analysis and modeling stages in this research. By utilizing web scraping techniques and employing Python libraries for data collection, cleaning, and structuring, this study adopted a systematic and efficient approach to obtain a comprehensive dataset for the analysis of rental prices in Ibadan city.
The data collected from these websites underwent a comprehensive process of cleaning, structuring, and analysis, employing both descriptive and inferential statistical methodologies. The rent prediction model was developed based on well-established machine learning algorithms. Descriptive methods are used to change the raw data into meaningful information, facilitating a clearer understanding and interpretation of the study. These methods encompassed various statistical measures such as frequency, percentages, mean, standard deviations, as well as maximum and minimum values. Moreover, the study used tables and charts, created using popular Python libraries like Plotly and Seaborn, as an effective means of presenting the data. This approach not only enhanced the clarity of the findings but also contributed to a more accessible interpretation of the study results.
2.3 Methodology
Regression analysis was employed to elucidate the relationship between the features or independent variables and the outcome or dependent variable. In this study, the house rent price served as the outcome variable, with location, house type, and amenities utilized as the features. The study employed OLS regression and the popular machine learning model; XGBoost regressor to build a price prediction model.
2.3.1 OLS Regression
OLS is a fundamental approach in econometrics and statistics for estimating the parameters of a linear regression model. Its core objective is to identify the best-fitting line, represented by coefficients, that minimizes the sum of squared differences between the observed dependent variable (rent prices) and the values predicted by the linear model. The mathematical formulation of OLS begins with a linear regression model defined as follows:
|
Where:
- yi represents the dependent variable, i.e., the housing rent price for the ith observation.
- β0 is the intercept.
- β1, β2, ..., βn are the coefficients of the independent variables. These coefficients indicate the impact of each independent variable on yi.
- X1, X2, Xn are the independent variables that potentially influence the housing rent price.
- Ɛi represents the error term, accounting for the difference between the observed yi and the predicted value based on the regression model.
The goal of OLS is to estimate the values of the coefficients (β0, β1, β2 ..., βn) that minimize the sum of squared errors. Solving the above system yields the estimates for β0, β1, β2 ..., βn, which provide the best linear fit for the data and represent the relationship between the independent variables and the dependent variable.
2.3.2 XGBoost Model
XGBoost is an advanced machine learning algorithm renowned for its efficacy in regression and classification tasks. Belonging to the family of gradient boosting methods, XGBoost is known for its high predictive performance and ability to handle complex datasets. The algorithm constructs a predictive model by iteratively combining multiple weak predictive models, known as decision trees, to form a robust ensemble model. The algorithm optimizes an objective function by minimizing the sum of the loss function and a regularization term, thereby mitigating both bias and variance in the final model. Mathematically, XGBoost can be represented as:
|
Where:
- Ŷ represents the predicted value of the dependent variable.
- Σᵢ denotes the summation over all individual decision trees (weak learners).
- Fᵢ(x) represents the prediction of the ith decision tree for the given input variables x.
Each decision tree in XGBoost is constructed sequentially, with subsequent trees learning from the errors (residuals) of the previous ones. This iterative approach allows the model to focus on the patterns that were not effectively captured by earlier trees, leading to improved overall performance. XGBoost incorporates several techniques to enhance its predictive power, including regularization, gradient-based optimization, and tree pruning. These techniques collectively help prevent over-fitting, increase model robustness, and improve generalization to unseen data. To estimate the parameters of the XGBoost model, a specific loss function is minimized during the training process. For regression tasks, mean squared error is commonly used, while log loss is employed for classification tasks. Additionally, hyperparameters such as the learning rate, maximum depth of the trees, and regularization parameters can be tuned to optimize the model's performance. XGBoost has gained popularity due to its ability to handle large datasets, handle missing values, and automatically handle feature selection. It has become a widely used tool in various domains, including finance, healthcare, and natural language processing. Implementation of the XGBoost model can be done using programming languages such as Python, R, or Scala, with dedicated libraries like XGBoost or scikit-learn providing convenient functions for training, evaluating, and fine-tuning XGBoost models. In summary, XGBoost is a powerful and versatile machine learning algorithm that leverages ensemble methods to deliver accurate predictions. Its ability to handle complex relationships and large-scale datasets makes it a valuable tool for a wide range of predictive modeling tasks.
3 RESULTS
Of the 2,527 houses scraped from both websites, approximately 97.5% (2,465) were deemed usable for analysis, with about 2.5% excluded due to issues such as duplicates or missing important features due to the complexity of the website design. Consequently, the analyses were conducted based on 2,465 observations, all of which were apartments ranging from bungalows, flats, duplexes, and mansions. The findings revealed that the median house price in Ibadan sits at 550,000 naira. However, there is a significant variation in prices from street to street, underscoring the pivotal role of location in determining rent prices. Notably, Agodi and Kolapo Ishola are the most expensive neighborhoods, boasting median rent prices of 2.5 million and 2.2 million naira, respectively. These figures surpass the overall median by approximately 454.55% and 450%, highlighting the considerable disparity in rental costs across different neighborhoods. Figure 1 shows the box plot of house rent prices for the considered locations in Ibadan, Oyo State.
|
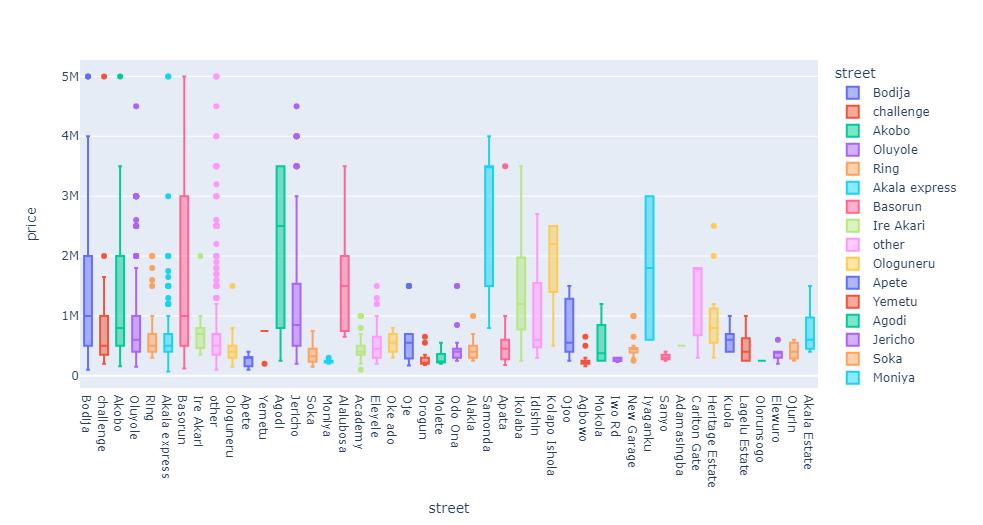
Figure 1. Box-plot of house rent price in Ibadan.
Akala Express (416), Oluyole (348) and Akobo (282) have the highest number of apartments accounting for 16.86%, 14.10%, and 11.43% of the total listings, respectively. To visually represent the house rent prices, a bar plot is presented in Figure 2.
|
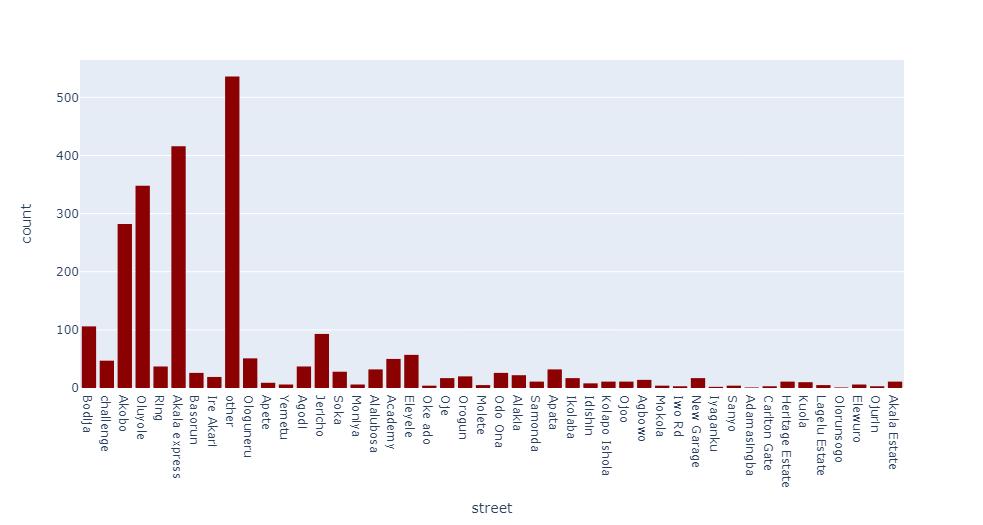
Figure 2. Bar plot of house rent price in Ibadan.
The descriptive statistics of the rental property data reveal interesting insights into key variables, as presented in Table 1. The dataset's mean rent price is approximately 842,762, exhibiting a standard deviation of 809,825, indicating a considerable degree of variability in rental prices. Furthermore, the average number of bedrooms in the rental properties is approximately 1.93, with a standard deviation of 1.31, suggesting that the majority of properties have fewer than two bedrooms on average. Similarly, the mean number of bathrooms is approximately 1.17, with a standard deviation of 1.44, indicating a range of bathroom configurations across the properties. Additionally, the dataset indicates an average of 1.37 toilets per rental property, with a standard deviation of 1.68, suggesting variation in the number of toilets available in the properties. These descriptive statistics provide initial insights into the rental market, highlighting the average rent prices and the distribution of key property features such as bedrooms, bathrooms, and toilets. A comprehensive understanding of these summary statistics is crucial for gaining insights into the overall landscape of the rental market under investigation.
Table 1. Descriptive Statistics
Descriptive |
Price |
Bedroom |
Bathroom |
Toilet |
Count |
2,465.00 |
2,424.00 |
2,423.00 |
2,425.00 |
Mean |
842,762.28 |
1.94 |
1.18 |
1.38 |
Std |
809,825.04 |
1.31 |
1.45 |
1.68 |
Min |
70,000.00 |
0.00 |
0.00 |
0.00 |
25% |
400,000.00 |
1.00 |
0.00 |
0.00 |
50% |
550,000.00 |
2.00 |
0.00 |
0.00 |
75% |
900,000.00 |
3.00 |
2.00 |
3.00 |
Max |
5,000,000.00 |
9.00 |
8.00 |
8.00 |
3.1 Machine Learning Models and OLS Regression Model
In this section, we present the results of the OLS and the XGBoost model using the household rent data collected. Tables 2-4 showcase the results for the OLS regression model, XGBoost model, and the comparison between the two models. Table 4 provides an overview of the performance of individual models, including a comparison of the evaluation metrics for each model.
Table 2. OLS Regression Model (Dependent Variable = Price)
Metric |
Value |
R-squared |
0.551 |
F-Statistic |
3.66 |
Prob (F-statistic) |
0.00 |
Log-Likelihood |
-35,340 |
AIC |
7.081e+04 |
BIC |
7.120e+04 |
Df Residuals |
2,351 |
Df Model |
66 |
No. Observations |
2,418 |
Omnibus: 167.201 |
Durbin-Watson: 1.921 |
Prob(Omnibus): 0.000 |
Jarque-Bera (JB): 579.461 |
Skew: 0.282 |
Prob(JB): 1.48e-126 |
Kurtosis: 5.331 |
Cond. No. 209 |
Table 3. XGBoost Model Performance
Rsq Score |
Root Mean Squared Error (RMSE) |
Root Mean Squared Logarithmic Error (RMSLE) |
0.65 |
0.3765 |
0.47 |
Table 4. Model Comparison
s/n |
Model |
Rsq Score |
Adjusted Rsq Score |
RMSE |
1 |
XGBoost |
0.66 |
0.639 |
0.3765 |
2 |
Linear Regression |
0.551 |
0.538 |
0.52 |
Table 5 shows the top 10 important features contributing to house prices as shown by the XGBoost model.
Table 5. Feature Importance
s/n |
Feature |
Importance |
1 |
Duplex (House type) |
0.185018 |
2 |
Self contain (House Type) |
0.076984 |
3 |
Toilet (Amenity) |
0.064526 |
4 |
Kolapo Ishola (Location) |
0.056875 |
5 |
Jericho (Location) |
0.040586 |
6 |
Bedrooms (Amenity) |
0.034082 |
7 |
Apata (Location) |
0.031436 |
8 |
Bashorun (Location) |
0.029797 |
9 |
Alakia (Location) |
0.028890 |
10 |
Agodi (Location) |
0.026781 |
4 DISCUSSION
The OLS regression model demonstrated moderate predictive ability, as indicated by the R-squared value of 0.551, implying that approximately 55.1% of the variance in rent prices can be explained by the included independent variables (Table 2). The adjusted R-squared value of 0.538 further points to the strength of the model's goodness of fit, considering the number of independent variables. The overall significance of the model was established by the F-statistic (43.66), with a P-value of 0.00, indicating that at least one independent variable significantly influenced rent prices.
However, caution is warranted regarding the normality of residuals, as suggested by the significant Omnibus test (Prob(Omnibus) = 0.000), possibly implying deviations from the normal distribution. Additionally, the model's diagnostic test for autocorrelation, the Durbin-Watson statistic (1.954), indicated no significant autocorrelation in the residuals. The correlation analysis revealed that several factors exhibit a notable association with rent prices. The five variables with the highest correlation coefficients were identified as duplex (0.54), toilet (0.34), detached (0.31), flat (-0.3), and bedroom (0.29), indicating their substantial influence on housing rental rates. To enhance the model's accuracy and reliability, further examination and validation of the normality assumptions and the presence of non-random patterns in the data are conducted. Addressing these issues will contribute to the robustness of the findings and strengthen the model's ability to predict rent prices accurately.
XGBoost demonstrated strong predictive performance in estimating house rent prices, as evidenced by the achieved R2 score of 0.65 in Table 3. The RMSE of 0.3765 and RMSLE of 0.47 further validate the model's accuracy. The successful outcome was obtained through a meticulous process of hyperparameter optimization, enabling the XGBoost model to capture the intricate relationships within the data and produce reliable predictions. Notably, the presence of considerable outliers in the rent prices necessitated the application of a log transformation, enhancing the model's ability to handle extreme values and improving overall performance. Table 4 shows the comparison result between the regression analysis and the XGBoost model. The result shows that the XGBoost model captures the data better with higher R-square and Adjusted R-square values, with a lower root mean square error value compared to that of the OLS[16].
Furthermore, the analysis revealed key features that significantly influence house rent prices. Notably, the type of house (e.g., duplex, self-contained) emerged as a top important factor, as seen in Table 5. Additionally, the presence of a toilet and the location of the house were identified as crucial features in determining rent prices. These findings underscore the importance of property characteristics and location in shaping rental values in the studied market. The XGBoost model, with its robust performance and ability to capture important features, contributes to the understanding and prediction of house rent prices[17]. Table 5 shows the top 10 important features contributing to house prices as indicated by the model.
5 CONCLUSION
In conclusion, factors such as the type of house (e.g., duplex, self-contained), the presence of a toilet, the location, the number of bedrooms, and whether or not the house is a flat have the most significant impact on house rent prices. Among the most influential locations are Kolapo Ishola, Jericho, Apata Alakia, Agodi, Bodija, Ologuneru, Apata, and Agodi, which are the most expensive neighborhoods. While Sanyo, Moniya, and Academy have the lowest rent prices, with median rent prices below 200,000, 50% less than the overall median rent price. In essence, for buyers with budget constraints, considering a house with a small number of bedrooms in these areas is advisable. Choosing a furnished house can also help buyers save costs, eliminating the need for additional spending on furnishings. Regarding rent price model building, the XGBoost model, with its robust performance and ability to capture important features, contributes significantly to understanding and predicting house rent prices. The insights derived from this analysis provide valuable guidance for landlords, tenants, and policymakers, enabling them to make informed decisions. For future research, the consideration of other deep learning models, as explored in works like Ayansola et al.[18], Ogundunmade and Adepoju[19,20], could provide further insights into house rent price.
Acknowledgements
Not applicable.
Conflicts of Interest
The authors declared no conflict of interest.
Author Contribution
Ogundunmade TP contributed to the conceptualization and methodology, while Abidoye M and Oluwafunbi OM authored the manuscript.
Abbreviation List
OLS, Ordinary Least Squares
RMSE, Root mean squared error
RMSLE, Root mean squared logarithmic error
XGBoost, Extreme Gradient Boosting
References
[1] Dokmeci V, Abay C, Nasiroglu S. Rent hedonic analysis in Istanbul. J Real Estate Res, 2003; 25: 83-104.
[2] Peppercorn L, Taffin E. Rental housing: A growing share of the housing market. Statistique Canada, 2013; 75: 12-19.
[3] Tomal M. Modelling Housing Rents Using Spatial Autoregressive Geographically Weighted Regression: A Case Study in Cracow, Poland. Int J Geo-Inf, 2020; 9: 346.[DOI]
[4] Ming Y, Zhang J, Qi J et al. Prediction and Analysis of Chengdu Housing Rent Based on XGBoost Algorithm. Proceedings of the 2020 3rd International Conference on Big Data Technologies, 2020; 1-5.[DOI]
[5] Li DK, Mei CL,Wang N. Tests for spatial dependence and heterogeneity in spatially autoregressive varying coefficient models with application to Boston house price analysis. Reg Sci Urban Econ, 2019; 79: 103470.[DOI]
[6] Kumar A. House Rent Price Prediction. Int Res J Eng Technol, 2019; 6: 3188-3191.
[7] Tomal MA. Housing rent and its determinants in Cracow, Poland. Geogr Pol, 2020; 93: 317-333.
[8] Babalola S, Umar AI, Sulaiman LA. Determinants of residential house rent price in Nigeria: Evidence from Ilorin, Kwara State. Res J Financ Acc, 2013; 4: 23-32.
[9] Sebsbe MT, Teshale DD, Asefa SB. Determinants of rental house price in Hawassa city, Ethiopia. J Land Manage A, 2017; 1: 35-49.
[10] Suárez-Vega R, Hernández JM. Selecting Prices Determinants and Including Spatial Effects in Peer-to-Peer Accommodation. Isprs Int J Geo-Inf, 2020; 9: 259.[DOI]
[11] Chiwuzie A, Aiyepada EG, Prince EM et al. Mean rental growth rates across selected residential property categories: A case study of Lagos, Nigeria. J Build Perform, 2019; 10: 12-24.
[12] Ivy A, Ernest O. Factors determining residential rental prices in Ghana. J Emerging Trends Econ Manag Sci, 2013; 4: 227-235.
[13] Oluseyi AS, Adebowale AR, Akinyemi FO. Determinants of market value of residential properties in Ibadan metropolis, Nigeria. Int J Acad Res Bus Soc Sci, 2017; 7: 143-161.
[14] Azadeh A, Moghaddam M, Khakzad M et al. A flexible neural network-fuzzy mathematical programming algorithm for improvement of oil price estimation and forecasting. Comput Ind Eng, 2012; 62: 421-430.[DOI]
[15] Wu B, Wang L, Lv SX et al. Effective crude oil price forecasting using new text-based and big-data-driven model. Measurement, 2021; 168: 108468.[DOI]
[16] Xie Y, Xiang W, Ji M et al. An Application and analysis of Forecast Housing Rental Based on Xgboost and LightGBM Algorithms. Comput Appl Software, 2019.
[17] Gong H. Empirical research on the prediction model of second-hand housing price in wuhan based on XGBoost algorithm. Huazhong U Sci Technol, 2018.
[18] Ayansola OA, Ogundunmade TP, Adedamola AO. Modelling Willingness to Pay of Electricity Supply Using Machine Learning Approach. Mod Econ Manag, 2022; 1: 9.[DOI]
[19] Ogundunmade TP, Adepoju AA. The Performance of Artificial Neural Network Using Heterogeneous Transfer Functions. Int J Data Sci, 2021; 2: 92-103.[DOI]
[20] Ogundunmade TP, Adepoju AA, Allam A. Predicting crude oil price in Nigeria with machine learning models. Mod Econ Manag, 2022; 1: 4.[DOI]
Copyright © 2023 The Author(s). This open-access article is licensed under a Creative Commons Attribution 4.0 International License (https://creativecommons.org/licenses/by/4.0), which permits unrestricted use, sharing, adaptation, distribution, and reproduction in any medium, provided the original work is properly cited.


