Liquidity Risk Management Practices and Profitability of Banking Firms in Nigeria
Wofuru-Nyenke Oroma King1, Marshal Iwedi2*
1Department of Accountancy, Faculty of Management Sciences, Rivers State University, Port Harcourt, Rivers State, Nigeria
2Department of Banking and Finance, Faculty of Management Sciences, Rivers State University, Port Harcourt, Rivers State, Nigeria
*Correspondence to: Marshal Iwedi, PhD, Lecturer, Department of Banking and Finance, Faculty of Management Sciences, Rivers State University, Nkpolu-Oroworukwo. P. M. B. 5060, Port Harcourt, Rivers State, Nigeria; Email: marshal.iwedi@ust.edu.ng
DOI: 10.53964/mem.2023010
Abstract
Methods: The study employed financial time series methodology and based on the results of the descriptive analysis and augmented Dickey-Fuller unit root tests for stationarity, the authors employ the Johansen co-integration test to establish the long-run effect of liquidity risk management practices alongside other control factors on profitability of banking firms in Nigeria. The study also examines the short-run relationship between liquidity risk management practices and profitability by estimating the ordinary least square.
Results: Based on the result of the descriptive statistics, it is evident that there is a positive relationship between the variations in the mean of the net profit for each of the banks. This result indicates that most of the banks recorded a profit for the year under review. The econometric results show that the current ratio of the banks was within the range of 1.74 to 2.49 indicating that most of the banks under study are well within the desired range and not overstretched as they may not meet the demand of their depositors for withdrawals in the near future. The coefficient of cash ratio in the random effect model is statistically insignificant which indicate that its impact is negligible on the profit margin of the commercial banks. With an R-square value of 0.66, it can be concluded that 66% of the variation in the dependent variable is explained by the independent variables used in the model. The coefficients of the current ratio and cash ratio were statistically insignificant and negatively related to net profits of the banks, this result implies that current and cash ratios have a limited impact on net profits.
Conclusion: In conclusion, most Nigerian commercial banks have adequate financial resources to meet their current liabilities this is because they are well capitalized.
Keywords: liquidity management, cash ratio, current ratio, profitability, commercial banks, financial stability
1 INTRODUCTION
Profitability is one of the two established indicators used to evaluate bank performance in Nigeria. Shareholders find profitability pleasing as it directly affects their financial interests. However, several factors impact this performance metric, including monetary policy measures, provisions for bad loans and doubtful debts, interest rates, exchange rates, liquidity risk, prudential requirements such as the liquidity ratio, and open market operations[1]. In the past, return on assets and return on capital employed were commonly used to assess profitability. However, these measures are no longer sufficient in evaluating bank performance because they fail to meet the requirements of stakeholders beyond shareholders[2]. In contrast, liquidity risk management emerges as a fundamental and essential component of banks' operations. Insufficient liquidity poses an immediate and significant threat to a bank's ability to fulfill its short-term maturing obligations. The essence of liquidity-risk management lies in ensuring a bank's ongoing capability to carry out the fundamental function of converting liquid deposit liabilities into illiquid assets, such as loans. It is precisely this transformation process that renders banks inherently susceptible to liquidity risk. Bank liquidity, as defined, pertains to the bank's capacity to finance expansions in assets and fulfill obligations as they arise, all while avoiding unacceptable losses. This definition underscores the critical importance of maintaining a robust liquidity position that enables a bank to meet its financial commitments promptly, without exposing itself to excessive risks or incurring substantial losses. By effectively managing liquidity risk, banks can safeguard their financial stability and ensure their continued ability to function as intermediaries in the economy. The goal of liquidity-risk management is to strike a delicate balance between maintaining an adequate level of liquid assets to honor obligations and maximizing the utilization of available funds to generate returns. Achieving this equilibrium is vital for banks to navigate potential liquidity shocks or adverse market conditions, ultimately safeguarding their ability to support economic growth and maintain the overall stability of the financial system[3].
Over time, Nigerian banks have faced repeated instances of failure primarily caused by severe liquidity risks, notably during the 2009 wave of bank failures in Nigeria. This collapse occurred following a collaborative investigation by the Central Bank of Nigeria (CBN) and the Nigerian Deposit Insurance Corporation into the financial records of 25 banks operating within the country at that time[4]. The results of the investigation unveiled that the financial institutions were in a state of technical insolvency due to insufficient capital, inadequate management of credit risk, liquidity issues, and lack of proper corporate governance[5]. The Basel Committee for Banking Supervision (BCBS) has presented a principle for sound liquidity risk management which aim to promote sound liquidity risk management practices in banks and ensure that they have sufficient liquidity to withstand various stress events. By implementing these principles, banks can enhance their resilience to liquidity shocks and contribute to the stability of the financial system.
The CBN oversees the banking sector in Nigeria, ensuring compliance with the BCBS principles. In accordance with these principles, banks are required to effectively handle liquidity and funding risks. To establish a baseline for supervision, the CBN has provided guidelines on managing liquidity risk. These guidelines outline the minimum expectations that banks must meet in order to adequately manage their liquidity and funding risk. Within the bank, its management is saddled with the responsibility of liquidity management and may fix or set their own standards based on their liquidity risk management capabilities, experiences and profile in cognizance of the prevailing policies in the industry and the global industry at large. Despite that these principles and standards exist at various levels in the Nigeria banking industry, frequent failures of banks have proved that banks have not set up a robust and effective liquidity risk management system. As pointed out earlier, management of banks are saddled with this responsibility and in performing their key functions of planning, controlling, evaluating among others, banks should subject themselves to these standards but instead somehow, they have become carefree. Senior management should develop a strategy, policies and practices to manage liquidity risk in accordance with the risk tolerance and to ensure that the banks maintain sufficient liquidity. It is based on this; the study was carried out to know if Nigeria banks will achieve enhanced profitability through sound, robust and effective liquidity risk management practices.
2 LITERATURE REVIEW
2.1 Theoretical Foundation
The study is underpinned by Liquidity preference theory. Liquidity demand is the desire for money as liquidity. This concept was initially formulated by John Maynard Keynes in his book "The General Theory of Employment, Interest and Money" (1936) to elucidate how the interest rate is determined by the supply and demand for money. The demand for money as an asset is posited to hinge on the potential interest foregone by holding bonds (here, "bonds" can be understood to encompass stocks and other relatively illiquid assets, including government bonds). Keynes argues that interest rates cannot simply be a reward for saving, as an individual who hoards savings in cash, such as under a mattress, would not receive any interest, despite refraining from fully consuming their current income. Instead, in the Keynesian analysis, interest serves as a reward for relinquishing liquidity. According to Keynes, money holds the highest degree of liquidity among assets, with liquidity denoting a characteristic of an asset. The ease and speed with which an asset can be converted into money determines its liquidity. Keynes identifies three motives governing the demand for liquidity: (1) The transaction motive: Individuals prefer to maintain liquidity to facilitate essential transactions, especially when their income is not consistently available. The amount of liquidity demanded is contingent on income levels: higher income necessitates a greater demand for money to support increased spending. (2) The precautionary motive: Individuals desire liquidity to address unexpected social issues that require expenditures beyond the ordinary. The demand for money for this purpose expands as income rises. (3) The speculative motive: Individuals hold onto liquidity in anticipation of declining bond prices. When the interest rate decreases, there is an increased demand for money to hold until the interest rate rises again, resulting in a decrease in the price of existing bonds to align their yield with the interest rate. Consequently, the lower the interest rate, the higher the demand for money (and vice versa).
2.2 Empirical Review
Toby[6] investigated monetary policy target bank liquidity management practice in Nigeria. The empirical work shows that liquidity management practices of Nigerian banks have been at variance with monetary policy targets in times of deregulation. The evidence confirms that a reduction in the cash reserve requirement necessitated an increase in average bank liquidity and a paradoxical fall in credit to the economy. Owolabi et al.[7] carried out a study that explored the correlation between liquidity and profitability in 15 chosen publicly traded firms in Nigeria. The main aim was to assess the characteristics and magnitude of this connection.
Botoe[8] sought to determine the influence of liquidity on commercial banks' profitability in Liberia. Utilized correlation design in this research, which involved surveying all 8 commercial banks in Liberia for the period 2006-2011. Extracted liquidity data from published financial statements of the banks. Analyzed the effect of liquid asset holdings on the profitability of commercial banks in Liberia. Banks that effectively monitored their cash, accounts receivables, and inventories experienced increased profitability. Empirical findings indicate a negative impact of concentration on bank profitability, although the effect is relatively insignificant.
Ibe[9] in order to gain insights into the overall state of the banking industry in Nigeria, a thorough analysis was conducted by randomly selecting three banks to represent the entire sector. The focus of this study was primarily on liquidity management, as it plays a pivotal role in the financial stability and success of banks. To assess liquidity management, various indicators were utilized as proxies. These included cash and short-term funds, bank balances, and treasury bills and certificates. These metrics provide an accurate representation of a bank's ability to meet its short-term obligations and manage its overall liquidity position. In addition to liquidity management, the study also aimed to evaluate the profitability of the selected banks. Profit after tax was chosen as the primary proxy for profitability, as it reflects the net income generated by the banks after tax expenses. To analyze the association between liquidity management and profitability, a stationary test model was employed. This model enabled researchers to determine whether the variables under study exhibited any long-term patterns or trends. Furthermore, regression analysis was utilized to test the hypothesis and identify any causal relationships between liquidity management and profitability. The results of this comprehensive study have conclusively demonstrated the critical importance of liquidity management in the Nigerian banking industry. The findings highlight the direct impact of efficient liquidity management on the overall profitability of banks. Adequate management of cash and short-term funds, bank balances, and treasury bills and certificates is essential for ensuring smooth operations, meeting obligations, and maximizing profitability. An empirical examination was conducted by Durrah et al.[10] to analyze the impact of efficient liquidity management on banking performance in Nigeria. The results unequivocally demonstrate a substantial relationship between efficient liquidity management and banking performance. It is evident that effective liquidity management significantly contributes to the overall soundness of a bank[11]. Conducted a study on the correlation between liquidity risk management and financial returns of Kenyan commercial banks from 2010 to 2013. Forty-three listed commercial banks were included in the study. Descriptive study design was employed to analyze the relationship between the variables. The findings indicate that managing liquidity risk has a detrimental impact on the financial performance of commercial banks[12]. Examined liquidity management in commercial banks profitability: First bank in Lagos, Nigeria. The result of the study indicates that there is significant relationship between liquidity and profitability. That means profitability in commercial banks is significantly influenced by liquidity and vice versa[13]. Examined the correlation between liquidity management and financial performance of commercial banks in Rwanda. Fourteen commercial banks were chosen at random to investigate the relationship between liquidity management and financial returns in Rwanda. The research determined that commercial banks in Rwanda would experience lower returns if they held a greater proportion of liquid assets in comparison to their total assets, with a significant effect at 5%[14].
In a study, the effects of risk management (credit and liquidity) on the financial performance of money deposit banks in Nigeria were examined. Panel methodology and other econometric techniques, including Hausman test and descriptive statistics, were utilized in the study. The findings from the panel regression indicate a favorable association between risk management and the financial performance of money deposit banks. The results of the study conducted by Mwashi and Miroga[15] on the influence of liquidity management on the profitability of deposit taking SACCOs in Kakamega County revealed some interesting findings. It was found that liquidity risk management practices, liquidity decision-making, and liquidity monitoring and cash management practices significantly influence the profitability of these SACCOs. One significant finding was that liquidity management practices accounted for a significant variance of 66.3% in the profitability of deposit taking SACCOs. This suggests that effective liquidity management strategies play a crucial role in determining the profitability of these SACCOs in Kakamega County. It is worth noting that the R square value of 0.663 indicates that 66.3% of the profitability can be explained by the liquidity management practices studied. Additionally, the fact that the p-value is 0.000 suggests that the relationship between liquidity management and profitability is statistically significant[16]. Examine liquidity risk management as determinant of financial performance of deposit money banks in Nigeria. The empirical result of the research indicates a significant positive relationship between liquidity risk management and financial performance of listed banks in Nigeria. The study also indicates that credit risk management has a negative but insignificant influence on the level of profitability.
3 METHODOLOGY
This paper adopted the panel econometric methodology. The ordinary least square method was employed for estimation of the relationships between the predictor variable and the criterion variables. Unit root test was conducted using the Augmented Dickey Fuller to ascertain the stationary property of the time series. To prevent spurious regression, this procedure is implemented. Additionally, a co-integration test was conducted to ascertain the significance of the model by examining the existence of a long-run equilibrium relationship among the variables. Furthermore, a panel regression model was utilized to capture short-run relationships.
3.1 Population and Sample Size
The population of the study comprises of all the commercial banks in Nigeria. There are currently 24 commercial banks registered with the CBN, They are shown in Table 1.
Table 1. List of Registered and Licensed Commercial Bank in Nigeria
Number |
Bank |
1 |
Access Bank Plc |
2 |
Citibank Nigeria Limited |
3 |
Ecobank Nigeria Plc |
4 |
Fidelity Bank Plc |
5 |
First Bank Nigeria Limited |
6 |
First City Monument Bank |
7 |
Globus Bank Limited |
8 |
Guaranty Trust Bank Plc |
9 |
Heritage Banking Company Ltd. |
10 |
Keystone Bank Limited |
11 |
Parallex Bank Ltd. |
12 |
Polaris Bank Plc |
13 |
Premium Trust Bank |
14 |
Providus Bank |
15 |
Stanbic IBTC Bank Plc |
16 |
Standard Chartered Bank Nigeria Ltd. |
17 |
Sterling Bank Plc |
18 |
Sun Trust Bank Nigeria Ltd. |
19 |
Titan Trust Bank Ltd. |
20 |
Union Bank of Nigeria Plc |
21 |
United Bank for Africa Plc |
22 |
Unity Bank Plc |
23 |
Wema Bank Plc |
24 |
Zenith Bank Plc |
Notes: Source: (CBN 2021).
The sample size was determined using Taro Yamani model for objectively deciding a sample size for a study. Taro Yamani model is a model used to determine a sample size that will represent the whole population of study. The formula is defined:
|
Where:
n = Sample
N = Total population of the area under study
1 = Constant
e = Error unit or margin of error at 0.4
Using this formula; N = 22 representing the registered banks in Nigeria
|
10 banks out of 24 were randomly selected for the basis of this study.
3.2 Data
The secondary data were extracted from annual financial reports of selected commercial banks for the period of 10 years from 2012 to 2021. The financial report was published and obtained from the Nigerian Exchange Group factsheet. Information on annual net profits, total assets, total deposits, total liabilities, equity and total income were collected and the notes to the accounts were also considered for pertinent information.
3.3 Model Specification
In order to achieve the objectives of this study and test the hypothesis, a functional relationship in form of multiple linear regression models was formulated. The baseline regression model is presented as follows:
|
When Equation (3) is transformed into an econometric equation, we have the pooled effect model fixed effect and random effect models as follows:
Pooled effect model specification
|
Fixed effect model
|
Random effect model
|
Where:
NEP = Net Profit
CUR = Current Ratio
CAR = Cash Ratio
ε1it= Stochastic or disturbance / Error term
t = Time dimension of the variable
β1-β2 = Slope of regression model
α0 = Constant or intercept
4 REDULTS AND DISCUSSION
4.1 Trend Analysis of Cash Ratio, Current Ratio and Return on Assets of Banking Firms in Nigeria
Figure 1 show the trend of the cash ratio of the 10 selected banks, Stanbic IBTC, First Bank of Nigeria, FCMB, Union Bank and Wema Bank records significant cash ratios. Their cash ratio range from a minimum of 9% to a maximum of 30% while their net profit ranges from a minimum of less than 266 million to maximum of 13 billion. These parameters show that the higher the profit is, the lower is the cash ratio and vice versa. Thus it can be inferred that these companies are not doing a good job of managing their cash and this could lead to financial instability in their operations.
|
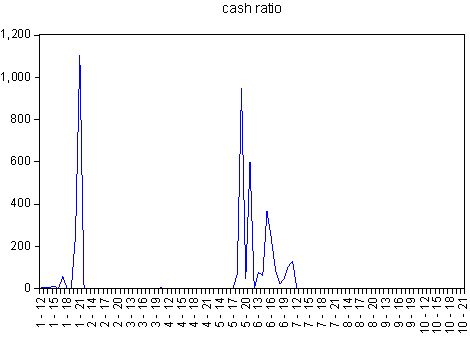
Figure 1. Trend of cash ratio.
From Figure 2 the net profit of Access Bank, Fidelity Bank, First Bank Nigeria, FCMB, Union Bank and Wema Bank are significant while for Stanbic IBTC and Zenith Bank, the trends are not significant. The non-significant trend indicates that both companies posted profits at a lower rate as compared to their peers which signifies a poor performance on their part. The high net profits of these companies imply that they have the capacity to pay dividends to their shareholders thus leading to improved returns on their capital investments.
|
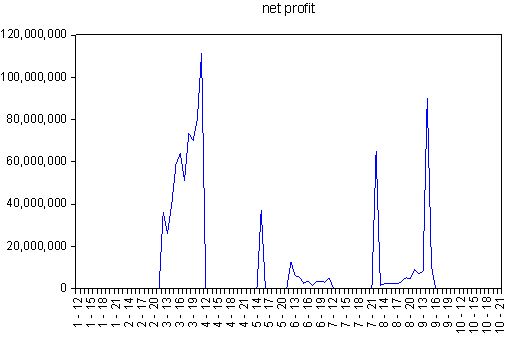
Figure 2. Trend of net profit.
The trend of current ratio is an important indicator for understanding a bank's ability to pay its debts and stay afloat. The trend of current ratio measures how much money a bank has available to pay its debts in relation to the amount of current liabilities. Figure 3 presents the trend of current ratio, Stanbic IBTC, First Bank of Nigeria, FCMB and Union Banks have stronger current ratio compare to the other banks studied. A high current ratio suggests that a bank can pay its debts 3 times over. A lower current ratio means that the bank has less than three times' worth of funds to cover its current liabilities. The bank that has a high current ratio is more likely to survive in the long-run than a bank with a weak current ratio. A high current ratio could indicate that the firm is inefficiently using its resources, has poor liquidity management or is under a lot of financial pressure. As a result, the bank may be unable to meet its financial obligations if it encounters any financial difficulties in the future. However, a high current ratio does not necessarily mean that the bank is healthy and stable.
|

Figure 3. Trend of current ratio.
4.2 Descriptive Result
From Table 2, the descriptive statistics revealed that the mean of the net profit of the selected banks was 9,125,701, the kurtosis was 9.954025, the skewness of 2.775062 and the standard deviation of 22,251,619; this result implies that there is a great deal of variation in net income among the ten banks. The standard deviation for the ten banks indicate that there was a degree of variability in the net profit of each of these banks, which tends to suggest that their net profits are not stable over time. Based on the information in the descriptive statistics, it is evident that the degree of variability in the net profit is relatively high among the selected banks. The mean of the net profit for the banks is 9,125,701. This result indicates that most of the banks recorded a profit for the year under review. In terms of individual bank profitability, First Bank had the highest mean net profit, while Ecobank recorded the lowest mean net profit, which is indicative of differences in the profitability of these banks.
The mean of the cash ratio of the selected banks was 43.024, the kurtosis was 30.14, the skewness of 5.12 and the standard deviation of 162.6; this descriptive statistic implies that: (i) there is a high degree of variability in the cash ratio, (ii) the mean of the cash ratio is not stable over time, (iii) the cash ratio has a positive relationship with the liquidity expressed in terms of cash liquidity ratio, and (iv) the cash ratio has a positive relationship with the current assets ratio. The standard deviation and skewness implies that there was a high level of variability with respect to the cash ratio among the banks and that there was a substantial amount of negative skewness observed.
The mean of the current ratio of selected banks was 76.2, the kurtosis was 46.8, the skewness of 6.42 and the standard deviation of 349.7; the descriptive statistics shows that 76.2% of the sample is within the range of 68.6% to 79.5% and that majority of the sample lies within the range of 80% to 100% of the desired ratio but little of it lies outside of the desired range. The current ratio indicates the financial stability of the banks and if a bank is not within this range, it may not be considered stable. The higher the current ratio, the better the stability of the bank as it is an indicator that the bank has sufficient assets to meet its liabilities. The current ratio of the banks was within the range of 1.74 to 2.49 indicating that most of the banks are well within the desired range and not overstretched as they may not meet the demand of their depositors for withdrawals in the near future. The average current ratio of the Nigerian banks shows that they are sufficiently funded to meet their current liabilities and hence can be considered as a stable bank. The financial crisis in the Nigerian banking sector has affected the current ratios as many of them have not been able to meet their financial obligations and, as a result, have seen a significant decline in the value of their assets.
Table 2. Descriptive Statistics between Current Ratio, Cash Ratio and Net Profit
|
NEP |
CAR |
CUR |
Mean |
9,125,701 |
43.02370 |
76.18890 |
Median |
57,790.00 |
0.660000 |
1.315000 |
Maximum |
1.11E+08 |
1,106.240 |
2,867.570 |
Minimum |
0.000000 |
0.000000 |
0.160000 |
Std. Dev. |
22,251,619 |
162.5980 |
349.6881 |
Skewness |
2.775062 |
5.116412 |
6.417986 |
Kurtosis |
9.954025 |
30.14148 |
46.80344 |
Jarque-Bera |
329.8431 |
3,505.710 |
8,681.266 |
Probability |
0.000000 |
0.000000 |
0.000000 |
Sum |
9.13E+08 |
4,302.370 |
7,618.890 |
Sum Sq. Dev. |
4.90E+16 |
2,617,374 |
12,105,896 |
Observations |
100 |
100 |
100 |
Notes: Source: Extracted from E-view 9.0 Output. NEP = Net Profit; CAR = Cash ratio; CUR= Current ratio.
4.3 Stationarity Test Result
The result of Unit root test using the panel data from a cross section of 10 selected bank is presented in Table 3. The Levin, Lin & Chu, ADF - Fisher Chi-square and the PP - Fisher Chi-square revealed that all the 0.05 and 0.01 level rejects the null hypothesis of unit root[17]. However, the cross-sectional dependency among the variables indicates that unit root specifications cannot be rejected[18]. This is confirmed by the p-values obtained from the cross-section test which is less than 0.05 for all variables at first difference. The findings show that the variables of current ratio, net profit and cash ratio are stationary at the individual bank level.
Table 3. Unit Root Test for Current Ratio, Cash Ratio and Net Profit of Banking Firms in Nigeria
Variable |
ADF Statistic |
Decision |
NEP |
-4.96918 |
I(1) |
CAR |
-6.43215 |
I(1) |
CUR |
-5.15551 |
I(1) |
Notes: Source: Extracted from E-view 9.0 Output.
4.4 Correlation Coefficients
Table 4 shows the correlation coefficients of current ratio, cash ratio and net profit of the banks, the negative coefficients suggest that the net profit, current ration and cash ratio move in opposite direction. A study by Kirkham[18], found that current ratio and cash ratio morally go hand in hand as the higher the current ratio, the greater would be the liquidity of the bank and the lower the cash ratio, the greater would be the depositor's confidence in the bank. Thus, these ratios are used to judge the financial strength of the bank as well as the repayment capacity of the firm to its creditors. High current ratio is a sign of ample capital adequacy and low cash ratio suggests low depositor's confidence in the firm.
Table 4. Relationship between the Current Ratio, Cash Ratio and Net Profit
|
NEP |
CUR |
CAR |
NEP |
1.000000 |
-0.083581 |
-0.096368 |
CUR |
-0.083581 |
1.000000 |
0.809200 |
CAR |
-0.096368 |
0.809200 |
1.000000 |
4.5 Panel Regression Results
The pooled, Random and Fixed effects models are presented in Table 5, the pooled effect model is not statistically significant though the cash ratio was significant at 1% and negatively influenced the net profit, and this implies that individual effects are correlated with other regressors. However, there is no overall significant effect in this model which could be due to high variability among companies within the industry[19]. The fixed effects model was statistically significant at 1% and the R-square value of 0.66 indicates that 66% of the total variation in the dependent variable is accounted for by the independent variables included in the model. The coefficients of the current ratio and cash ratio were statistically insignificant and negatively related to net profits of the banks, this result implies that current and cash ratios have a limited impact on net profits. According to Eljelly[20] the negative coefficients of current ratio and cash ratio as it is related to net profit is because of (i) lack of current assets to pay current liabilities, (ii) high current liabilities indicate low business liquidity, and (iii) high current ratio and cash ratio indicate high leverage and low profitability[21]. Ogachi et al.[22] also reported that financial ratios such as current ratio are directly related to business performance and can be used as a predictor of future profitability for banking industry.
The random effect model is not statistically significant though the cash ratio was significant at 1% and negatively influenced the net profit; this implies that cash ratio has negative and insignificant impact on bank's net profit[23]. This result supports the findings of the previous model that states that a negative relationship between cash and profit exists. The coefficient of cash ratio in the random effect model is statistically insignificant which indicate that its impact is negligible on the profit margin of the commercial banks. In addition, the magnitude of coefficients for the linear effect of current ratio on net profits for the random effect model is also insignificant which indicates that the impact of current ratio on net profit is insignificant. Similarly, the findings reported in the Amanda[20]. study also supports the results of this study that negative impact of current ratio on profits can be attributed to the reason that current ratio indicator is based on the measurement of short term assets against short term liabilities and as such it will indicate that the borrowing ability of the firm is high if the current ratio is low which means that banks are more exposed to potential liquidity risk.
Table 5. Effects of Current Ratio, Cash Ratio on Net Profit (Pooled, Random and Fixed Effects Models)
Variable |
Coefficient |
Std. Error |
t-Statistic |
Prob. |
Pooled Effects Models |
||||
CUR |
-1,032.392 |
850.5690 |
-1.213766 |
0.2278 |
CAR |
-11,391.30 |
2,986.666 |
-3.814052 |
0.0002 |
C |
9,694,453 |
1,091,066 |
8.885302 |
0.0000 |
R-squared |
0.009378 |
Mean dependent var |
9,125,701 |
|
Adjusted R-squared |
-0.011048 |
S.D. dependent var |
22,251,619 |
|
S.E. of regression |
22,374,195 |
Akaike info criterion |
36.71426 |
|
Sum squared resid |
4.86E+16 |
Schwarz criterion |
36.79241 |
|
Log likelihood |
-1,832.713 |
Hannan-Quinn criter. |
36.74589 |
|
F-statistic |
0.459119 |
Durbin-Watson stat |
0.518178 |
|
Prob(F-statistic) |
0.633206 |
|
|
|
Random Effects Models |
||||
CUR |
-3,276.244 |
2,247.968 |
-1.457425 |
0.1490 |
CAR |
-1,083.667 |
1,500.170 |
-0.722363 |
0.4722 |
C |
9,421,937 |
177,130.2 |
53.19216 |
0.0000 |
Effects Specification |
||||
Cross-section fixed (dummy variables) |
|
|||
Period fixed (dummy variables) |
|
|||
R-squared |
0.669005 |
Mean dependent var |
9,125,701 |
|
Adjusted R-squared |
0.585209 |
S.D. dependent var |
22,251,619 |
|
S.E. of regression |
14,330,996 |
Akaike info criterion |
35.97803 |
|
Sum squared resid |
1.62E+16 |
Schwarz criterion |
36.52511 |
|
Log likelihood |
-1,777.901 |
Hannan-Quinn criter. |
36.19944 |
|
F-statistic |
7.983716 |
Durbin-Watson stat |
1.386815 |
|
CUR |
-1,888.953 |
1,481.552 |
-1.274982 |
0.2054 |
CAR |
-779.0970 |
964.3204 |
-0.807923 |
0.4211 |
C |
9,303,138 |
4,586,803 |
2.028240 |
0.0453 |
Effects Specification |
||||
|
|
|
S.D. |
Rho |
Cross-section random |
20,199,690 |
0.6652 |
||
Period random |
|
0.000000 |
0.0000 |
|
Idiosyncratic random |
14,330,996 |
0.3348 |
||
Weighted Statistics |
||||
R-squared |
0.002564 |
Mean dependent var |
1,997,718 |
|
Adjusted R-squared |
-0.018002 |
S.D. dependent var |
13,767,793 |
|
S.E. of regression |
13,891,164 |
Sum squared resid |
1.87E+16 |
|
F-statistic |
0.124659 |
Durbin-Watson stat |
1.319993 |
|
Prob(F-statistic) |
0.882939 |
|
|
|
Unweighted Statistics |
||||
R-squared |
0.004872 |
Mean dependent var |
9,125,701 |
|
Sum squared resid |
4.88E+16 |
Durbin-Watson stat |
0.506504 |
|
Notes: Source: Extracted from E-view 9.0 Output.
5 CONCLUSION
In conclusion, the findings of this study reveal that there are positive relationships among the current ratios of Nigerian commercial banks and their net profit margins. However, coefficient of current ratio on net profit for random effect model is also statistically insignificant. This implies that the effect of current ratio on net profit is negligible in Nigeria. Therefore, most Nigerian commercial banks are well capitalized because they have adequate financial resources to meet their current liabilities. As such, Nigerian banks are financially sound and stable institutions that can offer investors a high degree of security for their funds; the financial stability does not affect the profitability positively. Based on the findings of this study the following recommendation are proffered: (1) Nigerian banks should intensify efforts to restructure their funding base to reflect the realities of the current CRR impact. In particular, they should increase the proportion of long-term debt in their capital structure in order to reduce the impact of rising interest rates on their net interest income. This would help ensure that the banks remain profitable even in the face of increased borrowing costs. (2) Nigerian banks should ensure monetary and fiscal compliance, which would help to maintain liquidity levels and enhance their capacity to withstand short-term liquidity shocks. (3) The government should consider implementing policies aimed at improving the business environment in the banking sector to boost bank profits and boost economic development. Such policies could include: loosening credit restrictions and reducing the level of taxation imposed on the banks in order to make it easier for them to raise additional capital; and establishing an interest rate floor, which would limit the ability of banks to lower interest rates on deposits and lending rates. (4) For the above reasons therefore, it is very pertinent for the government to encourage the development of commercial banking activities in Nigeria by maintaining a stable regulatory and legal environment. (5) Further research is required to evaluate the financial soundness and profitability of the regional rural banks operating in Nigeria.
Acknowledgements
We thankfully acknowledge scholars whose books and other works were used in this paper. Also grateful to the anonymous reviewers for their comments on the manuscript.
Conflicts of Interest
The authors declared no conflict of interest.
Author Contribution
Iwedi M designed the paper, supervised the work and performed the data analysis. King WO drafted the manuscript. All the authors contributed to writing the article, read and approved its submission.
Abbreviation List
BCBS, The basel committee for banking supervision
CBN, Central Bank of Nigeria
References
[1] Onah CR, Iwedi M, Leera LK. Causal relationship between asset quality and profitability of Nigerian banking industry. Contemp J Bank Financ, 2020; 2: 13-21.
[2] Central Bank of Nigeria. Financial Stability Report, 2013. Available at: [Web]
[3] Basel Committee on Banking Supervision. Risk management practices and regulatory capital: Cross-sectional comparison. Basel: BCBS. 2008.
[4] Marshal I. Bank failure in Nigeria: Evidence of prudential regulator laxity. Frontiers Manage Res, 2017; 1: 141-150. [DOI]
[5] Iwedi M, Edeh MB. Capital regulatory policy and non-performing loans of commercial banks in Nigeria. African J Account Financ Res, 2023; 6: 55-70. [DOI]
[6] Toby AJ. Monetary policy targets and bank liquidity management practices in Nigeria: An inter-temporal analysis. Indian J Econ, 2006; 343: 459.
[7] Owolabi SA, Obiakor RT, Okwu AT. Investigating liquidity profitability relationship in business organization: A studi of selected quoted companies in Nigeria. British J Econ Financ Manage Sci, 2011; 1: 2.
[8] Botoe CW. The impact of liquidity on profitability of commercial banks in Liberia. Nairobi, Kenya: University of Nairobi; 2012.
[9] Ibe SO. The impact of liquidity management on the profitability of banks in Nigeria. J Financ Bank Manage, 2013; 1: 37-48.
[10] Durrah O, Rahman AAA, Jamil SA et al. Exploring the relationship between liquidity ratios and indicators of financial performance: An analytical study on food industrial companies listed in Amman Bursa. Int J Econ Financ Issues, 2016; 6: 435-441.
[11] Mwangi FM. The effect of liquidity risk management on financial performance of commercial banks in Kenya. Nairobi, Kenya: University of Nairobi; 2014.
[12] Agbada AO, Osuji CC. The efficacy of liquidity management and banking performance in Nigeria. Int Rev Manage Bus Res, 2013; 2: 223-233.
[13] Mucheru E, Shukla J, Kibachia J. Effect of liquidity management on financial performance of commercial banks in Rwanda. A Study on Selected Banks in Rwanda. Eur J Bus Soc Sci, 2017; 6: 1-11.
[14] Okere W, Isiaka M, Ogunlowore AJ. Risk management and financial performance of deposit money banks in Nigeria. Eur J Bus Econ Account, 2018; 6: 30-42.
[15] Mwashi J, Miroga J. Influence of liquidity management practices on profitability of deposit taking SACCOs in Kakamega County. Strateg J Bus Change Manage, 2018; 5: 902-922.
[16] Ofeimun GO, Okeke IC. Liquidity risk management as determinant of financial performance of listed deposit money banks in Nigeria, J Account Financ Manage, 2019; 5: 12-20.
[17] Hasan MA. Does globalization accelerate economic growth? South Asian experience using panel data. J Econ Struct, 2019; 8: 26. [DOI]
[18] Kirkham R. Liquidity analysis using cash flow ratios and traditional ratios: The telecommunications sector in Australia. J New Bus Ideas Trends, 2012; 10: 1-13.
[19] Amanda RI. The impact of cash turnover, receivable turnover, inventory turnover, current ratio and debt to equity ratio on profitability. J Res Manage, 2019; 2: 14-22.
[20] Eljelly AMA. Liquidity-profitability tradeoff: An empirical investigation in an emerging market. Int J Commer Manage, 2004; 14: 48-61. [DOI]
[21] Al Zaidanin JS, Al Zaidanin OJ. The impact of credit risk management on the financial performance of United Arab Emirates commercial banks. Int J Res Bus Soc Sci, 2021; 10: 303-319. [DOI]
[22] Ogachi D, Ndege R, Gaturu P et al. Corporate bankruptcy prediction model, a special focus on listed companies in Kenya. J Risk Financ Manage, 2020; 13: 47. [DOI]
[23] Herawati A, Fauzia FI. The effect of current ratio, debt to equity ratio and return on asset on dividend payout ratio in sub-sector automotive and component listed in Indonesia stock exchange in period 2012-2016. KnE Soc Sci, 2018. [DOI]
Copyright © 2023 The Author(s). This open-access article is licensed under a Creative Commons Attribution 4.0 International License (https://creativecommons.org/licenses/by/4.0), which permits unrestricted use, sharing, adaptation, distribution, and reproduction in any medium, provided the original work is properly cited.


