Statistical Analysis of Cost Reflective Electricity Tariff and Distribution in Nigeria (A Study of Southwest States)
Olufemi A Ayansola1, Tayo P Ogundunmade2*, Afolabi O Adedamola1
1Department of Statistics, The Polytechnic of Ibadan, Oyo State, Nigeria
2Department of Statistics, University of Ibadan, Ibadan, Nigeria
*Correspondence to: Tayo P Ogundunmade, Masters, Teaching Assistant, Department of Statistics, University of Ibadan, Oduduwa Road, Ibadan, Oyo 200132, Nigeria; Email: ogundunmadetayo@yahoo.com
DOI: 10.53964/mem.2023005
Abstract
Background: A cost reflective tariff eliminates the need for government subsidies to make up the difference between the prevailing tariff and the actual cost of supply by reflecting the true cost of producing power. However, in order to provide adequate cost reflective tariff, there must be a balanced understanding between the electricity producers and the users in terms of electricity production and supply. It is against this backdrop that this study seeks to investigate the relationship between cost reflective electricity tariff and distribution in Nigeria.
Objective: The aim of this study is to empirically investigate the impact of cost reflective tariff on the Nigerian electricity supply industry and to investigate the relationship between cost reflective tariff and electricity distribution using multiple regression analyses.
Methods: The data used in this study were secondary data generated and extracted from the World Bank indicators (2020), CBN statistical bulletin (2020) and supplemented with data from Nigerian Electricity Regulatory Commission (2020) that covered the period of the study for the 6 states in southwest. Two models were specified to address the two specific research objectives. The first model sought to test the impact of cost reflective tariff on the Nigeria electricity supply industry using multiple regression analyses and the other to investigate the factors that contributed to the price of electricity determinants in Nigeria.
Results: The results showed that the cost of electricity production contributed significantly to the quantity of electricity distributed and the model produced R-square and adjusted R-square values of 91.16% and 87.38%, respectively.
Conclusion: The results obtained in this work is useful for electricity producers and government for proper planning.
Keywords: electricity tariff, electricity distribution, cost reflective, electricity distribution, co-integration
1 INTRODUCTION
Cost reflective tariffs are thought to offer a financial incentive or ‘price signal’ that might encourage consumers to change their energy usage behavior in ways that improve network efficiency, such as by lowering their consumption during times of peak demand (when costs are higher) and/or shifting consumption to off-peak periods, according to the Australian Energy Market Commission (when costs are lower)[1]. Cost reflective, in accordance with the Trade and Industry Chamber of South Africa, implies that the revenue from electricity tariffs covers the full and efficient operating and maintenance costs (including staff costs and overheads), primary energy costs (fuel costs, such as gas and coal), and the full capital costs associated with using the assets (including interest and depreciation costs), which enables the asset to be replaced (or refurbished) as necessary and for the assets to be expanded as demand for electricity grows[2]. A cost reflective tariff eliminates the need for government subsidies to make up the difference between the prevailing tariff and the actual cost of supply by reflecting the true cost of producing power.
According to this broad definition, the subsidy component must be entirely eliminated for a tariff to be really cost reflective, establishing a perfect market for energy where supply and demand work together to determine the price[3]. The advantages of cost reflective tariffs (for customers and networks alike) mainly rely on the presumption that people will choose to use power in a way that maximizes their utility. Although many people would view this as a logical assumption, research in the domains of psychology and behavioral economics has shown time and time again that people regularly make mistakes and stray from the ‘rational choice’ assumed by traditional economic modelling[4].
In order to modernize the energy markets, the Nigerian Electricity Regulatory Commission (NERC) was founded. One of NERC's main responsibilities is to make licensees’ prices fair to customers and high enough for them to be able to fund their operations and make a profit that is suitable for efficient operation.
In order to prevent the abuse of market power, NERC is authorized to create one or more tariff approaches. A Multi-Year Tariff Order (MYTO) was first adopted by NERC in 2008 as the framework for establishing the pricing structure for the industry in an effort to produce a viable and strong tariff policy for NESI. According to Section 76 of the Electric Power Sector Reform Act 2005, the MYTO methodology specified the procedure for tariff regulation. It gave the electrical sector a fifteen-year tariff path with minor and major reviews happening every two years and every five years, respectively[5].
The Nigerian power supply business is made up of numerous enterprises in various industries, locations, and sectors that are all connected through the transfer of gas, money, and energy. It is a highly dynamic system with intricate interactions between many different components. The energy source, which is made up primarily of gas (80%), is at the top of the value chain. To generate power and supply it to the transmission grid, which has a finite capacity, gas producers sell gas to generation companies at a fixed/subsidized price. The distribution businesses receive electricity after it is transmitted to the end users. Electricity tariffs, which in turn work their way back through the system with participating businesses collecting their share of the earnings, reflect how the cost incurred along the value chain is passed on to consumers. Due to Nigeria's current tariff regime's non-cost-reflective nature and significant legislative and operational issues, tariff pricing is crucial to maintaining operations and assuring returns on investment[6].
According to Kaitafi, government regulation caused Nigeria's average tariff to be low for a very long period. Before 2002, Nigeria’s standard rate per kWh was N4.50. It was raised to an average of roughly N6.00/kWh in 2002[7]. NERC first made an attempt to create an efficient cost recovery program or plan in 2008 when the organization unveiled the MYTO. It was anticipated that this new tariff order would guarantee affordability[8]. As a result, under MYTO, the cost was raised to an average of N11.20/kWh in 2008.
This growth rate of almost 50% was nevertheless regarded as among the lowest worldwide[9]. A uniform pricing system was in place prior to MYTO 2008, in which the electricity tariff remained set for years despite an ongoing increase in the cost of inputs (such as natural gas, which accounted for more than 80% of the source of power generated in Nigeria). The most recent end-use tariff by PHCN was set in February 2002 and ranged in price from roughly N6/kWh to N4.50/kWh on average. After that setting, the business continued to function with approximately 2 billion (dollars) monthly deficits. Due to this, it was unable to address the issues with its insufficient and inconsistent electricity service[10].
In 2011, the government approved electricity prices ranging from 4 to 6 cents per kilowatt-hour for single-phase consumers, from 6 to 8 cents per kilowatt-hour for industrial users, and from 8 to 12 cents per kilowatt-hour for users with the highest demand. However, the cost of electricity production at the time was 10 cents per kilowatt-hour. Although the current law or lack of enabling legislation was a stronger disincentive to private investment than the tariffs, this pricing regime impeded the entry of profit-oriented private investors.
As a result, the establishment of transparent tariff determination and the provision of stability and predictability in power price were necessary[10]. Hence, the MYTO 2015 tariff regime was retroactively adjusted as part of the minor review for 2016-2018 to take into account changes in the pertinent macroeconomic indices for 2016, 2017, and 2018. Finding the cost reflective rates for the relevant years and determining the revenue shortfall that has developed as a result of the difference between these cost reflective tariffs and the actual end-user tariffs imposed by the DisCos during these years are two important goals of this adjustment.
The minor review order also reaffirms the Government’s commitment to the Power Sector Recovery Plan (PSRP), which calls for all accumulated obligations resulting from the tariff deficit to be transferred from the DisCos' financial records and fully settled under the PSRP initiative's financing plan. However, there are questions about how thorough the tariff review was because it might not have taken into account the actual Aggregated Technical Commercial and Collection losses suffered by the DisCos throughout the course of the review period[11]. The minor review of the MYTO 2015 and the minimum payment orders for the Year 2019 for the 11 DisCos in Nigeria were released by NERC on August 19, 2019.
Simply put, the main objectives of these orders are to address the historical income shortfall and create a framework to manage and avoid future shortfalls. These orders, which were tailored to each DisCo, took into account the actual changes in the macroeconomic variables and the available generation capacity from 1 January 2016 to 31 December 2018 to establish the tariff shortfall and market shortfall. The order also included forecasts from 2019 onward, with a promise to revise them to reflect current values at the time of the review, which would take place on January 1, 2020[12]. Nigeria has had inconsistent, insufficient, and unreliable power supplies.
The issues are ascribed to the power sector’s failure to make enough money to keep the system running as a result of undercharging for electrical service. The sector’s inability to produce enough income to meet operational expenses, let alone the significant capital investment requirements, has been a problem[13]. Accordingly[14], the power sector was unable to provide efficient services since there was no cost reflective pricing in place. According to The Transmission Company of Nigeria[15], the industry’s subpar operational and financial performance was made worse by incorrect pricing. The government’s reform agenda included a rise in tariffs. Before the MYTO was implemented, power rates in Nigeria were reportedly lower than the cost of supply[16]. The World Bank emphasized that non-cost reflective tariffs put a constraint on how much the service provider can spend in new generation capacity and network development while also limiting how much the existing generation and grid network can be maintained. Low electricity rates only benefit those who already have energy connections in the short term and degrade the quality and consistency of the supply in the long run. Low rates further hinder the pace at which the majority of the population, namely those without access, can obtain connections[17]. The government implemented a new electricity tariff, a reset tariff order known as MYTO 2.2 in February 2016 to address the low tariff regime. This tariff order took into account the facility provided by the CBN, the nation’s current levels of energy output, a new baseline gas price, and other factors that could more accurately reflect the true cost of operating electricity businesses[18]. In Abuja, for example, energy costs increased from 11 to 23.60 Naira per kWh as a result of the new tariff order. The increased tariffs, however, still fall short of accurately reflecting the price of electricity provision[19].
The problem of non-cost reflective tariff, according to Ikeja Electric Plc's Felix Ofulue, is the sector’s biggest problem, especially for DisCos. He claimed that the market was very undersupplied and that the prices are not cost reflective, which had an impact on how effectively the company operates. He told Nigerian News Direct that although the firm was operating, there were many difficulties, one of which was the pricing, which was not cost reflective. We will be able to balance things out and move on with new development if it is cost reflective[20,21]. In light of this, this study aims to examine the connection between cost reflective electricity tariff and distribution in Nigeria. The aim of this study is to empirically investigate the impact of cost reflective tariff on the Nigeria electricity supply industry and to investigate the relationship between cost reflective tariff and electricity distribution using multiple regression analysis. The rest of the paper is structured into three sections. The next section, which contains the materials and method, reports the data collected, the method used. Section 3 shows the results and interpretations, while the last section discusses the conclusion for the paper.
2 MATERIALS AND METHODS
2.1 Research Design
Ex post facto and descriptive research designs were also used in this study. The research was conducted using this design as its foundation. The data generated were already in place and cannot be manipulated by the researcher, making it an ex post facto research design. Similar to that, it is a descriptive research design in that conclusions were drawn after analyzing the data gathered and describing the results. The ordinary least squares (OLS) method of estimation shall be employed as the strategy for data analysis. OLS method will be used to estimate the model.
2.2 Data and Sources of Data
The sources of the data are secondary data generated and extracted from the World Bank indicators (2020), CBN statistical bulletin (2020) and supplemented with data from NERC (2020) that covers the period of 2010 to 2020 and for the 6 states in southwestern Nigeria.
2.3 Model Specification
The two models for this study are specified to address the two specific research objectives. The model seeks to establish the aim of this study. The first model seeks to test the impact of cost reflective tariff on the Nigeria electricity supply industry using multiple regression analysis.
2.3.1 Model I
Deriving from the existing studies and using the intuition of Marginal cost pricing theory, we specify a general model that relates cost reflective tariff and electricity distribution:
|
Where:
ED = Electricity distributed
EP = Electricity production
CEG = Cost of electricity generation
ET = Electricity tariff
Transforming Equation (1) into a multiple model gives the following equation:
|
A double log transformation is used to create a model that is suitable to econometric (regression) estimation techniques. Because the coefficients are presented as elasticity estimates, which are very simple to read and apply to a single country, the double-log transformation, which is frequently favoured settings of Equation (2) that yields the following, is employed:
|
Where: the so-called white noise error term is thought to have a normal, independent distribution with a mean of zero and a variance of one. The definitions of the additional variables are as in Equation (3), and the estimated coefficients of the additional variables in natural log, that is, and represent elasticity of the respective variables.
Economic a-priori which is used to explain the sign and size of the parameters in the model and as well as explaining the movement of variables (independent and dependent variables) in the models will be checked to see whether they confirm to economic theory. The a-priori expectations are: β0, β2, β3>0 and α1...αj>0. Thus, it is expected that the explanatory variables: Electricity Production (EPt), Cost of Electricity (CEGt) and Electricity Tariff (ETt) would have a positive relationship with electricity distribution, while the sign of the control variables may vary.
2.3.2 Model II
The second model seeks to test answers to Objective 2 of this study. We provide a broad model that relates the optimal price that will enable effective electricity distribution based on the results of previous studies and utilizing our intuition. The econometrics model is written as Equation (4):
|
Where:
P = Price of electricity
CT = Cost of transmission
CG = Cost of electricity generation
EP = Electricity production
EC = Electricity consumption
β0 = The intercept or autonomous parameter estimate
β1 - β4 = are the slope of the coefficients of the independent variables to be determined
µt = Error term or stochastic variable
2.3.3 Model Estimation Procedure and Technique
The model coefficients’ numerical values were obtained using the multiple regression models. To assess the estimated numerical values of the coefficient for statistical significance at the 5% level, the student t test with P-values was used. The collective impact of the independent variables on the dependent variables was assessed using the F-statistic.
2.3.4 Unit Roots Test
It has been demonstrated in the literature that most time series variables are not stationary, which can cause spurious regression in time series analysis models that cannot be utilized for exact prediction. Therefore, the first thing we did was look at the statistical characteristics of the variables to see if they had unit roots, or if they were stationary, and to figure out the order of integration. The Augmented Dickey-Fuller (ADF) test would be applied for this purpose. If the absolute ADF value exceeds any of the absolute mackinnon values, the variable is said to be stationary.
2.3.5 Co-integration Test
If any or all of the variables are non-stationary at level, the co-integration test is used to determine the long-term relationship between the dependent and independent variables. Basically, it is employed to determine whether the independent variables can forecast the dependent variable in the near future or over the long run. The co-integration paradigm proposed by Johansen (1991) was used to analyze the long-term connection between the variables.
2.3.6 Estimation Technique
To proceed with the estimation of the model, the study will employ the ordinary least square method of analysis for multiple regression method. The various diagnostic tests will be conducted. Also, to determine the level of significance of the parameters β1, β2, β3 and β4, Standard Error of Estimates, T-statistics, F-statistics, Co-efficient of determination (R2) and Adjusted co-efficient of determination (Adjusted R2) will be considered.
3 RESULTS AND INTERPRETATIONS
This section shows the analyses of the data. It consists of the correlation plot and the performance analytic plot for the variables used. This is to show the relationships among the variables. It also shows the regression results to the two models considered.
3.1 Descriptive Statistics
Table 1 showed the descriptive statistics of the variables, including the median value, mean, standard error of mean, standard deviation, coefficient o deviation, Mean absolute deviation (MAD), variance, skewness, standard error of skewness, kurtosis, minimum and maximum values. Figure 1 below showed the time plot of the variables.
Table 1. Descriptive Statistics of the Variables
Descriptive |
Production |
Distributed |
Consumption |
Cost of Electric. Gen. |
Cost of Transmission |
Electricity Tariff |
Price of Electricity |
Median |
1.91E+10 |
1.84E+10 |
1.59E+10 |
1.08E+10 |
5.37E+09 |
530 |
15723.24 |
Mean |
1.90E+10 |
1.78E+10 |
1.65E+10 |
7.61E+09 |
6.41E+09 |
541.41 |
18612.329 |
Std. Error of Mean |
8.56E+08 |
6.59E+08 |
5.74E+08 |
2.31E+09 |
2.31E+09 |
71.671 |
3597.894 |
Std. Deviation |
2.84E+09 |
2.19E+09 |
1.90E+09 |
7.67E+09 |
7.66E+09 |
237.705 |
11932.865 |
Coefficient of variation |
0.15 |
0.123 |
0.115 |
1.007 |
1.196 |
0.439 |
0.641 |
MAD |
3.05E+09 |
2.18E+09 |
1.39E+09 |
9.75E+09 |
5.28E+09 |
134.43 |
7797.24 |
Variance |
8.06E+18 |
4.78E+18 |
3.62E+18 |
5.88E+19 |
5.87E+19 |
56503.803 |
1.42E+08 |
Skewness |
-0.116 |
-0.217 |
0.281 |
0.238 |
0.931 |
0.143 |
0.65 |
Std. Error of Skewness |
0.661 |
0.661 |
0.661 |
0.661 |
0.661 |
0.661 |
0.661 |
Kurtosis |
-1.905 |
-1.669 |
-1.693 |
-1.522 |
-0.6 |
0.194 |
-0.343 |
Std. Error of Kurtosis |
1.279 |
1.279 |
1.279 |
1.279 |
1.279 |
1.279 |
1.279 |
Minimum |
1.56E+10 |
1.51E+10 |
1.45E+10 |
3.92E+07 |
5.50E+07 |
129.59 |
2976.12 |
Maximum |
2.21E+10 |
2.06E+10 |
1.92E+10 |
2.05E+10 |
2.05E+10 |
987.21 |
41646.18 |
N |
11 |
11 |
11 |
11 |
11 |
11 |
11 |
|
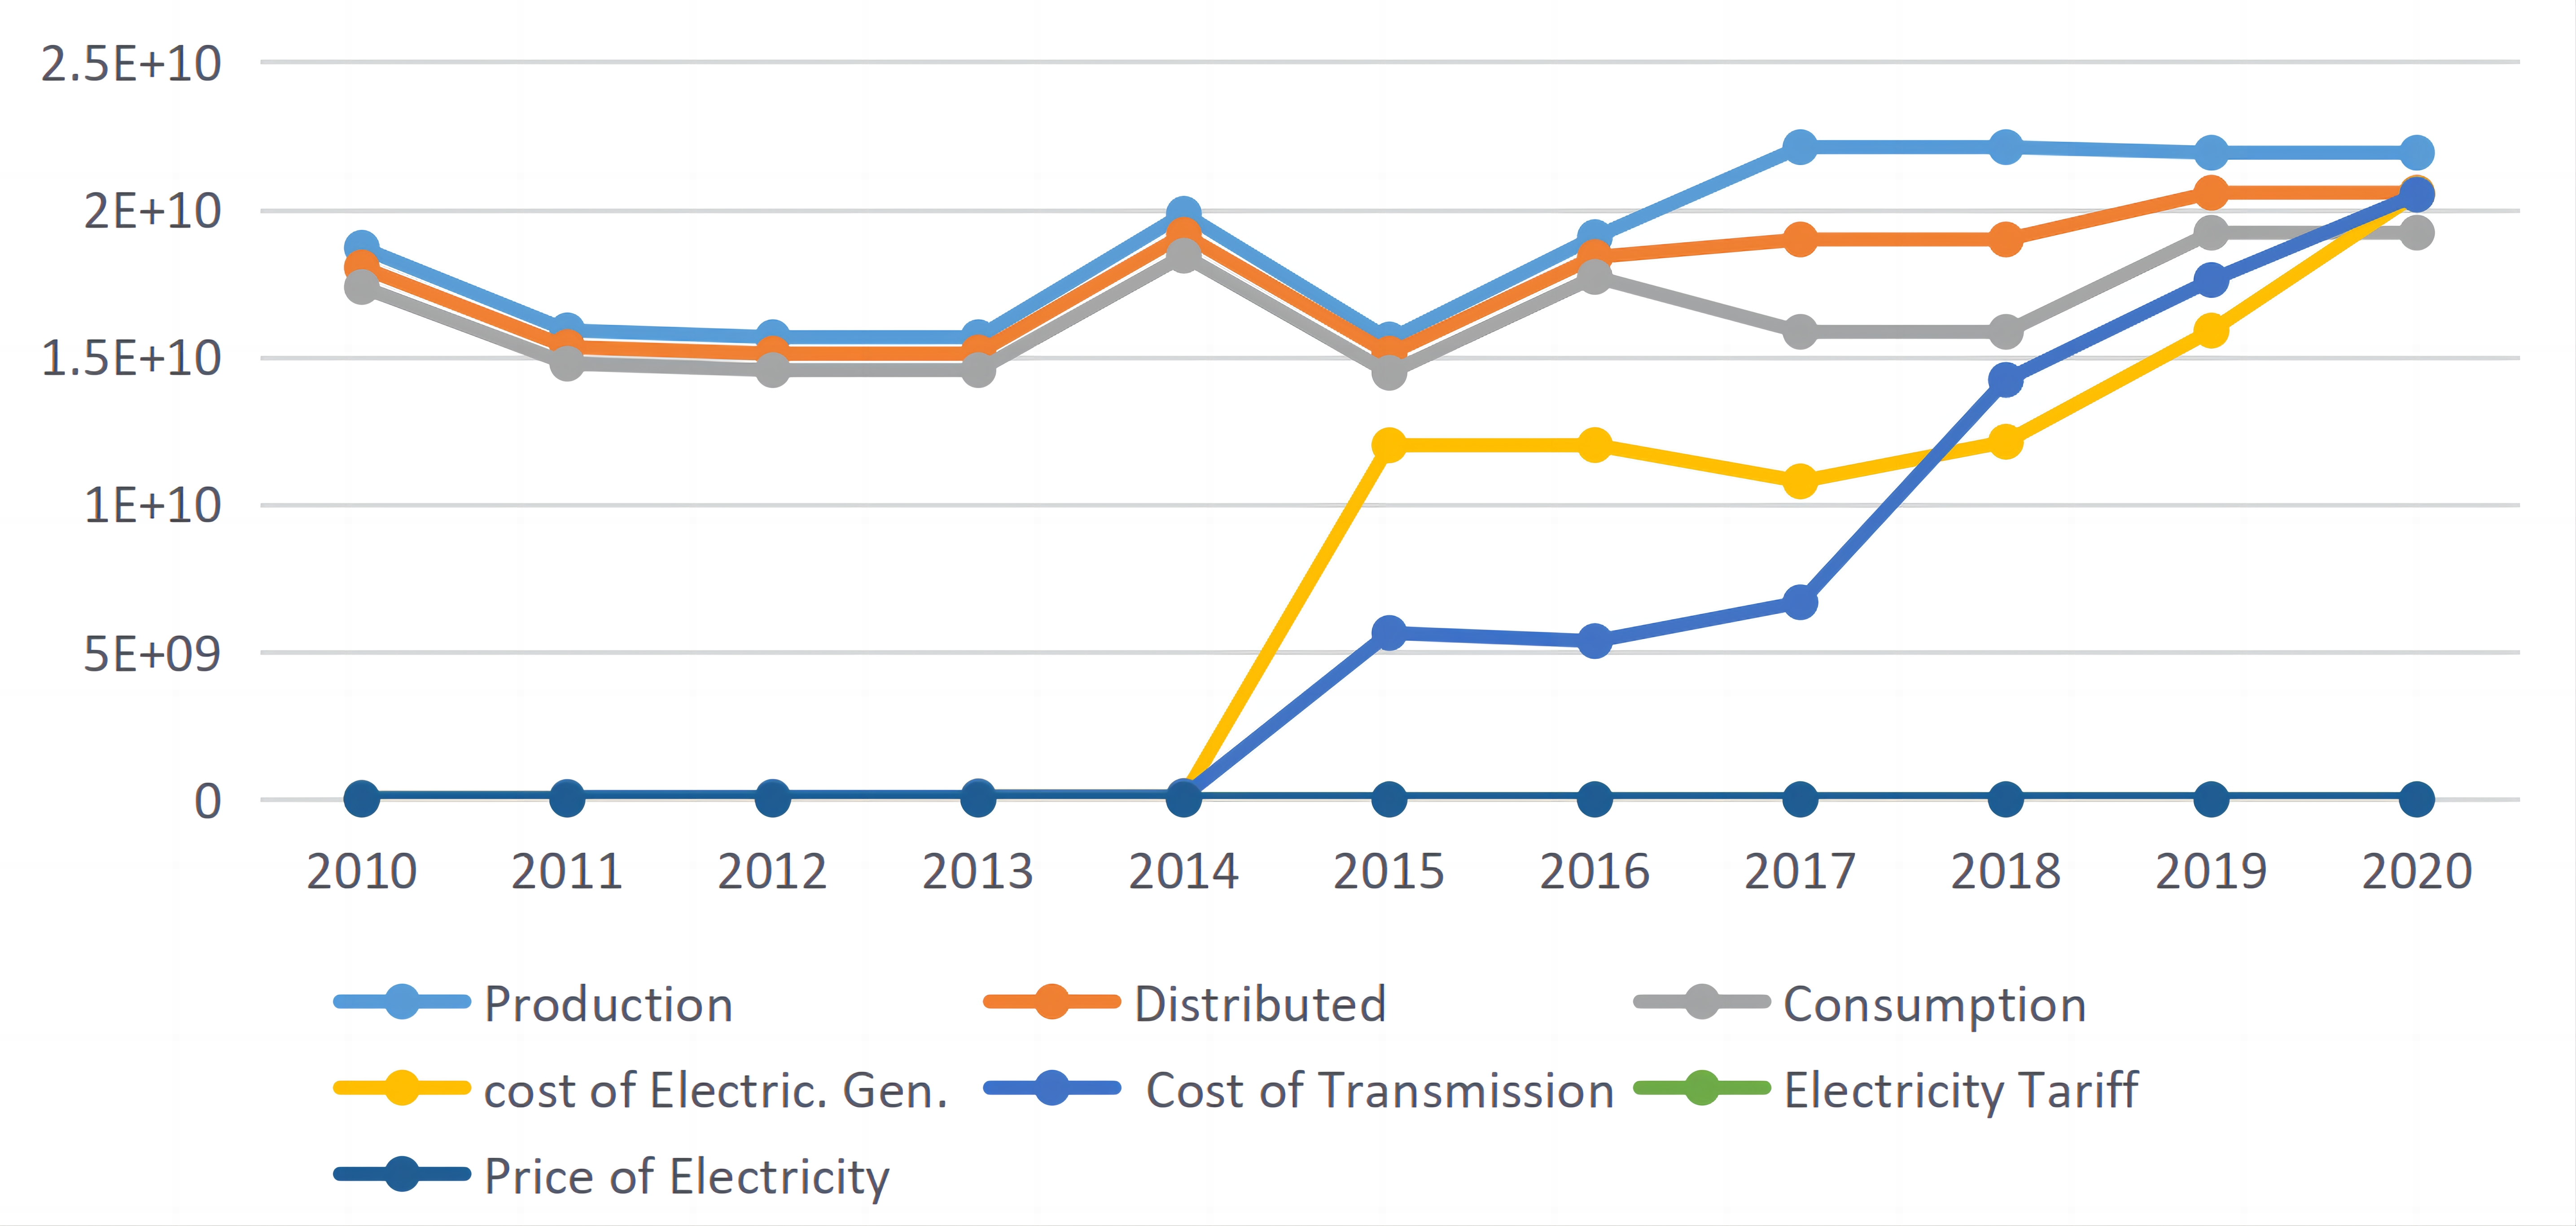
Figure 1. Time plot for the variables.
Figure 2 below showed the correlation plot of the variables used in this study. It showed that there exist weak correlation between electricity consumption and cost of electricity generated as it shows a correlation of 0.48. The correlation between the other variables showed a strong positive and negative correlations as they produced values greater than 0.5. Figure 3 below showed the performance analytics plot of the variables and this showed also the correlation values among the variables, the histogram of the data and so on.
|
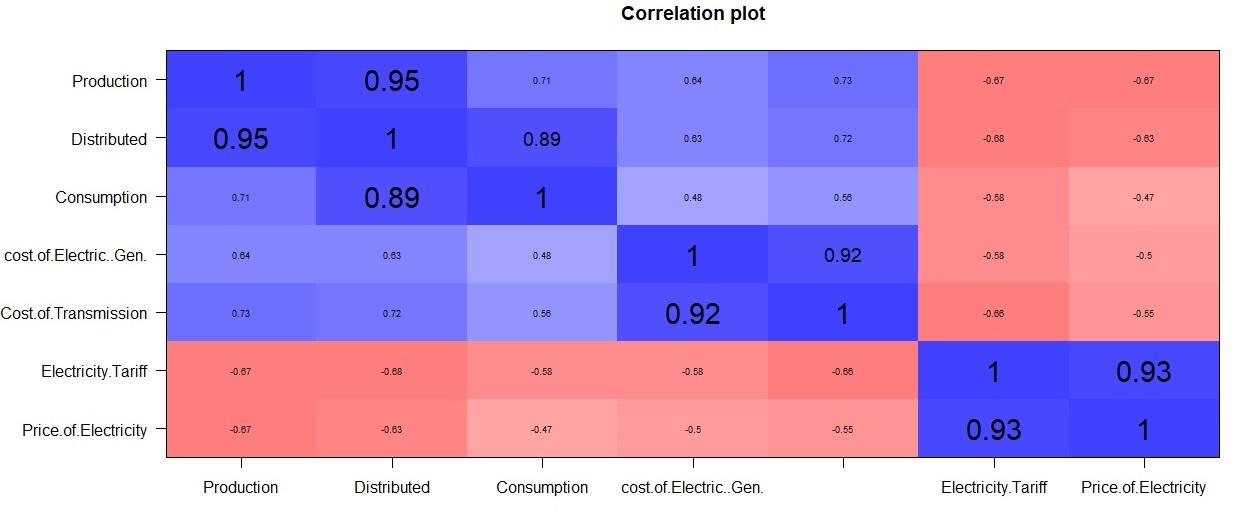
Figure 2. Correlation plot of the variables.
|
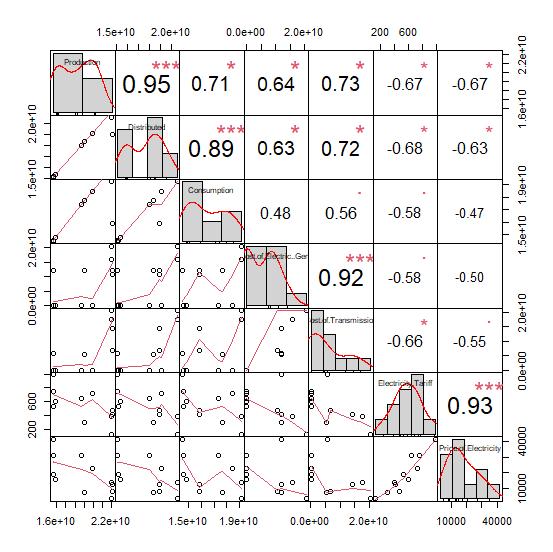
Figure 3. Performance Analytic plot of the variables.
3.2 Co-integration Regression Result
The section is to show the co-integration regression results for the two models. Table 2 showed the the results of the relationship between the quantity of electricity electricity distributed among the populace and the factors that could influence it like electricity production, cost of electricity generated and electricity tariff. Table 3 showed the co-integration result for the relationship between the price of electricity and the explanatory variables like cost of transmission, cost of electricity generated, cost of electricity produced and the quantity of electricity consumption.
Table 2. Co-integrating Regression for Electricity Distributed
|
Coefficient |
Std. error |
T-ratio |
P-value |
|||
Constant |
5.02378e+09 |
2.81993e+09 |
1.782 |
0.1180 |
|||
Electricity Production |
0.692174 |
0.128447 |
5.389 |
0.0010 *** |
|||
Cost of Electricity |
0.000840 |
0.0434785 |
0.01934 |
0.9851 |
|||
Electricity Tariff |
−721234 |
1.44192e+06 |
−0.5002 |
0.6323 |
|||
Mean dependent var 1.78e+10 |
S.D. dependent var 2.19e+09 |
||||||
Sum squared resid 4.22e+18 |
S.E. of regression 7.77e+08 |
||||||
R-squared 0.911652 |
Adjusted R-squared 0.873788 |
||||||
Log-likelihood −238.3013 |
Akaike criterion 484.6026 |
||||||
Schwarz criterion 486.1942 |
Hannan-Quinn 483.5994 |
||||||
rho −0.003126 |
Durbin-Watson 1.891194 |
||||||
uhat_1 |
−1.00313 |
0.329632 |
−3.043 |
0.3903 |
|||
AIC: 435.525 |
BIC: 435.828 |
HQC: 435.193 |
|||||
The result from Table 2 above showed that the quantity of electricity produced contributed significantly to the quantity of electricity distributed among the users. This implies that the quantity of electricity produced has a lot of effect on the quantity of electricity to be distributed among the electricity users. From the table, we have a R-square value of 91.16% and adjusted R-square of 87.38%. This implies good performance of the model in measuring the relationship between the variables. For co-integration among the variable, if the unit-root hypothesis is not disproved for the individual variables and it is disproved for the residuals (uhat) from the co-integrating regression, then there is evidence for a co-integrating connection. The p-value of uhat produces 0.3903 which implies little significance and also means that the there is no evidence of co-integration among the variables as the unit root hypothesis is rejected.
Table 3. Co-integrating Regression for Price of Electricity
|
Coefficient |
Std. error |
T-ratio |
P-value |
||
Constant |
65657.9 |
39804.1 |
39804.1 |
0.1501 |
||
Cost of Transmission |
−9.03521e-08 |
1.37519e-06 |
−0.09186 |
0.9298 |
||
Cost of Electricity |
−1.11778e-07 |
1.21684e-06 |
0.01934 |
0.9851 |
||
Electricity Production |
−2.45499e-06 |
2.22713e-06 |
−1.102 |
0.3126 |
||
Electricity Consumption |
5.54527e-08 |
2.71388e-06 |
0.02043 |
0.9844 |
||
Mean dependent var 18612.33 |
S.D. dependent var 11932.86 |
|||||
Sum squared resid 7.79e+08 |
S.E. of regression 11395.93 |
|||||
R-squared 0.452781 |
Adjusted R-squared 0.087968 |
|||||
Log-likelihood −115.0257 |
Akaike criterion 240.0514 |
|||||
Schwarz criterion 242.0409 |
Hannan-Quinn 238.7973 |
|||||
rho −0.422521 |
Durbin-Watson 2.633135 |
|||||
uhat_1 |
−1.42252 |
0.284372 |
−5.002 |
0.0086 *** |
||
AIC: 208.474 |
BIC: 208.777 |
HQC: 208.142 |
||||
The result from Table 3 above showed that the none of the variables considered significantly contributed to the price of electricity to the users. This implies that these variables considered-cost of transmission, cost of electricity generated, quantity of electricity generated and electricity consumption-are factors to be considered for price of electricity but not significantly important to determining the price of electricity to consumers. From the table, we have a R-square value of 45.28% and adjusted R-square of 8.79%. This implies weak performance of the model in measuring the relationship between the price of electricity and other explanatory variables. For co-integration among the variable, if the unit-root hypothesis is not disproved for the individual variables and it is disproved for the residuals (uhat) from the co-integrating regression, then there is evidence for a co-integrating connection. The p-value of uhat produces 0.0086 which implies significance and also means that the there is evidence of co-integration among the variables as the unit root hypothesis is not rejected.
4 CONCLUSION
This work has been able to show factors that contributes to the quantity of electricity distributed among the users and the price of electricity. Model 1 and Model 2 were used to depict these results. It could be seen from Model 1 that quantity of electricity produced contributes significantly to the quantity of electricity distributed. Additionally, the model produced a R-square and adjusted R-square values of 91.16% and 87.38%, respectively. Model 2 examined the relationship between the price of electricity and other explanatory factors like cost of transmission, cost of electricity generated, quantity of electricity generated and electricity consumption. It was observed that none of these variables reported significance value in the model. Also, the model produced R-square value and adjusted R-square of 45.28% and 8.79%, respectively, which implies weak performance of the model. This occurs as a result of the presence of co-integration among the variables. This work will help both the electricity producers and users in understanding the price of electricity to be paid and also factors associated with the electricity production and distribution.
Acknowledgements
The authors hereby wish to thank the Tertiary Education Trust Fund (TETFUND) for the funding received for this research, under the category of Institutional Based Research (IBR).
Conflicts of Interest
The data collected in this study do not involve experiments, or human sample; neither does it violate privacy. All respondents willingly participated in the study.
Author Contribution
Ogundunmade TP performed conceptualization, methodology and writing. Ayansola OA wrote, reviewed and edited the article. Adedamola AO performed data curation and writing. All the authors read and approved its submission.
Abbreviation List
ADF, Augmented Dickey-Fuller
MAD, Mean absolute deviation
MYTO, Multi-year Tariff Order
NERC, Nigerian Electricity Regulatory Commission
OLS, Ordinary least squares
PSRP, Power Sector Recovery Plan
References
[1] AEMC. Power of choice review - giving consumers options in the way they use electricity, Final Report. Sydney, Australia: Australian Energy Market Commission. 30 November 2012. Available at:[Web]
[2] Adepoju AA, Ogundunmade TP. Economic Growth and its Determinant: A cross country Evidence. Statistical Trans New Ser, 2019; 20: 69-84.[DOI]
[3] United capital. Nigeria power sector report, Is there light at the end of the tunnel? 2017. Available at:[Web]
[4] Stenner K, Frederiks E, Hobman EV et al. Australian Consumers’ Likely Response to Cost-Reflective Electricity Pricing. CSIRO, Canberra, Australia, 2015.
[5] Ogundunmade TP, Adepoju AA. Modelling Liquefied Petroleum Gas Prices in Nigeria Using Time Series Machine Learning Models. Mod Econ Manag, 2022; 1: 5.[DOI]
[6] Onyekwena C, Ishaku J, Akanonu PC. Electrification in Nigeria: Challenges and Way Forward. Centre for the Study of the Economies of Africa (CSEA), Abuja, Nigeria, 2017. Available at:[Web]
[7] Nigerian Electricity Regulatory Commission: Regulations for Independent Electricity Distribution Networks. Abuja, 2005.
[8] Nigerian Electricity Regulatory Commission: Regulations for Independent Electricity Distribution Networks. Abuja, 2012. Available at:[Web]
[9] Kaitafi AI. Imperatives of Tariff/Tariff Setting and Subsidy in Nigerian Electricity Industry (NESI). Authoritat J Power Holding Corp Nigeria, 2011; 6-14.
[10] Bello SL. Evaluating the Methodology of Setting Electricity Prices in Nigeria. Int Assoc Energy Econ, 2013; 4: 31-32.
[11] KPMG. Nigeria’s Electricity Supply Industry Highlights. Power Sector Watch, Edition 2019-Q3, Nigeria. Available at:[Web]
[12] Kofo OO. Cost-reflective tariff in the Nigerian electricity supply industry (NESI). 2020. Available at:[Web]
[13] Ogundunmade TP, Adepoju AA, Allam A. Predicting crude oil price in Nigeria with machine learning models. Mod Econ Manag, 2022; 1: 4.[DOI]
[14] Amadi S. Absence of Cost Effective Tariff Led to the Failure of Power Sector-NERC. 2012.
[15] Trade and Industry Chamber (2010) A study into approaches to minimise the impact of electricity price increases on the poor. Accessed 20 January 2016. Available at:[Web]
[16] Ofoegbu GN, Emengini SE. Recovery of Cost of Electricity Supply in the Nigerian Power Sector. Res J Finance Acc, 2013; 4: 130-141.
[17] World Bank indicators (2020) Bulletin.
[18] Adepoju AA, Oludunni AA, Ogundunmade TP. Pettitt and Bayesian Change Point Detections in the Price of Kerosene in The Southwestern Region of Nigeria. Int J Data Sci, 2022; 3: 33-44.[DOI]
[19] Ayansola OA, Ogundunmade TP, Adedamola AO. Modelling Willingness to Pay of Electricity Supply Using Machine Learning Approach. Mod Econ Manag, 2022; 1: 9.[DOI]
[20] Ogundunmade TP, Adepoju AA, Allam A. Stock price forecasting: Machine learning models with K-fold and repeated cross validation approaches. Mod Econ Manag, 2022; 1: 2.[DOI]
[21] Ogundunmade TP, Adepoju AA. The performance of artificial neural network using heterogeneous transfer functions. Int J Data Sci, 2021; 2: 92-103.[DOI]
Copyright © 2023 The Author(s). This open-access article is licensed under a Creative Commons Attribution 4.0 International License (https://creativecommons.org/licenses/by/4.0), which permits unrestricted use, sharing, adaptation, distribution, and reproduction in any medium, provided the original work is properly cited.


