Potential of Urban Green Infrastructure for Climate Change Adaptation in Karongi Town, Rwanda
Nsekanabanga Jean D'Amour1, John Maina Nyongesah2*
1Department of Environmental Studies, University of Lay Adventists of Kigali (UNILAK), Kigali, Rwanda
2Department of Biological Sciences, Jaramogi Oginga Odinga University of Science and Technology, Bondo, Kenya
*Correspondence to: John Maina Nyongesah, PhD, Senior Lecturer, Department of Biological Sciences, Jaramogi Oginga Odinga University of Science and Technology, W745+XFF, Ukwala-Bondo Road, Bondo 40601, Kenya; Email: jr_nyongesah@yahoo.co.uk
DOI: 10.53964/mem.2023004
Abstract
Methods: This study used the analytic hierarchy process (AHP) software for the multiple criteria decision-making method that was originally developed by Prof. Saaty, ArcGIS data and excel spreadsheet. Five main criteria (Geo-physical, accessibility, blue and green infrastructure, urban land, and Vegetation data), sixteen sub-criteria and climate factors were analyzed. The comprehensive literature review and observation on ground contributed to the selection of criteria. Each criterion was ranked by using scale (1-9). Sub-criteria weighting was performed by using pairwise comparison in AHP.
Results: The results indicated that available green infrastructures did not fully facilitate city residents to enjoy their benefits. Additionally, 20 years ago, Karongi city faced a land use decrease in forested areas in favor of built-up space as well as variation in rainfall pattern. Accessibility to urban green infrastructure by urban communities was at a low level, and this was an indication of vulnerability to climate change.
Conclusion: The multi-scale planning approach has an impressive contribution in ecological multi-scale connections between various ecological infrastructures offering the prospect of a more sustainable landscape for well-being, biodiversity and adaptability to climate change in Karongi city. Even though these issues may have more importance than a simple term, gathering them under the umbrella of a term like green infrastructure could accentuate their interconnections and dependence on each other, hence providing contribution to climate change adaptation.
Keywords: green infrastructure, adaptation, climate change
1 INTRODUCTION
Green infrastructure provides significant benefits for the preservation of biodiversity and quality of life[1]. It has been estimated that 68% of the world population will be living in cities by 2050[2], which will dramatically increase demands for land and natural resources and exacerbate environmental issues. Currently, most cities face rapid urbanization associated with urban sprawl and decrease of urban green infrastructures[3]. These urbanization projects increase pressure on the urban ecological environment[3,4] that needs to be understood through empirical research.
Rwanda is characterized by rapid urbanization where the government is actively encouraging the transition into secondary cities as well as Kigali satellite cities[2]. According to the World Bank group report (2017), an increase in the urban population has been accompanied by the physical expansion of cities, notably the periphery of Kigali and secondary cities as well. Since towns and cities should be managed as a separate portfolio, with support to the main city which leads the economy and provision for other cities[5], potentiality of green infrastructures to adapt to climate should be understood.
Rwanda actively promoted development of six ‘secondary cities’ and Kigali satellite cities to reduce the pressure on Kigali, which will ultimately solve population pressure on an urbanized city[6]. Even though cities have come to provide advanced urban services, such as well-structured urbanization forms, highways and water supplies, thus making cities more convenient with the development[5-7], there is a wide array of urban problems markedly exposed on the surface.
There is also an increasing consensus that global climate change is likely to have considerable consequences for the functioning of ecosystems. Management of ecosystem services is included in the array of possible human responses to climate change[6-8]. According to the World Bank group report (2021) on climate change, rainfall and temperature will continue to increase from 2020 to 2050 and beyond. The maximum temperatures are expected to increase by 0.44℃ to 0.6℃ in 2020, and 1.3℃ to 1.9℃ in 2050. There is a projection of an increase in number of warm days markedly by the middle and end of the century based on all emissions scenarios. The above report indicates that Warm nights are projected to increase significantly by the middle and late 21st century under each emissions scenario.
The precipitation is another factor where rainfall is highly variable in Rwanda but average annual rainfall may increase by up to 20% by the 2050s from 1970 based on data from Rwanda green growth strategy report of 2011. Alternatively, the projections for East Africa over Rwanda and Burundi show an increasing trend in rainfall intensity for both rainy seasons which is likely to cause floods and storms which can result in landslides, crop losses, health risks and damage to infrastructure[9].
The challenges of urbanization include loss of biodiversity, air and water pollution, storm water runoff, urban heat islands, and exponential population growth, which damagingly affects both nature and cities themselves. Since global climate change has gradually accelerated the problems to be more pronounced by accumulated impacts[7], green infrastructure could offer a lasting solution to climate change adaptation in cities.
Karongi is a fast growing city, with a population of more than 70,000[10]. Approximately 21.4% of Karongi District population is living in Karongi city. The city is governed by two administrative sectors namely Rubengera and Bwishyura. Expansion of the city has led to conversion of rural agricultural lands to urban gray infrastructure in the recent past, with the creation of model villages, roads and buildings. These land use changes have impinged on urban ecosystems, and yet at the same time increased demands for new strategies to aim for a better environment.
According to the Rwandan national statistics[10], 23.1% of infrastructures in Karongi are affected by environmental destruction, 6.5% affected by flooding events; 36.2% affected by mountain slides or landslide; 47.3% destructive rains, and 10% affected by other environmental problems not specified. Karongi District has a clear development plan drawn from the Government of Rwanda seven years program and vision 2050. There’s need for environmentally focused plan, policy and stewardship for Rwandan built environment; how we are proactive and responsive to the contemporary conditions will be a key challenge to envision a better Karongi city.
This study ultimately aims at contributing to better approaches for the fastest growing Karongi City through a broadly accepted, environmental concept green infrastructure (UGI) and a methodology to support decision-making process appropriateness analysis. It is important to evaluate the effort put in environment and ecosystem management, methodology being used as well as their connection with institution legal framework and sustainability principle. These will enable the environmental and cities development actors to spearhead a common shared goal of sustainable cities as well as narrowing the view of UGI in decision making.
2 METHODOLOGY
2.1 Study Site
Karongi District is one of the seven Districts in the Western Province. It is bordered by Rutsiro to the north, Ngororero and Muhanga districts to the north-east, Nyamasheke and Nyamagabe districts to the south, Ruhango district to east and it borders with the Democratic Republic of Congo and Lake Kivu to the west. Karongi District stretches over an area of 993km2 with a population of 331,571 distributed into 77,000 households (Figure 1). It is composed of 175,684 females and 155,887 males which represent a Sex Ratio of 89. It is among the districts of Rwanda which has a high density of 334 persons per square kilometer and faces demographic growth with an average annual growth rate of 1.7%. Karongi District is divided into 13 administrative sectors (Imirenge), It is subdivided into 88 cells (Akagari) and 538 villages (Imidugudu).
|

Figure 1. Karongi District.
Karongi district is characterized by the highlands area with steep features. Karongi District has an altitude varying between 1,470 to 2,200 meters. On one hand, the topographical characteristics allow the district to be faced with soil erosion. The various land uses decrease forest area, accentuate the erosion phenomena, bring heavy siltation downstream, and in some cases, the floods may occur. The sensitive degradation is a constraint for developing mechanized agriculture with productivity. Climate Karongi District experiences tropical climate of high altitude. It is one of Rwanda regions which have high rainfall characterized by two dry seasons covering the period from December to January and from June to mid-September. The annual average of temperature varies from 16℃ to 21.5℃ Annual rain falls ranging from 1,100 to 1,500mm.
2.2 Description of the Method
Analytic hierarchy process (AHP) is a form of multi-criteria analysis that is used to analyze complex decisions where multiple perspectives need to be considered. It was developed by Saaty[11] to help decision makers find the option that best suits their goal and understanding of the ‘problem’, while taking into consideration factors that cannot be quantified.
AHP is very flexible and can be adapted to different needs and contexts. The criteria and sub-criteria can be decided in advance by the expert through a participatory process with stakeholders to increase transparency, dialogue and ownership of the process and outcome. There is no upper limit to the number of criteria or sub-criteria, except for the time that is required to do the comparison.
Criteria can be both tangible and intangible and defining them can involve as many participants as required. The number of alternatives to evaluate can also vary, though they should be as mutually exclusive as possible. The types of decision situations in which the AHP can be applied include choices, ranking, prioritization, resource allocation and conflict resolution and clearly these have relevance in many areas of climate adaptation as used in this study.
A series of steps were involved in undertaking the method as described by Saaty[11-13].
● Define the ‘problem’ or adaptation challenge, i.e. the need and purpose of the decision (goal), listing the alternatives to evaluate (e.g. adaptation options), setting-up the criteria and sub-criteria (attributes) by which to evaluate the alternatives (or adaptation options) and identifying the stakeholders and groups to involve in the process.
● Structure the issue, including the decision hierarchy, and identify the top-level criteria, the intermediate criteria, and the set of options.
● Undertake the pairwise comparison. This compares the elements to one another, two at a time, with respect to their impact/ importance on an element above them in the hierarchy. This AHP uses numerical values (e.g., as in the scale below) to conduct the pairwise comparisons, constructing a set of pairwise comparison matrices (Table 1). Several matrices are produced to compare the alternatives (e.g. adaptation options) with respect to each criteria, and the criteria with respect to the goal.
● Calculate relative priorities. This can be done using a spreadsheet, or software, such as Expert Choice. 1 The values in Step 3 are processed to obtain numerical priorities or weights for the criteria and alternatives. Depending on the problem at hand, a priority or weight can refer to importance, preference or likelihood.
● Aggregate priorities. The final step is to aggregate relative priorities to produce overall priorities (final evaluation metrics) which sum to 1.0.
Table 1. AHP Scale for Comparison
Value Relative Importance |
Explanation |
1 Equal importance |
Two elements contribute equally |
3 Moderately more important / better |
Experience and Judgement moderately favor one element over another |
5 Definitely more important / better |
Experience and Judgement strongly favor one element over another |
7 Much more important / better |
One element is highly favored, its dominance is demonstrated in Practice |
9 Extremely more important |
All evidence favors one element over another |
Notes: Source: Fictitious data, for illustration purposes only.
2.3 AHP Method Innovation
AHP has been used in a wide variety of fields including engineering, business strategic management, education and quality assessment. The approach has high relevance for the analysis of climate adaptation related decisions, given it is useful where a range of stakeholders are dealing with issues that have a high degree of complexity, that involve uncertainty and risk, and include subjectivity, i.e., human perceptions and judgments. It is also potentially useful when the outcomes have possible long-term consequences. The tool has a particular relevance where important elements of the decision are difficult to quantify or compare, or where different expertise, goals, and world-views are a barrier to consensus-building and communication. In the context of climate adaptation, the method can be used to compare a set of adaptation options against a set of defined criteria using participants’ experience and judgment about the issues of concern. It allows the comparison of diverse elements that are often difficult to measure in a structured and systematic way using a scale. This makes it particularly relevant for sectors or key criteria where quantification is challenging.
2.4 Research Design
Publicly accessible data on Geo-physical, accessibility, blue and green infrastructure, urban land, and Vegetation data contributed to this study. This study also relied on the comparison of green infrastructure and climate change strategies. High resolution satellite images of the study area were downloaded from Google Earth and used for geophysical and visual interpretation.
2.5 Data on Characteristics of Green Infrastructure
2.5.1 Geo-physical
In order to ensure that the most suitable site is selected for Green infrastructure, the decision makers have to ensure that the site is suitable to increase landscape or habitat connectivity. We explore how geography contributes research on green infrastructure as well as the emerging practices as seen within sustainability plans. We identify four areas in which geographers can influence both green infrastructure theory and practice: (1) scale; (2) mapping distribution; (3) sensitivity to place and locale; and (4) equity and access. The sub-criteria identified to help evaluate the available sites are: (i) Slope (degree), (ii) Elevation (m), (iii) Aspect, (iv) Erosion and (v) Land capability. Landscape connectivity is important for dispersing or migrating individuals. Dispersal increases resilience to disturbances by allowing organisms to track their shifting habitats, and it promotes the spread and expansion of populations.
2.5.2 Accessibility
The accessibility principle refers to the guarantee that all people can use, enjoy, and positively contribute to green infrastructure. Therefore, experts in site selection for UGI should take those criteria into consideration. The sub-criteria to be evaluated are: (i) Distance (m) between Urban Green Infrastructure and the highway, (ii) Distance(m) from the road, and (iii) Distance from the bus stops.
2.5.3 Blue and Green Infrastructure
Gray infrastructure refers to buildings, roads, and other urban constructions. Blue infrastructure refers to water elements, like rivers, canals, ponds, wetlands, floodplains, water treatment facilities, etc. Green infrastructure refers to trees, lawns, hedgerows, parks, fields, forests, etc. These terms come from urban planning and land-use planning (http://bioveins.eu/blog/article2, 2021). Green infrastructure is a strategically planned network of natural and semi-natural areas, including green and blue spaces and other ecosystems, designed and managed to deliver a wide range of ecosystem services at various scales. The consideration of this criterion is very important in respecting urban Green infrastructure interconnectivity principle. The sub-criteria to be considered are: (i) Distance (m) between Green infrastructure and the reservoir, (ii) Distance (m) from the watercourses and distance from coastline, and (iii) Distance(m) from urban green space.
2.5.4 Urban Land
GI provides more benefits when it is located close to people and to the areas in need[14]. The sub criteria of this study will be: (i) distance (m) from commercial centers, and (ii) Distance (m) from high-density residential centers.
2.5.5 Vegetation
The unplanned urban expansion exerts pressure on natural resources, resulting in environmental conflicts, contamination of watercourses, loss of biodiversity, deterioration of fragile ecosystems, degradation of productive soils and land use conflicts.
Main biophysical feature are important components and were taken into consideration to ensure that existing natural values and processes of the city are protected. Therefore, the site selection under this study should focus mainly on (i) land use/land cover, and (ii) agriculture land.
The Analytical Hierarchy Process is one of the multiple criteria decision-making method that was originally developed by Prof. Saaty[15]. AHP provides measures of judgment consistency while deriving priorities among criteria and alternatives and simplifies preference ratings among decision criteria using pairwise comparisons. The model involves:
Step 1: Decomposition of the decision-making problem into a hierarchy;
Step 2: Making pairwise comparisons and establish priorities among the elements in the hierarchy;
Step 3: Synthesizing judgments (to obtain the set of overall or weights for achieving your goal);
Step 4: Evaluation and checking the consistency of judgements.
The first step in the AHP procedure is to make pairwise comparisons between each criterion using scale for comparison[13]. Results of the comparison (for each factor pair) were described in terms of integer values from 1 (equal value) to 9 (extreme different) where higher number means the chosen factor is considered more important in greater degree than other factor being compared with (Table 2).
Table 2. Comparisons between Each Criterion Using Scale for Comparison[13]
Scale |
Degree of Preference |
1 |
Equal importance |
3 |
Moderate importance of one factor over another |
5 |
Strong or essential importance |
7 |
Very strong importance |
9 |
Extreme importance |
2, 4, 6, 8 |
Values for inverse comparison |
The sum of each column of the pairwise matrix will be denoted as follows:
|
Then the element of the matrix will be divided by its column total to generate a normalized pairwise matrix as shown below:
|
The AHP generates a weight for each evaluation criterion according to the expert’s pairwise comparisons of the criteria. The higher weight is more important than the corresponding criteria. Then the AHP combines the weights and the scores to determine the total score for each option and a consequent ranking was used (n) to generate the weighted matrix of the priority criteria (W).
2.7 Weighting in AHP
Saaty[11] developed AHP tool for analyzing complex decisions involving different criteria. In AHP, a matrix is generated as a result of pairwise comparisons which help decision makers to assign different levels of importance of factors included in analysis. The assigned rank (1-9) indicates the strength and dominance of the criterion. This AHP involves four steps for calculation of weight in pairwise comparison matrix (PCM)[16].
(1) Formation of judgment;
(2) Calculation of assigned ranks;
(3) Development of PCM and;
(4) Calculation of weights.
The cell values of PCM are divided by sum of each column and averaged across rows to calculate weight for each criterion.
The consistency ratio for determination of accuracy of the calculated weight[11]. Consistency ratio has the upper limit value of 0.10. This imply that the values greater than 0.10 are inconsistent. AHP online software may be employed to identify criteria weighting based on expert views.
3 RESULTS
Geophysical characteristics represent the main determinant of urban green infrastructure in Karongi city. These are represented by: slope degree, elevation, aspect, erosion, land capability (Table 3). The second determinant of green infrastructure status in Karongi city is a set of blue and green infrastructure with 21.9% as priority. These are mainly the distance from roads as well as recreational spaces like Lake Kivu and historical places.
Table 3. Criteria Based on Pairwise Comparison
Priorities |
Decision Matrix |
||||||||||
|
Cat |
Priority |
Rank |
|
1 |
2 |
3 |
4 |
5 |
6 |
|
1 |
Geo-physical |
48.00% |
1 |
1 |
1 |
3 |
6 |
4 |
8 |
9 |
|
2 |
Accessibility |
16.90% |
3 |
2 |
0.33 |
1 |
1 |
5 |
3 |
5 |
|
3 |
Blue and green infrastructure |
21.90% |
2 |
3 |
0.17 |
1 |
1 |
7 |
7 |
9 |
|
4 |
urban land |
5.70% |
4 |
4 |
0.25 |
0.2 |
0.14 |
1 |
1 |
3 |
|
5 |
Vegetation |
4.70% |
5 |
5 |
0.12 |
0.33 |
0.14 |
1 |
1 |
2 |
|
6 |
flexible and adaptable |
2.80% |
6 |
6 |
0.11 |
0.2 |
0.11 |
0.33 |
0.5 |
1 |
|
It is observed in results above that the contribution of geophysical characteristics of GI (48%) indicate that slope degree is high as well as other presence of erosion and mountainous relief which impede sustainability of blue and green infrastructures (roads destroyed by high intensity of water runoff, sedimentation and water pollution among others).
The resulting weights for the criteria based on pairwise comparisons are shown in Table 4. Urban Green infrastructure accessibility was analyzed and 63.7% was attributed to accessibility of highway by urban community. They walk a distance ranging from 50m to 1500m. This distance is small compared to distance to access the bus stage. The resulting weights are based on the principle of eigenvector of the decision matrix.
Table 4. AHP Green Infrastructure Accessibility Status
Priorities |
Decision Matrix |
||||||
Cat |
|
Priority |
Rank |
|
1 |
2 |
3 |
1 |
Dist. from highway |
63.70% |
1 |
1 |
1 |
3 |
5 |
2 |
Dist. from road |
25.80% |
2 |
2 |
0.33 |
1 |
3 |
3 |
Dist. from bus stop |
10.50% |
3 |
3 |
0.2 |
0.33 |
1 |
The results above indicate that the altitude of Karongi city has been given high priority in determination of GI status as it is ranged between 1300m and 1700m (Table 5). Slope degree (15, 35, 45) respectively took the second rank while erosion risk intensity had the least contribution in determining the status of GI.
Table 5. AHP-Geophysical Characteristics of GI
Cat |
Priority |
Rank |
|
1 |
Elevation |
54.00% |
1 |
2 |
Slope degree |
29.70% |
2 |
3 |
Erosion risk intensity |
16.30% |
3 |
The distance covered by urban communities to access the water course ranged from 50m to 3500m and it took the first rank with 44.3% during pairwise comparison (Table 6). However, the distance from residential centers to recreational space was higher as it ranged from 2500m to 4500m and therefore the distance from green space was ranked at 3rd level with 16.9%.
Table 6. Blue and Green Infrastructure Status
Cat |
Priority |
Rank |
|
1 |
Distance from reservoir |
38.70% |
2 |
2 |
Distance from watercourse |
44.30% |
1 |
3 |
Distance From green space |
16.90% |
3 |
The percentage of 85.7% attributed to distance from high density residential centers indicate that urban communities has more chances to access GI benefits like green space, recreational areas, improved infrastructure without traveling long distances than people living beyond (Table 7). It was observed that most urban communities covered the distance between 50 to 600m to access basic urban green infrastructures. However, the distance from commercial centers to urban green infrastructure was observed to be long (100 to 2500m)
Table 7. Urban Land and GI Accessibility
Cat |
Priority |
Rank |
|
1 |
Dist. from commercial centers |
14.30% |
2 |
2 |
Dist. from high-density residential centers |
85.70% |
1 |
Table 8 indicated that LULC changed at a rate of 13.75% from 2000 to 2020. These changes are observed mainly in decrease of forest and grassland in favor of built-up land, wetland and water bodies. The forest land decreased significantly by 14.38% followed by grassland by 1.68%. Agriculture land increased at a rate of 13.71% from 2000 to 2020. Remarkable increases were observed specifically arable crop and permanent crop land 14.71% in favor of permanent grassland.
Table 8. Vegetation and Urban Green Infrastructure
Level 0 |
Level 1 |
Level 2 |
Glb Prio. |
Vegetation |
Land use land cover 0.500 |
Forest land (29.75% in 2000 and 15.37% in 2020) 0.200 |
10.0% |
Built-up land (0.54% in 2000 and 1.85% in 2020) 0.200 |
10.0% |
||
Wetland (3.1% in 2000 and 4.02% in 2020) 0.200 |
10.0% |
||
Grassland (15.98% in 2000 and 14.3% in 2020) 0.200 |
10.0% |
||
Waterbodies (6.04% in 2000 and 6.12% in 2020) 0.200 |
10.0% |
||
Agriculture land status 0.500 |
Arable Crop land (44.48% in 2000 and 58.29%) 0.333 |
16.7% |
|
Permanent crop land (4.1% in 2000 and 5% in 2020) 0.333 |
16.7% |
||
Permanent grassland (15% in 2000 and 14% in 2020) 0.333 |
16.7% |
Other factors that increased include: Built-up land (1.31%), cropland (13.81%), wetland (0.92%) and water bodies (0.08%). The accessibility indicators also revealed that the city residents have no sufficient recreational UGI within the minimum walking 511m distance thresholds. Expansion of built-up environment, density, weak implementation of policies and plans, and lack of priority for UGI development were identified as the major constraints behind the current state of UGI in the city. Decrease in forest land and grassland is a clear justification of land use change and decreased capacity of soil and forest in carbon sequestration.
3.1 Normalized Difference Vegetation Index (NDVI)
Based on the results in Figure 2 on the NDVI which defines the extent of an area’s vegetation cover and / or greenness, it is clear that Twumba sector record the highest vegetation greenness compared to sectors of Karongi district like Mutuntu and Rugabano. The remaining sectors have moderate NDVI values (approximately 0.2 to 0.5).
|

Figure 2. NDVI across sectors of Karongi district.
3.2 Land Use and Land Cover (LULC)
The analysis on land use and land cover in 2000 (Figure 3) indicated that cropland occupied the large part (44.48%) of the land in Karongi district while built-up land or settlement was only 0.54% of the total land of Karongi district.
|

Figure 3. 2000 LULC classes (%) within Karongi district.
Regarding land use classes in 2010, Figure 4 demonstrated that settlements or built-up land increased up to 0.82 percent from 2000 which was 0.54%. In addition, cropland slightly increased up to 44.05% and forestland decreased in 2010 compared to its area in 2000.
|
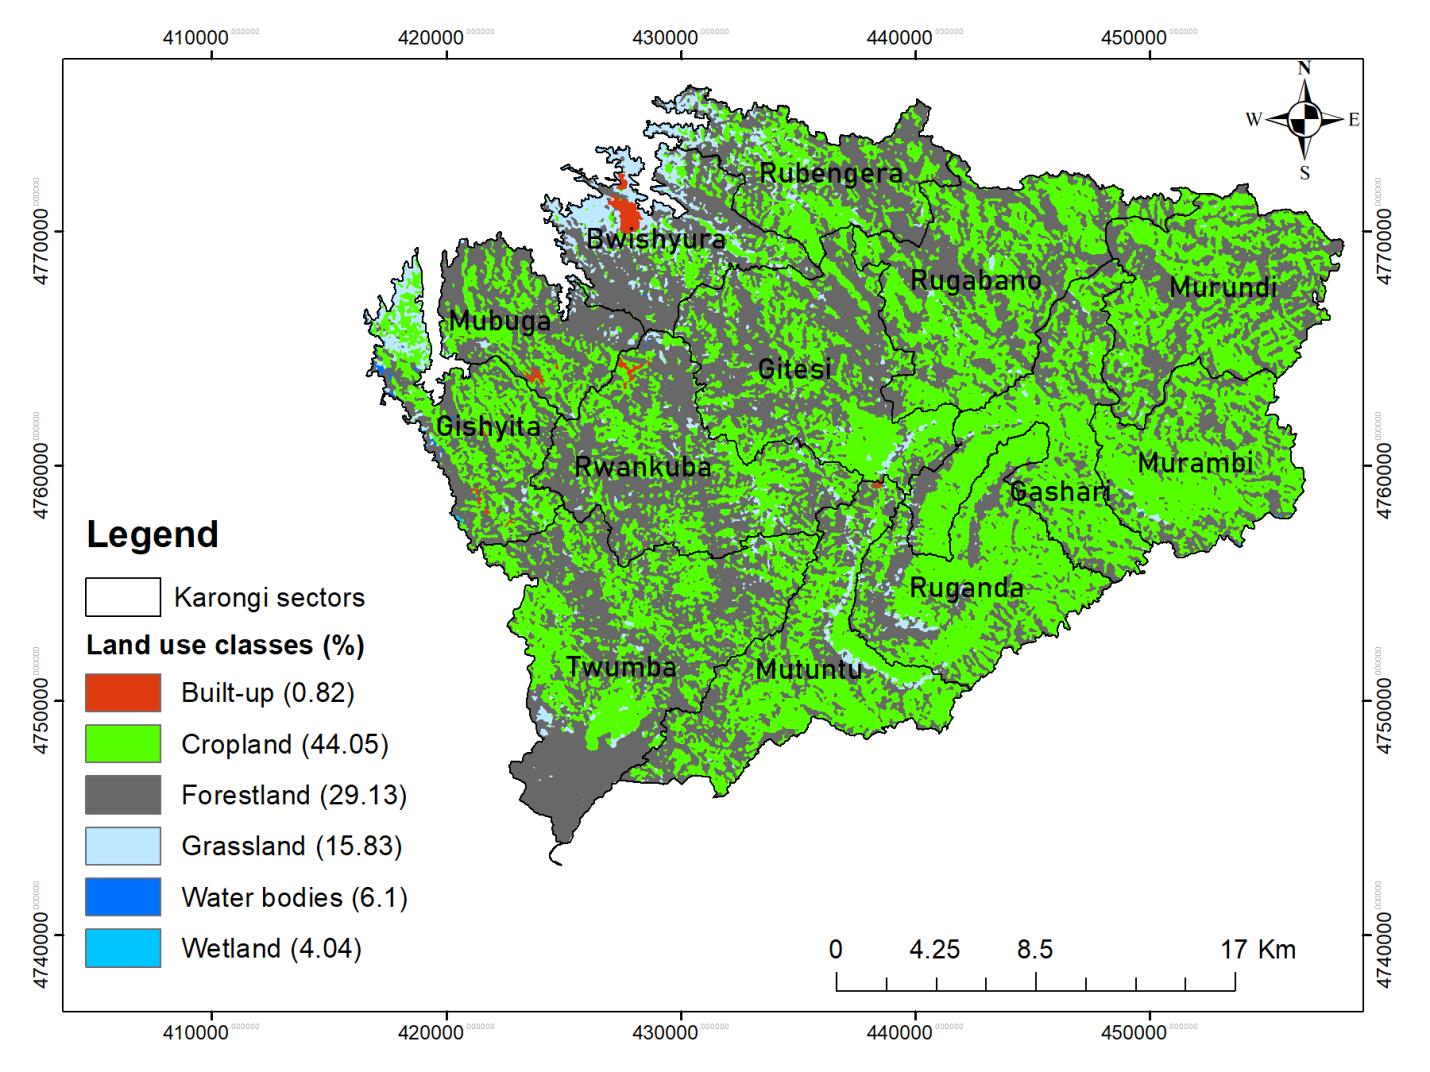
Figure 4. 2010 LULC classes (%) in Karongi district.
As illustrated in Figure 5, the settlement land increased at a high rate compared to previous years considered namely 2000 and 2010. The score of built-up land rose up to 1.85%. Also, cropland expanded up to 58.29% in 2020 which is likely the results of the forestland decrease (15.37% in 2020).
|

Figure 5. 2020 LULC classes (%) for Karongi district.
3.3 Rainfall (mm)
The analysis in Figure 6 showed that in 2000, the rainfall was high within the Twumba and Mutuntu sectors at 160.935mm. The sectors of Murambi, Murundi and Karengera were the ones with low annual mean rainfall of 77.1037mm, respectively.
|
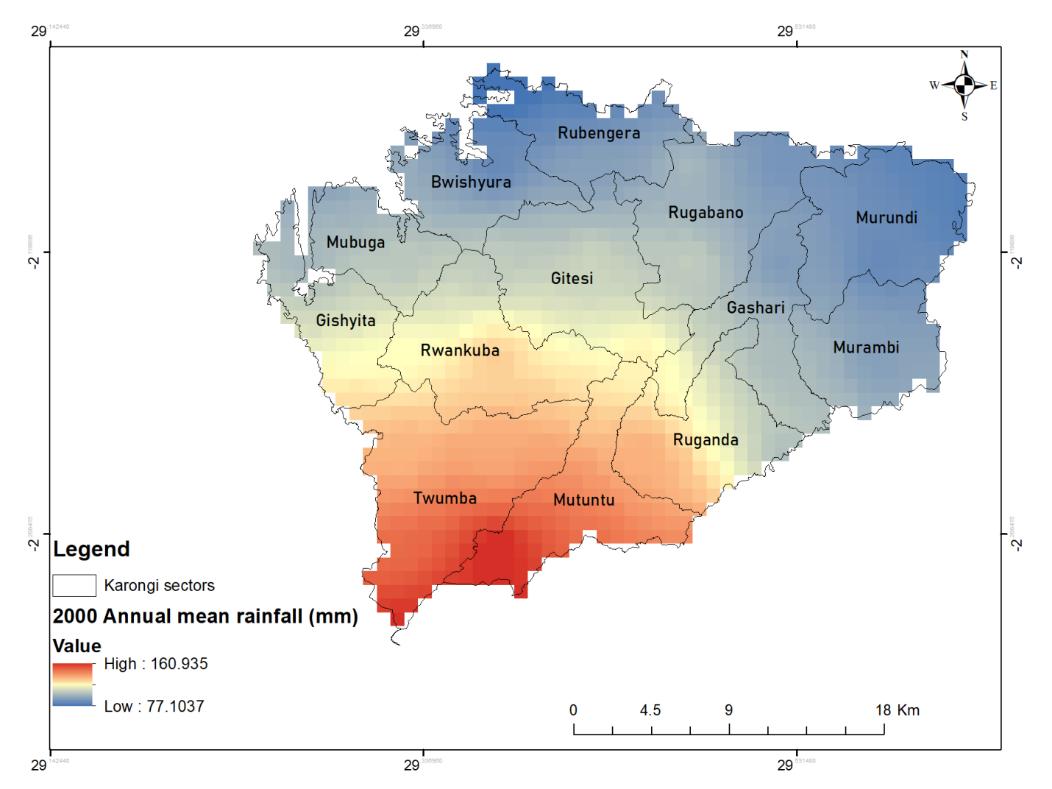
Figure 6. 2000 Annual mean rainfall in sectors of Karongi district.
With reference to Figure 6, the annual mean rainfall distribution in Karongi district recorded a varying image since the Mutuntu sector recorded the highest record (151.761mm) and Mubuga and Bwishyura sectors recorded the lowest value (94.5mm). In addition, the annual mean rainfall of 2010 reduced compared to the record of 2000 (Figure 6).
Finally, as indicated in Figure 8, the rainfall decreased in 2020 compared to the record registered in 2000 and 2010, (Figures 6 and 7) respectively. Also, its distribution is different because Twumba, Rwankuba and Gishyita recorded high rainfall (98.5mm) compared to the areas with high rainfall in previous years (2000 and 2010) (Table 9). However, Murambi and Murundi sectors remain the sectors recording low rainfall similar to 2000 and 2010 as well.
|

Figure 7. 2010 Annual mean rainfall for sectors of Karongi district.
|

Figure 8. 2020 Annual mean rainfall across sectors of Karongi district.
Table 9. Identified GI and Possible Contribution to Climate Change Adaptation
Type of GI |
Dimension |
Location |
Function / Reference |
Green spaces |
2500sqm |
Bwishyura |
Increasing the number and quality of green spaces has the potential to mitigate short-lived climate pollutants that produce a strong global warming effect and contribute significantly to more than 7 million premature air-pollution related deaths annually. (https://www.un.org/en/chronicle/article/green-spaces-invaluable-resource-delivering-sustainable-urban-health) |
Pervious surfaces |
3000sqm |
Bwishyura, Rubengera |
Pervious concrete pavements are normally designed to reduce the runoff water and avoid urban flooding as a stormwater management solution. https://trid.trb.org |
Tree corridors |
6km |
Bwishyura |
- Reduce greenhouse gasses - Allow species to migrate as climate changes - Protect sensitive areas from increased climatic events such as floods and storm surges along coastal areas. - Provide habitat that offers range of microclimate refugia. https://www.fs.usda.gov/nac/buffers/guidelines/2_biodiversity/6.html |
Lake |
60ha |
Bwishyura,Rubengera |
- The Great Lakes modify the local weather and climate. Because water temperatures change more slowly than land temperatures, lake waters gain heat in summer and release heat during cooler months. |
Water channels |
2.5km |
Bwishyura_Rubengera |
- Refer to various measures aimed at controlling surface water runoff. |
Eco friendly hotels & logdes |
5 |
Bwishyura |
- By minimizing heat gains in buildings, green roofs can lower the indoor temperatures by as much as 5°C and consequently reduce the need for cooling and the associated energy use, thus contributing to climate change mitigation and adaptation. |
Conserved forest |
7ha |
Bwishyura |
Forests can be used to strengthen societal adaptation to climate change, as they provide critical ecosystem services, such as wood, non-timber forest products, and watershed hydrological regulation, the values of which are usually underestimated by society (“forests for adaptation”). https://www.profor.info › sites › profor.info› |
4 DISCUSSION
In this study, we examined the status of green infrastructure in Karongi city, change in GI over the last 20 years as well as capacity of GI in climate change adaptation. The status of GI in Karongi City was examined by referring to climate factors like LULC, NDVI, and RAINFALL. Land use / land cover change (LUCC) and climate changes were observed to be responsible for degradation of the ecosystem in the city. Similar findings have been reported by Abd El-Hamid et al.[17] on the effects of land use/land cover and climatic change on the ecosystem of North Ningxia, China. This indicates that there is no close cooperation of GI and Climate change adaptation strategies in the city development and ecological conservation plan with adaptation dimension. Locally, Mlotha[18] recognized that Rwanda does not have National data sets to use as baseline data for stratifying the country to be precise with internationally recognized IPCC Tier 3 category. This would be very useful by stratifying cities when planning for monitoring LUCC.
Furthermore, the percentage of land-covers within land-use categories have been used as primary input for climatic modeling. This has been used to determine the existing adaptive capacity and the future potential based on climatic and planning scenarios[7,19]. Geophysical characteristics of GI in Karongi city in this study (slope degree, elevation, aspect, erosion risks and land capability) dominated the pair-wise comparison of selected criteria at 48.0% while blue and green infrastructures took the second place with 21.9%. In general blue and green infrastructure (buildings, roads, lake, rivers, green space, etc.) are located at slopes varying between 0 and 45 degree at elevation estimated between (1400 and 1700m). At this elevation, the risk of soil erosion is dominant on bare steep hills. On the other side, the land capability is categorized in classes (I, II, III, and V). Therefore, 21.9% can be classified as built environment due to buildings, roads, paths, and other unclassified land uses. Although Karongi city is one of Rwanda’s greenest cities, the challenge is how to fully utilize the ecosystem services potential of Karongi’s green infrastructure and its rural hinterland. This includes extending a green network across parts of Karongi that are currently lacking. Further expansion of the green infrastructure network within the existing city fabric requires integrated urban design strategies and an increasingly multi-functional network of green spaces. This means changes to conventional urban design strategies and changes to the management of built assets and spaces.
The distance to and from blue and green infrastructure varied from 200 to 2500m for the water reservoir, 100 to 1400m for water course, and 50 to 1300m for the green space and recreational area. Accessibility of urban communities to high residential centers is at 57.9%, which indicates a low number of green spaces. Previous research has shown that developers are required by planning policy to actively use green infrastructure such as ensuring new roofs are flat or gently sloped[19]. This kind of central planning policy or local authority development plans could be used to set specific city-wide targets to increase the quantity and quality of green infrastructure, or to make it mandatory to use green infrastructure on developments in parts of Karongi city where there is a low amount of green space compared to other sections.
Land-use and urban planning have suggested a denser and more compact urban form and development[8] as well as changing land uses towards those uses that ameliorate local and regional temperatures, such as open spaces with pervious surfaces[9]. These two ways have been shown to mitigate climate change within urban regions. Moderate NDVI found in Bwishyura and Rubengera sectors of Karongi City indicates that the town is moderately vegetated. Studies have shown that less vegetated surfaces may lead to a decrease in evaporative cooling[20]. Therefore, re-vegetation measures should be undertaken to maintain climate adaptation efforts in Karongi city. Furthermore, the presence of Lake Kivu in the western part of the city provides a contribution in mitigation of Karongi City heat island.
According to Gelan et al.[21], city residents have no access to green spaces from their residences within a walking distance of 300-1000m. The key factors that hinder its accessibility are rapid urban expansion and population growth, violation of the plan, and institutional failure.
Land use land change was also observed where forest and grassland area decreased significantly (P<0.05), 14.38% and 1.68% respectively from 2000 to 2020 in favor of built-up land (1.31%), cropland (13.81%), wetland (0.92%) and water-bodies (0.08%). According to Munsi et al.[22], many developing countries are moving through transition economics, increasing demand for food and energy due to a growing population that has caused deforestation, increase in cropland, and urbanization in the last three centuries. Similar results of decreased forest area and increased crop land have been highlighted in different studies such as Thapa[23]. Land use change is not a preserve of Karongi city alone, Lambin et al.[24] indicated that every country from Asia, Africa, and Europe has faced land use change due to economic and population growth. For the past few decades, land-use change has impacted on climate. The significant contribution is the precipitation cycle at a local and regional level.
GI is inherently a spatial approach to land-use and change planning and design. It has been noted that planning a GI is to lay out a strategically designed system as a whole that ensures integrity of the network[1]. This implies that GI should function across scales and jurisdictions. GI is a suitable suite of measures that have the potential to address climate change impacts. The environmental impacts of climate change such as increased temperatures, run-off storage and infiltration due to extreme precipitation can be potentially managed by multi-scale green infrastructure of patches and corridors. As an ecosystem-based system, green infrastructure in the form of trees, for example, may reduce temperatures within urban contexts. Retarding basins and infiltration swales allow the delay of run-off and infiltration of excess rain water. This synergy renders green infrastructure as an important way to respond to climate impacts.
Over the last 20 years this city expanded, which has affected the land use especially by increasing the built-up land ratio while minimizing the vegetative cover. According to the fourth national climate assessment, changes in land cover continue to impact local to global-scale weather and climate by altering the flow of energy, water, and greenhouse gasses (GHG) between the land and the atmosphere. Although reforestation can foster localized cooling in urban areas, continued warming is expected to exacerbate urban heat island effects. Additionally changes in land cover can occur in response to both human and climate drivers. For example, the demand for new settlements often results in the permanent loss of natural and working lands, which can result in localized changes in weather patterns. Decrease in forest land in Karongi is common countrywide. According to the world bank report 2021, Rwanda’s forests are critical to its environmental sustainability and wider ecosystem health. 64% of the country’s total forest was deforested from 1960 to 2007, however reforestation efforts are reversing these trends. Although LULC in Karongi city is based on the political decision of implementing the city master plan, decisions about land use, cover, and management can help determine society’s ability to mitigate and adapt to climate change. Reducing atmospheric GHG concentrations can, in part, be achieved by increasing the land-based carbon storage[25], as highlighted in this study the forest area has decreased, this has a negative impact on climate.
In this study, we aimed at analyzing the capacity of urban green infrastructure for adaptation to climate change in Karongi city. This work has helped to understand the links between landscapes in various scales and climate change. Green infrastructure has been described as the strategy for landscape planning and design. Climate change is described as important drivers of global change and adaptation to it is about taking actions which will help to reduce the impacts associated with anticipated climate change trends, events, and hazards.
This study revealed the variation in rainfall in Karongi town as well as its neighborhood. Changes in rainfall with increased temperature and increases in floods and droughts is expected to impact food security and water availability as reported by the World Bank in its 2021 report.
The increased variability of rainfall and its variation as well may also result in soil degradation and water logging of crops, thus decreasing yields and increasing food shortage. The trend of climate factors under this study; Built-up land, change in rainfall, decreased NDVI, increased cropland and wetland indicates a disconnection of Green infrastructure multifunctionality and climate change adaptation strategies.
To understand the relationship between climate change adaptation strategy and green infrastructure can be used in setting in a foundation for intelligently and effectively planning, designing and managing green areas as the main fostering part of the ecosystem. Green Infrastructure “is a strategically planned network of natural and semi-natural areas with other environmental features designed and managed to deliver a wide range of ecosystem services[19]. It incorporates green spaces (or blue if aquatic ecosystems are concerned) and other physical features in terrestrial (including coastal) and marine areas. On land, GI is present in rural and urban settings.” Linked together, these strategically planned networks of green elements are able to provide multiple benefits in the form of supporting a green economy, improving quality of life, protecting biodiversity, and enhancing the ability of ecosystems to deliver services such as disaster risk reduction, water purification, air quality, space for recreation and climate change mitigation and adaptation. After analysis of data collected on available green infrastructure and literature review, the researcher found that Multi use of green infrastructure has the potential contribution to climate change adaptation in various scales. It has been observed that climate change as a result of historical emissions of GHG would jeopardize cities[26-28]. In this study, it was observed that there is variation of climate data like rainfall and land use change in Karongi town, whose long-term variation would lead to changes in climate. The deficiency of existing urban systems to cope with the risks resulting from these changes such as floods, droughts, and extreme temperatures should be halted. This would render residents of cities vulnerable to these changes. Therefore, GI has the potential of providing a range of ecosystem services, which is a significant role in helping to combat climate change.
5 CONCLUSION
Land use land change affected the Geophysical characteristics of Karongi city while climate change manifested itself progressively when the ecosystem is disturbed. In this study it was highlighted that the status of GI is not friendly to Karongi city residents, also the change in land use as well as other climate factors impacted a lot on the climate of the city as well as its residents. In general, the status of green infrastructure in Karongi city is complex and Geophysical characteristics (elevation, slope, aspect) are the main determinant and regulators of the city climate conditions. Erosion is driven by stones, steep hills with the occurrence of landslides. Water resources like rivers are accumulating sediments which contribute to water pollution. City residents walk long distances for recreational spaces. The city cannot achieve the sustainable development goals with the issue of access to green spaces as it is one of the crucial aspects of sustainable urban development and has got considerable attention in the global north, although relatively little is known in the global south. Multifunctionality for a GI network needs to take connectivity into account, because connectivity represents the spatial distribution and relations of GI elements and consequently the distribution of benefits they provide. Urban planning should take into consideration those networks of structures with capacity to link gray and green settings and play the multifunctionality role so as it stands for communicative and socially inclusive planning and management.
Acknowledgements
We acknowledge faculty members in Environmental studies at University of Lay Adventists of Kigali for their unwavering support. This manuscript is part of a Master’s degree at UNILAK.
Conflicts of Interest
The authors declared no conflict of interest.
Author Contribution
D'Amour NJ designed the experiment, analyzed data and wrote the manuscript; Nyongesah JM supervised the research and reviewed the manuscript.
Abbreviation List
AHP, Analytic hierarchy process
GHG, Greenhouse gasses
LUCC, Land use / land cover change
NDVI, Normalized difference vegetation index
PCM, Pairwise comparison matrix
References
[1] Murkin K, Shoide N, Shiode S et al. Biodiversity and Recreational Value of Green Infrastructure in England. Sustainability, 2023; 15: 2915.[DOI]
[2] World Bank. World development report 2017: Governace and the law.[DOI]
[3] Chen Y, Gu W, Liu T et al. Increasing the use of Urban Greenways in Developing Cuntries: A case study on Wutong Greenway in Shenzhen, China. Int J Environ Res Public Health, 2017; 14: 554.[DOI]
[4] Bryant MM. Urban landscape conservation and the role of ecological greenways at local and metropolitan scale. Landsc Urban Plan, 2006; 76: 23-44.[DOI]
[5] Bai X, Chen J, Shi P. Landscape urbanization and economic growth in china: positive feedbacks and sustainability dilemmas. Environ Sci Technol, 2012; 46: 132-139.[DOI]
[6] GGGI. National Roadmap for Green Secondary City Development SEOUL GGGI management-time to ‘let someone else have a go’? J Town Country Plan Associat, 2015; 8: 138-141.
[7] Government of Rwanda, GGGI. National roadmap for green secondary cities development. Available at:[Web]
[8] Childers DL, Cadenasso ML, Grove JM et al. An ecology for cities: A transformational nexus of design and ecology to advance climate change resilience and urban sustainability. Sustainability, 2015; 7: 3774-3791.[DOI]
[9] Republic of Rwanda. Green Growth and Climate Resilience-National Strategy for Climate Change and Low Carbon Development. 2011. Available at:[Web]
[10] National Institute Of Statistics Of Rwanda. Integrated Household Living Conditions Survey 6 (EICV6), 2021. Available at:[Web]
[11] Saaty TL. Rank from comparisons and from ratings in the Analytical Hierarchy Network Processes. Eur J Oper Res, 2006; 168: 557-570.[DOI]
[12] Saaty TL. Axiomatic foundation of the analytic hierarchy process. Manag Sci, 1986; 32: 841-855.[DOI]
[13] Saaty TL. An exposition of the AHP in reply to the paper “Remarks on the analytic hierarchy process.” Manag Sci, 1990; 36: 259-268.[DOI]
[14] Apud A, Faggian R, Sposito V et al. Suitability Analysis and Planning of Green Infrastructure in Montevideo, Uruguay. Sustainability, 2020; 12: 9683.[DOI]
[15] Saaty TL. A scaling method for priorities in a hierarchichal structure. J Math Psych, 1977; 15: 234-281.
[16] Perveen S, Arsalan MH, Siddiqui MF et al. ‘GIS-based multi-criteria model for cotton crop land suitability: a perspective from Sindh Province of Pakistan’. FUUAST J Biol, 2013; 3: 31-37.
[17] Abd El-Hamid HT, Caiyong W, Hafiz MA et al. Effects of land use/land cover and climatic change on the ecosystem of North Ningxia, China. Arab J Geosci, 2020; 13: 1-13.[DOI]
[18] Mlotha MAJ. Analysis of Land Use/Land Cover Change Impacts Upon Ecosystem Services in Montane Tropical Forest of Rwanda: Forest Carbon Assessment and REDD+Preparedness. Antioch University, New England. 2018.
[19] Sturiale L, Scuderi A. The Role of Green Infrastructures in Urban Planning for Climate Change Adaptation. Climate, 2019; 7: 119.[DOI]
[20] Sturiale L, Scuderi A. The evaluation of green investments in urban areas: A proposal of an eco-social-green model of the city. Sustainability, 2018; 10: 4541.[DOI]
[21] Gelan E, Girma Y. Urban green infrastructure accessibility for the achievement of SDG 11 in rapidly urbanizing cities of Ethiopia. GeoJournal, 2022; 87: 2883-2902.[DOI]
[22] Munsi M, Malaviya S, Oinam G et al. A landscape approach for quantifying land-use and land-cover change(1976-2006) in middle Himalaya. Reg Environ Change, 2010; 10: 145-155.[DOI]
[23] Thapa P. Spatial estimation of soil erosion using RUSLE modeling: a case study of Dolakha district, Nepal. Environ Syst Res, 2020; 9: 11-10.[DOI]
[24] Lambin EF, Geist HJ, Lepers E. Dynamics of land-use and land-cover change in tropical regions. Annu Rev Environ Resour, 2003; 28: 205-241.[DOI]
[25] Brandão M, Levasseur A, Kirschbaum MUF et al. Key issues and options in accounting for carbon sequestration and temporary storage in life cycle assessment and carbon footprinting. Int J Life Cycle Assess, 2013; 18: 230-240.[DOI]
[26] Ramyar R, Zarghami E. Green infrastructure contribution for climate change adaptation in urban landscape context. Appl Ecol Environ Res, 2017; 15: 1193-1209.[DOI]
[27] Brasil J, Macedo M, Lago C et al. Nature-based solutions and real-time control: challenges and opportunities. Water, 2021; 13: 651.[DOI]
[28] Almaaitah T, Appleby M, Rosenblat H et al. The potential of Blue-Green infrastructure as a climate change adaptation strategy: a systematic literature review. Blue-Green Systems, 2021; 3: 223-248.[DOI]
Copyright © 2023 The Author(s). This open-access article is licensed under a Creative Commons Attribution 4.0 International License (https://creativecommons.org/licenses/by/4.0), which permits unrestricted use, sharing, adaptation, distribution, and reproduction in any medium, provided the original work is properly cited.


