Modelling Willingness to Pay of Electricity Supply Using Machine Learning Approach
Olufemi A Ayansola1, Tayo P Ogundunmade2*, Afolabi O Adedamola1
1Department of Statistics, the Polytechnic of Ibadan, Nigeria
2Department of Statistics, University of Ibadan, Nigeria
*Correspondence to: Tayo P Ogundunmade, Masters, Teaching Assistant, Department of Statistics, University of Ibadan, Oduduwa Road, Ibadan, Oyo 200132, Nigeria; Email: ogundunmadetayo@yahoo.com
DOI: 10.53964/mem.2022009
Abstract
Background: Electricity has long been regarded as a catalyst for enhancing economy growth in developing countries. The availability of electricity can drive a country’s growth by allowing firms to take advantage of it to increase its productivity enhancing technologies, the bulk of which are reliant on electricity.
Objective: In view of the above, this study aims to model the willingness to pay of electricity supply to consumers in southwestern states of Nigeria using machine learning approach.
Methods: The study was conducted in six southwestern states in Nigeria. This data contain information which was obtained through longitudinal survey using a google form questionnaire. The data contains the category of the respondents, type of commercial activity, average daily electricity supplied, willingness to pay of electricity supply per month and so on. K-Nearest Neighbors (KNN), Random Forest, Support Vector Machine (SVM), Decision Tree and Boosting Classification models were considered.
Results: Among the models considered, KNN, SVM and Boosting classification models perform better in classifying whether a consumer is willing to pay for electricity consumption or not.
Conclusion: The information obtained from this research can be used to produce insight into electricity production in the states.
Keywords: electricity tariff, electricity distribution, willingness to pay, supply
1 INTRODUCTION
Power supply in Nigerian has been unstable, inadequate and unreliable. The problem has been attributed to the power sectors inability to generate enough revenue to maintain the system due to under-pricing of electricity service. The industry has not been able to generate enough revenue to cover its operating cost let alone its considerable capital expenditure needs[1]. According to Amadi[2], the incapacity of the electricity industry to provide adequate services was brought on by the lack of a cost-reflective pricing. The Transmission Company in terms of volume, comfort, and consistency. Since the Federal Government wants to turn the power sector over to private operators, cost recovery is now crucial. There is evidence in the literature that inconsistent power supplies cause welfare losses[3]. There is significant relationship between the power supply and willingness to pay of electricity supplied by the consumers of the electricity. The power supply agency need the assurance of the users to be committed to supplying a 24h electricity to a customer. As a result of this, there is need to study the willingness of the users in paying for the electricity supplied.
The majority of researchers whose papers were reviewed, including Adenikinju[4], Adebayo[5] and Amadi[2] were able to analyze the cost of power outages on business in Nigeria while Ellahi[6] also tested the relationship between electricity supply, development of industrial sectors and economic growth. Nevertheless, researchers like Udah[7], Ubi et al.[8], Yaya et al.[9] and Olayemi[10] in their numerous studies have supported the impact of electricity supply and internally produced electricity on business. Although Olayemi[10] in his study highlighted that there might be a major difference between power generation at home and supply from the public grid, he did not fully analyze the relationship between electricity pricing and self-generated electricity. Rioja[11] only observed that there was no difference that was statistically significant between the effect of electricity taxation and self-generated electricity on business performance. All other studies have failed to look into the factors that contributes to the willingness to pay of electricity bills by the consumers. Also, the studies reviewed above have not considered the modern approach of machine learning and Artificial Intelligence to study the factors that exists between the electricity production and the consumers’ willingness to pay for electricity bills. Few studies of real life problems with the use of machine learning algorithms are like Ogundunmade and Adepoju[12,13]. In view of the above, the aim of this study is to model the willingness to pay of the electricity by consumers in the southwestern part of Nigeria and to determine the factors contributing to this willingness to pay. The rest of the paper is structured as follows: Section 2 is the material and methods, section 3 discusses the results and the last section, the conclusion of the study.
2 MATERIAL AND METHODS
2.1 Data Source
The survey was carried out in six south-western states in Nigeria. These states are Oyo, Ogun, Ondo, Osun, Ekiti and Oyo. A google form questionnaire was administered to determine their level of satisfaction to electricity supplied in the areas and their willingness to pay for a 24h electricity supply. A total of 210 responses were obtained in this survey. The response showed 2.0% responses from Ekiti state, 32.0% responses from Lagos state, 16.0% responses from Osun state. 14.0% responses from Ogun state, 2.0% responses from Ondo state and 34.0% responses from Oyo state.
Information on Gender, highest educational level, type of commercial activity, house occupancy status (Landlord or Tenant), occupation and total monthly income of the respondents were extracted from the responses gathered. The willingness to pay was (option: Yes or No) used as the response variable while other variables were used as the features or independent variables.
2.2 Methodology
In this study, five machine learning models were considered and these are the K-Nearest Neighbors (KNN), Random Forest, Support Vector Machine (SVM), Decision Tree and Boosting classification models. These models models are used because of their performance current use in classification analysis. 60% of the data was used for training these models. 20% used for validation and the rest 20% as the testing data. The performance of the models were recorded.
2.2.1 KNN
The KNN algorithm, also known as KNN, is a non-parametric, supervised learning classifier, which uses proximity to make classifications or predictions about the grouping of an individual data point. While it can be used for either regression or classification problems, it is typically used as a classification algorithm, working off the assumption that similar points can be found near one another.
The goal of the KNN algorithm is to identify the nearest neighbors of a given query point, so that we can assign a class label to that point. In order to do this, KNN has a few requirements:
(i) Determine your distance metrics: Euclidean distance
|
(ii) Compute KNN: defining k
The k value in the KNN algorithm defines how many neighbors will be checked to determine the classification of a specific query point. For example, if k=1, the instance will be assigned to the same class as its single nearest neighbor.
2.2.2 SVM
SVM is a supervised machine learning algorithm that can be used for both classification or regression challenges. However, it is mostly used in classification problems. In the SVM algorithm, we plot each data item as a point in n-dimensional space (where n is a number of features you have) with the value of each feature being the value of a particular coordinate. Then, we perform classification by finding the hyper-plane that differentiates the two classes very well.
The objective of the SVM algorithm is to find a hyperplane in an N-dimensional space (N-the number of features) that distinctly classifies the data points. The main goal of SVM is to divide the datasets into classes to find a maximum marginal hyperplane and it can be done in the following two steps:
(i) First, SVM will generate hyper-planes iteratively that segregates the classes in best way.
(ii) Then, it will choose the hyperplane that separates the classes correctly.
2.2.3 Boosting Classification Algorithm
Unlike many ML models which focus on high quality prediction done by a single model, boosting algorithms seek to improve the prediction power by training a sequence of weak models, each compensating the weaknesses of its predecessors. To understand Boosting, it is crucial to recognize that boosting is a generic algorithm rather than a specific model. Boosting needs you to specify a weak model (e.g., regression, shallow decision trees, etc) and then improves it. For a weak classifier C, X: n x d, Y: n x k with sample weights W: n x 1
|
2.2.4 Random Forest Classification Algorithm
Random forest is a supervised learning algorithm which is used for both classification as well as regression. But however, it is mostly used for classification problems. As we know that a forest is made up of trees and more trees means more robust forest. Similarly, random forest algorithm creates decision trees on data samples and then gets the prediction from each of them and finally selects the best solution by means of voting.
It is an ensemble method which is better than a single decision tree because it reduces the over-fitting by averaging the result. We can understand the working of Random Forest algorithm with the help of following steps:
(i) First, start with the selection of random samples from a given data.
(ii) Next, this algorithm will construct a decision tree for every sample. Then it will get the prediction result from every decision tree.
(iii) In this step, voting will be performed for every predicted result.
(iv) At last, select the most voted prediction result as the final prediction result.
2.2.5 Decision Tree Classification Algorithm
A supervised learning method called a decision tree can be used to solve classification and regression problems, but it is typically favoured for doing so.
It is a tree-structured classifier, where internal nodes stand in for a dataset's features, branches for the decision-making process, and each leaf node for the classification result.
The Decision Node and Leaf Node are the two nodes of a decision tree. While Leaf nodes are the results of decisions and do not have any more branches, Decision nodes are used to create decisions and have numerous branches. The given dataset's features are used to execute the test or make the decisions.
2.3 Performance Measures
The performance of the models will be based on these four criteria: Accuracy, Precision, Recall and F1-score. The mathematical expressions for the criteria are discussed below:
|
|
|
|
Where TN means True Negative, TP means True Positive, FN means False Negative and FP means False Positive. These are obtained in the confusion matrix and then be used to compute the performance criteria. The confusion matrix is a performance measurement in machine learning classification problems. It is a 2 by 2 table showing the true positive, true negative, false positive and false negative. When considering multi-class classification, the confusion matrix table takes the size equal to number of class squared.
3 RESULTS AND DISCUSSION
3.1 Presentation of Results
In this section, we present the confusion matrix results for each classification model considered and their performance measures. Table 1 shows the prediction results using the classification models. The train data were used for modelling in each of the classification model. The models developed were then used to forecast for the test data and the prediction results compared with the used data. Table 1 shows the comparison between the forecast results obtained from the models and the test data. Table 2 shows the classification tables for the KNN model, Random forest model, SVM model, Decision Tree and Boosting classification models. Table 3 below shows the performance measure for the models considered.
Table 1. Prediction Results for the Models
Test Data |
K-Nearest Neighbors |
Random Forest |
Support Vector Machine |
Decision Tree |
Boosting |
Yes |
Yes |
Yes |
Yes |
No |
Yes |
Yes |
Yes |
Yes |
Yes |
Yes |
Yes |
Yes |
Yes |
Yes |
Yes |
Yes |
Yes |
Yes |
Yes |
Yes |
Yes |
Yes |
Yes |
Yes |
Yes |
Yes |
Yes |
Yes |
Yes |
Yes |
Yes |
Yes |
Yes |
Yes |
Yes |
Yes |
Yes |
Yes |
Yes |
Yes |
Yes |
Yes |
Yes |
Yes |
Yes |
Yes |
Yes |
Yes |
Yes |
Yes |
Yes |
Yes |
Yes |
Yes |
Yes |
Yes |
Yes |
Yes |
Yes |
Yes |
Yes |
Yes |
Yes |
Yes |
Yes |
Yes |
Yes |
Yes |
Yes |
Yes |
Yes |
Yes |
Yes |
Yes |
Yes |
Yes |
Yes |
Yes |
Yes |
Yes |
Yes |
Yes |
Yes |
Yes |
Yes |
Yes |
Yes |
Yes |
Yes |
Yes |
Yes |
Yes |
Yes |
Yes |
Yes |
Yes |
Yes |
Yes |
Yes |
Yes |
Yes |
Yes |
Yes |
Yes |
Yes |
Yes |
Yes |
Yes |
Yes |
Yes |
Yes |
Yes |
Yes |
Yes |
Yes |
Yes |
Yes |
Yes |
Yes |
Yes |
Yes |
Yes |
Yes |
Yes |
Yes |
Yes |
Yes |
Yes |
Yes |
Yes |
Yes |
Yes |
Yes |
Yes |
Yes |
Yes |
Yes |
Yes |
Yes |
Yes |
Yes |
Yes |
Yes |
Yes |
Yes |
Yes |
Yes |
Yes |
Yes |
Yes |
Yes |
Yes |
Yes |
Yes |
Yes |
Yes |
Yes |
Yes |
Yes |
Yes |
Yes |
Yes |
Yes |
Yes |
Yes |
Yes |
Yes |
Yes |
Yes |
Yes |
Yes |
Yes |
Yes |
Yes |
Yes |
Yes |
Yes |
Yes |
Yes |
Yes |
Yes |
Yes |
Yes |
Yes |
Yes |
Yes |
Yes |
Yes |
Yes |
Yes |
Yes |
Yes |
Yes |
Yes |
Yes |
Yes |
Yes |
Yes |
Yes |
Yes |
Yes |
Yes |
Yes |
Yes |
Yes |
Yes |
Yes |
Yes |
Yes |
Yes |
Yes |
Yes |
Yes |
Yes |
Yes |
Yes |
No |
Yes |
Yes |
No |
No |
No |
No |
No |
No |
Yes |
No |
No |
No |
Yes |
No |
Yes |
No |
Table 2. Confusion Matrix for K-Nearest Neighbors, Random Forest, Support Vector Machine, Decision Tree, and Boosting Classification
|
|
Predicted |
|
No |
Yes |
||
K-Nearest Neighbors |
|
|
|
Observed |
No |
2 |
0 |
Yes |
0 |
37 |
|
Random Forest |
|
|
|
Observed |
No |
1 |
0 |
Yes |
0 |
38 |
|
Support Vector Machine |
|
|
|
Observed |
No |
2 |
0 |
Yes |
0 |
37 |
|
Decision Tree |
|
|
|
Observed |
No |
1 |
1 |
|
Yes |
2 |
35 |
Boosting Classification |
|
|
|
Observed |
No |
3 |
0 |
Yes |
0 |
36 |
|
Table 3. Evaluation Matrix
Level |
KNN |
Random Forest |
SVM |
Decision Tree |
Boosting |
Accuracy |
1.000 |
0.974 |
1.000 |
0.923 |
1.000 |
Precision (Positive Predictive Value) |
1.000 |
0.975 |
1.000 |
0.939 |
1.000 |
Recall (True Positive Rate) |
1.000 |
0.974 |
1.000 |
0.923 |
1.000 |
False Positive Rate |
0.000 |
0.250 |
0.000 |
0.277 |
0.000 |
False Discovery Rate |
0.000 |
0.013 |
0.000 |
0.347 |
0.000 |
F1 Score |
1.000 |
0.970 |
1.000 |
0.930 |
1.000 |
Matthews Correlation Coefficient |
1.000 |
0.698 |
1.000 |
0.369 |
1.000 |
Area Under Curve (AUC) |
1.000 |
1.000 |
1.000 |
0.723 |
0.972 |
Negative Predictive Value |
1.000 |
0.987 |
1.000 |
0.653 |
1.000 |
True Negative Rate |
1.000 |
0.750 |
1.000 |
0.723 |
1.000 |
False Negative Rate |
0.000 |
0.250 |
0.000 |
0.277 |
0.000 |
False Omission Rate |
0.000 |
0.013 |
0.000 |
0.347 |
0.000 |
Threat Score |
∞ |
9.750 |
∞ |
4.475 |
∞ |
Statistical Parity |
1.000 |
1.000 |
1.000 |
1.000 |
1.000 |
3.2 Discussion
Table 2 shows the confusion matrix for the models used. For KNN Classification model, 2 observed No and 37 Yes options were classified correctly. Random Forest Classification model had 1 observed No classified correctly, 1 No classified as Yes, 1 Yes classified as No and 36 Yes options correctly classified. For the SVM Classification model, 2 observed No and 37 Yes options were classified correctly. Random Forest Classification model had 1 observed No and 38 Yes options classified correctly. The Decision Tree Classification model also had 1 observed No classified correctly, 1 No classified as Yes, 2 Yes classified as No and 35 Yes options correctly classified. Lastly, Boosting Classification had 2 observed No and 37 Yes options correctly classified.
Table 3 above shows the performance measures for the five models considered. The result shows that KNN, SVM and Boosting classification models have same model performance for the accuracy, precision, Recall and F1-score values as 100%. This shows good performance of these models in predicting the willingness of the consumers on payment of electricity consumption. Random Forest model produced 97.4% accuracy, 97.5% precision, 97.4% Recall value, 97.0% F1 score and Decision Tree models produced 92.3% accuracy, 93.9% precision, 92.3% Recall value, 93.0% F1 score value. Looking at the performance of KNN, SVM and Boosting classification models under the AUC performance, KNN and SVM produced 100% performance, while Booting produced 97.2%.
Figure 1 shows the feature importance using Boosting classification models. It shows that, The monthly income of the consumers takes 30.648 percentage determination on whether the consumer will be willingly to pay for electricity consumption. Occupation takes 28.57%, House occupancy status (Landlord or Tenant) determines 16.964%, type of commercial activity determines 10.469%, highest educational determines 9.046% and gender determines 4.3%.
|
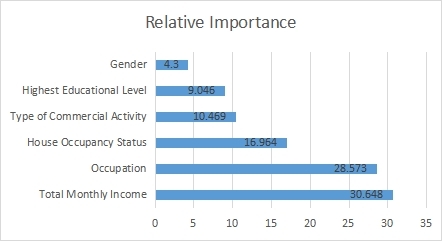
Figure 1. Feature importance using boosting classification.
4 CONCLUSION
In this work, we have been able to determine the machine learning models which are best in determining the willingness to pay of the electricity by the consumers in southwestern states of Nigeria. The study was able to deduce that, out of the five models considered, KNN, SVM model and Boosting classification model perform better compare to other models as they deliver 100 percent accuracy and F1-score performance of the models using this data. Also, we have been able to see that, in determining this willingness to pay, factors such as the monthly income of the respondent is to be considered, and other factors like, occupation, House occupancy status, type of commercial activity, highest educational level and gender of the respondent. These models can be used to study for other regions and even, more machine learning models can be considered too. The information revealed in this research will help the government and the private sectors in the production and supply of electricity to the southwestern states of Nigeria as electricity can be supplied 24h with the assurance or not that the people supplied this electricity are willing to pay for the electricity.
Acknowledgements
The authors hereby wish to thank the Tertiary Education Trust Fund (TETFUND) for the funding received for this research, under the category of Institutional Based Research (IBR).
Conflicts of Interest
The data collected in this study do not involve experiments, or human sample, neither does it violate privacy. All respondents willingly participated in the study.
Author Contribution
Ogundunmade TP, conceptualization, methodology, writing. Ayansola OA writing, reviewing and editing. Adedamola AO, Data curation, writing.
Abbreviation List
KNN, K-Nearest Neighbors
SVM, Support Vector Machine
AUC, Area under curve
References
[1] NERC. Draft Health And Safety Code. Accessed 2022. Available at https://nerc.gov.ng/index.php/library/documents/Draft-Documents/Draft-Health-and-Safety-Code-2013.pdf
[2] Amadi S. Absence of Cost Effective Tariff Led to the Failure of Power Sector NERC. 2012.
[3] Zuberi J. Estimating the Cost of Power Outages for Large Scale Manufacturing Firms [doctor’s thesis]. Berkeley, USA: University of California; 2012.
[4] Adenikinju AF. Analysis of the cost of infrastructure failures in a developing economy: The case of the electricity sector in Nigeria. The Regal Press Kenya, Ltd: Nairobi, Kenya, 2005.
[5] Adebayo I. The limits of privatization in a developing economy. Privatization of public enterprises in Nigeria. Ibadan: Nigeria Economic Society Seminar Series, 2010.
[6] Ellahi N. Testing the relationship between electricity supply, development of industrial sector and economic growth: An empirical analysis using time series data for Pakistan. Int J Manage Sci Eng Manage, 2011; 6: 272-277. DOI: 10.1080/17509653.2011.10671173
[7] Udah EB. Industrial development, electricity crisis and economic performance in Nigeria. Eur J Econ Financ Admin Sci, 2010; 18: 105-121.
[8] Ubi PS, Effiom L, Okon EO et al. An econometric analysis of the determinants of electricity supply in Nigeria. Int J Bus Admin, 2012; 3: 72.
[9] Yaya OOS, Abu N, Ogundunmade TP. Economic policy uncertainty in G7 countries: evidence of long-range dependence and cointegration. Econ Chang Restruct, 2021; 54: 541-556. DOI: 10.1007/s10644-020-09288-3
[10] Olayemi SO. Electricity crisis and manufacturing productivity in Nigeria. Dev Country Stu, 2012; 2: 16-21.
[11] Rioja FK. The penalties of inefficient infrastructure. Rev Dev Econ, 2003; 7: 127-137. DOI: 10.1111/1467-9361.00180
[12] Ogundunmade TP, Adepoju AA. The performance of artificial neural network using heterogeneous transfer functions. Int J Data Sci Anal, 2021; 2: 92-103. DOI: 10.18517/ijods.2.2.92-103.2021
[13] Ogundunmade TP, Adepoju AA. Modelling liquefied petroleum gas prices in nigeria using time series machine learning models. Mod Econ Manag, 2022; 1: 5. DOI: 10.53964/mem.2022005
Copyright © 2022 The Author(s). This open-access article is licensed under a Creative Commons Attribution 4.0 International License (https://creativecommons.org/licenses/by/4.0), which permits unrestricted use, sharing, adaptation, distribution, and reproduction in any medium, provided the original work is properly cited.


