Regression Analysis of the Factors Responsible for Live Birth and Maternal Mortality in Oyo State, Nigeria
Olubukola A Adesina1, Toyin O Oguntola1*, Tayo P Ogundunmade2*, Yemisi O Akinlade3, Adeyinka S Ogunsanya4
1Department of Statistics, Ladoke Akintola University of Technology, Ogbomoso, Nigeria
2Department of Statistics, University of Ibadan, Ibadan, Nigeria
3Department of Statistics, The Polytechnic, Ibadan, Nigeria
4Department of Statistics, University of Ilorin, Ilorin, Nigeria
*Correspondence to: Toyin O Oguntola, Lecturer, Department of Statistics, Ladoke Akintola University of Technology, Old Oyo/ Ilorin Rd, Ogbomoso 210214, Nigeria; Email: toyeni@yahoo.com
Tayo P Ogundunmade, Masters, Teaching Assistant, Department of Statistics, University of Ibadan, Oduduwa Road, Ibadan, Oyo 200132, Nigeria; Email: ogundunmadetayo@yahoo.com
DOI: 10.53964/mem.2022007
Abstract
Background: The changes in the size of the population take a systemic pattern of variation at different periods of demographic studies.
Objective: This study examines the demographic analysis using different regression estimators to determine the effect of live births and factors responsible for maternal mortality in Oyo State.
Methods: Analysis of child state of birth such as cephalic presentation, twin, stillbirth, triplet, and prematurity was carried out using discrete regression estimators (negative binomial (NB) regression, zero-inflated regression, poisson regression, and quasi-poisson regression) to determine the factors responsible for live birth and maternal mortality in the state. Level of significance of 5% was used to authenticate the results.
Results: The result revealed that cephalic presentation, triplet, and prematurity significantly contributed to live birth at 5%. In contrast, estimated results showed that twin, stillbirth, and triplet states of a child contributed positively to the maternal mortality at 5% level of significance.
Conclusion: The log-likelihood function of all the four models were performed and compared, hence the NB regression fitted the maternal mortality better, while quasi poisson regression model fitted the live birth data better. Therefore, the childbirth state of delivery statistically determines factors responsible for both live births and maternal mortality in Oyo State.
Keywords: live birth, maternal mortality, negative binomial regression, zero-inflated regression, poisson regression, discrete
1 INTRODUCTION
Knowledge of population changes is essential to government agencies and planning organizations to estimate national and local needs in education, employment, health services, housing, social security, and defense. Demographic data comes from census or survey to determine size and composition from vital registration to determine changes. Therefore, we seek to know the level of performance in some form of behavior in the population for the birth and death rate, the changes in the level of performance during some period of observation, and the examination of patterns of variation with the population. The changes in the size and structure of the population are determined by three demographic variables vis-a-vis fertility, mortality, and migration. Fertility refers to the actual reproductive performance of a population. Fertility may measure in relation to the father as well as the mother or couple. The event of birth involve both the child and the parents of the measuring fertility, and the characteristics of both child and parent are considered jointly; on the other hand, death occurs in an individual only.
Globally, birth rates are declining much lower than the 2.1 replacement fertility rate, particularly in the majority of developing countries and as well as developed countries, and this is regarded as a crucial problem in terms of economic growth, political challenges, cultural stability, and other factors[1]. In Taiwan region, the criteria of live birth follow the definition set by the WHO, which is “the complete extraction or expulsion from its mother of a product of conception, regardless of how long the pregnancy was, following such separation, breathes or otherwise displays evidence of life for instance, beating of heart, the umbilical cord pulsing or a distinct voluntary muscle movement whether or not the umbilical cord has been cut or the placenta is attached”. Each product of such a birth is considered live born[2].
Gil-Gonalez et al.[3] reported that the primary reasons for maternal deaths obstructed labor, unsafe abortions, and hemorrhage were under-reported in scientific studies published between 2000 and 2004. The majority of the studies under consideration were cross-sectional, conducted in developed nations without the involvement of researchers from developing nations, where maternal mortality was higher. The maternal mortality ratio (MMR) in developed countries (such as Norway, Sweden, and the United Kingdom) ranges from 5.4 to 12 per 100,000 live births, whereas middle-income countries such as Mexico and Honduras report 106 and 280 maternal deaths per 100,000 live births, respectively. An American study that revealed a maternal mortality ratio of only 5.5 per 100,000 births provided evidence in support of this. According to studies, Africa has a maternal mortality rate that ranges from 414 to 2151 per 100,000 live births. The main reasons were poor quality of medical care, the prevalence of infectious diseases, and high fertility rates.
Hill et al.[4] reveal that there were 900 maternal deaths worldwide between 1990 and 2005, with Asia and Sub-Saharan Africa having 45% and 50% of the cases, respectively. Although maternal mortality was decreasing globally by 2.5%, Sub-Saharan Africa, where the status quo was maintained, was exempt from the decline. The causes of this change depend on where you are, and such specific studies must be initiated for further clarification.
Normal birth has become overly "medicalized" and higher rates of normal birth correlate with conception-related beliefs, the use of evidence-based practices, and teamwork. Mortality is among the elements of population change measured by relating death in a given period of time to the total population at risk. This type of population could be distinguished by sex, occupation, age, income, information on mortality levels, trends, and differentials useful for the demographic assessment of the population. In many societies, maternal mortality is a crippling medical complication. It is now known that complications related to childbirth and pregnancy are the main reasons why women in reproductive age pass away[5].
By dissecting its causes and analyzing Nigeria's maternal health care system, Olonade et al.[6] concentrated on critical maternal mortality issues. Maternal mortality a death associated with pregnancy may be preventable, but it has continued to rise in many nations, particularly in Sub-Saharan African nations, for reasons including poor socioeconomic development. Bale et al.[7] review that the available statistics of low birth weight, prematurity, and birth defect shows the current knowledge and practices of a healthy pregnancy, detect cost-effective opportunities for improving birth outcomes and support families with an infant handicapped by birth problems. They pointed out the millennium declaration includes two goals that are relevant to maternal and perinatal conditions by setting targets of lowering child mortality and improving maternal health associated with adverse birth outcomes.
Mairiga et al.[8] conducted a study to examine the community's knowledge and perceived implications of maternal mortality and morbidity population-based qualitative study which took place in two urban and two rural communities in Borno state, Nigeria. The main direct causes of maternal mortality were found to be Medical, Socio-economic and cultural and misconceptions, in which there were many implications narrated by the respondents. Various suggestions were made to improve on the poor maternal health in the areas.
Onatunji and Adesina[9] investigated infant and child mortality risk factors in Nigeria, where the mother's age and other specific covariates such as educational level, household income level, residence type and place of delivery were treated as categorical data. It was evident from their results that there is an increased risk of infant and child mortality in the place of delivery. Because of this, the focus of efforts to advance international development has remained primarily on issues related to pregnancy and childbirth complications. This is amply demonstrated by the fact that the fifth millennium development goal (MDG), which was slated for completion by the year 2015, specifically names improved maternal health and safety as a target. system, with a weak social structure as one of the contributing factors. Other areas like machine learning models and artificial intelligence approaches are to be considered for further study on this work as done in some research[10-14].
The state of childbirth during pregnancy and maternal is a serious concern to the government and all interested stakeholders, and as such, it has become a vital issue for research. This study, therefore, aims to unravel the effect of live birth and factors responsible for maternal mortality in Oyo State, Nigeria. The improvement of the care provided to pregnant women in Nigeria cannot be overemphasized, as it is an essential part of sustainable development.
2 MATERIALS AND METHODS
The data used for this study was collected from Adeoyo Maternity Teaching Hospital, Yemetu, Ibadan. It is documentary data that was prepared or ready-made information; hence, the data set used in this study is Secondary Data. Maternity Teaching Hospital, established in 1928, serves as a referral health centre for many primary health centres and private clinics in all LGAs. The hospital has the department of obstetrics and gynaecology with two consultants and medicals, senior medical and principal medical officers. One of the main aims of establishing this hospital is to improve maternal health care, which is included in MDGs. The analyses used in the study are carried out using four regressions namely, zero inflated negative regression (ZINR), negative binomial (NB) regression, poisson regression, and quasi-poisson regression.
2.1 Generalized Linear Model (GLM)
The GLM is a larger class of models popularized by McCullagh and Nelder[15]. In the GLM, the response variable y is assumed to follow an exponential family distribution with the mean μi which is assumed to be some (often nonlinear) function of xiTβ. Examples of GLM considered in this study are NB regression, zero-inflated negative binomial (ZINB) regression, poisson regression, and quasi poison regression models. We consider two response variables, live birth and maternal mortality. Each of the response variables is a binary indicator variable. In other words, NB regression, ZINR, poisson regression, and quasi-poisson regression are all GLM. The following are the count assumption of GLM.
2.1.1 Poisson Regression Model
Poisson regression model, yi ~ Poi(μi) for i=1,…N where the expected count of
yi=E(μ)=μi=exp(α+βx+log(t))=(t)exp(α)exp(βx)
The model is then defined as
|
|
|
where μ is the mean incidence rate of the response variable, explanatory variables xi are the demographic variables. The log(t) is described as an offset which is an adjustment term and a group of observations may have the same offset, or each individual may have a different value of t. log(t) is an observation and will change the value of estimated counts.
2.1.2 The NB Regression Model
The NB regression model for live birth and maternal mortality yi ~ NB (μi) i=1,…N, usually used when there is over-dispersion. Thus, the NB regression model is then defined as follows:
|
To relate the time of exposure (t) with the set of k independent variables (x's), the mean of y can be written as
|
Where β1, β2,..., βk is the regression coefficients which are unknown and to be estimated from the dataset.
|
|
The parameter μ is the mean incidence rate of the response variable, live birth and maternal mortality per unit of exposure measured monthly and v as a scale parameter. Explanatory variables xi are the demographic variables.
2.1.3 The ZINB Regression Model
The ZINB and NB regression are similar, except that excess zero exist in the former. In ZINB, the distribution of the data is combination of binomial and log it distribution. There are two possible cases for both live birth and maternal mortality. If case 1 occurs, the count will be zero and it’s associated with probability π. Furthermore, if case 2 occurs, counts (including zeros) are generated according to the NB model with probability 1-π. Then, we express the probability distribution of the ZINB random variable yi as
|
where πi denote the logistic link function and g (yi) is the NB distribution in section 2.1.2.
Thus, the logistic link function of πi is written as
|
The logistic component includes an exposure time t measured monthly and a set of demographic variables. The exposure time t with a set of k regressor can be related as
|
2.1.4 Quasi-poisson Regression Model
In the quasi-poisson model, the variance is assumed to be the mean multiplied by a dispersion parameter. Therefore, the quasi-poisson regression model can consider the over dispersion in data, a common characteristic in live birth and maternal mortality study. For assumed i.i.d. live birth and maternal mortality frequency N1,N2,...,Nm during the durational birth process, where Ni is the number of live birth and maternal mortality for monthly registration.
|
Quasi regression model defined on log link function is
|
3 RESULTS AND DISCUSSION
We present the analysis of the data set. The figure presents the monthly distribution for the live birth, maternal mortality, live birth for the male and live birth for the female respectively. The modeling of both the live birth and maternal mortality were four regressions namely: ZINR, NB model, poisson regression and quasi-poisson regression were used.
Figure 1A shows the monthly distribution of the live birth for Adeoyo Maternity Teaching Hospital, Yemetu, Ibadan from 2010 to 2018. The combined density plot shows in April, the highest live birth cases are reported at Adeoyo Hospital. Figure 1B shows the monthly distribution of the Maternal Mortality case at Adeoyo Maternity Teaching Hospital, Yemetu, Ibadan from 2010 to 2018. The combined density plot shows that the lowest Maternal Mortality cases were reported in August at Adeoyo Hospital. It also shows the decrease in the maternity cases reported as the year goes by. Figure 1C shows the monthly distribution of the live birth for the male case at Adeoyo Maternity Teaching Hospital, Yemetu, Ibadan from 2010 to 2018. The combined density plot shows that in April, the highest live birth male cases are reported at Adeoyo Hospital. Figure 1D shows the monthly distribution of the live birth for female cases at Adeoyo Maternity Teaching Hospital, Yemetu, Ibadan from 2010 to 2018. The combined density plot shows that in April, the highest live birth female cases are reported, although there is not much difference in the occurrence of live birth for females in the other months.
|
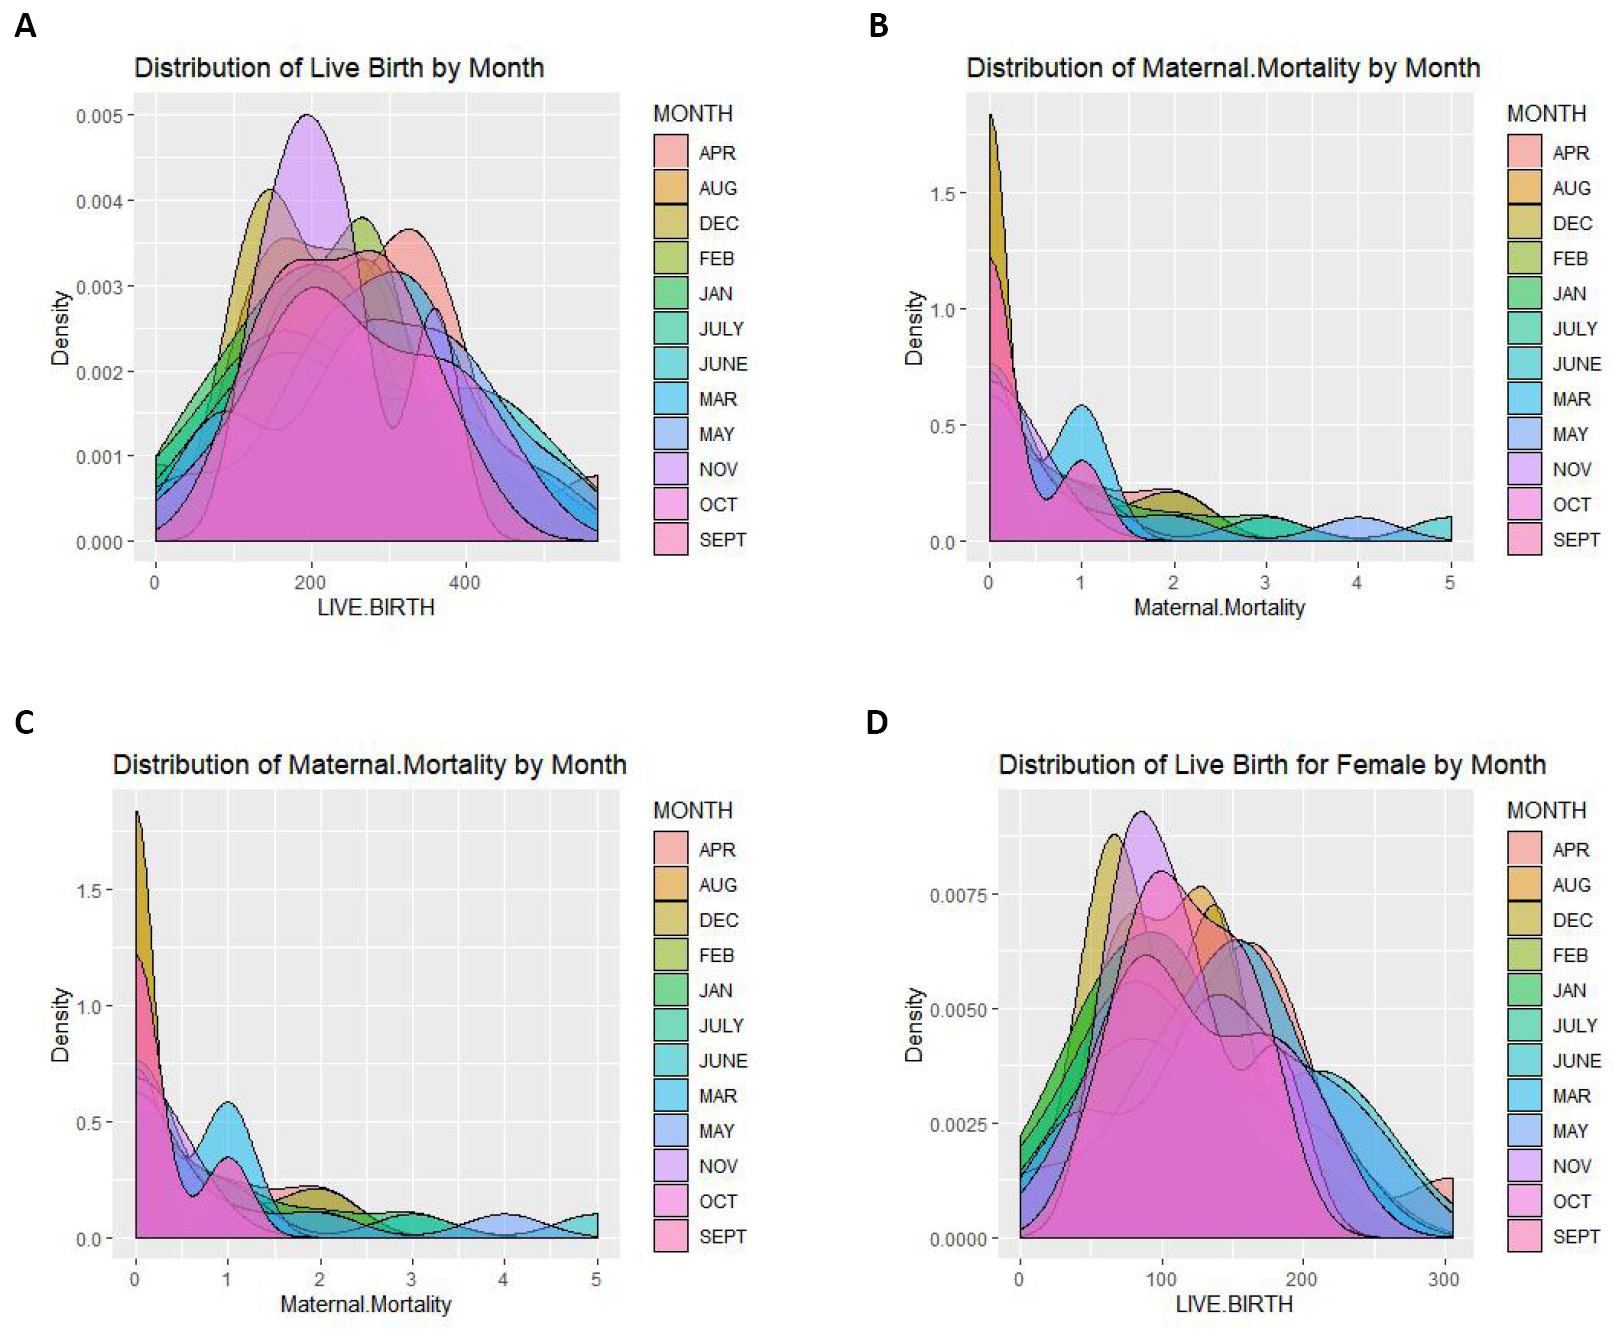
Figure 1. Monthly distribution at Adeoyo Maternity Teaching Hospital, Yemetu, Ibadan from 2010 to 2018. A: Distribution of live birth; B: Distribution of maternal mortality; C: Distribution of the live birth for the male; D: Distribution of live birth for female.
3.1 Modelling Live Birth and Maternal Mortality
Four count data models were used to model the live birth and maternal mortality data obtained at Adeoyo Hospital, Yemetu, Ibadan, to determine demographic variables responsible for child and maternal mortality during the birth process. The models considered are the NB regression model, the zero inflated regression model, the Poisson model and the quasi-poisson model.
3.2 Model Performance for Maternity and Live Births
The performance of the four count data models is discussed below. The models are the NB regression model, the zero inflated regression model, the poisson model and the quasi poisson model.
3.3 Discussion of the Study
This study applies different regression estimators to determine the effect of live births and factors responsible for maternal mortality in Oyo State. Analysis of child state of birth such as cephalic presentation, twin, stillbirth, triplet, and prematurity was carried out using discrete regression estimators. Table 1 shows the regression coefficients, standard errors and computed P-values of demographic factors, breech, cephalic, twin, stillbirth, triplet, and prematurity at 0.05 level of significance. The results reveal that breech, cephalic presentation and twin significantly contribute to child live birth with P-values of 0.00808, 0.00135 and 0.00325 respectively. By default, the output shows estimated coefficients, standard errors, values for the Wald test and associated P-values, but no confidence intervals. Table 2 shows the regression coefficients, standard errors and computed P-values of demographic factors, breech, cephalic presentation, twin, stillbirth triplet, and prematurity at 5% level of significance of maternal mortality using NB regression. From the table below, it could be deduced that breech, stillbirth and prematurity significantly contributed to maternal mortality with P-values of 0.000777, 0.002582 and 0.004249 respectively. Table 3 shows the regression coefficients, standard errors and computed P-values of demographic factors, breech, cephalic presentation, twin, stillbirth triplet, and prematurity at 0.05 level of significance using zero-inflated regression. It could be deduced that cephalic, twin, triplet and prematurity significantly contributed to live birth with p-values of 4.64e-05, 0.000111, 0.004635 and 0.000567 respectively. Table 4 shows the regression coefficients, standard errors, and computed P-values of demographic factors, breech, cephalic presentation, twin, stillbirth triplet, and prematurity at 95% level of significance of maternal mortality using zero-inflated regression. From the table, it could be deduced that breech, cephalic presentation, twin, still birth, and prematurity significantly contributed to maternal mortality with P-values of 0.001821, 0.003981, 0.004619, 0.001204 and 0.004522 respectively. Table 5 shows the regression coefficients, standard errors and computed P-values of demographic factors, breech, cephalic, twin, stillbirth triplet, and premature at 0.05 level of significance. The result shows that cephalic, triplet, and prematurity significantly contributed to live birth with P-values 7.58e-09, 2.45e-05 and 0.004581 respectively. Table 6 shows the regression coefficients, standard errors, and computed P-values of demographic factors, breech, cephalic presentation, twin, stillbirth triplet, and prematurity at 5% level of significance of maternal mortality using poisson regression. The result shows that twin, stillbirth and triplet significantly contributed to maternal mortality with P-values of 0.004354, 2e-16 and 0.001521 respectively. Table 7 shows the regression coefficients, standard errors and computed P-values of demographic factors, breech, cephalic presentation, twin, stillbirth, triplet, and prematurity at 0.05 level of significance. The result shows that cephalic, triplet and prematurity significantly contributed to live birth with P-values of 3.52e-05, 0.002805 and 0.000867 respectively. Table 8 shows the regression coefficients, standard errors and computed P-values of demographic factors, breech, cephalic presentation, twin, stillbirth triplet, and prematurity at 95% level of significance of maternal mortality using quasi-poisson regression. The result shows that twin, stillbirth and triplet significantly contributed to maternal mortality with P-values of 0.002236, 0.000251 and 0.004150 respectively. Table 9 shows the model performance for the four considered models using the maternal mortality and live birth data. The table shows the log likelihood results for the models. In order to determine the model that best captured the maternal mortality data and the live birth data, we choose the model with the minimum log likelihood value. This implies that NB regression best captured the maternal mortality and quasi poisson regression model best captured the live birth data as they produced log likelihood values of -163.156 and -1,724.01 respectively. Figure 2 below shows the bar plot of the log likelihood estimates.
Table 1. Negative Binomial Regression for Live Birth Data
Coefficients |
Estimate |
Std. Error |
Z value |
Pr(>|z|) |
Intercept |
4.862208 |
0.073583 |
66.078 |
<2e-16*** |
Breech |
0.053085 |
0.020043 |
2.649 |
0.00808** |
Ceph |
0.003174 |
0.102477 |
0.031 |
0.00135** |
Twin |
0.032582 |
0.011070 |
2.943 |
0.00325** |
Still Birth |
0.038527 |
0.012021 |
3.205 |
0.97529 |
Triplet |
-0.008751 |
0.044988 |
-0.195 |
0.84576 |
Premature |
0.005819 |
0.051069 |
0.114 |
0.90929 |
Table 2. Negative Binomial Regression for Maternal Mortality Data (2010-2018)
Coefficients |
Estimate |
Std. Error |
Z value |
Pr(>|z|) |
Intercept |
-2.35451 |
0.40047 |
-5.879 |
4.12e-09*** |
Breech |
0.23486 |
0.06988 |
3.361 |
0.000777** |
Cephalic |
0.23324 |
0.29045 |
0.803 |
0.421972 |
Twin |
0.02609 |
0.04218 |
0.618 |
0.536272 |
Still Birth |
0.04158 |
0.04663 |
0.892 |
0.002582** |
Triplet |
0.03678 |
0.17160 |
0.214 |
0.830266 |
Premature |
0.41317 |
0.19623 |
2.105 |
0.004249** |
Deviance residuals |
||||
Min |
1Q |
Median |
3Q |
Max |
-1.6907 |
-0.5160 |
-0.5160 |
-0.4291 |
2.2481 |
Table 3. Zero Inflated for Live Birth Data (2010-2018)
Coefficients |
Estimate |
Std. Error |
Z value |
Pr(>|z|) |
(Intercept) |
4.930691 |
0.058075 |
84.902 |
<2e-16*** |
Breech |
0.048359 |
0.014030 |
3.447 |
0.494931 |
Cephalic |
0.023957 |
0.074065 |
0.323 |
4.64e-05** |
Twin |
0.030897 |
0.007996 |
3.864 |
0.000111** |
Still Birth |
0.033617 |
0.008254 |
4.073 |
0.730370 |
Triplet |
0.023536 |
0.034414 |
0.684 |
0.004635** |
Premature |
-0.012734 |
0.036963 |
-0.345 |
0.000567** |
Pearson residuals: |
|
|
|
|
Min |
1Q |
Median |
3Q |
Max |
-1.91786 |
-0.53121 |
0.07196 |
0.44861 |
2.97467 |
Table 4. Zero Inflated for Maternal Mortality Data (2010-2018)
Coefficients |
Estimate |
Std. Error |
Z value |
Pr(>|z|) |
(Intercept) |
-0.39050 |
0.56726 |
-0.68 |
0.491231 |
Breech |
0.08771 |
0.06571 |
1.3358 |
0.001821** |
Cephalic |
0.02851 |
0.22347 |
0.128 |
0.003981** |
Twin |
0.03802 |
0.04230 |
0.899 |
0.004619** |
Still Birth |
-0.03596 |
0.04265 |
-0.843 |
0.001204** |
Triplet |
0.28842 |
0.21467 |
1.344 |
0.179214 |
Premature |
-0.01748 |
0.18977 |
-0.092 |
0.004522** |
Pearson residuals |
|
|
|
|
Min |
1Q |
Median |
3Q |
Max |
-0.4558 |
-0.2349 |
-0.1330 |
1.0960 |
3.3235 |
Table 5. Poisson Regression for Live Birth Data (2010-2018)
Coefficients |
Estimate |
Std. Error |
Z value |
Pr(>|z|) |
(Intercept) |
5.009809 |
0.011958 |
418.968 |
<2e-16*** |
Breech |
0.040818 |
0.002543 |
16.051 |
0.762105 |
Cephalic |
0.066672 |
0.011540 |
5.778 |
7.58e-09** |
Twin |
0.021145 |
0.001476 |
14.324 |
0.645720 |
Still Birth |
0.033409 |
0.001650 |
20.247 |
0.466417 |
Triplet |
0.004750 |
0.006535 |
0.727 |
2.45e-05** |
Premature |
-0.015654 |
0.008125 |
-1.927 |
0.004581** |
Deviance residuals |
|
|
|
|
Min |
1Q |
Median |
3Q |
Max |
-17.4372 |
-2.6277 |
0.2496 |
2.3588 |
14.0838 |
Table 6. Poisson Regression for Maternal Maternity Data (2010-2018)
Coefficients: |
Estimate |
Std. Error |
Z value |
Pr(>|z|) |
(Intercept) |
-2.05580 |
0.33103 |
-6.210 |
5.29e-10*** |
Breech |
0.16965 |
0.05350 |
3.171 |
0.74436 |
Cephalic |
0.27462 |
0.21211 |
1.295 |
0.19541 |
Twin |
0.01134 |
0.03370 |
0.336 |
0.004354** |
Still Birth |
0.04945 |
0.03768 |
1.313 |
<2e-16** |
Triplet |
0.04602 |
0.14112 |
0.326 |
0.001521** |
Premature |
0.33552 |
0.16242 |
2.066 |
0.03885 |
Deviance residuals |
|
|
|
|
Min |
1Q |
Median |
3Q |
Max |
-1.8956 |
-0.7851 |
-0.5769 |
-0.5046 |
3.6417 |
Table 7. Quasi-poisson Regression for the Live Birth Data (2010-2018)
Coefficients |
Estimate |
Std. Error |
t value |
Pr(>|z|) |
(Intercept) |
5.009809 |
0.055910 |
89.605 |
<2e-16*** |
Breech |
0.040818 |
0.011890 |
3.433 |
0.681156 |
Cephalic |
0.066672 |
0.053957 |
1.236 |
3.52e-05** |
Twin |
0.021145 |
0.006902 |
3.063 |
0.219455 |
Still Birth |
-0.033409 |
0.007715 |
4.330 |
0.876755 |
Triplet |
0.004750 |
0.030554 |
0.155 |
0.002805** |
Premature |
0.015654 |
0.037989 |
-0.412 |
0.000867** |
Deviance residuals |
|
|
|
|
Min |
1Q |
Median |
3Q |
Max |
-17.4372 |
-2.6277 |
0.2496 |
2.3588 |
14.0838 |
Table 8. Quasi-poisson Regression for the Maternal Maternity (2010-2018)
Coefficients |
Estimate |
Std. Error |
t value |
Pr(>|z|) |
(Intercept) |
-2.05580 |
0.37942 |
-5.418 |
41e-07 |
Breech |
0.16965 |
0.06132 |
2.767 |
0.00674 |
Cephalic |
0.27462 |
0.24311 |
1.130 |
0.26132 |
Twin |
0.01134 |
0.03863 |
0.294 |
0.002236** |
Still Birth |
0.04318 |
0.04945 |
1.145 |
0.000251** |
Triplet |
0.04602 |
0.16175 |
0.284 |
0.004150** |
Premature |
0.33552 |
0.18616 |
1.802 |
0.07448 |
Deviance residuals |
|
|
|
|
Min |
1Q |
Median |
3Q |
Max |
-1.8956 |
-0.7851 |
-0.5769 |
-0.5046 |
3.6417 |
Table 9. Log-likelihood Results Using Maternity Mortality and Live Birth Data
Models |
Maternity Mortality |
Live Birth |
Poisson Regression |
-84.584 |
-1,665.841 |
Negative Binomial Regression |
-163.156 |
-1,293.140 |
Quasi Poisson Regression |
-105.23 |
-1,724.01 |
Zero Inflated Regression |
-76.478 |
-603.6 |
|
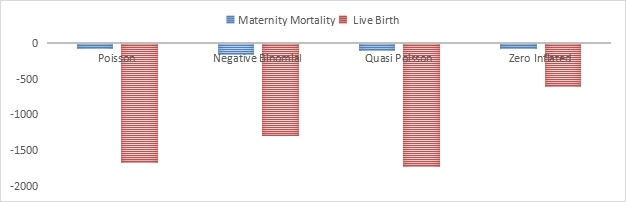
Figure 2. Log likelihood estimates of the models for live birth and maternal mortality.
4 CONCLUSION
It can be observed from the analysis that four count data models were used to model the live birth and Maternal mortality data obtained at Adeoyo Hospital, Yemetu, Ibadan, to determine demographic variables responsible for the child and maternal mortality during the birth process. The models considered are the NB regression model, the zero-inflated regression model, the poisson model and the quasi-poisson model. It was revealed that cephalic presentation, triplet, and prematurity significantly contributed to the live birth of children in Adeoyo Maternity Hospital, Ibadan, at 5% level of significance, while estimated results showed that twin, stillbirth, and triplet state of a child contributed positively to the maternal mortality at 5% level of significance. This implies that prenatal conditions of the woman during pregnancy are essential and should be given attention to prevent child and maternal mortality. It is also discovered from the research that among the four considered models used to model maternal mortality and live birth, quasi poisson regression model best captured the two datasets.
Acknowledgements
Not applicable.
Conflicts of Interest
The authors declared no conflict of interest.
Author Contribution
Adesina OA designed the study, Ogundunmade TP and Oguntola TO wrote the article. Ogunsanya AS and Akinlade YO revised the paper for intellectual contribution. All authors approved the final version.
Abbreviation List
MDG, Millennium development goal
GLM, Generalized linear model
ZINB, Zero-inflated negative binomial
NB, Negative binomial
ZINR, Zero inflated negative regression
References
[1] Song JE, Ahn JA, Lee SK et al. Factors related to low birth rate among married women in Korea. PLoS One, 2018; 13: e0194597. DOI: 10.1371/journal.pone.0194597
[2] Wang LY, Chang YS, Liang FW et al. Comparing regional neonatal mortality rates: the influence of registration of births as live born for birth weight<500g in Taiwan. BMJ Paediatr Open, 2019; 3: e000526. DOI: 10.1136/bmjpo-2019-000526
[3] Gil-Gonzalez D, Carrasco-Portino M, Ruiz MT. Knowledge gaps in scientific literature on maternal mortality: a systematic review. Bull World Health Organ, 2006; 84: 903-909.
[4] Hill K, Thomas K, AbouZahr C et al. Estimates of maternal mortality worldwide between 1990 and 2005: an assessment of available data. Lancet, 2007; 370: 1311-1319. DOI: 10.1016/S0140-6736(07)61572-4
[5] Johanson R, Newburn M,Macfarlane A. Has the medicalization of childbirth gone too far? BMJ, 2002; 324: 892-895. DOI: 10.1136/bmj.324.7342.892
[6] Olonade O, Olawande TI, Alabi OJ et al. Maternal mortality and maternal health care in Nigeria: Implications for socio-economic development. Open Access Maced J Med Sci, 2019; 7: 849-855. DOI: 10.3889/oamjms.2019.041
[7] Bale JR, Stoll BJ, Lucas AO. Improving Birth Outcomes: Meeting the Challenge in the Developing World. National Academies Press (US): Washington (DC), USA, 2003. DOI: 10.17226/10841
[8] Mairiga AG, Kawuwa MB, Kullima A. Community perception of maternal mortality in northeastern Nigeria. Afr J Reprod Health, 2008; 12: 27-34.
[9] Onatunji AP, Adesina OA. Effect of determinants of infant and child mortality in Nigeria: hazard and odds ratio models. West Afr JInd Acad Res, 2016; 16: 80-85.
[10] Ogundunmade TP, Adepoju AA. The performance of artificial neural network using heterogeneous transfer functions. Int J Data Sci Anal, 2021; 2: 92-103. DOI: 10.18517/ijods.2.2.92-103.2021
[11] Ogundunmade TP, Adepoju AA, Allam A. Stock price forecasting: Machine learning models with K-fold and repeated cross validation approaches. Mod Econ Manag, 2022; 1: 1. DOI: 10.53964/mem.2022001
[12] Yaya OOS, Abu N, Ogundunmade TP. Economic policy uncertainty in G7 countries:evidence of long-range dependence and cointegration. Econ Chang Restruct, 2021; 54: 541-556. DOI: 10.1007/s10644-020-09288-3
[13] Ogundunmade TP, Adepoju AA, Allam A. Predicting crude oil price in Nigeria with machine learning models. Mod Econ Manag, 2022; 1: 4. DOI: 10.53964/mem.2022004
[14] Ogundunmade TP, Adepoju AA. Modelling liquefied petroleum gas prices in Nigeria using time series machine learning models. Mod Econ Manag, 2022; 1: 5. DOI: 10.53964/mem.2022005
[15] McCullagh P, Nelder JA. Generalized Linear Models, 2nd Edition. Chapman and Hall: London, UK, 1989.
Copyright © 2022 The Author(s). This open-access article is licensed under a Creative Commons Attribution 4.0 International License (https://creativecommons.org/licenses/by/4.0), which permits unrestricted use, sharing, adaptation, distribution, and reproduction in any medium, provided the original work is properly cited.


