Improving Buyer-supplier Relationships: A Supplier's Perspective
Glenn Scheerlinck1*, Genserik Reniers2, Hans Michiels3
1Department of Applied Economics, Vrije Universiteit Brussel, Brussels, Belgium
2Faculty of Technology, Policy and Management, Delft University of Technology, Delft, the Netherlands
3Department of Business and Economics, Universiteit Antwerpen, Antwerp, Belgium
*Correspondence to: Glenn Scheerlinck, Associate Director Procurement, Department of Applied Economics, Vrije Universiteit Brussel, Av. Franklin Roosevelt 50, Brussels 1050, Belgium; Email: gscheerlinck@hotmail.com
DOI: 10.53964/mem.2023002
Abstract
Objective: This study attempts to find quantitative scientific evidence for variables that can improve buyer-supplier relationships.
Results: The results indicate that the variables explain 41% of the variance (R2adj) of preferred customer status. Our research supports the idea that preferred customer status is significantly influenced by financial attractiveness, corporate social responsibility (CSR), and proximity. The findings suggest that both financial attractiveness and CSR have a positive partial effect on preferred customer status that is diminishing as the independent variables keep increasing, while the positive effect from proximity on preferred customer status is linear.
Conclusion: Buyers should be aware of the significance that these three variables hold on their preferred customer status, from a supplier’s viewpoint. Buyers should carefully consider the potential effects of their decisions regarding the generation of sufficient and steady cash flow at the supplier, the risk of an undersized CSR policy, and the value of proximity in a supply chain.
Keywords: procurement, purchasing, sourcing, supply chain, strategy
1 INTRODUCTION
Porter’s value chain model[1] mentions procurement as a support activity that can contribute to a company’s competitive advantage. In today’s fast-paced business environment and trend for horizontal supply chain management, the need to procure products and services has increased[2]. Because of that, procurement became a strategic business partner. Companies spend on average 50% of their revenue on procuring products and services. This means procurement can have a significant impact on the profit margin[3].
Procurement has their own triple bottom line. First, cost savings such as reducing unit prices, demand, and total cost of ownership. Other examples consist of commodity market outperformance, cost avoidances, optimising net working capital through increasing supplier payment terms or negotiating volume rebates. Second, improving supplier service levels reduce indirect costs related to managing a supplier. Examples consist of on time and in full deliveries. Third, bringing in supplier innovation, e.g., joint product developments. Even minor improvements have a notable impact on a company’s profit[4]. The ultimate strategic procurement objective is to establish a best in class supplier base and outperform that of competitors. However, due to a trend for horizontal supply chain management, companies are more and more dependent on their suppliers, especially during an economic boom as seen in the last four years. In the presence of such a situation, optimising the relationship between buyers and suppliers are a prerequisite for companies in achieving their targets[3].
When browsing through procurement literature, the relationship between buyers and suppliers is as follows. Suppliers propose a deal and buyers evaluate this deal based on costs and benefits. The outcome of this evaluation makes buyers take the deal, negotiate a better outcome, or search for alternatives[5]. This notion assumes that buyers are in an advantaged position, namely buyers select suppliers and suppliers try to gain buyers interest with their offers[5,6]. This assumes buyers can select amongst suppliers and those suppliers by default are interested in the buyers as a customer. However, buyers cannot always pick between suppliers[7] and occasionally buyers are not commercially appealing to suppliers[5]. The buyer can only can choose if the buyer is the dominant party in the relationship and not depending on the supplier. However, a supplier base often consists of asymmetrical relationships[8], and suppliers are not always the weaker party. The relationship between a dominant supplier and a dependent buyer is often harder to manage, since the purchases are small and do not meet the supplier’s expectations[8]. When being a weaker buyer, it becomes an objective to become a ‘customer of choice’ or reach ‘preferred customer status’[9]. The basic concept of customer attractiveness is that the buyer, in the capacity of customer, will attract the supplier, and that this will bring a trustworthy and better performing relationship[9]. This position will enable buyers to obtain preference from the supplier in comparison to other buyers[9].
There is a wide scope of research discussing the relationship between a buyer and supplier[2,6,10]. As stated by Hallikas et al.[10], there are numerous studies that discuss this relationship from a customer perception and far less studies that look this relationship from the supplier’s perspective. These studies are largely qualitative research rather than quantitative[2,11]. Combining the above two gaps in literature, this research will try to partially close the gaps by determining the significant explanatory variables that can improve a buyer’s attractiveness as a customer from the viewpoint of suppliers. The results will enable buyers to consider the potential effects of their and their company’s decisions with regards to these variables.
This article is organised as follows. The next section reviews existing literature on the buyer-supplier relationship. Then we present the research question and data to establish our cross-sectional dataset. Subsequently, we explain the empirical model and results. Finally, conclusions and suggestions for future research are provided.
2.1 Literature Review
Procurement departments deal with a wide variety of products, services and suppliers. To differentiate the importance of these, the ABC analysis was most used for a long time[12]. However, this tool lacks strategic recommendations and does not provide guidelines. Therefore, it is not usable as a portfolio technique[13]. Since supply chain management requires a strategic approach to the buyer-supplier relationship[14], procurement portfolio models offer classification of procured products and/or services and put forward an optimal approach[15].
Kraljic[16] was the first to introduce such a portfolio approach for procurement. Here the buyer-supplier relationship is assessed from the buyer’s perspective. This portfolio technique results in a 2x2 matrix with four categories. Assessing the position in the matrix can determine the appropriate strategy for maximum bargaining, reducing risk, and minimizing vulnerabilities. Decisions made upon this portfolio technique should be made with caution, primarily the dimensions setup. Subjective choices may result in bias regarding the location within the matrix. Therefore it is important to supplement this tool with extra information, such as the company mission and vision, market information, and supplier information. This additional information may enrich decisions to be made on the basis of this analysis but avoids treats or missed opportunities[17]. Another flaw in this model is the absence of the supplier’s opinions. Despite limited academic research, this tool is successfully and widely used across many procurement departments[17].
Carter[18] is the first to make a portfolio similar to that of Kraljic[16]. This portfolio determines the strategy a supplier should utilize in handling buyers. A Dutch consulting firm combined both portfolios into one, naming it the ‘Dutch windmill model’. This model advises which strategy the buyer should use after positioning both buyer and supplier viewpoint[3]. Both buyers and suppliers are not necessarily in the same quadrant, and do not automatically have the same strategy in mind with regards to each other. This means perception of attractiveness in the buyer-supplier relationship could differ and even be conflicting.
The assumption of customer attractiveness is that the buyer will attract the supplier, and that this will lead to good prices, superior service and innovation[9,19]. This objective is referred to as becoming a ‘customer of choice’ or achieving ‘preferred customer’ status. Achieving this will ensure companies receive preferential treatment over competition from suppliers[20,21]. However, the dynamics between buyers and suppliers are changing, and it is no longer the candidate supplier who initiates the relationship. Nowadays best in class suppliers are recognised and proactively approached by the buyers, making it more important to stand out from other potential customers in order to convince a supplier to allocate his resources towards your company[21]. A long-term, durable relationship with such suppliers thus becomes more important to attain competitive advantage[22]. The opposite of customer attractiveness is also present, where suppliers discontinue relationships with unattractive buyers who offer no perspective[23]. Therefore, customer attractiveness is most important when suppliers are scarce[24]. In highly developed markets oligopolies often exist, making it even more difficult to find alternatives. This makes suppliers distribute their resources at their conditions and are selective in the customers they supply[9]. Cooperation and creating value for both parties is the main objective, with optimising value being the primary purpose.
Customer attractiveness will be different for each buyer and supplier. A case study by He et al.[25] requested suppliers to describe their ‘best customer’ and along came the following characteristics as most important: trust, involvement in product design, quality innovation, profitability, cost de-escalation ideas, schedule sharing, feedback and communication, commitment to partnership and crisis management. Walter et al.[26] came to similar characteristics and clustered these in two categories. The first category contains all functions that are monetary related for the supplier. The most important function being cash generation by ordering large and steady volumes as a loyal customer. The next category comprises non-monetary advantages for the supplier. These indirect functions have no direct impact on profit and turnover, but provide chances to achieve them in the future. Buyers on the frontier of innovation can give access to new technologies, the ‘innovation function’. Prestigious customers can be a valuable reference when entering new markets, the ‘network function’. Some customers can provide valuable market information, the ‘information exchange’ function. A study by Ellis et al.[27] found that the influence of non-monetary characteristics on customer attractiveness surpasses the influence of monetary characteristics for the U.S. automotive industry. A study conducted by van der Schans[28] attempts suggests variables that improve a buyer’s customer attractiveness position towards suppliers. It puts focus on cases in which the buyer is depending on the supplier, although the supplier is not depending on the buyer. The study finds that financial attractiveness, innovation, information exchange, network, trust, dependence asymmetry, and commitment explain 38% of the variance in preferred customer status, with the variables ‘network function’ and ‘commitment’ being significant. Furthermore, the data confirms a negative correlation between preferred customer status and dependence asymmetry.
Based on the characteristics as described by He et al.[25] and Walter et al.[26], and in accordance with the findings from Ellis et al.[27] and van der Schans[28], this research will use similar variables as presented in the next section. The literature assumes these variables have the highest likelihood of influencing customer attractiveness.
2.2 Research Question and Presentation of the Variables
How can we broaden our understanding of which variables influence the preferred customer status from a supplier’s viewpoint?
To partially answer this question, the paper will contribute to literature on how the following nine variables may have a significant impact on preferred customer status: ‘financial attractiveness’, ‘commitment’, ‘innovation function’, ‘trust’, ‘information exchange’, ‘supplier dependence’, ‘network function’, ‘corporate social responsibility (CSR)’, and ‘proximity’.
2.2.1 Financial Attractiveness
The most important feature of an account for a supplier is to create cash flow by ordering a large and steady volumes as a loyal customer. Here suppliers differentiate between profit and volume customers. The more economies of scale and/or scope a supplier can generate, the lower the threshold to make profit[26]. In literature, the overall hypothesis is that monetary value is the cradle of all business relationships. The most evident being cash flow and revenue, which is realised by volume and/or price setting. This in turn should result in profit, which is a basis for company survival[9,21,22,29]. Even leaving out scientific research, it is rational to assume that financial attractiveness is a key driver of a business relationship. Findings in literature indicate that financial attractiveness, under the form of steady cash flow, revenue and profit, will increase preferred customer status compared to customers who are not financially attractive.
2.2.2 Commitment
Commitment is the belief that an existing relationship should be maintained. This is often done by committing resources to that relationship[30,31]. The difference between trust and commitment is that the latter is an outcome of trust, with the goal to create and sustain relationships[31]. A supplier’s commitment to a buyer will influence the decisions from the supplier. Baxter[6] found a positive relation between commitment and preferred customer status. The increasing pace in technologic development demands a corresponding development of resources. This urges the need to make long-term relationships between buyers and suppliers in developing their business with each other. Frequently, a pareto analysis applies to a minority of buyers representing a large part of the suppliers market share. A relationship between parties departs when one party takes the initiative, and the other invests resources into the relationship. This continuing throughout the development of the relationship. The degree of commitment perceived by the other party significantly drives the amount of commitment returned[32]. Commitment can bring competitive advantage for both parties[33]. However, developing commitment is a time-consuming process and is shaped through interaction between both parties. Here mutual commitment is of importance[32]. Chen et al.[32] found that mutual commitment has a significant effect on mutual dependence, which in turn has a significant effect on value creation for both parties. Commitment creates value, but it is important to avoid dependence on one another. Suppliers’ dependence is positively correlated with commitment[33]. And commitment is connected to the effort that a party invests in the relationship[6]. Suppliers remain cautious in committing to a buyer that offers no incentives[33]. However, promises encourage suppliers to grant buyers’ needs and wishes[33]. Commitment regards openness, for which only responsible parties are suitable[31]. One way a buyer can illustrate his commitment to the supplier is by illustrating its consistency in sustaining promises, acting reliable, and not letting the supplier down. The fundamental idea is that reliability reduces risk and thus improves the attractiveness of the customer. Concluding, commitment will ensure the allocation of scares resources into the relationship[31,33], increasing preferred customer status more than parties who do not invest in a committing relationship[28].
2.2.3 Innovation
Firms are shifting the way innovation gets driven. The buyer-suppliers relationship is often an important source of ideas. A relatively larger share of innovations arises from more and more intensive collaborations between different companies[34]. The extent to which a buyer supports the supplier innovate will be referred to as the ‘innovation function’. Innovation is a main driver for company success and a prerequisite for its long-term survival[35]. A buyer supporting a supplier becoming more competitive, through innovation, will get a preferred customer status[21]. Schiele et al.[23] showed significance evidence that preferred customer status is positively correlated when allowing a supplier to innovate. Higher involvement makes it easier to concept, develop, protype, engineer and launch new products or services. The supplier will benefit from this buyer participation, since it will trigger a cost reduction, which in turn provides higher attractiveness as a customer[27]. Also the availability of new technology could give a competitive advantage to both parties. The buyer gains the edge over its competitors, and the supplier direct feedback from its customer, intensifying innovation[27]. integration buyers and suppliers offers an external source of innovative solutions[23]. Furthermore, the challenge of the buyer can trigger a supplier to improve its productions process and products. A supplier in turn will be more innovative if the buyer is willing and capable of reviewing procedures, standardization , and improving the overall supply chain[21]. Provided this review on innovation, we conclude that buying companies who are open to innovation are more likely to become a preferred customer for the supplier than companies who do not prioritise innovation.
2.2.4 Trust
Trust in buyer-supplier partnerships implies that both parties engaging in the relationship will give and get back something out of it[31]. Nagati et al.[36] indicate a positive correlation between trust and preferred customer status. However, evidence is limited that trust improved preferred customer status[37]. Trust is often referred to in business relationship studies, and it is seen as an important aspect to maintain the business relationship[38]. Provided the effort a supplier must make to onboard a new buyer, it is important trust is present from the beginning, since literature shows trust is a significant enabler for companies in allocating their resources to a particular customer. In a situation where trust is present, the supplier will give more information to the buyer[6,36]. Trust enables a higher chance for adaptation, collaboration, and commitment. This in turn enables smoother daily operations and improves coordination[35]. Piricz et al.[30] find that trust is very important for fostering and nurturing a buyer-supplier relationship, however being a time-consuming effort that is often underestimated by buyers. Trust is also shown as a predictor for success in an alliance[30]. Of all variables discussed, trust is the most fragile[37]. The first contact in a purchasing relationship is often based on the need for a product and/or service. Departing from a good product and/or service will reduce the risk for a buyer and is a good starting point to develop trust. Difficulties in developing trust can spring from differences in experiences and perceptions between both parties[38]. Viitaharju and Rebolledo[38] found that trust could easily develop when a product and/or service is highly attractive for a buyer. However, incorrect pricing (too high or too low) will damage the relationship. Additional free services provided along with the supplied product and/or service will increase trustworthiness. On the other hand it is difficult and challenging for a small cap company with limited economic resources to fulfil the expectations of a larger party, showing asymmetry causes major mistrust[38]. However, if trust is present it will lower the cost to maintain the relationship, because it protects against opportunism[30,35]. A supplier’s trust in its buyer is a predictor for a successful cooperation[37], and trust leads to competitive advantage for both parties[38]. Buyers who gain the supplier’s trust will more likely get preferred customer status than buyers who do not gain the supplier’s trust.
2.2.5 Information Exchange
Buyers may have information that is valuable for suppliers[6]. This concerns a wide variety of information. For example, market information can aid suppliers to anticipate their responses to changing markets and serve as risk mitigator by avoiding obsolescence and bullwhip effects. Buyer-supplier relationships are often considered as an important source of ideas and information[34,39]. Another advantage of information exchange lies in its conflict avoiding properties by searching for solutions in an early stage. Such communication has a positive influence on the supplier satisfaction in strategic partnerships. The quality and dept of shared information is important to the relationship[30]. Eckerd and Hill[40] found a significant correlation between the amount of shared information and supplier’s fulfilment. A large share of sales suggests the supplier is delivering an important or critical product and/or service, which results in better buyer-supplier communication[27]. Information sharing also increases financial performance for both parties[35]. However, one could argue this is due to information exchange[35] or the importance of the product and/or service to the buyer[27]. The amount of information exchange is likely highly dependent on the kind of product and/or service that is sold[41]. Nollet et al.[21] highlight knowledge transfer, information exchange where specific skills and expertise are shared in the buyer-supplier relationship, as having significant added value for the supplier. An example of knowledge exchange may result in the joint development of products and/or services, whereas information exchange is the broader overarching concept, e.g. sales leads or sector information. Collaboration amongst companies impacts the extend of knowledge transfer amongst companies. The exchange of tactical information, which requires intensive communication will improve with a higher level of trust[41]. Information sharing strengthens trust, enabling a long-term relationship. Companies are showing their trustworthiness to the other party when they share information. Information sharing can protect a firm from unethical behaviour on the part of the other party, which is a form of risk mitigation[40]. However, (mainly strategic) information exchange is prone to misuse by the other party[42]. For example, General Motors' former Chief Procurement Officer was found sharing innovative technological blueprints with competitors[43]. Trust should ensure shared information will not be misused to reduce the competitive advantage of the relationship. Information exchange is an important feature to the buyer-supplier relationship to improve daily operations and avoid possible conflicts[30]. Valuable and integer information exchange in both directions increases the likelihood of becoming a preferred customer, compared to parties who do not or limit exchange of information.
2.2.6 Supplier Dependence
Nyaga et al.[44] find that the combination balance of power and use of power will affect behaviour and operational performance of a relationship. It is important that both parties exercise the right kind of power. However, its impact on the relationship is greater for the buyer than for the supplier. in addition, Gulati and Sytch[45] find that joint dependence improves the performance of a buyer-supplier relationship. By contrast, buyer dependence on a supplier deteriorates performance. Supplier dependence on a buyer did not have this effect. Asymmetrical relationships lead to more conflict, which stalls the flow of knowledge and creates operational barriers. If to the advantage of the supplier, he will reduce the transfer of knowledge to sustain this dependence or even increase it. The supplier can also raise prices to improve its profit for this account. Dependence will have a negative influence on preferred customer status and the performance of the relationship[19,35]. Reciprocity and self-interest encourage suppliers to provide benefits to buyers that are attractive customers. To strengthen this exchange, it is necessary to have mutual advantages for both sides[27]. The relationship will only last as long as each party benefits from it. In case of a demand that does not make economic sense, one of the parties will eventually end the relationship[19]. The risk of high dependence on a supplier is that the buyer will be unable to formulate the specifications of the product and/or service to be sourced, this due to a lack of knowledge[35]. To conclude on this variable, a mutual, equal dependence is a favourable position for increasing customer attractiveness[46], while an asymmetric relationship negatively affects preferred customer status[45]. Our research will only include the extent to which a supplier is depending on the buyer, as we have opted for an anonymous survey to increase the response rate and avoid biased answers to gain the buyer’s favour. We thus only measure if supplier dependence on the buyer will have a negative influence on preferred customer status. This choice disables us to test how an (a)symmetrical relationship influences preferred customer status.
2.2.7 Network Function
Relationships between buyers and suppliers do not exist in isolation[32]. Companies have networks of industrial resources and relationships. When evaluating potential relationships, it is incomplete to consider only the relationship between the two companies at hand. These companies in turn have relationships with other companies that could be useful for the other organisation. A network holds two advantages. First, collaborating buyers can create economies of scale and scope. In turn triggering suppliers’ efforts in achieving significant technological innovations. Second, integrating firms’ connections in this broader network of companies. This gathering of firms will produce value for both companies[32]. This supply chain structure will not only connect two companies in a buyer-supplier relationship, but also enables access to the network of companies in which they are included, e.g. the supplier of one’s supplier[40,47]. The network in which a buyer-supplier relationship is situated has a direct implication on the social relations of the companies[45]. It is important that both companies value the other party’s network as relevant for them[47]. A network offers a platform for learning, information sharing, and innovation[47]. Also, extensive contact demonstrates commitment to the supplier[7]. From an organisational perspective, both parties must match, but relationship development must also be present to have a network effect. Supplier satisfaction is primarily driven by the relationship rather than by performance[21]. Access to other parties is important for one to extend its business. A smaller customer could gain entrance to specific markets which are interesting for a supplier tapping into new markets. For instance, a buyer could serve as a reference for their suppliers and customers[7]. Furthermore, buyers can use their network to influence suppliers to improve their products and/or services[47]. The network of a buyer could be valuable for the supplier[32]. However, the network needs to be relevant. Networks offer an effective means for learning, information sharing, and innovation[47]. It is important to develop a good relationship before the network effect can take place. Satisfaction of the supplier is primarily driven by the relationship rather than by performance. Network function: having a developed network as a customer is positively related to being a preferred customer for a supplier[28], compared to customers who have limited or absent network functionalities.
2.2.8 CSR
CSR is a form om self-regulation practised by small and large companies. The concept holds businesses socially accountable to their stakeholders and the public. By implementing firm CSR strategies, companies accept responsibility beyond their bottom line, being society as a whole, including economic, social, and environmental aspects. In the beginning, simply claiming to have a CSR policy in place was already enough for a company to be recognized as socially responsible, even if social responsibility was not embedded in the production processes or the business model. Coming a long way since then, it is safe to say this has changed. Companies are highly judged on being responsible for their social and environmental impact by, amongst other stakeholders, their suppliers. Today suppliers need proof that their clients act to the benefit of the greater common good. When implemented correctly, CSR will help to meet supplier expectations and has the power to improve overall business performance, if invested in it for the long run[48]. Leppelt et al.[49] provide evidence that promoting CSR capabilities improves reputation, but only when sending consistent signals to the market. Therefore, a close integration of marketing and procurement is crucial for achieving signalling consistency. Concluding that CSR is taken into account by a supplier before connecting its name and allocating its resources to the customer, it will enhance preferred customer status if CSR is held in high esteem by the customer. Customers who have no CSR or intension only will have a disadvantage in reaching preferred customer status.
2.2.9 Proximity
Tendencies that affect the manufacturing of innovative goods – increasing international fragmentation of production, and modular and lean process technologies – have increased the significance of proximity in a supply chain. Proximity has three main business dimensions: geographical, organisational and technological. Geographical proximity is all about distance. It is also relative in terms of the availability of transport infrastructure and of the financial resources of the individuals who use these transport infrastructures[50]. Organisational proximity is the way of being close in a buyer-supplier relationship, referring to the nature of doing business in a similar way[50]. Technological proximity indicates the extent of overlap between the buyers and suppliers involving their technology bases and experiences[51]. Schmitt and Van Biesebroeck[52] find that buyers and suppliers value some aspects of each dimension independently in their relationship. Their research indicates that the positive effects of technological proximity tend to reflect past and existing relationships, rather than predicting new ones. Bönte[53] suggests there is a positive relationship between technological proximity from business partners and the level of inter-firm trust. Organisations that are unable to safeguard their technological knowledge fear buyer-supplier opportunism. Furthermore, estimators indicate that inter-firm trust between geographically close partners exceeds inter-firm trust between geographically distant partners. Research[54] reveals diverse combinations of proximities that characterise relationships between a buyer and suppliers of several purchasing categories. Higher proximity influences the buyer-supplier relationship in a positive way. Literature is unanimous that each dimension of higher proximity positively influences preferred customer status, while increased distance deters preferred customer status.
Table 1. Variables That Influence Preferred Customer Status
Variable name |
Walter et al.[26] |
He et al.[25] |
Ellis et al.[27] |
Corsten and Felde[35] |
Leppelt et al.[49] |
Schmitt and Van Biesebroeck[52] |
Financial attractiveness |
● Profit function ● Volume function |
Profitability |
Share of sales |
|
|
|
Commitment |
|
Commitment to partnership |
|
|
|
|
Innovation |
|
● Early supplier involvement ● Involvement in product design ● Response to cost reduction ideas |
Supplier involvement |
|
|
|
Trust |
|
Mutual trust |
Reliability of relationship |
|
|
|
Information exchange |
Scout function |
● Schedule sharing ● Communication and feedback ● Crisis management |
|
|
|
|
Supplier dependence |
|
|
|
● Negative influence on performance ● Reciprocity and self-interest encourage suppliers |
|
|
Network function |
● Market function ● Access function |
|
|
|
|
|
CSR |
|
|
|
|
● Enhances reputation if consistent signals ● Close integration of marketing and procurement |
|
Proximity |
|
|
|
|
|
● Each dimension is independent ● Reflect past relationships rather than predict new ones |
Notes: Source: own creation as derived from the literature study.
2.3 Methodology and Data
It is impossible to cover all buyer-supplier relationships. Due to feasibility and data-access possibilities, this research focusses on two production sites within a business division of a large cap multinational healthcare company noted on the SIX Swiss Exchange. This research thus examines a small part of the domain.
Since the company acts as a buyer in the market, the unit of analysis will be its suppliers. From the Enterprise Resource Planning (ERP) database, a selection of 2.737 suppliers was extracted. The selection was based on whether the suppliers were active as from January 1st 2020 onwards. This active status was determined by checking if the ERP contained a purchase order and/or invoice after this date.
The obtained list contains suppliers for goods and/or services used by one or more departments throughout the sites. The suppliers were requested to participate in an online survey. In total 2.737 surveys were sent out.
Only one response from an individual supplier is received. Some suppliers had several procurement contact persons, however only the main contact person was approached, in order to avoid multiple responses from the same supplier. This technique further reduces a scenario in which a single company can misbalance the survey results.
The responses were treated confidentially and anonymous. This is necessary to counter the risk respondents will give answers the buyer wants to hear and not damage the relationship. However, more honest answers could possibly improve future collaboration with the supplier, which would be an advantage if the responses are not anonymous.
It is likely the survey carries a non-response bias for the complete supplier population of the two sites. To minimise this bias, a reminder is sent after two weeks to actively encourage those suppliers that did not participate yet.
The survey is carried out on a Likert scale[55]. Two to four questions per variable are included in the survey. For all variables, except for proximity and CSR, all questions are based on previous research and have been proven to be reliable with a Cronbach’s alpha greater than 0,7[56]. References for the variable questions are illustrated in Table 2. The questions are slightly altered to fit our research. For the ‘proximity’ and ‘CSR’ variables, no reliable sample questions have been identified, thus the questions were newly developed for this research, based on the questions from the other variables. To ensure consistency between the variables in the survey, all questions were evaluated on a 5-point Likert sale (for the interested reader it is possible to obtain the research question by mailing the corresponding author). Question range from ‘very low’ to ‘very high’ or ‘strongly disagree’ to ‘strongly agree’. Each question is set as mandatory, so the result is a balanced cross-sectional dataset. Finally, an arithmetic average of the 5-point Likert score is calculated for the two to four questions per variable[57,58].
Table 2. Questions and References
Variable Name |
Ref. |
Financial attractiveness |
|
Commitment |
[33] |
Innovation |
[23] |
Trust |
[35] |
Information exchange |
[23] |
Supplier dependence |
[19,33] |
Network function |
[28] |
CSR |
Newly developed for this research |
Proximity |
Newly developed for this research |
Notes: Source: own creation.
Table 3. Descriptive Statistics
Variable Name |
Observations |
Mean |
SD |
Min |
Max |
Dependent Variable |
|
|
|
|
|
Preferred customer status |
319 |
2.94 |
0.81 |
1 |
5 |
Independent Variables |
|
|
|
|
|
Financial attractiveness |
319 |
2.65 |
0.81 |
1 |
4.75 |
Commitment |
319 |
4.43 |
0.67 |
1 |
5 |
Innovation |
319 |
3.14 |
0.68 |
1 |
5 |
Trust |
319 |
3.71 |
0.61 |
1 |
5 |
Information exchange |
319 |
3.93 |
0.66 |
1 |
5 |
Supplier dependence |
319 |
2.57 |
0.94 |
1 |
5 |
Network function |
319 |
3.12 |
0.81 |
1 |
5 |
CSR |
319 |
3.27 |
0.88 |
1 |
5 |
Proximity |
319 |
3.55 |
0.69 |
1 |
5 |
Notes: Source: own calculations based on the constructed cross-sectional dataset.
We wish to estimate the effect of the independent variables on the dependent variable, i.e. preferred customer status. A first step consists of determining the functional form of the regression, as illustrated by Floyd[59], Dougherty[60], and Boudt[61]. For our case this necessitates taking polynomials of order two for information exchange and supplier dependence, keeping proximity linear and applying a custom power to all other independent variables. The final linear (Despite the relationship between E [dependent variable|independent variables] and the independent variables is nonlinear, we refer to a linear regression model, since the regression function E [dependent variable|independent variables] is a linear function of its regression parameters.) regression model becomes Equation (1).
|
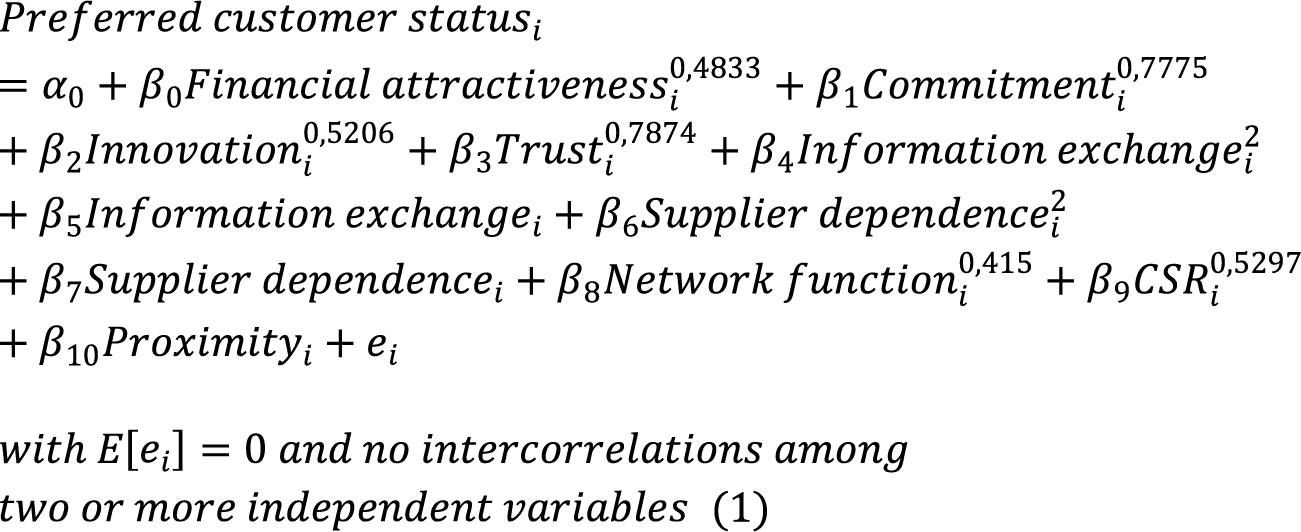
Second, a correlation matrix is established to check for high intercorrelations among two or more independent variables in the model. Since the intercorrelations are all <0.7, no independent variable is omitted and multicollinearity does not exist[61]. Third, we assume that, based on the literature, all relevant independent variables are included in the model and thus E[ei]=0, further assuming no omitted variable bias occurs in the model[61]. Fourth, the standardised residuals relative to their index are analysed to detect outliers. Only one outlier is detected ![]() . Since the outlier does not concern an error but rather an interesting observation, the outlier is retained in the dataset[61]. Fifth, checking for normality of the error terms can be neglected, since and the least squares estimator will thus be normally distributed, even if the error terms are not normally distributed[61]. Finally, a White test[62] to detect heteroscedasticity and Breusch-Godfrey linear model test[63] to detect serial correlation up to order four is performed. As the effects are not present, the model needs further correction.
. Since the outlier does not concern an error but rather an interesting observation, the outlier is retained in the dataset[61]. Fifth, checking for normality of the error terms can be neglected, since and the least squares estimator will thus be normally distributed, even if the error terms are not normally distributed[61]. Finally, a White test[62] to detect heteroscedasticity and Breusch-Godfrey linear model test[63] to detect serial correlation up to order four is performed. As the effects are not present, the model needs further correction.
3 RESULTS
After testing the model for the type of effects and the property of effects, test reveal absence of heteroskedasticity, multicollinearity and autocorrelation, making the model very reliable. Regression results explaining preferred customer status are presented in Table 4 (Despite the relationship between and the independent variables is nonlinear, we refer to a linear regression model, since the regression function is a linear function of its regression parameters).
Table 4. Cross-sectional Regression Result: Preferred Customer Status
Independent Variable |
Preferred Customer Status |
Financial attractiveness0.4833 |
0.52641** (0.20475) |
Commitment0.7775 |
0.20757 (0.12613) |
Innovation0.5206 |
0.08076 (0.20694) |
Trust0.7874 |
-0.01187 0.14074 |
Information exchange² |
0.01557 (0.04568) |
Information exchange |
-0.08349 0.34869 |
Supplier dependence² |
0.01517 (0.03425) |
Supplier dependence |
0.10620 (0.18602) |
Network function0.415 |
0.07715 (0.22930) |
CSR0.5297 |
0.69690*** (0.15807) |
Proximity |
0.16182*** (0.06086) |
R2adj |
0.4067 |
F-statistic: P-value |
2.2e-16 |
Notes: *** significant at the 1% level, ** significant at the 5% level, * significant at the 10% level. Standard errors in parentheses. Source: own calculations based on data analysis.
When explaining preferred customer status, the results suggest that the average marginal effect of financial attractiveness on preferred customer status depends on the value of financial attractiveness. Since preferred customer status ≥1, an increasing value of financial attractiveness will have a positive partial effect on preferred customer status that is diminishing as financial attractiveness keeps increasing, this at the 5% level. The result implies customers with a very low financial attractiveness can expect bigger gains in their preferred customer status if they generate more cash flow at the supplier by ordering a steady volume and being a loyal customer. While financial attractiveness is significant at the 5% level, the variable CSR is significant at the 1% level. Again the results suggest that the average marginal effect of CSR on preferred customer status depends on the value of CSR. Since preferred customer status ≥1, an increasing value of CSR will have a positive partial effect on preferred customer status that is diminishing as CSR keeps increasing. It is reasonable to assume suppliers do not want to have their name or brands linked to a customer that neglects its social accountability to their stakeholders and the public, since this might harm suppliers’ reputation sooner or later. The estimation illustrates CSR has the power to increase preferred customer status, with a greater impact if the customer is at the low end of practising CSR. Also proximity is significant at the 1% level. If proximity increases with one unit, then preferred customer status will increase on average with 0,16182 units. The results suggest suppliers value proximity in the buyer-supplier relationship, being geographical, organisational, technological or a combination thereof. The F-statistic and its corresponding p-value <5%, proving the collective significance of the model. Furthermore, the independent variables explain 41% of the variance (R2adj) of preferred customer status.
4 DISCUSSION
When comparing our results to existing literature, few studies look at the buyer-supplier relationship from the supplier’s viewpoint. The studies that are available are largely qualitative research rather than quantitative[2,11]. However, there is, to our knowledge, one quantitative study made by Van der Schans[28] that can serve best as a point of comparison. Van der Schans finds that financial attractiveness, innovation, information exchange, network, trust, dependence asymmetry, and commitment explain 38% of the variance (R2adj) in preferred customer status, with the variables ‘network function’ and ‘commitment’ being significant. Furthermore, the data confirms a negative correlation between preferred customer status and dependence asymmetry. Our study, containing two extra independent variables and leaving out dependence asymmetry, explains 41% of the variance (R2adj) of preferred customer status. This immediately proves the added value of CSR and proximity in explaining the variance of preferred customer status, given they are even significant at the 1% level. Omitting dependence asymmetry as a variable could have two separate effects or a combination thereof. One could argue buyer-supplier relationships are often asymmetrical[8]. Especially when being a weaker buyer, it becomes an objective to reach ‘preferred customer status’[9]. An asymmetric relationship negatively affects preferred customer status[45], so including an independent variable that measures asymmetry in the buyer-supplier relationship might be of great added value. However, it could limit the response rate and result in biased answers to gain the buyer’s favour. The latter seems to apply to van der Schans’ research, since he only obtained 60 responses, of which 14 incomplete, leaving him with an unbalanced dataset. Whereas our research contains 319 responses and a balanced dataset.
This study is, as any other, subject to shortcomings. First, one could argue buyer-supplier relationships are often asymmetrical[8], so including an independent variable that measures the asymmetry in the buyer-supplier relationship might be of great added value. Our research only includes this partially, namely the extent to which a supplier is depending on the buyer. Since we opted for an anonymous survey to increase the response rate and avoid biased answers to gain the buyer’s favour, we excluded the extent to which a buyer is depending on the supplier. Thus the model only measures if supplier dependence on the buyer will have an effect on preferred customer status. Second, the variable proximity is made up of three dimensions, being geographical, organisational and technological. The estimator describes the combined impact those three dimensions have on preferred customer status. Given the significance of proximity, it would be of added value to measure the impact of each dimension in itself. Our research did not anticipate this, since adding proximity to estimate preferred customer status is a novel approach in literature. Third, the model presented in this research was not compared to the model including the interaction effects between all variables, possibly excluding significant interaction effects. However, this would lead to a model with maximum nine variables and 72 interaction terms. Afterwards one should question if some interaction terms should be omitted, which necessitates in performing the corresponding amount of F-tests and respecifying the model over and over. To maintain feasibility, our study has opted to omit the interaction terms altogether, based on a P-value corresponding to the F-statistic that is <5%, proving the collective significance of the model. Fourth, one may have the impression that the goodness-of-fit measure is too low. However, human behaviour cannot be accurately predicted. For studies in the field of social sciences, arts, and humanities, an R² as low as 10% is generally accepted[64]. Referring back to Table 4, our study greatly exceeds this percentage. In addition, our study reports the R2adj, taking into account a penalty for the number of variables enclosed in the model.
This study belongs to the first quantitative analysis on the topic, which will hopefully stimulate further research. To give some ideas, one may consider redoing the regression with datasets covering a wider variety of companies, involving multiple sectors and countries, increasing the validity and capturing more and different buyer-supplier relationships. Next, more independent variables estimating preferred customer status could be included, to run a more extensive regression. A main independent variable would be dependence asymmetry, if free from response bias. A larger working group could consider comparing models including the interaction effects between all variables, which necessitates in performing the corresponding amount of F-tests and respecifying the model over and over. Finally, one could break down the independent variable proximity to its various dimensions, being geographical, organisational, and technological. This enables researchers to run a regression with each proximity aspect as an explanatory variable, ultimately deciding to which extend each dimension drives preferred customer status.
5 CONCLUSION
Study shortcomings are fourfold. First, the exclusion of asymmetry as an independent variable. Second, the variable proximity includes three dimensions, rather than considering each dimension as a separate explanatory variable. Third, the model presented in this research was not compared to the model including the interaction effects between all variables. Fourth, one may have the impression that the goodness-of-fit measure is too low. However, the retention and acceptance of each shortcoming has a rational as elaborated upon in the discussion. This study belongs to the first quantitative analysis on the topic, which will hopefully stimulate further research. To give some ideas, one may consider redoing the regression with datasets covering a wider scope, e.g. by companies, countries and industries. Next, more independent variables estimating preferred customer status could be included, to run a more extensive regression. Finally, one could break down the independent variable proximity to its various dimensions, ultimately deciding to which extend each dimension drives preferred customer status.
Not applicable.
Conflicts of Interest
The authors declared no conflict of interest.
Author Contribution
Scheerlinck G designed the study and wrote the article. Reniers G and Michiels H revised the paper for intellectual contribution. All authors approved the final version.
Abbreviation List
CSR, Corporate social responsibility
ERP, Enterprise resource planning
References
[1] Porter ME. Competitive Advantage, 2nd ed. The Free Press: New York, USA, 1985.
[2] Rozemeijer F. Wie kust Doornroosje wakker? Maastricht University, 2009.[DOI]
[3] Van Weele A. Purchasing and Supply Chain Management, 4th ed. Cengage Learning Business Press: London, UK, 2010.
[4] USA. Investopedia. Dupont Analysis: The Dupont Formula Plus How To Calculate and Use It. Accessed 28 June 2021 Available at:[Web]
[5] Ramsay J, Wagner BA. Organisational Supplying Behaviour: Understanding supplier needs, wants and preferences. J Purch Supply Manag, 2009; 15: 127-138.[DOI]
[6] Baxter R. How can business buyers attract sellers' resources?: Empirical evidence for preferred customer treatment from suppliers. Ind Market Manag, 2012; 41: 1249-1258.[DOI]
[7] Christiansen PE, Maltz A. Becoming an" interesting" customer: Procurement strategies for buyers without leverage. Int J Logist, 2002; 5: 177-195.[DOI]
[8] Belaya V, Gagalyuk T, Hanf J. Measuring asymmetrical power distribution in supply chain networks: what is the appropriate method? J Relat Marketing, 2009; 8: 165-193.[DOI]
[9] La Rocca A, Caruana A, Snehota I. Measuring customer attractiveness. Ind Market Manag, 2012; 41: 1241-1248.[DOI]
[10] Hallikas J, Puumalainen K, Vesterinen T et al. Risk-based classification of supplier relationships. J Purch Supply Manag, 2005; 11: 72-82.[DOI]
[11] Lee CJ, Johnsen RE. Asymmetric customer-supplier relationship development in Taiwanese electronics firms. Ind Market Manag, 2012; 41: 692-705.[DOI]
[12] Malaysia. Purchasing & Procurement Center. ABC Analysis: A Critical Inventory Management Tool. Accessed 28 June 2021. Available at:[Web]
[13] Gelderman CJ. Rethinking Kraljic: towards a purchasing portfolio model, based on mutual buyer-supplier dependence. Danish Purch Log Forum, 2000; 37: 9-15.
[14] Bensaou M. Portfolios of buyer-supplier relationships. MIT Sloan Management Review, 1999.
[15] Luzzini D, Caniato F, Ronchi S et al. A transaction costs approach to purchasing portfolio management. Int J Oper Prod Man, 2012; 32: 1015-1042.[DOI]
[16] Kraljic P. Purchasing must become supply management. Harvard Business Review, 1983; 109-117.
[17] Gelderman CJ, Van Weele AJ. Handling measurement issues and strategic directions in Kraljic's purchasing portfolio model. J Purch Supply Manag, 2003; 9: 207-216.[DOI]
[18] Carter S. Successful Purchasing in a week, 2nd ed. John Murray Learning: London, UK, 1998.
[19] Paswan AK, Blankson C, Guzman F. Relationalism in marketing channels and marketing strategy. Eur J Marketing, 2011; 45: 311-333.[DOI]
[20] Bew R. The new customer of choice imperative: ensuring supply availability, productivity gains, and supplier innovation: 92nd Annual International Supply Management Conference, Las Vegas, USA, 6-9 May 2007.
[21] Nollet J, Rebolledo C, Popel V. Becoming a preferred customer one step at a time. Ind Market Manag, 2012; 41: 1186-1193.[DOI]
[22] Walter A, Müller TA, Helfert G et al. Functions of industrial supplier relationships and their impact on relationship quality. Ind Market Manag, 2003; 32: 159-169.[DOI]
[23] Schiele H, Veldman J, Hüttinger L. Supplier innovativeness and supplier pricing: The role of preferred customer status. Int J Innov Manag, 2011; 15: 1-27.[DOI]
[24] Steinle C, Schiele H. Limits to global sourcing? Strategic consequences of dependency on international suppliers: Cluster theory, resource-based view and case studies. J Purch Supply Manag, 2008; 14: 3-14.[DOI]
[25] He Y, Lai KK, Sun H et al. The impact of supplier integration on customer integration and new product performance: The mediating role of manufacturing flexibility under trust theory. Int J Prod Econ, 2014; 147: 260-270.[DOI]
[26] Walter A, Ritter T, Gemünden HG. Value creation in buyer-seller relationships: Theoretical considerations and empirical results from a supplier's perspective. Ind Market Manag, 2001; 30: 365-377.[DOI]
[27] Ellis SC, Henke Jr JW, Kull TJ. The effect of buyer behaviors on preferred customer status and access to supplier technological innovation: An empirical study of supplier perceptions. Ind Market Manag, 2012; 41: 1259-1269.[DOI]
[28] Van der Schans F. Improving the buyer attractiveness for suppliers: How to improve the position of a depending buyer [master's thesis]. Rotterdam, the Netherlands: Rotterdam School of Management-Erasmus University; 2014.
[29] Purchase S, Butler B, Alexander P. Becoming customer of choice in the healthcare supply chain: Australia New Zealand Marketing Academy Conference 2011, Perth, Australia, 28-30 November 2011.
[30] Piricz N. Affecting determinants of trust in business relationships. Serb J Manag, 2018; 13: 281-291.[DOI]
[31] Cater B. Trust and commitment in professional service marketing relationships in business-to-business markets. Manag Glob Tr, 2007; 5: 371.
[32] Chen PY, Chen KY, Wu LY. The impact of trust and commitment on value creation in asymmetric buyer-seller relationships: the mediation effect of specific asset investments. J Bus Venturing, 2017; 32: 457-471.[DOI]
[33] Paul WT, Semeijn J, Ernstson S. Supplier satisfaction and commitment: The role of influence strategies and supplier development. J Purch Supply Manag, 2010; 16: 17-26.[DOI]
[34] Darroch J, Miles MP. Sources of Innovation. Technol Innovat Manag, 2015; 13: 97-103.[DOI]
[35] Corsten D, Felde J. Exploring the performance effects of key‐supplier collaboration: An empirical investigation into Swiss buyer-supplier relationships. Int J Phys Distr Log, 2005; 35: 445-461.[DOI]
[36] Nagati H, Rebolledo C. Supplier development efforts: The suppliers' point of view. Ind Market Manag, 2013; 42: 180-188.[DOI]
[37] Johnston DA, McCutcheon DM, Stuart FI et al. Effects of supplier trust on performance of cooperative supplier relationships. J Oper Manag, 2004; 22: 23-38.[DOI]
[38] Viitaharju L, Lähdesmäki M. Antecedents of trust in asymmetrical business relationships: Differing perceptions between food producers and retailers. Mark Intell Plan, 2012; 30: 567-587.[DOI]
[39] Caniëls MCJ, Gelderman CJ. Power and interdependence in Kraljic's purchasing portfolio matrix: 14th annual IPSERA (International Purchasing and Supply Education and Research Association) conference, Archamps, France, 20-24 March 2005.
[40] Eckerd S, Hill JA. The buyer‐supplier social contract: information sharing as a deterrent to unethical behaviors. Int J Oper Prod Man, 2012; 32: 238-255.[DOI]
[41] Squire B, Cousins PD, Brown S. Cooperation and knowledge transfer within buyer-supplier relationships: the moderating properties of trust, relationship duration and supplier performance. Brit J Manage, 2009; 20: 461-477.[DOI]
[42] Sashi CM. Customer engagement, buyer-seller relationships, and social media. Manage Decis, 2012; 50: 253-272.[DOI]
[43] Wathne KH, Heide JB. Opportunism in interfirm relationships: Forms, outcomes, and solutions. J Marketing, 2000; 64: 36-51.[DOI]
[44] Nyaga GN, Lynch DF, Marshall D et al. Power asymmetry, adaptation and collaboration in dyadic relationships involving a powerful partner. J Supply Chain Manag, 2013; 49: 42-65.[DOI]
[45] Gulati R, Sytch M. Dependence asymmetry and joint dependence in interorganizational relationships: Effects of embeddedness on a manufacturer's performance in procurement relationships. Admin Sci Quart, 2007; 52: 32-69.[DOI]
[46] Benton WC, Maloni M. The influence of power driven buyer/seller relationships on supply chain satisfaction. J Oper Manag, 2005; 23: 1-22.[DOI]
[47] Roseira C, Brito C, Ford D. Network pictures and supplier management: An empirical study. Ind Market Manag, 2013; 42: 234-247.[DOI]
[48] European Commission. Internal Market, Industry, Entrepreneurship and SMEs. Accessed July 2, 2021. Available at:[Web]
[49] Leppelt T, Foerstl K, Hartmann E. Corporate social responsibility in buyer-supplier relationships: is it beneficial for top-tier suppliers to market their capability to ensure a responsible supply chain? Bus Res, 2013; 6: 126-152.[DOI]
[50] Torre A. Proximity relationships and entrepreneurship: some reflections based on an applied case study. J Innov Econ Manag, 2014; 2: 83-104.[DOI]
[51] Guan JC, Yan Y. Technological proximity and recombinative innovation in the alternative energy field. Res Policy, 2016; 45: 1460-1473.[DOI]
[52] Schmitt A, Van Biesebroeck J. Proximity strategies in outsourcing relations: The role of geographical, cultural and relational proximity in the European automotive industry. J Int Bus Stud, 2013; 44: 475-503.
[53] Bönte W. Relations: Are Knowledge Spillovers and Geographical Proximity Relevant? J Econ Behav Organ, 2008; 67: 855-870.[DOI]
[54] Houe T, Duchamp D. Relational impact of buyer-supplier dyads on sustainable purchasing and supply management: a proximity perspective. Int J Logist Manag, 2021; 32: 567-591.[DOI]
[55] Likert R. A technique for the measurement of attitudes. Arch Psychol, 1932; 140: 1-55.
[56] Cronbach LJ. Coefficient alpha and the internal structure of tests. Psychometrika, 1951; 16: 297-334.[DOI]
[57] Darma S, Hakim YP, Kurniawan E et al. Understanding market behavior on corn commodity: phenomenon at year end. Asian J Agr Rural Dev, 2022; 12: 53-64.[DOI]
[58] Ramadania R, Titik R, Rizky F et al. The study of perceived risk and e-service convenience towards satisfaction and trust of online academic users in Indonesia. Int J Media Inf Lit, 2021; 6: 387-395.[DOI]
[59] Floyd JE. Statistics for economists: a beginning. University of Toronto: Toronto, Canada, 2010.
[60] Dougherty C. Introduction to Econometrics. 3rd ed. Oxford University Press: Oxford, UK, 2007.
[61] Boudt K. Econometrie, 1st ed. Vrije Universiteit Brussel: Brussels, Belgium, 2017.
[62] White H. A heteroskedasticity-consistent covariance matrix estimator and a direct test for heteroskedasticity. Econometrica: J Econometric Soc, 1980; 48: 817-838.[DOI]
[63] Breusch TS. Testing for autocorrelation in dynamic linear models. Aust Econ Pap, 1978; 17: 334-355.[DOI]
[64] Peterson O. What is the acceptable R-squared value? Accessed July, 25 2021. Available at:[Web]
Copyright © 2023 The Author(s). This open-access article is licensed under a Creative Commons Attribution 4.0 International License (https://creativecommons.org/licenses/by/4.0), which permits unrestricted use, sharing, adaptation, distribution, and reproduction in any medium, provided the original work is properly cited.


