Stock Price Forecasting: Machine Learning Models with K-fold and Repeated Cross Validation Approaches
Tayo P Ogundunmade1,2*, Adedayo A Adepoju1, Abdelaziz Allam2
1Department of Statistics, Univeristy of Ibadan, Ibadan, Nigeria
2Department of Mathematics, University of Tlemcen, Tlemcen, Algeria
*Correspondence to: Tayo P Ogundunmade, Masters, Teaching Assistant, Department of Statistics, University of Ibadan, Oduduwa Road, Ibadan, Oyo, 200132, Nigeria; Email: ogundunmadetayo@yahoo.com
DOI: 10.53964/mem.2022001
Abstract
Background: Stock exchange price prediction is one of the most researched topics, attracting interest from both academics and industry. Various algorithms have been developed since the introduction of Artificial Intelligence (AI) and have been used to forecast equities market movement. Despite all these researches, less attention has been paid to the use of cross validation (CV) approaches for better stock price prediction.
Objective: The aim of this work is to predict Nigerian stock prices using machine learning models with K-fold and repeated K-fold CVs.
Methods: In this work, we consider the prediction performance of machine learning models under two cross validation approaches, namely K-fold and repeated K-fold CVs and when no cross validation technique is used. The models consider here are simple linear regression model, random forest (RF), classification and regression tree (CART), and artificial neural network and the support Vector Machine model. Standard strategic indicators such as root mean square error and mean absolute error are used to evaluate the models. The financial data including real gross domestic product, inflation rate, exchange rate and interest rate are used as the input units in the model.
Results: Predicting models with CVs technique exhibit superior performance to models with no CV technique involved.
Conclusion: Modelling and forecasting stock exchange prices using RF model with CV are conducive to prediction for stock exchange price in Nigeria. Future research are warranted to consider other machine learning models with CVs approaches.
Keywords: stock exchange price, cross validation, support vector machine, mean absolute error, root mean square error
1 INTRODUCTION
The stock market is known for its volatility, dynamic, and nonlinear nature. Multiple (macro and micro) aspects, such as politics, global economic conditions, unforeseen events, a company's financial performance, etc., are inconducive to accurate stock price forecast. The attempt to forecast or predict the future value of a stock, a market sector, or even the entire market is referred to as stock market prediction. It concerns the interest of a wide range of people, including firms, traders, market participants, data analysts, and even computer experts working in machine learning and AI. Investing in the stock market exposes you to a variety of market risks because the value of a company's stock is highly dependent on its profits and performance in the marketplace, and thus can fluctuate due to a variety of factors such as government policies, microeconomic indicators, demand and supply, etc. Traditionally, two approaches have been proposed for predicting an organization's stock price. One is technical analysis method that predicts the future price of a stock by using historical data such as closing and opening prices, volume traded, adjacent close values, etc. The other is performed on the basis of external factors such as gross domestic product (GDP), inflation rate, exchange rate, etc., and this is the approach considered in this study.
The research by Song et al.[1] provides three distinct Artificial Neural Network models that incorporate the use of multiple-input features, binary features, and technical features in order to discover the best strategy to predict stock market price. In the study, the accuracy of the models was investigated, and it was discovered that the model with binary features had the highest accuracy. As a result, binary features were determined to be lightweight and best suited for stock prediction. However, the study has some limitations in that converting the characteristics to binary removes some of the critical information for prediction.
In a study conducted by Misra et al.[2] discovered that using the Principal Component Analysis on the data to identify the most important components improves the accuracy of predictions generated by the Linear Regression Model. Linear regression is preferred for linear data due to its high confidence value; a high accuracy rate was observed on a binary classification model using the RF approach; and the Multilayer Perceptron produced the least amount of error when making predictions.
The stock price was represented as a time series by Jeevan et al.[3], which prevented the model's difficulties during the training phase. According to the authors, the article used normalized data and a Recurrent Neural Network model to make forecasts that were very close to the actual values, indicating that machine learning techniques are the best for forecasting stock prices.
Sharma et al.[4] deduced that daily sentiment scores of various companies have an impact on their stock prices. When information or news about/by an organization is shared across multiple social media platforms, it can encourage investors to buy/sell the company's stock, causing its stock value to fluctuate. As a result, the authors proposed a stock market prediction model that included sentimental analysis as one of the indicators.
Pahwa et al.[5] used Linear Regression, a supervised learning approach, to forecast stock prices in their study. By researching the GOOGL stock and extracting nearly 14 years of data, the proposed research effort essentially explains the entire process of using a given dataset to estimate the closing value. From previous studies where models for stock price has been developed, less usage of better CV approaches has been considered immense contribution to model building for predicting stock prices. Most papers only consider splitting the data into 70%, 80% and 90% of the training set, the rest are tested and continue with model building, whereas using machine learning CV methods for model building for prediction makes it possible to build preferable models and predictions. The goal of this paper is to forecast Nigerian stock prices using machine learning models with the use of K-fold and repeated k-fold CVs. We compare the performance of the forecasting models with no CV technique and those with CV technique. The remainder of the paper is organized as follows: Section 2 describes the study's materials and methodology; Section 3 presents the findings and discussions; Section 4 shows the conclusion of the paper.
2 MATERIALS AND METHODS
This is an excellent combination of simple linear regression (LM), nonlinear [CART, artificial neural network (ANN)], and complex nonlinear methods [support vector machine (SVM), RF]. We reset the random number seed before each run to ensure that each algorithm is evaluated using the same data splits, which ensures that the outcomes are directly comparable.
2.1 Data Description
The data used in this work is a secondary data on the price of stock exchange price, GDP, inflation rate, exchange rate and interest rate of Nigeria. The data was obtained from the Central Bank of Nigeria. It is a quarterly data from first quarter of 1985 to the fourth quarter, 2019. GDP, inflation rate, exchange rate and interest rate are used as the explanatory (feature) variables while stock exchange price is used at the target variable.
2.2 Linear Regression Model
Linear regression is a machine learning algorithm utilized for supervised learning. It plays out the assignment to predict a target variable on the given explanatory variable(s), detects a linear relationship between these variables, and is one of the most-involved relapse algorithms in machine learning. A significant variable from the dataset is decided to predict the target variable, and a linear regression algorithm is used when the variables are continuous.
The model used is given as
|
Where
y = Stock exchange price
x = Real GDP, Inflation rate, Exchange rate and Interest rate
e = error term
2.3 Random Forest Regression
Random Forests, a troupe of decision trees, is a supervised learning model used for regression and classification, in which the input data is gone through different decision trees. Dissimilar to decision tree regression (single tree), a random forest utilizes different decision trees for predicting the result. Random data points are chosen from the given dataset, and a decision tree is worked with them through this algorithm. A few decision trees are then modeled that predict the value of any new data item.
2.4 Support Vector Regression (SVR)
SVR likewise utilizes a similar thought to SVM however here it attempts to predict the real values. This algorithm uses hyper planes to segregate the data. On the off chance that this partition is unimaginable then it utilizes a piece stunt where the aspect is expanded and afterward the information focuses become distinct by a hyper plane.
In contrast to OLS, the goal of SVR is to minimize the coefficients specifically, the l2-norm of the coefficient vector rather than the squared error. Instead, the error term is handled in the constraints, where we set the absolute error to be less than or equal to a specified margin, known as the maximum error (epsilon). To achieve the desired accuracy of our model, we can adjust epsilon. The following are our new objective function and constraints:
Minimize,
|
Constraint,
|
where w is the weight.
2.5 Neural Network Regression
Statistical models such as ANN has been useful to many functions, such as forecasting, curve-fitting, and regression in the fields of engineering, earth sciences, medicine, hydrology, etc. ANN models study data and carry out jobs such as classification or forecasting. The nature of the data is used to assess the network model in the building procedure, unlike other models that use before postulations. ANN arrangements are structured in levels positioned as input, hidden, and output levels. Within every level, there are interconnected elements known as neurons. Weights are the essential variables of the ANN models used to resolve a hitch. The total of the weighted inputs and the bias terms are entered into an activation function that is executed to avert the output from getting bigger. Frequently executed sets of activation functions include the sigmoid, hyperbolic tangent, and the rectified linear unit functions[6]. A simple neural network regression model is given as:
|
Where y = stock price
g(.) = activation function = tanhx
w = weights
M = number of hidden neuron
x = feature variables = Real GDP, Inflation rate, Exchange rate and Interest rate
e = error term
2.6 Decision Tree Regression
The decision tree models can be applied to the quantitative and categorical explanatory variables. Decision trees are great at catching non-linear relationships between the independents and the dependent variables. The principle of the decision tree model is to part the dataset into smaller sets that are then made to plot the value of any information point that associates with the issue articulation. The parting of the data by this algorithm brings about a decision tree that has decision and leaf hubs. Machine Learning specialists prefer this model in situations where there isn't sufficient change in the dataset.
2.7 K-fold and Repeated K-fold Cross Validation
Cross-validation is a statistical method used to assess the ability of AI models. It is often used in applied AI to consider and select a model for a given predictive modeling problem because it is straightforward, easy to perform, and capable of assessing those less sensitive using other methods in most cases. In this work, K-fold and Repeated K-fold CVs are utilized.
2.7.1 K-fold CV
Cross-validation is a resampling strategy for assessing AI models on a sample of data. The interaction incorporates just a single parameter, k, which indicates the number of groups into which a given dataset ought to be divided. Thus, the cycle is oftentimes referred to as k-Fold CV. Whenever an exact value for k is determined, it is substituted for k in the model's reference, for instance, k=10 for 10-fold cross-validation. The steps in K-Fold CV are:
- Randomly shuffle the dataset.
- Divide the data into a total of k groups.
- For each distinct group: (a) Consider a group as the test data set; (b) Use the remaining groupings as a training data set; (c) Fit a model to the training data and test it on the test data; and (d) Keep the evaluation metric value.
- Summarize the performance of the model using the evaluation metric value.
2.7.2 Repeated K-fold CV
For both classification and regression machine learning models, repeated K-fold is the preferred CV strategy. The main method of the repeated K-fold algorithm is shuffling and random sampling of the data set numerous times, which results in a robust model because it covers the most training and testing activities. The accuracy of a machine learning model is evaluated using this CV technique, which is based on two parameters. The first argument, K, is an integer value that specifies how many folds the given dataset will be divided into (or subsets). The model is prepared on the K-1 subsets of the K folds, with the leftover subset being utilized to assess the model's performance. These stages will be repeated up to a given number of times, which will be determined by the second parameter of this method, giving it the name Repeated K-overlay, and that implies the K-fold CV cycle will be repeated a particular number of times. The steps are summarized as follows:
1. Randomly divide the data into K subsets.
2. For each of the data point subsets that have been produced: (a) Consider that subset to be the validation set; (b) All of the rest subsets will be used for training purposes; (c) The model is trained and evaluated on a validation or test set; and (d) Calculate the error in your prediction.
3. Repeat the above steps K times, or until the model has not been trained and tested on all subsets.
4. Calculate the overall prediction error by averaging the prediction errors in each case.
2.8 Prediction Metrics
A predictive model's performance is measured using an evaluation metric. This typically entails training a model on a dataset, then using the model to generate predictions on a test dataset that was not used during training and comparing the predictions to the predicted values in the test dataset.
2.8.1 Root Mean Square Error (RMSE)
RMSE measures the difference of values. These values are the one which are predicted by the model and the actual values. Whatever deviation is measured by RMSE is called residuals. This method is also called root mean square deviation (RMSD). In order to aggregate the magnitude of the errors, RMSD is used to serve the purpose of prediction. Mathematically, RMSE is calculated as
|
2.8.2 Mean Absolute Error (MAE)
MAE is referred to as the difference between 2 continuous variables. MAE is used to measure accuracy for continuous variables. When we have a set of predictions, it is used to measure the average magnitude of errors. It does not take into consideration the direction of the magnitude.
|
3 RESULTS AND DISCUSSION
This section shows the result of the analyses. It involves the exploratory data analysis of the data and the model performance for the machine learning models considered in this work. The machine learning models considered are the linear regression model, SVM, RF, ANN and the CART (random tree) model. The models are considered under two CV approaches, i.e. K-fold and repeated CVs. Training set of 70, 80 and 90 are also used.
3.1 Exploratory Data Analysis
This involves the descriptive statistics of the variable, time plot showing the pattern of the data over the years considered and the correlation matrix which shows the relationship between the variables.
Table 1 shows the descriptive statistics of the variables. The table shows that the average value for real GDP over the span of years considered is 9526.25. For Inflation rate, the average value is 18.29. Exchange rate also has the average value of 105.35. Interest rate has the average value of 18.46 and stock exchange price, an average value of 1373.14. The table also shows the values of skewness and kurtosis for the variables. We could also see from the table that the data count for all the variables is 140 data points.
Table 1. Descriptive Statistics of the Variables
Descriptive |
Real GDP |
Inflation Rate |
Exchange Rate |
Interest Rate |
Stock Price |
Mean |
9526.25 |
18.29 |
105.35 |
18.46 |
1373.14 |
Standard Error |
406.64 |
1.59 |
7.69 |
1.59 |
153.90 |
Median |
7458.61 |
12.28 |
117.40 |
12.65 |
592.96 |
Standard Deviation |
4811.48 |
18.83 |
91.03 |
18.78 |
1821.02 |
Sample Variance |
23150288 |
354.40 |
8287.17 |
352.81 |
3316117 |
Kurtosis |
-1.14 |
10.27 |
-0.10 |
10.27 |
2.35 |
Skewness |
0.60 |
3.14 |
0.75 |
3.14 |
1.84 |
Range |
15606.01 |
111.14 |
303.19 |
111.14 |
7517.15 |
Minimum |
3921.71 |
-1.88 |
3.76 |
-1.88 |
113.13 |
Maximum |
19527.72 |
109.26 |
306.95 |
109.26 |
7630.28 |
Sum |
1333675 |
2561.19 |
14749.38 |
2584.05 |
192239.10 |
Count |
140 |
140 |
140 |
140 |
140 |
Figure 1 shows the time plot of the variables used in this study. It consists of real GDP, stock exchange price, interest rate, inflation rate and exchange rate.
|
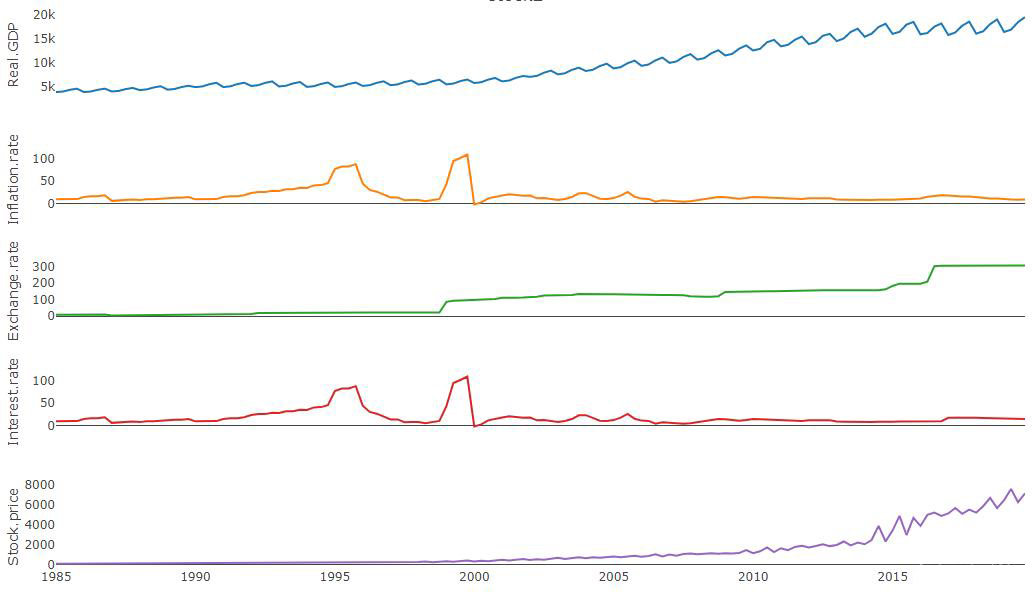
Figure 1. Time plot for the variables.
Figure 2 shows the correlation plot and values between the variables. From the plot, we could deduce that there exist a positive correlation of 0.86 between stock exchange price and real GDP, a negative correlation of -0.21 between stock exchange price and inflation rate, a positive correlation of 0.9 between stock exchange price and exchange rate and a negative correlation -0.18 between stock exchange price and interest rate.
|
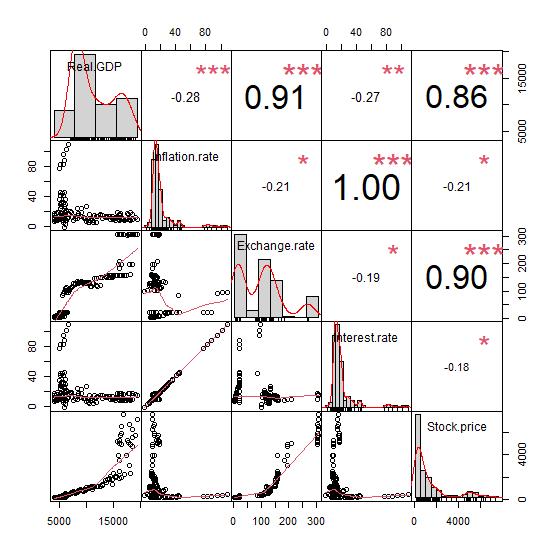
Figure 2. Scatterplot matrix of the variable.
3.2 Regression Results
Table 2 shows the result of the regression analysis on the data without CV. The table shows the estimates, standard error, t-value and the significance value.
Table 2. Regression Estimates and Significance
|
Estimate |
Std. Error |
t Value |
Pr(>|t|) |
(Intercept) |
-1.003e+03 |
2.041e+02 |
-4.914 |
2.54e-06 *** |
Real GDP |
1.143e-01 |
3.217e-02 |
3.552 |
0.000527 *** |
Inflation rate |
-1.561e+02 |
3.834e+01 |
-4.071 |
7.94e-05 *** |
Exchange rate |
1.180e+01 |
1.694e+00 |
6.964 |
1.32e-10 *** |
Interest rate |
1.571e+02 |
3.836e+01 |
4.097 |
7.19e-05 *** |
Signif. codes: 0 ‘***’ 0.001 ‘**’ 0.01 ‘*’ 0.05 ‘.’ 0.1 ‘ ’ 1
Adj R-squared: 0.8325
Table 2 shows the results of the regression between the stock exchange price and the explanatory variables considered. From the Table 2, real GDP, exchange rate and interest rate produced a positive estimates of 0.1143, 11.80 and 157.1 respectively. This implies that, at every unit contribution of real GDP, stock exchange price of Nigeria will be added by 0.1143. Inflation rate produced a negative contribution of -156.1 to stock exchange price in Nigeria which implies that, at every unit contribution of inflation rate, stock exchange price will be reduced b 156.1. In all, these variables are significant to stock exchange price has they all produce p-values less than 0.05. Also, it could be seen from the table that the explanatory variables are able to explain the stock exchange price 83.25%.
3.3 Model Performance
The performance results for the models considered in this study are discussed in this section. The data were divided into training sets of 70, 80 and 90 percent respectively. 10 K-fold and repeated CV approaches were looked into in determining the performance of these models. The results in Tables 3-5 show the root mean square estimate and the MAE value for the forecast performance of the models.
Table 3. Performance Results of the Models at Training Set of 70%
Model |
Training = 70 |
Training = 70 |
||||
K-Fold |
Repeated K-Fold |
No Cross Validation |
||||
RMSE |
MAE |
RMSE |
MAE |
RMSE |
MAE |
|
Linear |
842.0012 |
701.3541 |
831.8347 |
688.0908 |
855.5491 |
670.8155 |
CART (random tree) |
536.2554 |
365.4474 |
457.5999 |
336.1308 |
553.7729 |
346.5939 |
rf |
299.4596 |
167.0407 |
271.2229 |
150.107 |
378.6939 |
194.6593 |
ANN |
2255.2460 |
1421.7210 |
2263.875 |
1420.831 |
2265.883 |
1472.086 |
SVM |
492.9765 |
334.6851 |
459.8437 |
321.0843 |
548.5950 |
349.8701 |
Table 4. Performance Results of the Models at Training Set of 80%
Model |
Training = 80 |
Training = 70 |
||||
K-Fold |
Repeated K-Fold |
No Cross Validation |
||||
RMSE |
MAE |
RMSE |
MAE |
RMSE |
MAE |
|
Linear |
803.7467 |
688.0961 |
782.9962 |
665.9050 |
884.5001 |
676.4033 |
CART (random tree) |
682.2480 |
410.9887 |
499.4950 |
351.8814 |
613.2698 |
361.0351 |
rf |
363.2621 |
190.5044 |
292.9873 |
155.9461 |
370.6642 |
187.6393 |
ANN |
2190.1100 |
1367.3590 |
2219.0370 |
1375.3820 |
2308.417 |
1385.031 |
SVM |
402.2336 |
260.8988 |
337.1702 |
228.0919 |
490.7508 |
304.5572 |
Table 5. Performance Results of the Models at Training Set of 90%
Model |
Training = 90 |
Training = 90 |
||||
K-Fold |
Repeated K-Fold |
No Cross Validation |
||||
RMSE |
MAE |
RMSE |
MAE |
RMSE |
MAE |
|
Linear |
790.5033 |
651.8717 |
781.8462 |
605.4430 |
796.8679 |
655.6131 |
CART (random tree) |
593.6534 |
388.4835 |
432.8650 |
343.4533 |
682.6787 |
410.1940 |
rf |
308.5238 |
169.4048 |
292.9873 |
155.9461 |
412.2773 |
187.8909 |
ANN |
2219.4540 |
1370.0320 |
2219.0370 |
1375.3820 |
2304.29 |
1457.513 |
SVM |
467.1424 |
288.3347 |
337.1702 |
228.0919 |
506.6192 |
308.5058 |
3.4 Discussion
Tables 3-5 show the prediction performance of the considered models. From the tables, we could see the performance of these models when no CV approaches are used and their performance when using K-fold and repeated K-fold CV under 70%, 80% and 90% training sets using RMSE and MAE as the performance criteria. Looking at the tables critically, at all the training sets (70, 80 and 90), the models produced a lower RMSE values and MAE for repeated K-fold CV followed by the K-fold CV. The performance of the model was inferior when no CV approach was implemented. Also from the results, we could see that RF model best predict the stock exchange price in this study as it produced the lowest RMSE and the MAE throughout the training set and at all cases considered compared to other models used in this study. Figure 3 shows the plot of the predictive performance of the models.
|
|
|
|
|
|
|
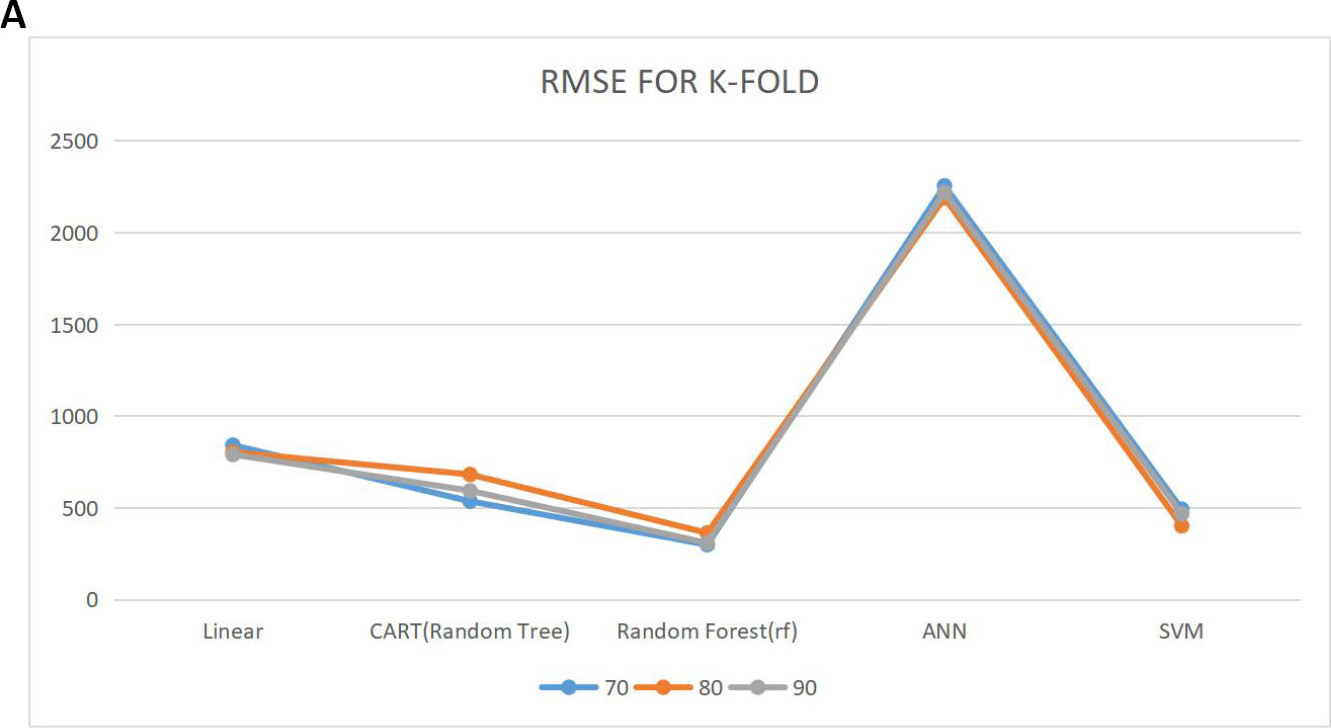
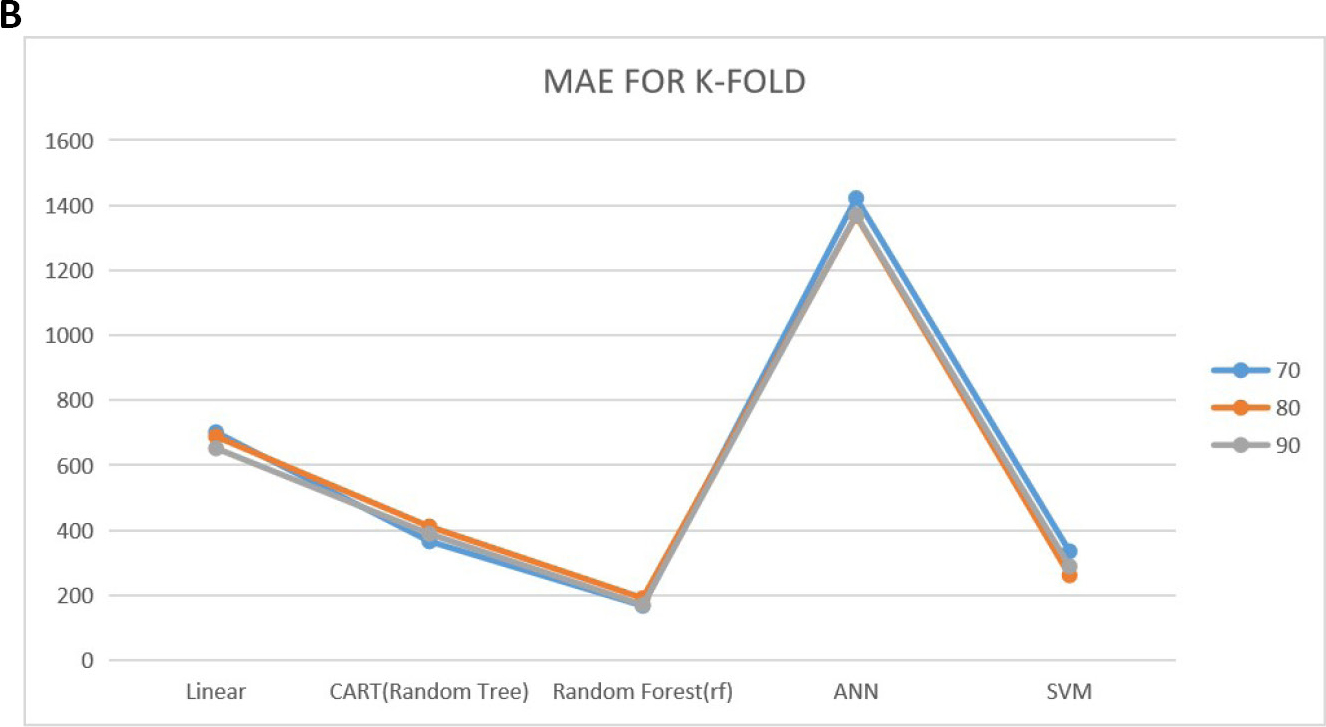
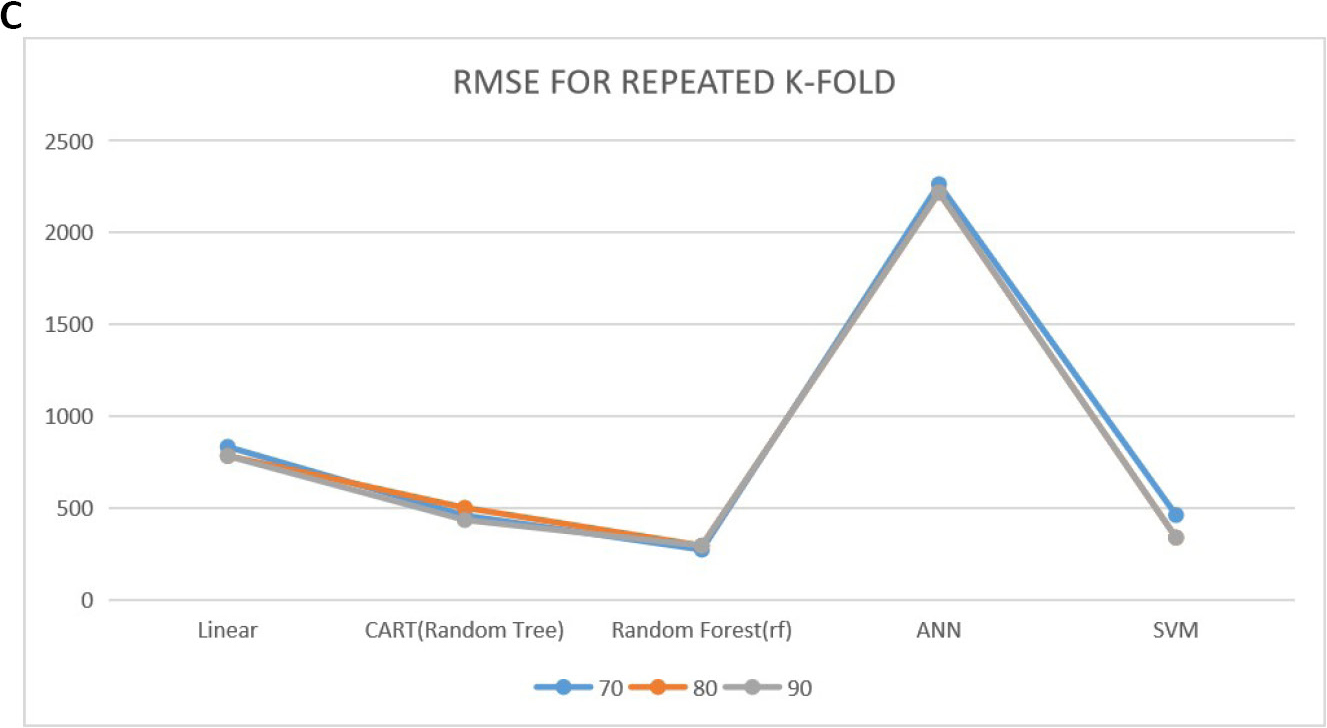
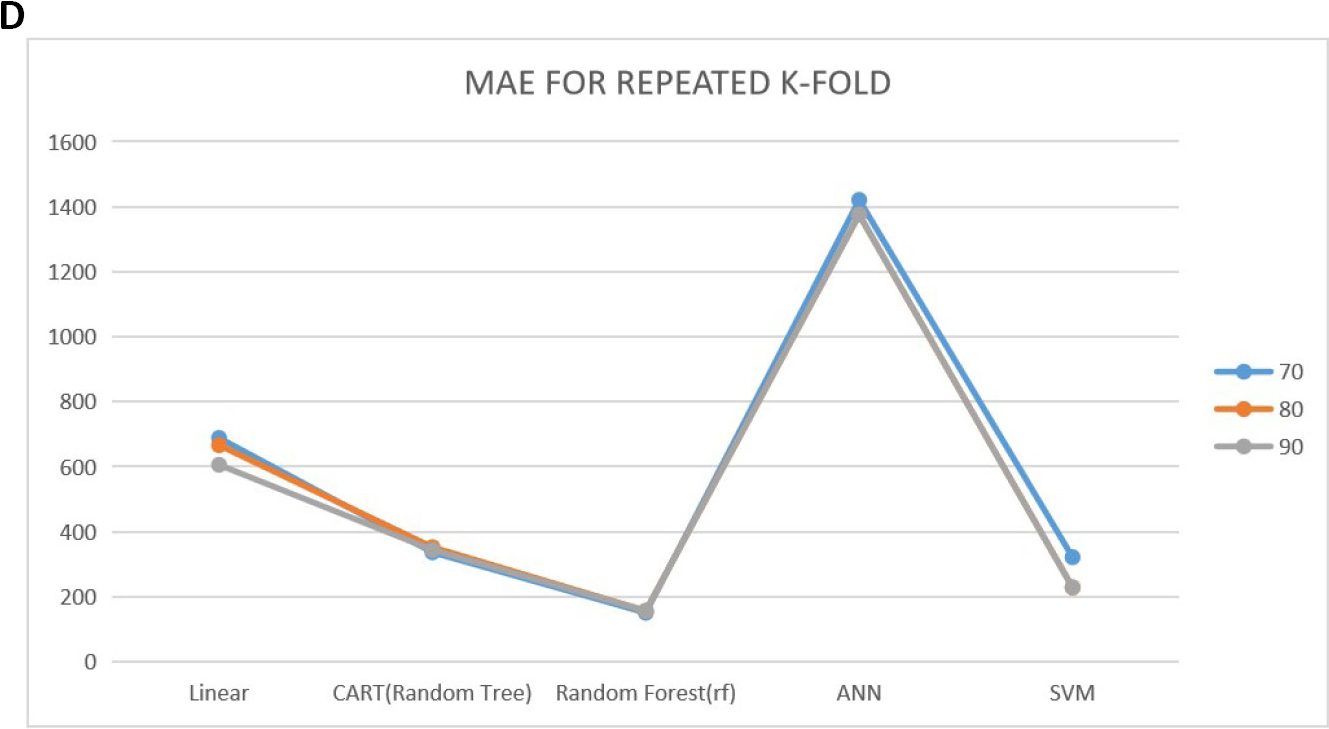
Figure 3. The plot of the predictive performance. A: Root mean square error for K-fold CV; B: Mean absolute error plot for K-fold CV; C: Root mean square error for repeated K-fold CV; D: Mean absolute error plot for repeated K-fold CV.
4 CONCLUSION
In this work, we have been able to model stock price using linear regression model, RF regression, random tree (CART), ANN and the SVM model. Linear regression model estimates were obtained so as to see the significant contributions of the explanatory variables considered. From the result, we observed that GDP, inflation rate, exchange rate and interest rate are all significant at 5%. This implies that these variables contributes to the price of stock exchange in Nigeria. Also we found that among the five models considered, RF model exhibited a superior forecast performance for stock exchange price in Nigeria as it produced the lowest RMSE and the MAE throughout the training sets and even at using k-fold and repeated k-fold CVs. Repeated K-fold and K-fold CVs also produced favorable forecast performance compared that with no CV technique involved in modelling stock price in Nigeria. In conclusion, we recommend the use of CV technique in modelling stock exchange price and also the use of RF model. The significance of this study is that, researchers are provided with the appropriate model and techniques for stock price prediction in Nigeria, which enables them to have an optimal plan for the future. For further study, other important variables can be considered to measure stock price in Nigeria. Also other CV approaches can be considered so as to have a preferable modelling for stock prices in Nigeria.
Acknowledgements
Not Applicable.
Conflicts of Interest
The authors had no conflict of interest.
Author Contribution
Ogundunmade TP designed this study and wrote this article. Adepoju AA and Allam A revised the paper for intellectual content. All authors approved the final version.
Abbreviation List
AI, Artificial intelligence
ANN, Artificial neural network
CV, Cross validation
GDP, Gross domestic product
MAE, Mean absolute error
rf, Random forest
RMSD, Root mean square deviation
RMSE, Root mean square error
SVM, Support vector machine
SVR, Support vector regression
References
[1] Song Y, Lee J. Design of stock price prediction model with various configurations of input features. Proceedings of the International Conference on Artificial Intelligence, Information Processing and Cloud Computing, Sanya, China, 19-21 December 2019. DOI: 10.1145/3371425.3371432
[2] Misra M, Yadav AP, Kaur H. Stock market prediction using machine learning algorithms: a classification study. 2018 International Conference on Recent Innovations in Electrical, Electronics & Communication Engineering. IEEE, Odisha, India, 27-28 July 2018. DOI: 10.1109/ICRIEECE44171.2018.9009178
[3] Jeevan B, Naresh E, Kambli P. Share price prediction using machine learning technique. 2018 3rd International Conference on Circuits, Control, Communication and Computing. IEEE, Bangalore, India, 3-5 October 2018. DOI: 10.1109/CIMCA.2018.8739647
[4] Sharma V, Khemnar R, Kumari R et al. Time series with sentiment analysis for stock price prediction. 2019 2nd International Conference on Intelligent Communication and Computational Techniques. IEEE, Jaipur, India, 28-29 September 2019. DOI: 10.1109/ICCT46177.2019.8969060
[5] Pahwa K, Agarwal N. Stock market analysis using supervised machine learning. 2019 International Conference on Machine Learning, Big Data, Cloud and Parallel Computing. IEEE, Faridabad, India, 14-16 February 2019. DOI: 10.1109/COMITCon.2019.8862225
[6] Ogundunmade TP, Adepoju AA. The performance of artificial neural network using heterogeneous transfer functions. Int J Data Sci, 2021; 2: 92-103. DOI: 10.18517/ijods.2.2.92-103.2021
Copyright © 2022 The Author(s). This open-access article is licensed under a Creative Commons Attribution 4.0 International License (https://creativecommons.org/licenses/by/4.0), which permits unrestricted use, sharing, adaptation, distribution, and reproduction in any medium, provided the original work is properly cited.


