
Compatibility Study of Moxifloxacin Hydrochloride with Various Excipients and Formulation of its Spheroids
Rinkal Sharma1, Vivek Ranjan Sinha1, Ashok Kumar Yadav1*
1University Institute of Pharmaceutical Sciences, Panjab University, Chandigarh, India
*Correspondence to: Ashok Kumar Yadav, Assistant Professor, University Institute of Pharmaceutical Sciences, Panjab University, Chandigarh, 160014, India; Email: ashoky@pu.ac.in
Abstract
Objective: The aim of current study is to investigate compatibility study of moxifloxacin hydrochloride with various excipients and development of formulation of its spheroids.
Methods: Different analytical instruments such as Bruker Advance Neo 500 MHz NMR spectrometer, Fourier transform infrared spectroscopy (FTIR) Spectrum RX 1, Differential scanning calorimetry (DSC) [DSC-Q20, TA Instruments, (New Castle Delaware, U.S)], and IR (Perkin Elmer spectrum 400 USA FTIR.) and UV spectrometer (Lab India) have been used. Moxifloxacin hydrochloride (MFX.HCl) was managed as gift sample from Galpha Laboratories Ltd., New Delhi. Methyl cellulose, lactose, sodium carboxy methylcellulose, magnesium stearate (MgS), hydroxypropyl methylcellulose (HPMC), microcrystalline cellulose (MCC) PH 200, MCC PH 101, mannitol, starch, potassium hydrogen phosphate, di-sodium hydrogen phosphate, sodium chloride, sodium hydroxide, and HCl were obtained from Loba chemie Pvt. Ltd., Mumbai and Central drug house, New Delhi. The acetonitrile (HPLC grade), and methanol (HPLC grade), were bought from Thermo-fisher scientific India Pvt. Ltd.
Results: MFX.HCl was characterized by melting point, DSC, FTIR, Nuclear magnetic resonance (NMR), and UV spectrometer. Compatibility study of MFX.HCl was done by use of different analytical techniques. Preformulation investigations were carried out by UV validation, solubility testing for drug. Five batches of MFX.HCl were formulated with the use of diluent and HPMC as binder in the formulation. Further, pellets of MFX.HCl was characterized. The in vitro drug release of MFX.HCl with batches B2, B3, B4 and B5 displayed 55.77%, 66.83%, 73.49% and 95.32% drug release within the first 30 minutes. Release kinetic study of developed pellets for moxifloxacin.HCl was also investigated for batches i.e. B2 to B5.
Conclusion: MFX.HCl was founded compatible with used excipients. From the findings of the MFX.HCl pellet characterization investigations, batches B2, B3, and B5 had high or excellent flow characteristics, whereas batch B1 had a fair flow nature. The in vitro drug release of MFX.HCl of batches B2, B3, B4, and B5 revealed 55.77%, 66.83%, 73.49%, and 95.32% drug release within the first 30 minutes, respectively. The drug content for batches B1–B5 ranged from 98.7 to 100.2%. Because B5 had less HPMC than the previous batches, it displayed the maximum release. A release kinetic analysis of the drug's produced pellets was also conducted for batches B2-B5 of MFX.HCl. The MFX.HCl was released using the Hixon Crowell model in batch B2, the Higuchi model in batch B4, the Zero Order Kinetics model in batch B3, and the First Order Kinetic Model in batch B5.
Keywords: compatibility study; moxifloxacin hydrochloride; excipients; formulation; spheroids
1 INTRODUCTION
One of the most prevalent infectious diseases in the world is community-acquired pneumonia (CAP)[1]. The prevalence of CAP varies between 1.6 to 11 cases per 1000 adults in different countries, although figures are hard to come by because there is not a single, accepted definition for the illness[2]. CAP is linked to a significant financial burden on the society for medical care and is a leading cause of illness, hospitalization, mortality, and decreased quality of life. The wide range of severity for disease is demonstrated by the mortality rates of CAP, that differ from less than 5% in out patients to 10% in ward patients and more than 30% in patients requiring intensive care[3-10]. Men are meaningfully more likely than women to experience CAP and CAP-related mortality, which rise substantially with age[9,11]. The fourth-generation fluoroquinolone, moxifloxacin, has an extensive range of efficacy against infections like M. catarrhalis and H. influenzae that are resistant to tetracyclines, penicillins, and macrolides, as well as multi-resistant pneumococci. L. pneumophila, C. pneumoniae, and M. pneumoniae are among the typical pathogens that moxifloxacin is active against[12-15]. Preformulation research is required for a novel dosage form to be stable, safe, and effective[16]. A portion of this procedure involves examining the drug's physical and chemical properties both by itself and in conjunction with excipients[17]. Drug substances are made by combining various excipients and active pharmaceutical ingredients (API). Excipients are broadly predictable for their ability to enhance ability of product to provide medication effectively, speed up API release, and protect it from deterioration[18]. Excipients, although pharmacologically inactive, may interact with a medicine during administration and affect its stability[19,20]. The interaction of the medicine with excipient alters the chemical and physical properties of the formulations, leading to incompatibility[21-26]. Careful excipient selection is necessary to provide dependable and effective formulations that can increase patient compliance, enhance drug absorption, and extend shelf life[27]. Analytical techniques must be used to properly examine any potential incompatibilities between the drug and excipient to prevent such interactions during the drug development process. The existing study evaluated for formulation of spheroids. Drug-excipient compatibility of moxifloxacin.HCl using analytical techniques were investigated. The utilized excipients in the current study were methyl cellulose, mannitol, starch, magnesium stearate (MgS), hydroxypropyl methylcellulose (HPMC), sodium carboxymethyl cellulose (NaCMC), and microcrystalline cellulose (MCC). As far as we are aware, there has not been any report on the compatibility research of moxifloxacin hydrochloride (MFX.HCl) with these excipients and their formulation development of the spheroid with MFX.HCl. One of the key rationales for the development of spheroids is multiparticulate systems that show better reproducible pharmacokinetic behaviour than conventional (monolithic) formulations. Like pellets disperse quickly in the GI track compared to tablets and powder-filled capsules and which ultimately enhance the drug absorption with minimize local irritation of certain irritant drugs as the amount of drug available in single pellet is quite small. It also reduces inter- and intra-patient variability. Furthermore, a standard moxifloxacin.HCl spheroid was developed utilizing the direct compression approach, considering the post-compression investigations, different study of spheroids, in vitro drug release, and suitable excipients were evaluated.
2 MATERIALS AND METHODS
MFX.HCl was obtained as gift sample from Galpha Laboratories Ltd., New Delhi. Methyl cellulose, lactose, sodium carboxy methylcellulose, MgS, HPMC, MCC PH 200, MCC PH 101, acetone, mannitol, starch, potassium hydrogen phosphate, acetonitrile (HPLC grade), methanol (HPLC grade), di-sodium hydrogen phosphate, sodium chloride, sodium hydroxide, and HCl were obtained fromLoba chemie Pvt. Ltd., Mumbai and Central drug house, New Delhi. The solvents were bought from Thermo-fisher scientific India Pvt. Ltd.; Mumbai, India.
2.2 Methods
The pure drug was characterized for its identity, quality and purity and compatibility study was carried out using Differential scanning calorimetry (DSC) [DSC-Q20, TA Instruments, (New Castle Delaware, U.S)], NMR (Bruker Advance Neo 500MHz NMR spectrometer), and IR (Perkin Elmer spectrum 400 USA FTIR.) techniques. It is an essential step for the formulations. Solubility is one of the important characteristics of product development.
2.2.2Analytical Method Development and Validation
2.2.2.1 Determination of Wavelength for Maximum Absorbance (λmax)
The drug is first subjected for scanning a wavelength to detect the absorbance maximum (max), which is necessary for the standardization of MFX.HCl using UV spectroscopy. The prepared samples were scanned through a UV spectrophotometer between 200 and 400 nm. The wavelength, at which maximum absorbance of MFX.HCl was observed (λmax) and that wavelengths were noted in the distilled water and 0.1N HCl, respectively.
2.2.2.2 Pre-formulation Studies
Pre-formulation studies encompass all the activities and studies that are required to convert an API into a suitable dosage form. It can be defined as an investigation of physical and chemical properties of a drug substance alone and when combined with the excipients[28,29].
2.2.2.3 Solubility Studies
To determine the solubility of MFX.HCl in various solvents, excess amount of MFX.HCl was added to test tubes containing 5mL of various solvents (including purified water, methanol, acetone, acetonitrile, 0.1N HCl, and phosphate buffer (pH~ 6.8) and covered the test tubes properly. For 72 hours, these test tubes were kept in an isothermal shaker at 37±0.5°C to achieve equilibrium. The balanced samples were removed from the shaker, the supernatant was collected, and samples were centrifuged at 1000rpm for 5min for allowing the undissolved drug particles to settle down, and samples were filtered via a 0.45μm membrane filter. Concentration of MFX.HCl was then determined in all solvents following dilutions using a UV-Visible spectrophotometer at 295nm.
2.3 Drug-Excipient Compatibility Studies
One of the primary objectives of pre-formulation investigation is to identify possible incompatibilities between a drug and its excipient. Compatibility studies are conducted to comprehend and characterize the physicochemical interactions that occur between a drug and its excipient. To develop a robust and effective formulation, careful selection of excipient is crucial to ensure the quality, safety, efficacy, and stability of the drug. Various experimental techniques, such as DSC, and FTIR spectroscopy have been employed to assess the compatibility of drug-excipients. In this study, DSC, FTIR, and 1H NMR were utilized to examine the compatibility study of drug with excipients[23,24].
2.3.1Visual Observation
The visual observation of drug-excipient mixture was done to observe in changing colour and texture of physical mixture.
2.3.2FTIR Study
To conduct the FTIR study, mixture of API and excipient in 1:1 ratio was thoroughly blended and combined with KBr of IR grade to create pellets. These pellets were produced by compressing the mixture under hydraulic pressure. Subsequently, the prepared pellets were subjected to scan using a Perkin Elmer spectrum 400 USA FTIR instrument, covering a frequency range of 4000-400cm-1. This scanning aimed to identify the peaks corresponding to several functional groups existing in the samples.
2.3.3 Nuclear Magnetic Resonance Spectroscopy (1H NMR Spectroscopy)
NMR spectrum of MFX.HCl with its physical mixtures were recorded in DMSO-d6 using Bruker Advance Neo 500MHz NMR spectrometer. NMR is highly selective method which can detect interaction through variations in the chemical shift due to change in the electron density at the interacting atoms.
For the DSC study, the drug and excipients were mixed in 1:1 ratio, ensuring thorough blending. The resulting mixtures were placed in standard sealed aluminium pans. The pans were heated under a nitrogen purge, using a scanning rate of 10°C/min, starting from 30°C and reaching up to 300°C. When the heating process was underway, an empty aluminum pan served as a reference.
2.4.1 Preparation of Standard Solution
Precisely weighed 25mg of MFX.HCl was added to a 25mL volumetric flask along with 15mL of distilled water, and the mixture was shaken to dissolve. The volume was made up to obtain a 1000µg/mL stock solution. Further, another stock solution of 100µg/mL was prepared from the above stock solution. Standard solutions of drug ranging from 2 to 9µg/mL were prepared from a stock of 100µg/mL. The samples were analyzed using UV spectrometer (lab India) at λmax 295nm by scanning the samples in the range of 200-400nm (Figure 1). A calibration cure was plotted and used for further calculations. A standard plot was also prepared in 0.1 N HCl.
|
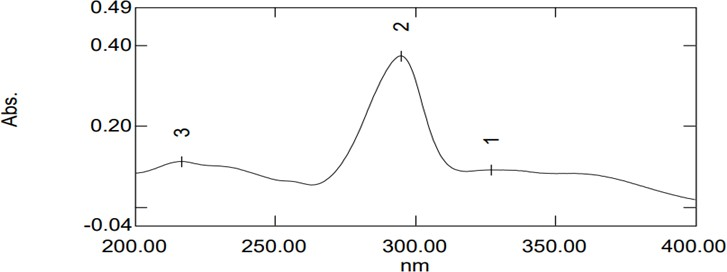
Figure 1. Absorption Spectrum of MFX.HCl.
From the above characterization parameters, it was confirmed that MFX.HCl was in its pure form.
2.4.2 UV/Visible Method Validation
UV/Visible method was authenticated for linearity, range, interday and intraday precision, repeatability, and accuracy.
2.4.2.1 Linearity
An analytical process is considered linear if it can produce results that, within a specified range, are directly proportional to the concentration (amount) of the analyte in the sample and can be fitted into the subsequent linear equation.
y=mx+c
In this case, 'y' represents the response region, 'x' denotes the drug concentration, ‘m' is the slope, and 'c' is the intercept of the best fit line. Plotting a concentration versus absorbance graph allowed for the determination of linearity. By precisely diluting the stock solution, three different concentrations ranging from 2 to 9µg/mL were created, and UV analysis was performed. Dilution absorbance was measured and plotted against the corresponding concentration. The straight-line equation yielded the graph's slope, which was then utilized in other calculations.
2.4.2.2 Range
With 5-9μg/mL working standard solutions, linearity was determined.
2.4.2.3 Precision
The technique of assaying a sample for enough times to yield statistically significant findings is used to determine precision.
2.4.2.4 Intraday Precision
Measuring the absorbance of several concentrations in a single day provided intraday precision. In a single day, three stock solutions were ready. Three separate times during the day, the concentrations of 2, 6, and 9µg/mL were prepared from each stock solution and examined using a UV spectrophotometer. The measured standard deviation (SD) and percent relative standard deviation (%RSD) were used to express precision.
2.4.2.5 Interday Precision
Samples can be analyzed three days in a row to assess interday precision. Every day, three concentrations of samples (2, 6 and 9µg/mL) were created by diluting the freshly manufactured stock solution for that day. The absorbance readings of each sample were recorded after it was examined three times. Next, percentage values of the relative standard deviation (%RSD) were extracted from the information.
2.4.2.6 Accuracy
The accuracy was calculated using the recovery method and reported as a percentage of recovery. To achieve a measurable concentration, three standard solutions were tampered with a known quantity of the drug. The resulting absorbance was measured, and the percent recovery was computed.
2.5 Drug-Excipient Compatibility Studies
One of the primary objectives of pre-formulation investigation is to identify possible incompatibilities between a drug and its excipient. Compatibility studies are conducted to comprehend and characterize the physicochemical interactions that occur between a drug and its excipient. To develop a robust and effective formulation, careful selection of excipient is crucial to ensure the quality, safety, efficacy, and stability of the medicine product. Various experimental techniques, such as DSC, and FT-IR spectroscopy have been employed to assess the compatibility of drug with excipients. In this study, we utilized DSC, FTIR, and 1H NMR to examine the compatibility of drug with excipients[23,24].
2.5.1 Visual Observation
The visual observation of drug-excipient mixture was used to observe in change of colour and texture of physical mixture.
2.5.2 FTIR Study
To conduct FTIR study, mixture of API and excipient in 1:1 ratio was thoroughly blended and combined with KBr of IR grade to create pellets. These pellets were made by compressing the mixture under hydraulic pressure. Subsequently, the prepared pellets were subjected to scan using a Perkin Elmer spectrum 400 USA FTIR instrument, with a frequency range of 4000-400cm-1. This scanning aimed to identify the peaks corresponding to several functional groups existing in the samples.
2.5.3 Nuclear Magnetic Resonance Spectroscopy (1H NMR Spectroscopy)
NMR spectrum of MFX.HCl with its physical mixtures were recorded in DMSO-d6 using Bruker Advance Neo 500MHz NMR spectrometer. NMR is highly selective method which can detect interaction through variations in the chemical shift due to change in the electron density at the interacting atoms.
2.5.4 DSC Study
For the DSC study, the drug and excipients were mixed in 1:1 ratio, ensuring thorough blending. The resulting mixtures were placed in standard sealed aluminium pans. The pans were heated under a nitrogen purge, using a scanning rate of 10°C/min, starting from 30°C and reaching up to 300°C. When the heating process was underway, an empty aluminum pan served as a reference.
2.6 Formulation and Development of Spheroids of MFX.HCl
2.6.1 Extrusion-Spheronization Technique
Extrusion-spheronization is a technique that was usually used in pharmaceutical manufacturing to produce spherical granules or pellets. This process involves two main steps: extrusion and spheronization. In the extrusion step, a wet mass consisting of drug and excipient ingredients is forced through a small orifice or die. This creates cylindrical extrudates of uniform size and shape. The wet mass typically contains binders or wetting agents to facilitate the formation of cohesive extrudates. Once the extrudates are formed, they undergo spheronization. Spheronization involves subjecting the extrudates to mechanical forces, such as rotation or oscillation, in a spheronizer apparatus. Due to these forces, the extrudates break into smaller particles and undergo rounding and smoothing. This results in the creation of spherical granules or pellets. Extrusion-spheronization techniques offer several advantages in pharmaceutical formulation. The resulting spherical granules have improved flow properties, making them suitable for further processing steps such as coating or tableting. They also exhibit enhanced drug release characteristics and can be formulated to achieve controlled or modified drug release profiles.
MFX.HCl was weighed and processed through a #40 sieve together with MCC PH 101 and HPMC. All the ingredients were triturated in mortar for proper formation of powder mass and mixed properly. Distilled water was added slowly to create a moist mass. A #16 sieve was used to extrude the wet blend in one direction. Since wet extrudates cling to one another uring spheronization, the extrudates were dried at ambient temperature. To get the appropriate size and shape, this extrusion was spheronized at 1200rpm for 2 minutes. The wet spheroids were dried into the R & D coater/oven. The compositions for the formulation of MFX.HCl spheroids of different Batches B1, B2, B3, B4 and B5 were specified in the Table 1.
Table 1. Compositions for Formulation of MFX.HCl Spheroids of Different Batches B1, B2, B3, B4 and B5
Ingredients |
Quantity (mg) |
||||
B1 |
B2 |
B3 |
B4 |
B5 |
|
MFX.HCl |
250 |
250 |
250 |
250 |
250 |
Xanthan gum |
- |
50 |
- |
- |
- |
HPMC K15 |
- |
- |
40 |
- |
- |
MCC PH 101 |
- |
100 |
110 |
115 |
130 |
MCC PH 200 |
100 |
|
- |
- |
- |
HPMC |
- |
- |
- |
35 |
20 |
HPMC K100 |
50 |
- |
- |
- |
- |
2.6.2 Characterization of Formulation of MFX.HCl Spheroids
2.6.2.1 Bulk Density
3g of MFX.HCl was weighed separately, that was earlier passed over sieve #22 to break the lumps and transferred into 25mL measuring cylinder, and initial volume was measured. The bulk density was obtained from the following equation[26].
|

2.6.2.2 Tapped Density
The mechanical tapping of a container containing pellets results in an increased bulk density and is known as the "tapped density" (t). Graduated measuring cylinder having a capacity of a specified quantity of pellets (3g) is mechanically tapped 100 times to determine the tapped density. The volume was noted and tapped density was calculated from the following equation[30].
|

|

2.6.3 Carr's Index
Pellets' compressibility refers to their capacity to lose volume when subjected to pressure. The percentage compressibility of pellets was calculated utilizing untapped density and tapped density, and the result is represented by Carr's compressibility index[31].
|

2.6.4 Hausner’s Ratio
It is a measurement of the drug’s frictional resistance. The ratio of bulk density to tapped density was used to calculate it.
|

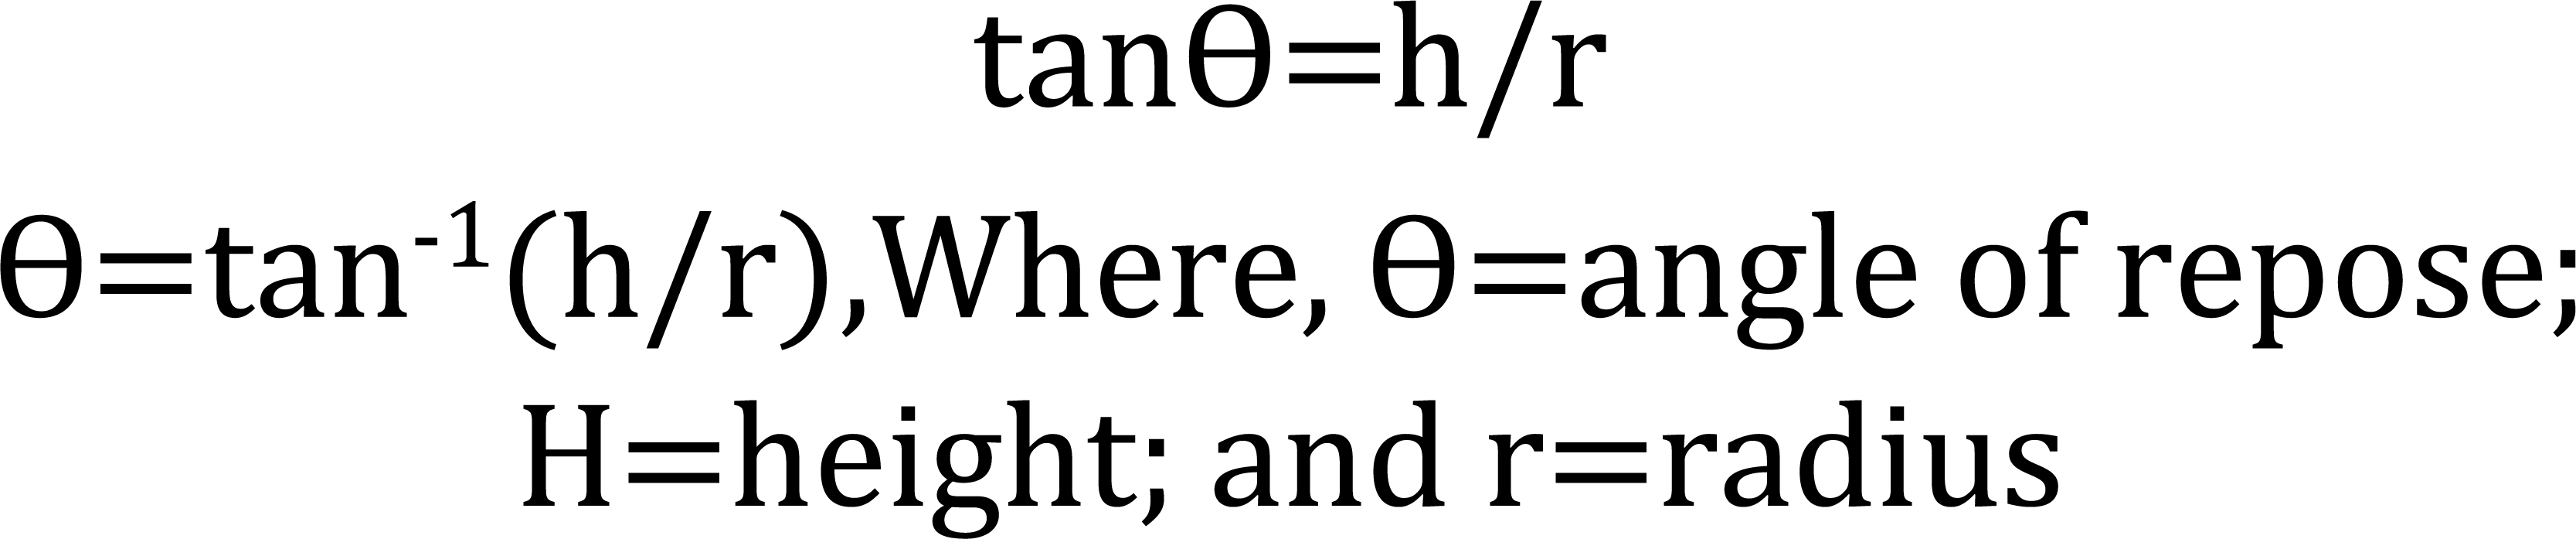
2.6.5 Angle of repose (Ɵ)
The angle of repose can be used to calculate the frictional forces in loose powder or granules. Angle of repose is a key indicator of the powder's flow behavior and a crucial characteristic for maintaining good content homogeneity in the formulations that are developed. A measured number of pellets was put via a funnel that was positioned on a stand at a particular height on graph paper. A conical mound was beginning to grow from a static pile of powder that was solely being affected by gravity. Measurements were made of the bottom cone part's radius (r) and the heap's height (h). The greatest angle that can exist between a pile of grains or powder and the horizontal plane is known as the angle of repose. It was computed using the subsequent formula.
|
2.6.6 Shape Analysis
The shape analysis was executed using both image analysis and optical microscopy. The image analysis was done using Olympus CH-201-Tr microscope with projection system while the optical microscopy was done using a projection microscope at a magnification of 10X. Diameters of 20 pellets that were selected randomly from each batch and were recorded to calculate different shape parameters like elongation, rectang and roundness according to the following formulae;
|
|
|
|
|



2.6.6.1 Size Analysis
The size analysis was executed by particle size determination. To evaluate the particle size, optical microscopy is used to examine the appearance and shape of each individual particle, either directly with the naked eye or using a microscopic image. This technique may also be utilized to determine the particle size distribution. The particle size distribution can also be determined by this method. Data processing techniques, such as image analysis, can be useful for determining the particle size distribution. Particles with a size of at least 1 μm can typically be characterized using this technique. The microscope's resolving power imposes the bottom bound. The increased difficulty in describing large particles determines the top limit, which is less certain. Optical microscopy is especially useful in characterizing non-spherical particles.
2.6.6.2 Surface Morphology
The external morphology (shape and surface texture) was analyzed by using scanning electron microscope (SEM). For scanning electron microscopy, samples were prepared by sprinkling microcapsule powder on a double adhesive tape, which is pounded on aluminum stub. The stubs were coated with gold/palladium layer (thickness of 150–200 Å) using a fine coat ion sputter. SEM photographs were got for various batches of pellets using a JSM 6100 scanning electron microscope. Samples were examined at 10KV at different magnification levels.
2.7 Drug Content of MFX.HCl
Accurately weighed 400mg of spheroids (equivalent to 250mg of drug) were powered. Powder of pellets was dissolved in 100mL of 0.1N HCl in a 100mL volumetric flask. Sample was sonicated for 10min and filtered. Dilutions of solutions were prepared and examined by UV-spectrophotometer at 295nm. The drug content of each sample was determined in triplicate.
2.7.1 In Vitro Dissolution Studies of MFX.HCl
Dissolution has become a popular, quick, and sensitive method for evaluating the effectiveness of formulations. The qualities of the raw materials, formulation factors, and storage have an impact on the rate of dissolution from instant release dosage forms. Therefore, it became clear that a surrogate for the in vivo bioavailability might be made using sensitive and repeatable dissolution data obtained from physiochemically and hydrodynamically controlled circumstances[32].
To calculate the in vitro dissolution rate for each formulation, the following method was performed in paddle type apparatus in 900mL of 0.1N HCl maintained at 37°C±0.5 °C and 75rpm. 5mL samples was withdrawn at various intervals and same amount of fresh media was replaced. Drug content was determined by UV visible spectrometer at 295nm.
2.8 Mathematical Model Development
Drug models and drug dissolution profiles are described by a variety of kinetics models and theories, where f is a function of t (time) and refers to the quantity of drug dissolved from the pharmaceutical dose system. Using a general equation that quantitatively translates the dissolving curve in function of some parameters related to the pharmaceutical dosage forms facilitates the quantitative interpretation of the values dissolved in the dissolution assay[33].
The kinetic models that describe drug dissolution from solid dosage forms state that the amount of drug (Q) that dissolves is a function of the test time, t, or that Q=f (t). The Q (t) function is defined analytically by a few widely used definitions, including zero order, first order, Hixson–Crowell, Higuchi, and Korsmeyer–Peppas models.
The drug's constant dissolution rate (k) was determined using the dissolution data that was acquired. The Microsoft Excel 2010 software was used to calculate the slope and regression coefficient of the following; % cumulative release versus time (t1/2) (Higuchi release kinetics), log cumulative % drug release versus log time (Korsmeyer–Peppas), CBR (Wo)-CBR (Wt) versus time (Hixson–Crowell), and % unreleased versus time (First order release kinetics).
3 RESULTS AND DISCUSSION
3.1 Characterization of Pure MFX.HCl
The primary goal of characterization of pure drug is to ascertain the identity, purity, and strength of the substance. Numerous analytical methods, having differential scanning spectroscopy (DSC), fourier transform-infrared (FT-IR), nuclear magnetic resonance (1H NMR) spectroscopy and, UV-visible spectroscopy was used to know the purity of MFX.HCl.
3.1.1 Visual Observation
The API of MFX.HCl is slightly yellow powder.
3.1.2 Melting Point
Melting point of MFX.HCl was observed by capillary method. Melting point of MFX.HCl was observed 241-43°C. The observed melting point agrees with the reported melting point of MFX.HCl (238-42°C)[34].
3.1.3 Differential Scanning Calorimetry
The DSC aluminum pan was filled with a little amount of MFX.HCl (2mg) and sealed. After that, it was heated between 30 to 300°C under a nitrogen flow at a scanning rate of 10°C per minute. As a reference, an empty aluminum pan was set in place. After then, the thermogram was noted. The endothermic peak, which represented MFX's melting point, was seen at 244.14°C (Figure 2). The experimental result of the DSC thermogram of pure MFX.HCl was almost matched the reported endothermic peak of 246.16°C for the compound[34].
|
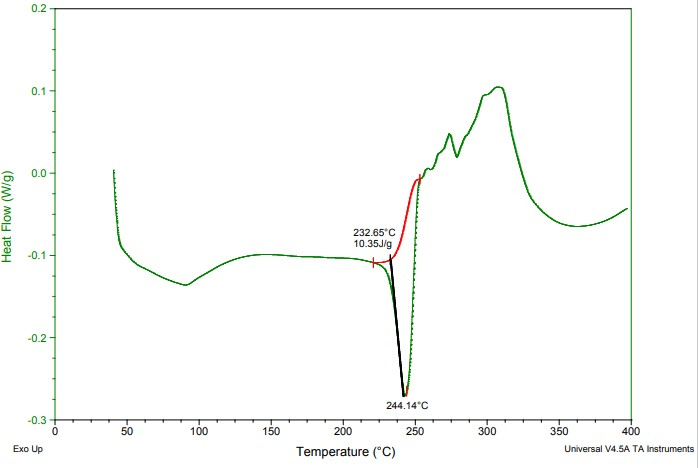
Figure 2. DSC Thermogram of Pure MFX.HCl.
3.1.4 Infrared Spectrophotometry
The FTIR spectra of the pure MFX.HCl were taken on IR Spectrophotometer using KBr pellet technique. The scanning range was 4000-400cm-1. The important functional group peaks were interpreted for the validation of the structure. The FTIR spectra of MFX.HCl was shown in the Figure 3. It is characterized by the absorption peaks at 3530cm-1 (N-H 2° amine stretch), 3472cm-1 (OH; COOH stretch), 2932cm-1 (C-H aliphatic stretch), 1710cm-1 (C=O; COOH stretch), 1519cm-1(C=O; cyclic), 1183cm-1 (C-O; ether stretch) (Figure 3), and these observed absorption peaks were nearly same as reported peaks of MFX.HCl[34,35].
|
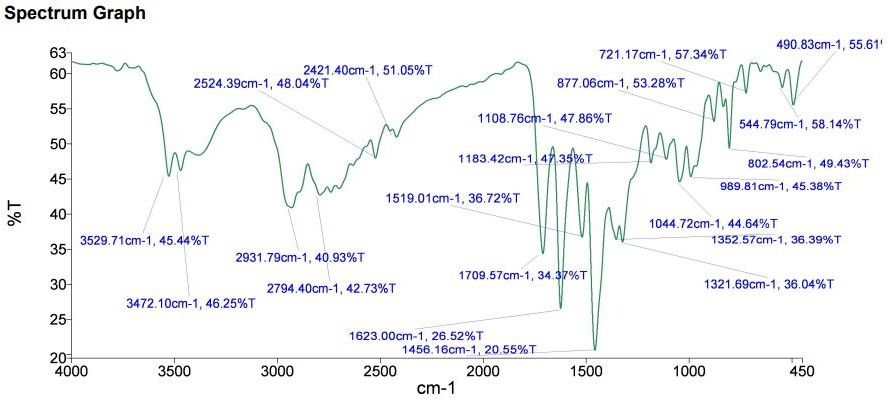
Figure 3. FTIR Spectrum of Pure MFX.HCl.
3.1.5 NMR Spectroscopy
The method that will be used to determine the hydrogen contents and their locations is 1H NMR. NMR Spectrophotometer was used for the experiment. A narrow glass vial containing a small amount (5-25mg) of MFX.HCl was dissolved in DMSO-d6 and placed in the instrument's sample holder. The 1H NMR of MFX.HCl exhibited characteristic values of chemical shift (δ) such as 1.21 δ (Cyclic–CH5), 1.83 δ, 1.71 δ (Cyclic (–CH13, – CH13a), 3.60 δ (CH3O4), 3.76 δ (N–CH15), 3.88 δ (N–CH9), 4.08 δ (N–CH28), 7.64 δ (Ar–CH1) (Figure 4); which was in concordance with the reported values in the literature[36].
|
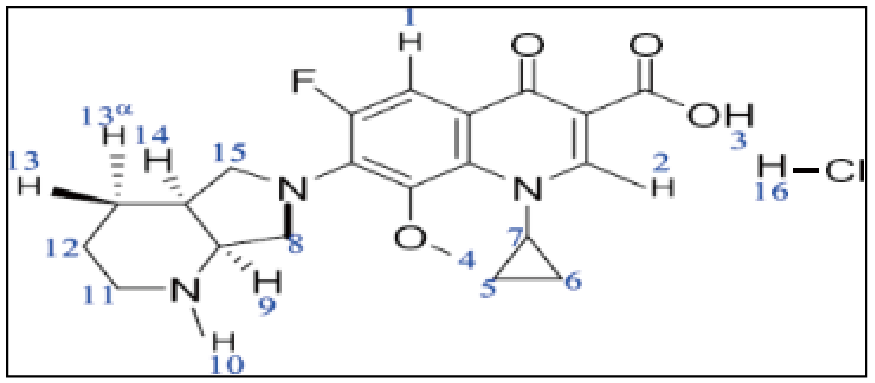
Figure 4. Structure of MFX.HCl.
3.2 Pre-formulation Studies
3.2.1 Analytical Method Development
3.2.1.1 Method Development and Validation by Ultra Violet-Visible Spectroscopy
Stock solution of MFX.HCl (1000µg/mL) was prepared in different solvents (distilled water and 0.1N HCl) and then, it was diluted to attain the concentration of (100µg/mL) stock solution. From 100µg/mL stock, graded dilutions were made to acquire standard solution of MFX.HCl ranging from 2-9µg/mL. Absorbances of different dilutions were obtained at respective λmax of drug in the suitable solvents and plotted against concentrations on x-axis. Absorbances of different dilutions were observed that was linear (Figure 5). Thus, this concentration ranges follows Beer-Lambert‘s law[37].
|
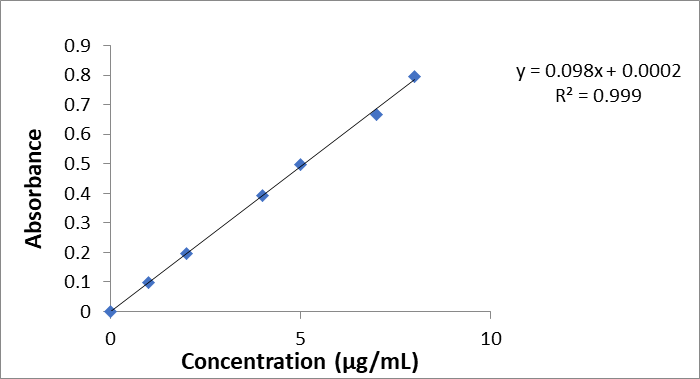
Figure 5. Calibration Curve for MFX.HCl in 0.1N HCl.
3.2.1.2 Calibration curve for MFX.HCl
The calibration curves for MFX.HCl in 0.1N HCl and distilled water were developed, respectively.
Accuracy was determined by spiking with known concentration of drug solution (2, 4, 6 μg/mL) with 4 μg/mL drug solution in equal ratio (1:1). %RSD values were observed in the range of 0.30 to 0.67%. The accuracy was quantified as percentage of MFX.HCl recovered by the assay as given in the Table 2.
Table 2. Accuracy Data of MFX.HCl from Standard Solution
Spiked Conc. (μg/mL) (1:1) |
Conc. (μg/mL) |
Mean Absorbance (μg/mL)±SD |
Mean Recovery |
% Recovery |
RSD |
2+4 |
3 |
0.292±0.020 |
2.99 |
99.76 |
0.672 |
4+4 |
4 |
0.390 ±0.015 |
3.98 |
99.58 |
0.386 |
6+4 |
5 |
0.493±0.015 |
5.02 |
100.47 |
0.306 |
3.2.1.3 Interday and Intraday Precision
The mean absorbance of three concentration (2, 6, 9µg/mL) with standard deviation and relative standard deviation were computed (Table 3). %RSD values were in the range of 0.19 to 0.43% for intraday precision whereas for interday precision, it was observed to be in the range of 0.07 to 0.30%.
Table 3. Intra-day and Inter-day Precision Data for MFX.HCl
Conc. (µg/mL) |
Intraday precision |
Interday precision |
||
Mean Absorbance±S.D |
%RSD |
Mean Absorbance ±S.D |
%RSD |
|
2 |
0.190±0.0008 |
0.43 |
0.191±0.0005 |
0.30 |
6 |
0.594±0.001 |
0.19 |
0.593±0.001 |
0.25 |
9 |
0.866±0.002 |
0.23 |
0.866±0.0006 |
0.07 |
3.2.1.4 Range
The linearity studies were used to determine the method's range, which offered a respectable level of precision and linearity. A range of 2 to 9µg/mL was discovered.
3.2.1.5 Repeatability
Six replicates of the mean absorbance at a single concentration of 6g/mL were generated, and the standard deviation and relative standard deviation were computed. The percentage RSD value was discovered to be 0.21%, falling within the allowed range of 2% (32). This validates the repeatability as indicated in Table 4.
Table 4. Repeatability Data for MFX.HCl
Concentration g/mL |
Mean±SD |
% RSD |
6 |
0.593±0.001 |
0.213 |
3.2.1.6 Method Validation of UV-Spectroscopy in distilled water
3.2.1.6.1 Linearity
Linearity determines the concentration range of drug which agrees to Beer-Lambert‘s Law. Standard solutions of MFX.HCl of different concentrations (2- 9μg/mL) were used for this purpose. Analysis was done in triplicate and absorbances of different concentrations were plotted against the concentrations to obtain the calibration curves. Calibration curve of absorbance versus concentration was found to be linear over range of 2-9μg/mL in distilled water (Figure 6).
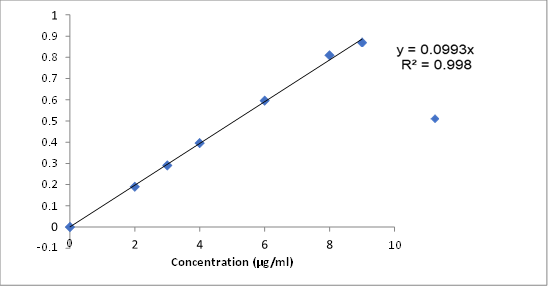
Figure 6. Calibration Curve for MFX.HCl in Distilled Water.
3.2.1.7 Overall Validation Parameters of MFX.HCl by UV Spectroscopy
The overall validation parameters of the drug are given in the Table 5.
Table 5. Validation Data for UV Spectroscopy
Validation Parameters |
Results Obtained |
Beer’s law range |
2-9μg/mL |
ƛ max |
295nm |
Slope |
0.099 |
Intercept |
0.005 |
Correlation coefficient (r2) |
0.998 |
Repeatability (%RSD) |
0.213% |
Precision (%RSD) |
Intra-day=0.19-0.43%. Inter-day=0.07-0.30%. |
Accuracy |
99.58-100.47 |
3.3 Drug-excipients Compatibility Studies of MFX.HCl
Using various analytical techniques, compatibility tests of MFX.HCl with specific excipients such as methyl cellulose, mannitol, starch, MgS, HPMC, Na CMC, and MCC were carried out. Studies on the drug's compatibility with a physical mixture of the drug and excipients (1:1) were carried out. The physical mixes were analyzed using DSC, FTIR, and 1H NMR tests to look for any signs of incompatibility.
3.3.1 Compatibility Study using Visual Observation
It was noted that none of the drug combinations showed any lump formation or color change based on the physical mixing of the drug with excipients. As a result, it demonstrated that the medicine and excipients employed in the experimental research were compatible.
3.3.2 Compatibility Study using FTIR Spectroscopy Analysis
A popular method for assessing potential incompatibilities between the drug and excipient is FTIR spectroscopy. Changes in the frequency and bandwidth of interacting groups during any physicochemical interactions are measured by FTIR spectroscopic examination of the pure drug and physical mixture of drug with excipient. The FTIR spectrum of pure MFX.HCl is shown in the Figure 3, which is characterized by the absorption peaks at 3530cm-1 (N-H 2° amine stretch), 3472cm-1 (OH, COOH stretch), 2932cm-1 (C-H aliphatic stretch), 1710cm -1 (C=O; COOH stretch), 1519cm-1 (C=O; cyclic), 1183cm-1 (C-O; ether stretch). Table 6 presents the findings of comparative FTIR spectrum research conducted to assess the compatibility of a drug's physical combination with excipients. In the FTIR spectra of the physical mixing of the drug with excipients such as MCC, HPMC, starch, MgS, NaCMC, mannitol, and methyl cellulose, all the significant drug peaks remained in the same position, showing that there was no interaction.
Table 6. Comparative Study for the FTIR Peaks of Pure MFX.HCl and Physical Mixture of Different Excipients
S.No |
Composition |
N-H 2° amine (cm-1) |
C-H Aliphatic (cm-1) |
C=O COOH (cm-1) |
C=O Cyclic (cm-1) |
C-O Ether (cm-1) |
OH COOH (cm-1) |
1. |
MFX.HCl |
3530 |
2932 |
1710 |
1519 |
1183 |
3472 |
2. |
MFX.HCl + MCC |
3528 |
2924 |
1709 |
1520 |
1165 |
3471 |
3. |
MFX.HCl + PMC |
3529 |
2931 |
1709 |
1520 |
1183 |
3472 |
4. |
MFX.HCl + Starch |
3528 |
2932 |
1709 |
1519 |
1163 |
3473 |
5. |
MFX.HCl + MgS |
3528 |
2921 |
1709 |
1534 |
1181 |
3472 |
6. |
MFX.HCl + NaCMC |
3527 |
2932 |
1708 |
1520 |
1171 |
3472 |
7. |
MFX.HCl + Mannitol |
3528 |
2932 |
1710 |
1518 |
1183 |
3472 |
8. |
MFX.HCl+methylcellulose |
3528 |
2931 |
1709 |
1519 |
1183 |
3473 |
The infrared spectra of the physical mixture of MFX.HCl and MCC showed the presence of the drug's distinctive peaks at the same places such as 3528cm-1 (N-H 2°amine stretch), 3471cm-1 (OH, COOH stretch), 2924cm-1 (C-H aliphatic stretch), 1709cm-1 (C=O; COOH stretch), 1520cm-1 (C=O; cyclic), and 1165 cm-1 (C-O; ether stretch) as shown in Figure 7A. Therefore, there was no significant shifting of characteristic peaks of drug in the physical mixture of MFX and MCC that specified that there was no significant interaction between the MFX and MCC.
|
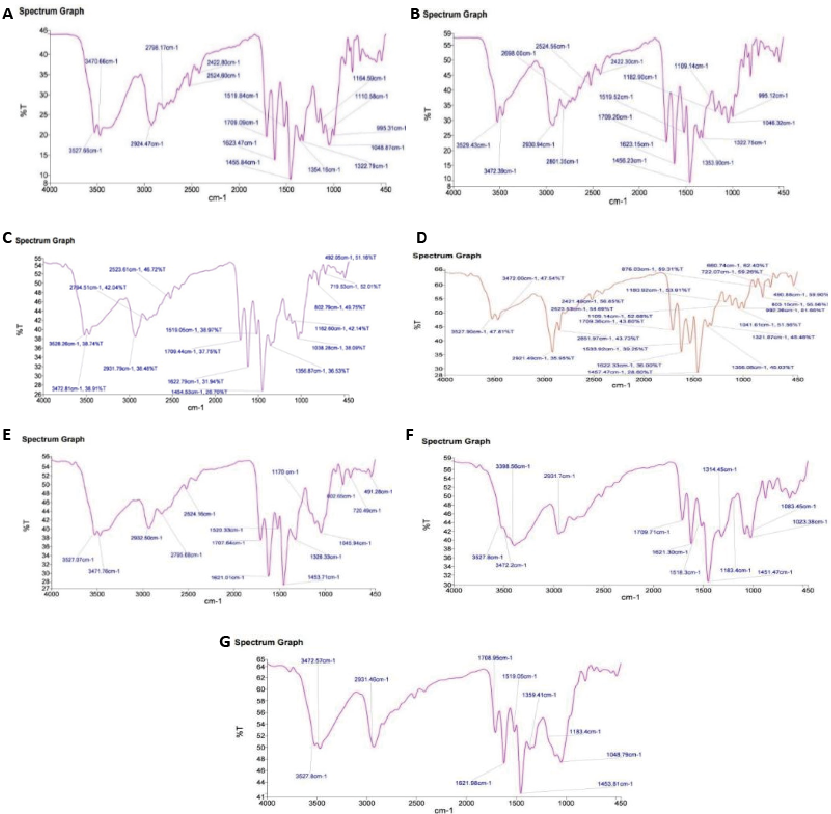
Figure 7. FTIR Spectrum of Physical Mixture of MFX.HCl with: (A) MCC; (B) HPMC; (C) Starch; (D) MgS; (E) NaCMC; (F) Mannitol; (G) Methylcellulose.
Further, the characteristic peaks of MFX.HCl were found to be present in the spectrum of physical mixture of MFX.HCl with HPMC at same positions such as 3529cm-1 (N-H 2°amine stretch), 3472cm-1 (OH, COOH stretch), 2931cm-1 (C-H aliphatic stretch), 1709cm-1 (C=O; COOH stretch), 1520cm-1 (C=O; cyclic), and 1183cm-1 (C-O; ether stretch) (Figure 7B). Additionally, there was no discernible shifting of the drug's distinctive peaks in the physical mixture, indicating that the MFX.HCl and HPMC did not significantly interact.
Subsequently, it was discovered that the physical combination spectrum of MFX.HCl and starch contained the drug's distinctive peaks at the same locations like 3528cm-1 (N-H 2°amine stretch), 3473cm-1 (OH, COOH stretch), 2932cm-1 (C-H aliphatic stretch), 1709cm-1 (C=O; COOH stretch), 1519cm-1 (C=O; cyclic), 1163cm-1 (C-O; ether stretch) as shown in the Figure 7C. In the physical mixing of MFX.HCl and starch, it was found that there was no discernible shifting of the MFX characteristic peaks, indicating the absence of any meaningful interaction between the two substances.
The characteristic peaks corresponding to MFX.HCl were found to be present in the physical mixture spectrum of MFX and MgS at same positions 3528cm-1 (N-H 2°amine stretch), 3472cm-1 (OH, COOH stretch), 2921cm-1 (C-H aliphatic stretch), 1709cm-1 (C=O; COOH stretch), 1534cm-1 (C=O; cyclic), and 1181cm-1 (C-O; ether stretch) as shown in the Figure 7D. Thus, the physical mixture of MFX.HCl and MgS did not exhibit any substantial shifting of distinctive peaks, indicating that there was no major interaction between the two substances.
The physical mixing of MFX.HCl with NaCMC showed the presence of the MFX.HCl characteristic peaks at the same places in the spectrum as 3527cm-1 (N-H 2°amine stretch), 3472cm-1 (OH, COOH stretch), 2932cm-1 (C-H aliphatic stretch), 1708cm-1 (C=O; COOH stretch), 1520cm-1 (C=O; cyclic), and 1171cm-1 (C-O; ether stretch) (Figure 7E). It was observed that there was no discernible interaction between the MFX.HCl and Na CMC in the physical mixing of MFX.HCl and Na CMC, nor was there any significant displacement of the MFX characteristic peaks.
The spectra of the physical mixture of MFX.HCl with mannitol was found to include the distinctive moxifloxacin peaks at the places 3528cm-1 (N-H 2°amine stretch), 3472cm-1 (OH, COOH stretch), 2932cm-1 (C-H aliphatic stretch), 1710cm-1 (C=O; COOH stretch), 1518cm-1 (C=O; cyclic), and 1183cm-1 (C-O; ether stretch) as shown in Figure 7F. This showed that there was no significant shifting of characteristic peaks of MFX.HCl in the physical mixture of MFX and mannitol which indicated no significant interaction between the MFX.HCl and mannitol. The characteristic peaks corresponding to MFX.HCl were found to be present in the spectrum of physical mixture of MFX.HCl and methyl cellulose at same positions 3528cm-1 (N-H 2°amine stretch), 3473cm-1 (OH, COOH stretch), 2931cm-1 (C-H aliphatic stretch), 1709cm-1 (C=O; COOH stretch), 1519cm-1 (C=O; cyclic), and 1183cm-1 (C-O; ether stretch) (Figure 7G). Moreover, there was no significant shifting of characteristic peaks of MFX.HCl in the physical mixture of MFX.HCl and methyl cellulose which indicated no significant interaction between the MFX.HCl and methyl cellulose.
3.3.3 Compatibility Study using DSC
The DSC thermogram of the physical mixture of MFX.HCl and MCC is shown in Figure 8A. Sharp endothermic peaks were visible on the DSC thermogram of pure MFX.HCl at 244.14°C. The endothermic peak associated with MFX.HCl was detected at 253.10°C in the thermogram of the physical mixture of MFX.HCl and MCC. Consequently, it was observed that the endothermic peak of MFX.HCl was in almost the same location in the physical mixture of MFX.HCl and MCC. Consequently, it was concluded that MFX.HCl and MCC did not interact chemically, indicating that MCC and MFX.HCl were compatible in nature.
|
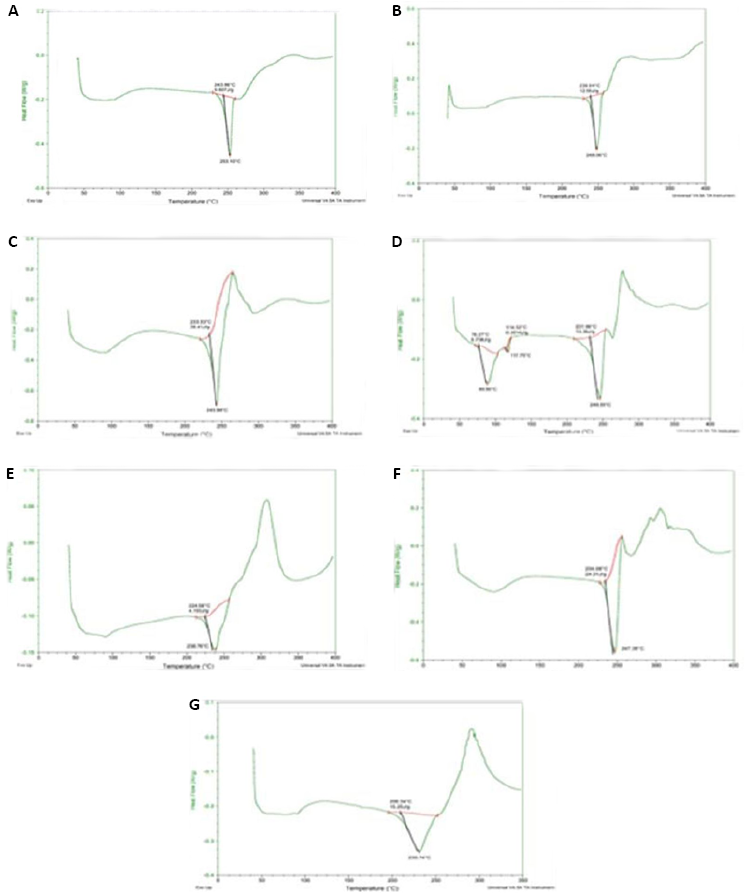
Figure 8. DSC Thermogram of Physical Mixture of MFX.HCl with (A) MCC; (B) HPMC; (C) Starch; (D) MgS; (E) NaCMC; (F) Mannitol; (G) Methyl Cellulose.
The physical combination of MFX.HCl with HPMC is shown on the DSC thermogram in Figure 8B. Sharp endothermic peaks could be seen on the DSC thermogram of pure MFX.HCl at 244.14°C. At 248.06°C, the endothermic peak associated with MFX.HCl was seen in the thermograph of physical mixture. It was discovered that the endothermic peak of MFX.HCl and the physical mixing of HPMC were comparable to the compound in its pure state. This finding indicated that moxifloxacin and HPMC were compatible because there is no chemical interaction between MFX.HCl and HPMC.
Figure 8C depicts the DSC thermogram of physical mixture of MFX.HCl with starch. The DSC thermogram of pure MFX.HCl reflected with sharp endothermic peaks at 244.14°C. In the thermogram of physical mixture, the endothermic peak corresponding to MFX.HCl was observed at 243.38°C. It was detected that the endothermic peak of MFX.HCl and physical mixture of starch was found to be close as that of pure compound. Thus, it was concluded that there was no chemical interaction between MFX.HCl and starch occurs which displayed that MFX.HCl was compatible with starch.
Figure 8D shows the DSC thermogram of physical mixture of MFX.HCl with MgS. The DSC thermogram of pure MFX.HCl displayed with sharp endothermic peaks at 244.14°C. In the thermogram of physical mixture, the endothermic peak corresponding to MFX.HCl was observed at 246.35°C. It was observed that the endothermic peak of MFX.HCl and physical mixture of MgS was found to be in same position as that of pure compound. Therefore, it was concluded that there was no chemical interaction between MFX and MgS. So, both MFX.HCl and MgS were compatible in nature.
The DSC thermogram of a physical mixture of MFX.HCl and sodium carboxymethylcellulose is shown in Figure 8E. Sharp endothermic peaks were visible on the DSC thermogram of pure MFX.HCl at 244.14°C. The endothermic peak associated with MFX.HCl was detected in the thermogram of physical mixture at 238.76°C. The endothermic peak of MFX.HCl in the drug's physical mixing with NaCMC was found to be lowered as the compound's pure peak. Thin layer chromatography (TLC) was used to see if there was any interaction present in the physical mixture of drug with NaCMC. The Rf value of MFX.HCl and its physical mixture with NaCMC was observed to be 0.45. The spot of MFX.HCl and physical mixture of MFX.HCl with NaCMC was visible at the same position. From this, it was resolved that no interaction was observed between the MFX.HCl and NaCMC.
The DSC thermogram of the physical mixture of MFX.HCl and mannitol is shown in Figure 8F Pure MFX.HCl's DSC thermogram revealed endothermic peaks at 244.14°C. The endothermic peak associated with MFX.HCl was seen in the physical mixture thermogram at 247.38°C. It was resolved that the endothermic peak of MFX.HCl in the physical mixture of drug with mannitol was retained at the same spot as that of the pure compound. As a result, it was determined that there is no chemical interaction between MFX.HCl and mannitol, indicating that MFX.HCl and mannitol are compatible.
Figure 8G displayed the DSC thermogram of physical mixture of MFX.HCl with methyl cellulose. The DSC thermogram of pure MFX.HCl reflected with sharp endothermic peaks at 244.14°C. In the thermogram of physical mixture, the endothermic peak corresponding to MFX.HCl was observed at 230.74°C. It was determined that the endothermic peak of MFX.HCl and physical mixture of methylcellulose was little deviated as that of pure compound. This interaction was ruled out by TLC. Thus, there was no incompatibility between MFX.HCl and methyl cellulose and both were compatible.
3.3.4 TLC of physical mixture of MFX.HCl with methyl cellulose
The Rf value is used to quantify the movement of the materials along the plate. Rf is equal to the distance travelled by the substance divided by the distance travelled by the solvent. Its value is always between zero and one. The Rf value of MFX.HCl and its physical mixture with methyl cellulose was found to be 0.45. The spot of MFX.HCl and physical mixture of MFX.HCl with methyl cellulose was visible at the same position. From this, it was resolved that no interaction was observed between the MFX.HCl and methyl cellulose.
3.3.5 Compatibility study using 1H NMR spectroscopy
The 1H NMR spectra for MFX.HCl and physical mixtures were compared and main signals of MFX.HCl such as 1.21 δ (Cyclic–CH5), 1.83 δ, 1.71 δ (Cyclic (–CH13, –CH13a)), 3.60 δ (CH3O4), 3.76 δ (N–CH15), 3.88 δ (N–CH4), 4.08 δ (N–CH28), 7.64 δ (Ar–CH1) (Figure 4) were present in all the physical mixtures. All the chemical shifts corresponding to the drug was found to be present in all the physical mixtures. Moreover, there was no significant shifting of chemical shift which indicated that no significant interaction between the drug and excipient occurred. Thus, it was concluded that MFX.HCl is compatible with all used excipients. The comparative analysis of chemical shift of the MFX.HCl in the physical mixture of drug with excipient is shown in the Table 7. The most important signals for MFX.HCl were 1.21 δ (Cyclic– CH5), 1.83 δ, 1.71 δ Cyclic (–CH13, –CH13a), 3.60 δ (CH3O4), 3.76 δ (N–CH15), 3.88 δ (N–CH9), 4.08 δ (N–CH28), and 7.64 δ (Ar–CH1). 1H NMR spectra of physical mixture of MFX.HCl with MgS showed the characteristic signals at 1.20 δ (Cyclic–CH5), 1.79 δ, 1.73 δ (Cyclic (–CH13, –CH13a)), 3.59 δ (CH3O4), 3.76 δ (N–CH15), 3.88 δ (N–CH9), 4.07 δ (N–CH28), and 7.65 δ (Ar–CH1). The characteristic signals of pure MFX.HCl were retained in the 1HNMR spectra of the physical mixture of MFX.HCl with MgS and this disclosed that there was no interaction between drug and excipient. The key indications for the MFX.HCl were 1.21 δ (Cyclic– CH5), 1.83 δ, 1.71 δ (Cyclic (–CH13, –CH13a)), 3.60 δ (CH3O4), 3.76 δ (N–CH15), 3.88 δ (N–CH9), 4.08 δ (N–CH28), and 7.64 δ (Ar–CH1). 1H NMR spectra of physical mixture of MFX.HCl with starch exposed the characteristic signals at 1.21 δ (Cyclic–CH5), 1.83 δ, 1.71 δ (Cyclic (–CH13, –CH13a)), 3.59 δ (CH3O4), 3.73 δ (N–CH15), 3.88 δ (N–CH9), 4.08 δ (N–CH 8), and 7.65 δ (Ar–CH1). The characteristic signals of pure MFX.HCl were retained in the 1HNMR spectra of the physical mixture of MFX.HCl with starch and this showed that there was no interaction between drug and excipient. Further, for MFX.HCl, the most significant signals were 1.21 δ (Cyclic– CH5), 1.83 δ, 1.71 δ (Cyclic (–CH13, –CH13a)), 3.60 δ (CH3O4), 3.76 δ (N–CH15), 3.88 δ (N–CH9), 4.08 δ (N–CH28), and 7.64 δ (Ar–CH1). 1H NMR spectra of physical mixture of MFX.HCl with MCC exhibited the characteristic signals at 1.21 δ (Cyclic–CH5), 1.83 δ, 1.71 δ (Cyclic (–CH13, –CH13a)), 3.59 δ (CH3O4), 3.76 δ (N–CH15), 3.88 δ (N–CH9), 4.08 δ (N–CH 8), and 7.69 δ (Ar–CH1). The characteristic signals of pure MFX.HCl were retained in the 1HNMR spectra of the physical mixture of MFX.HCl with MCC and this displayed that there was no interaction between drug and excipient. Regarding MFX.HCl, the most noteworthy indications were 1.21 δ (Cyclic–CH5), 1.83 δ, 1.71 δ (Cyclic (–CH13, –CH13a)), 3.60 δ (CH3O4), 3.76 δ (N–CH15), 3.88 δ (N–CH4), 4.08 δ (N–CH28), and 7.64 δ (Ar–CH1). 1H NMR spectra of physical mixture of MFX.HCl with mannitol disclosed the characteristic signals at 1.21 δ (Cyclic–CH5), 1.81 δ, 1.71 δ (Cyclic (–CH13, –CH13a)), 3.60 δ (CH3O4), 3.76 δ (N–CH15), 3.88 δ (N–CH4), 4.08 δ (N–CH28), and 7.67 δ (Ar–CH1). The 1HNMR spectra of the physical mixture of MFX.HCl with mannitol preserved the distinctive signals of pure MFX.HCl, indicating the absence of any drug-excipient interaction. The MFX.HCl signals that mattered most were 1.21 δ (Cyclic–CH5), 1.83 δ, 1.71 δ (Cyclic (–CH13, –CH13a)), 3.60 δ (CH3O4), 3.76 δ (N–CH15), 3.88 δ (N–CH9), 4.08 δ (N–CH8), and 7.64 δ (Ar–CH1). 1H NMR spectra of physical mixture of MFX.HCl with NaCMC exhibited the characteristic signals at 1.21 δ (Cyclic–CH5), 1.81 δ, 1.71 δ (Cyclic (–CH13, –CH13a)), 3.60 δ (CH3O4), 3.76 δ (N–CH15), 3.88 δ (N–CH9), 4.08 δ (N–CH 8), and 7.66 δ (Ar–CH1). The 1HNMR spectra of the physical mixture of MFX.HCl with NaCMC preserved the distinctive signals of pure MFX.HCl, indicating the absence of any drug-excipient interaction. The MFX.HCl signals that mattered the most were 1.21 δ (Cyclic– CH5), 1.83 δ, 1.71 δ (Cyclic (–CH13, –CH13a)), 3.60 δ (CH3O4), 3.76 δ (N–CH15), 3.88 δ (N–CH9), 4.08 δ (N–CH28), 7.64 δ and (Ar–CH1). 1H NMR spectra of physical mixture of MFX.HCl with methyl cellulose disclosed the characteristic signals at 1.21 δ (Cyclic–CH5), 1.81 δ, 1.69 δ (Cyclic (–CH13, –CH13a)), 3.59 δ (CH3O4), 3.76 δ (N–CH15), 3.88 δ (N–CH9), 4.07 δ (N–CH28), and 7.69 δ (Ar–CH1). There was no interaction between the medication and the excipient, as evidenced by the retention of the distinctive signals of pure MFX.HCl in the 1HNMR spectra of the MFX.HCl physical mixture with methyl cellulose.
Table 7. Chemical Shift (1H NMR) of MFX.HCl Protons in Physical Mixtures Sample
Composition |
Chemical Shifts (ppm) |
||||||
(Cyclic- CH5) |
(-CH13, - CH13a) |
(O- CH34) |
(N- CH9) |
(N- CH15) |
(N- CH28) |
(Ar- CH1) |
|
MFX.HCl |
1.21 |
1.83, 1.71 |
3.60 |
3.88 |
3.76 |
4.08 |
7.64 |
MFX.HCl+MgS |
1.20 |
1.79, 1.73 |
3.59 |
3.88 |
3.73 |
4.07 |
7.65 |
MFX.HCl+Starch |
1.21 |
1.83, 1.71 |
3.59 |
3.88 |
3.73 |
4.08 |
7.65 |
MFX.HCl+MCC |
1.21 |
1.83, 1.71 |
3.59 |
3.88 |
3.76 |
4.08 |
7.69 |
MFX.HCl+ Mannitol |
1.21 |
1.81, 1.71 |
3.60 |
3.88 |
3.76 |
4.08 |
7.67 |
MFX.HCl+NaCMC |
1.21 |
1.81, 1.70 |
3.60 |
3.88 |
3.76 |
4.08 |
7.66 |
MFX.HCl+Methylcellulose |
1.21 |
1.82, 1.69 |
3.59 |
3.88 |
3.76 |
4.07 |
7.69 |
MFX.HCl+HPMC |
1.20 |
1.87, 1.68 |
3.59 |
3.90 |
3.69 |
4.09 |
7.67 |
3.3.6 Characterization of Spheroids
Various parameters of the formulation studies were described below.
3.3.6.1 Angle of Repose
Angle of repose is indication of flow behavior of the spheroids. Table 8 shows the results obtained for angle of repose of all the formulations i.e. from batches B1 to B5. The values were found to be in the range of 25.69o to 36.82o. Batch B1 showed angle of repose (36.82o), that indicated fair flow property due to non-spherical nature of formulated pellets for batch B1. Batches (B2, and B3) showed good flow properties and batches (B4, and B5) showed excellent flow properties of spheroids.
Table 8. Characterization of MFX.HCl Multiparticulates
Batches Code |
Angle of Repose (Ɵ) |
Bulk Density (g/cm2) |
Tapped Density (g/cm2) |
Carr’s Index (% compressibility) |
Hauser’s Ratio |
B1 |
36.82o |
0.49 |
0.61 |
19.67 |
1.24 |
B2 |
31.20o |
0.5 |
0.56 |
11.3 |
1.12 |
B3 |
31.79o |
0.47 |
0.53 |
10.94 |
1.12 |
B4 |
30.56o |
0.5 |
0.56 |
10.71 |
1.07 |
B5 |
29.29 o |
0.51 |
0.55 |
6.54 |
1.07 |
3.3.6.2 Bulk Density
High bulk density of the formulated spheroids indicated that the spheroids were more spherical and had fewer void spaces or porosity. Bulk density of all formulated batches i.e. from batches B1 to B5 was obtained within the range of 0.49 to 0.51g/cm2 (Table 8).
3.3.6.3 Tapped density
Tapped density of formulated batches B1 to B5 lied within the range of 0.53 to 0.61g/cm2 (Table 8).
3.3.6.4 Compressibility Index (Carr’s index)
Percent compressibility of powder mixture was determined by Carr's compressibility index. The percent compressibility for all the formulations was within the range of 6.54 to 19.67%. Batch B1 showed fair flow property and Batches (B1, and B2) showed good flow property while batches (B4, B5) showed excellent flow property due to more sphericity of spheroids (Table 8).
3.3.6.5 Hausner’s Ratio
The Hausner‘s ratio of all formulation was within the range of 1.07 to 1.24. Batches (B4, and B5) showed excellent flow property due to less porosity and more sphericity of spheroids (Table 8).
3.3.6.6 Particle Shape Analysis
The shape analysis of multiparticulates was done by optical microscopy and scanning electron microscopy image analysis. Optical microscopy was executed with projection microscope. Various shape factors viz. elongation, rectang and roundness were calculated. The results of the various shape factors are listed in the Table 9. Roundness measures the sphericity, elongation measures the oblongation and rectang measures the rectangular shape of spheroids, respectively. The roundness factor for a circle is 1, so as the parameter approaches the value of unity, more circular are the spheroids. For all the batches of the prepared spheroids batches, roundness factor ranged from 0.581 to 0.906, which suggested that all the formed pellets were circular in shape. The elongation factor ranged from 1.128 to 1.168 and the rectang for all the batches were between 0.756 to 0.833 as shown in the Table 9.
Table 9. Shape factor of various batches of MFX.HCl spheroids
Batch no. |
Elongation (mean±S.D) |
Rectang (mean±S.D) |
Roundness (mean±S.D) |
B1 |
1.168±0.065 |
0.756±0.122 |
0.581±0.068 |
B2 |
1.159±0.052 |
0.777±0.068 |
0.764±0.059 |
B3 |
1.155±0.071 |
0.806±0.048 |
0.875±0.056 |
B4 |
1.146±0.069 |
0.796±0.051 |
0.869±0.068 |
B5 |
1.128±0.027 |
0.833±0.048 |
0.906±0.033 |
3.3.6.7 Particle Size Analysis
The drug's particle size is a significant factor in assuring content uniformity and its release rate in dissolution studies. This is especially important for formulations with low ratio of drug to excipients. Wider particle size distribution of drug can lead to problems in blend uniformity, even after ideal mixing. The oral absorption of a compound is affected by its particle size as smaller particles with large surface area and give higher peak plasma concentration and bioavailability. The particle size analysis of spheroids was executed using optical microscopy. The arithmetic mean diameter (dln) of MFX.HCl spheroids of batches B1, B2, B3, B4 and B5 were found to be 616.33µm, 417.33µm, 869.66µm, 681µm, 757.33µm, respectively.
3.3.6.8 Surface Morphology
Scanning electron microscopy (SEM) of batch B5 of multiparticulates showednearly smooth surface. The prepared spheroids were studied under 3 magnifications of 50X, 75X, 130X to observe the formulation of multiparticulates. The pallets were spherical with rough surface and entities (Figure 9).
|
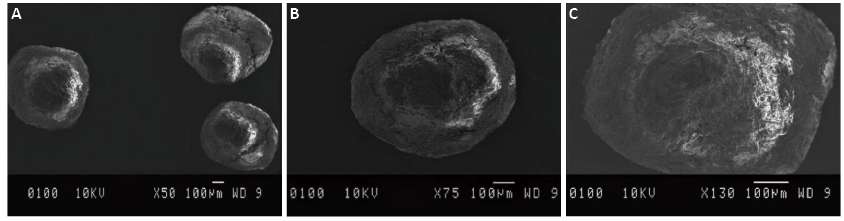
Figure 9. SEM Images of MFX.HCl At Different Magnification Levels (A) 50 (B) 75 and (C) 130.
3.3.6.9 Drug Content
The analysis of drug content of all batches (B1 to B5) of pellets was done. The assay’s result was in the range of 98.7±0.56 - 100.5±0.71.
3.3.7 In vitro Dissolution Studies
An essential feature of oral solid dosage forms is their ability to dissolve well, as both medication absorption and physiological activity rely on the drug's state of dissolution. The goal of the dissolving test is to give a starting point for assessing the drug substance's physiological availability. The multiparticulates' in vitro release profile was ascertained in triplicate utilizing a USP type II dissolution apparatusthat held 900mL of 0.1 N HCI at 37±0.5°C for one hour. At different intervals (5, 10, 15, 20, 30, 45, and 60 minutes), the samples were taken out and replaced with fresh disso media. Batch B1 was excluded from dissolution studies because chipping defects on the pellet surface. The use of xanthan gum in batch B2's formulation caused a delay in the drug's release. According to the dissolution research results, batches B3 through B5 released 66.83%, 73.49%, and 95.32% of their contents after 30 minutes, respectively (Figure 10 and Table 10)). Batch B3 exhibited slow release because it included higher amount of HPMC than batches B4 and B5. B5 had maximal release since there was lesser HPMC content there. However, all the batches released above 80% of the drug after 45min. However, in batches, B2 released only 64.24% drug at 45min and above 75% at 60min. (Figure 10 and Table 10)). Batch B5 showed the fast drug release as 75% above drug was released in only 10min.
|
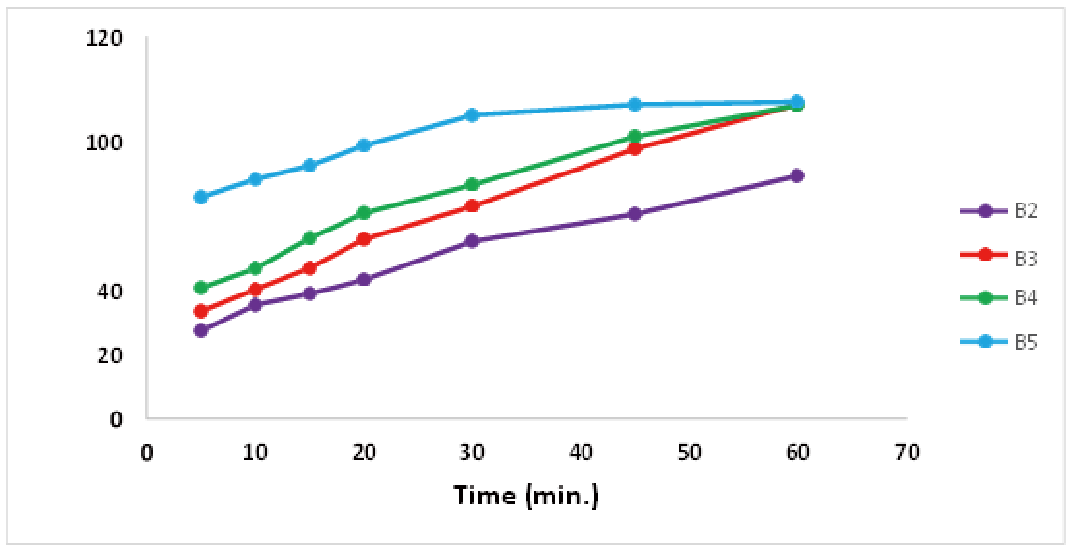
Figure 10. Cumulative Percentage Release for Batches (B2, B3, B4 and B5).
Table 10. In-vitro % Drug Release of Batches (B2 to B5)
Time |
% Drug Release±S.D. |
|||
B2 |
B3 |
B4 |
B5 |
|
5 |
27.68±0.9 |
33.80±0.2 |
41.14±1.2 |
69.64±1.5 |
10 |
35.78±0.4 |
40.59±1.3 |
47.24±0.5 |
75.16±0.8 |
15 |
39.28±1.5 |
47.30±1.5 |
56.67±0.7 |
79.49±0.8 |
20 |
43.66±1.6 |
56.67±1.7 |
64.57±1.1 |
85.80±1.1 |
30 |
55.77±0.3 |
66.83±0.6 |
73.49±0.7 |
95.32±0.3 |
45 |
64.27±0.5 |
84.81±0.9 |
88.69±1.2 |
98.66±0.6 |
60 |
76.34±0.5 |
98.73±1.1 |
98.47±0.7 |
99.56±0.6 |
3.3.8 Determination of Release Kinetics
The data were analyzed using Higuchi's square root of time equation, Korsmeyer-Peppas and Hixon-Crowells cube root of time equations, zero order release kinetics, and first order release kinetics to investigate the mode of drug release from various developed spheroids and to understand the mechanism of drug release from all prepared batches. The results are represented in Table 11. The kinetic treatment reflected that all the batches B2 (R2=0.993), B3 (R2=0.993), B4 (R2=0.995) and B5 (R2=0.990) were fitted well with Hixon-Crowell, zero order, Higuchi model, and First order kinetics model respectively, as given in Table 11.
Table 11. Kinetic Modelling of Batches (B2-B5)
Batch No |
Zero order (R2) |
First order (R2) |
Korsmeye Peppas Mod-el (R2) |
Higuchi model (R2) |
Hixon-c- rowell (R2) |
Best fit model |
B2 |
0.985 |
0.989 |
0.937 |
0.990 |
0.993 |
Hixon- Crowell |
B3 |
0.993 |
0.860 |
0.983 |
0.990 |
0.953 |
Zero order |
B4 |
0.975 |
0.911 |
0.986 |
0.995 |
0.979 |
Higuchi model |
B5 |
0.861 |
0.990 |
0.966 |
0.939 |
0.971 |
First order |
Batch B2 fitted well in Hixon-crowell model of release kinetics, the drug was released by the process of dissolution with the change in surface area and diameter of the particles (Figure 11A). The release kinetic profile of Batch B3 followed zero order release as the dissolution was through the developed matrix of HPMC with the MFX.HCl (Figure 11B). While, the drug release from the formed matrices between water-soluble drug MFX.HCl and HPMC was by diffusion which is based on Fick‘s law in case of batch B4 due to which Higuchi model was the best fit model for batch B4 (Figure 11C). Batch B5 followed first order kinetic model as formulated pellets contains MFX.HCl a water-soluble drug in a porous matrix of HPMC due to which the release of the drug was proportional to the amount of drug released by unit time diminished (Figure 11D).
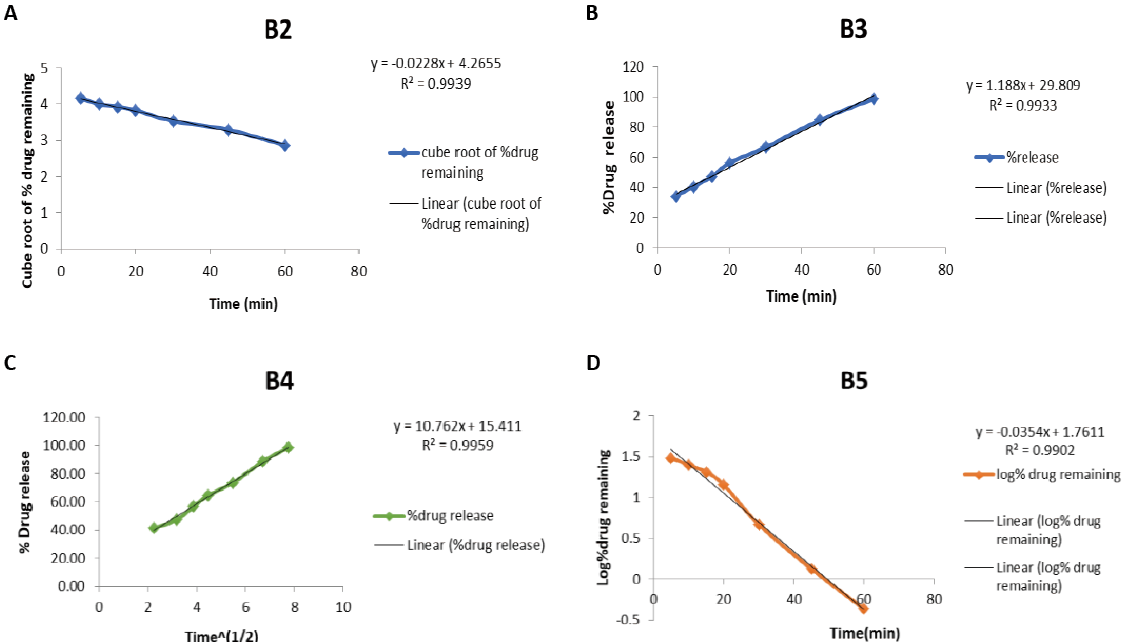
Figure 11. Kinetic Modelling of Batches (B2-B5). (A) Hixon-Crowell Kinetic Model of B2; (B) Zero Order Kinetic Model of B3; (C) Higuchi Kinetic Model of B4; (D) First Order Kinetic Model of B5.
Drug excipient compatibility study was done to know the interaction of drug with excipients. Melting point, DSC, FT-IR, NMR, and UV were used as characterization criteria to characterize MFX.HCl. Preformulation investigations included UV validation, solubility testing, and drug excipient compatibility testing for drug. When IR and NMR were used to examine the compatibility of physical mixes of the MFX.HCl with excipients, it was found that the distinctive peaks in NMR and IR spectroscopy signals did not deviate. Additionally, all physical combinations of medications and excipients were subjected to DSC analysis and comparison. All above study indicated that MFX.HCl was compatible with each other. Five batches of MFX.HCl was formulated with the use of MCC PH 101 as diluent and HPMC as binder in the formulation. Results of the pellets characterization study of MFX.HCl suggest the good and excellent flow properties of pellets for batches B2, B3 and B5, while batch B1 was having fair flow nature. The arithmetic mean diameter of Batches B1 to B5 of MFX.HCl was found to be 616.33 µm, 417.33µm, 869.66µm, 681µm and 757.33 µm. Apart from B1 batch of drug, all batches’ pellets were spherical. The reason behind non spherical shape of B1 pellets was presence of MCC PH200, which was not a suitable excipient for making spheroids. The drug content for MFX.HCl for batches B1-B5 was in the range 98.7- 100.2%; The in vitro drug release of MFX.HCl batches B2, B3, B4 and B5 showed 55.77%, 66.83%, 73.49% and 95.32% drug released within the first 30 minutes. In which B5 showed maximum release due to less amount of HPMC in comparison to other batches. Release kinetic study of developed pellets for the drug was also done for batches i.e. B2 to B5 in MFX.HCl. In which batch B2 of MFX.HCl showed its release via hixon crowell model, batch B3 via zero order kinetics, batch B4 via higuchi model and batch B5 via first order kinetic model.
Acknowledgements
Yadav AK is thankful to UGC, India for financial support from UGC faculty recharge programme. The DST-FIST Lab, University Institute of Pharmaceutical Sciences, Panjab University, Chandigarh, was appreciated by the authors for allowing them to use its space.
Conflicts of Interest
The authors declared no conflict of interest.
Data Availability
All data generated or analyzed during this study are included in this published article.
Copyright Permissions
Copyright © 2025 The Author(s). Published by Innovation Forever Publishing Group Limited. This open-access article is licensed under a Creative Commons Attribution 4.0 International License (https://creativecommons.org/licenses/by/4.0), which permits unrestricted use, sharing, adaptation, distribution, and reproduction in any medium, provided the original work is properly cited.
Author Contribution
Sharma R developed the methodology and was responsible for its execution. Sinha VR handled the planning and performed the final correction. Yadav AK prepared the draft and supervised the research.
Abbreviation List
API, Active pharmaceutical ingredient
CAP, Community-acquired pneumonia
DSC, Differential scanning calorimetry
FTIR, Fourier transform infrared spectroscopy
HPMC, Hydroxypropyl methylcellulose
MCC, Microcrystalline cellulose
MFX.HCl, Moxifloxacin hydrochloride
MgS, Magnesium stearate
NaCMC, Sodium carboxymethyl cellulose
NMR, Nuclear magnetic resonance
TLC, Thin layer chromatography
References
[1] Wiemken TL, Peyrani P, Ramirez JA. Global changes in the epidemiology of community-acquired pneumonia. Semin Resp Crit Care Med, 2012; 33: 213-219.[DOI]
[2] Polverino E, Torres MA. Community-acquired pneumonia. Minerva Anestesiol, 2011; 77: 196-211.
[3] Almirall J, Bolibar I, Vidal J et al. Epidemiology of community-acquired pneumonia in adults: a population-based study. Eur Respir J, 2000; 15: 757-763.[DOI]
[4] El Moussaoui R, Opmeer BC, de Borgie CAJM et al. Long-term symptom recovery and health-related quality of life in patients with mild-to-moderate-severe community-acquired pneumonia. Chest, 2006; 130: 1165-1172.[DOI]
[5] Lim WS, Baudouin SV, George RC et al. BTS guidelines for the management of community acquired pneumonia in adults: update 2009. Thorax, 2009; 64: iii1-iii55.[DOI]
[6] Lim WS, Woodhead M. British Thoracic Society adult community acquired pneumonia audit 2009/10. Thorax, 2011; 66: 548-549.[DOI]
[7] Lode HM. Managing community-acquired pneumonia: a European perspective. Resp Med, 2007; 101: 1864-1873.[DOI]
[8] Watkins RR, Lemonovich TL. Diagnosis and management of community-acquired pneumonia in adults. Am Fam Physician, 2011; 83: 1299-1306.
[9] Welte T, Torres A, Nathwani D. Clinical and economic burden of community-acquired pneumonia among adults in Europe. Thorax, 2012; 67: 71-79.[DOI]
[10] Nair GB, Niederman MS. Community-acquired pneumonia: an unfinished battle. Med Clin, 2011; 95: 1143-1161.[DOI]
[11] Jackson ML, Neuzil KM, Thompson WW et al. The burden of community-acquired pneumonia in seniors: results of a population-based study. Clin Infect Dis, 2004; 39: 1642-1650.[DOI]
[12] Blondeau JM, Vaughan D, Laskowski R et al. Susceptibility of Canadian isolates of Haemophilus influenzae, Moraxella catarrhalis and Streptococcus pneumoniae to oral antimicrobial agents. Int J Antimicrob Ag, 2001; 17: 457-464.[DOI]
[13] Burkhardt O, Welte T. 10 years’ experience with the pneumococcal quinolone moxifloxacin. Expert Rev Anti-Infe Ther, 2009; 7: 645-668.[DOI]
[14] Miravitlles M. Moxifloxacin in respiratory tract infections. Expert Opin Pharmaco, 2005; 6: 283-293.[DOI]
[15] Miravitlles M, Anzueto A. Moxifloxacin: a respiratory fluoroquinolone. Expert Opin Pharmaco, 2008; 9: 1755-1772.[DOI]
[16] Patel P, Ahir K, Patel V et al. Drug-Excipient compatibility studies: First step for dosage form development. Pharma Innov, 2015; 4: 14.
[17] Jabeen A, Nasir AM, Afaq B et al. An overview of pharmaceutical excipients: Interactions and incompatibilities in dosage form development. Pharma Res J, 2022; 1: 65-72.
[18] Narang AS, Boddu SHS. Excipient applications in formulation design and drug delivery. Springer International Publishing: Cham, Switzerland, 2015.[DOI]
[19] Pawar PA, Sinha VR, Yadav AK. Compatibility Study and Solid Dose Formulation of Rosuvastatin Calcium. J Mod Pharmacol Pathol, 2024; 2: 5.[DOI]
[20] Mishra A, Sinha VR, Sharma S et al. Molecular and qualitative characterization of compatibility between valacyclovir hydrochloride and excipients as raw materials for the development of solid oral dosage formulation. Am J Biopharmacy Pharm Sci, 2023; 3: 8.[DOI]
[21] Mishra A, Sinha V R, Sharma S et al. A comprehensive compatibility study of ganciclovir with some common excipients. Am J Biopharmacy Pharm Sci, 2023; 3: 2.[DOI]
[22] Monajjemzadeh F, Hassanzadeh D, Valizadeh H et al. Compatibility studies of acyclovir and lactose in physical mixtures and commercial tablets. Eur J Pharm Biopharm, 2009; 73: 404-413.[DOI]
[23] Pawar PA, Sinha VR, Yadav AK. Compatibility Study of Fenofibrate with Some Common Excipients and Their Effect on Solid Doge Formulation Development. J Mod Biol Drug Discov, 2024; 3, 4.[DOI]
[24] Hutchinson DJ, Johnson CE, Klein KC. Stability of extemporaneously prepared moxifloxacin oral suspensions. Am J Health-Syst Ph, 2009; 66: 665-667.[DOI]
[25] Gunda RK, Jujjuru NSK. Formulation development and evaluation of moxifloxacin HCl fast dissolving tablets. Pharm Methods, 2017; 8: 160-7.[DOI]
[26] Khan FU, Nasir F, Hassan M et al. Evaluation of the compatibility of moxifloxacin with selected excipients used in the formulation of nanopharmaceuticals. Pharm Chem J, 2022; 55: 1184-1189.[DOI]
[27] Manjanna KM, Krishna GS, Divya GN et al. AN APPROACH TO FORMULATE IN SITU ORAL GEL CONTAINING MOXIFLOXACIN HYDROCHLORIDE FOR THE TREATMENT PERIODONTITIS THERAPY. World J Pharm Res, 2023; 13: 647-660.
[28] Lachman L, Lieberman HA, Kanig JL. The theory and practice of industrial pharmacy. Lea & Febiger: Philadelphia, USA, 1976.
[29] Subramanyam CVS. Text Book of Physical Pharmaceutics. Vallabh Prakashan: New Delhi, India. 2009: 222-228.
[30] Nevle SS, Butle SR. FORMULATION AND EVALUATION OF MOXIFLOXACIN TASTE-MASKED CHEWABLE TABLES FOR PEDIATRIC TUBERCULOSIS. Int J Pharm Sci Res, 2023; 14, 3985-3992
[31] Lachman L, Liberman H, Kanig J. The theory and practice of Industrial pharmacy, Varghese Pub: House, Bombay. 1991: 298-314.
[32] Bhuwane N, Suresh PK. Formulation, optimization and characterization of Mfx-Gold nanoparticle loaded in-situ gel for ophthalmic drug delivery using box-benken design approach. Front Health Inform, 2024; 13: 779-805.
[33] Costa P, Lobo JMS. Modeling and comparison of dissolution profiles. Eur J Pharm Sci, 2001; 13: 123-133.[DOI]
[34] Mudgil M, Pawar PK. Preparation and in vitro/ex vivo evaluation of moxifloxacin-loaded PLGA nanosuspensions for ophthalmic application. Sci Pharm, 2013; 81: 591-606.[DOI]
[35] Bunaciu AA, Hoang VD, Aboul-Enein HY. Fourier transform infrared spectroscopy used in drug excipients compatibility studies. Appl Spectrosc Rev, 2025; 60: 385-403.[DOI]
[36] Kumar YR, Raju VP, Kumar RR et al. Structural identification and characterization of impurities in moxifloxacin. J Pharmaceut Biomed, 2004; 34: 1125-1129.[DOI]
[37] United States Pharmacopoeia, USP XXVII, NF XXII, United States Pharmacopoeial Convention, Inc.., 2004.



 Copyright ©