Compatibility Study and Solid Dose Formulation of Rosuvastatin Calcium
Prajakta Arun Pawar1, Vivek Ranjan Sinha1, Ashok Kumar Yadav1*
1University Institute of Pharmaceutical Sciences, Panjab University, Chandigarh, India
*Correspondence to: Ashok Kumar Yadav, PhD, Assistant Professor, University Institute of Pharmaceutical Sciences, Panjab University, Sector 14, Chandigarh, 160014, India; Email: ashoky@pu.ac.in
Abstract
Objective: The goal of present study is to recognize acceptable excipients to increase performance and stability of oral solid formulations of rosuvastatin calcium by estimating compatibility study of rosuvastatin calcium and used excipients.
Methods: Analytical instruments like fourier transform infrared spectroscopy Spectrum RX 1, [differential scanning calorimetry-Q20, TA], Bruker Advance Neo 500MHz NMR spectrometer, thin layer chromatography] were utilized. Excipients and rosuvastatin calcium were got from Loba chemie and Biocon, respectively. USP1-type dissolution apparatus, and Auto Dock VINA 1.2.0 software were applied.
Results: Numerous analytical methods established that rosuvastatin calcium was compatible with used excipients. Docking score was found -2.1, and minimal interactions were demonstrated by complexes of rosuvastatin calcium with microcrystalline cellulose (MCC) and lactose. Further, an immediate release of rosuvastatin calcium tablet was studied using a combination of various excipients. Tablets of rosuvastatin calcium were formulated with appropriate excipients. Tablets from batches 1, 2, 3, and 4 were observed to disintegrate in 3.0, 4.0, and 5.0min, respectively.
Conclusion: Lactose, talc, starch, dicalcium phosphate, MCC, and carbopol were found to be compatible with rosuvastatin calcium using analytical procedures. At 90min, the percentage of drug release for batches 1, 2, 3, and 4 were 89%, 85%, 82%, and 79%, respectively. The above study showed that batch 1 had the greatest drug release and the shortest disintegration time. Docking studies presented possible interactions between rosuvastatin calcium and excipients.
Keywords: compatibility, formulation, excipient, rosuvastatin calcium, dissolution, Molecular Docking
1 INTRODUCTION
To develop an effective, stable, and safe medicinal product during the drug development process, a detail understanding of the physico-chemical interaction of active pharmaceutical ingredient (API) with the excipient is a crucial stage for the preformulation study[1]. Formulation of dosage form involves combination of API with various excipients which helps to increase bioavailability of drug, effective administration of drug and protection of drug from degradation due to various factors[2,3]. Pharmaceutical excipients are materials that are other than pharmacologically active drug present in the dosage form[4]. Excipients are pharmacologically inert and that can react with API to inactivate drug through loss or decomposition of drug to less favorable physical or chemical form which is known as incompatibility[5,6]. Excipients should be selected properly for effective formulation to increase shelf life of formulation, to promote the release of medicine and patient compliance[7]. Therefore, there is need to assess the proper incompatibilities between drug and excipient by various analytical techniques to avoid the incompatibility problem in order to create a solid formulation.
The goal of current study is to evaluate drug-excipient compatibility study of Rosuvastatin calcium by various analytical techniques and to develop its solid doge formulation. Rosuvastatin calcium is antihyperlipidemic drug that inhibits 3-hydroxy-3-methylglutaryl coenzyme A (HMG CoA) reductase. This enzyme converts HMG-CoA to mevalonic acid in the biosynthetic pathway of cholesterol which is rate limiting step in the synthesis of cholesterol which leads to decrease concentration of hepatocellular cholesterol[8,9]. In this current investigation, excipients, that are used for compatibility study of rosuvastatin calcium are lactose, starch, carbopol, microcrystalline cellulose (MCC), talc, and di-calcium phosphate. In our knowledge, these excipients were not reported for compatibility study of rosuvastatin calcium and development of their solid dosage formulation till date. The interaction between drug-excipient was assessed using analytical techniques that include fourier transform infrared spectroscopy (FTIR), nuclear magnetic resonance (NMR), ultraviolet spectroscopy, and differential scanning calorimetry (DSC)[10,11]. The dissolution study of physical mixtures of drug with excipients was carried out to find %amount of drug release from each physical mixture. Thin layer chromatography (TLC) was also done for the confirmation of compatibility. In-Silico studies were done to discover possible interactions amid drug and excipients which supports compatibility testing and in-vitro drug release. Further, formulation development of conventional tablet of rosuvastatin calcium was studied. Direct compression method was utilized to formulate the tablet of rosuvastatin calcium. Next, formulated tablet was studied for post-compression studies, and in vitro drug release. As a result, we created a traditional rosuvastatin calcium tablet that would dissolve quickly in the gastrointestinal tract and accomplish fast tablet disintegration. Different batches for conventional tablets of rosuvastatin were formulated, evaluated, and compared for the best formulation.
2 MATERIALS AND METHODS
2.1 Materials
For research purposes, Biocon in Bangalore provided a gift sample of rosuvastatin calcium. Loba Chemie Pvt. Ltd. in Mumbai and Central Drug House in New Delhi provided starch, lactose, MCC, carbopol, di-calcium phosphate, and talc, in that order. From Thermo-Fischer Scientific India Pvt. Ltd. in Mumbai, India, the solvents were purchased.
2.2 Methods
2.2.1 Development and Validation of Analytical Procedures
2.2.1.1 UV-Visible Spectrophotometric Method
(1) Preparation of Standard Solution: To generate a stock solution of 100μg/mL, 10mg of rosuvastatin calcium was precisely weighed, dissolved in methanol, and the volume was increased to 100mL with methanol. To obtain a standard drug solution with a concentration range of 0-25μg/mL, graded dilutions were produced from the stock solution. Using UV-visible spectroscopy, the absorbance of the solution was detected at 250nm, and a calibration curve was created.
(2) Wavelength Selection: After baseline correction, methanol was used as a blank and a 10μg/mL standard solution of rosuvastatin calcium was scanned between 200 and 400nm in a UV spectrophotometer.
(3) Preparation of Calibration Curve: Solutions of drug were prepared for concentrations 2.5, 5, 7.5, 10, 15, 20 and 25μg/mL from 100μg/mL and 10μg/mL standard stock solutions and methanol was used as a solvent. A calibration curve was plotted.
(4) Linearity: A methanol stock solution containing 1000µg of the substance was prepared. To get a concentration of 100μg/mL, 1.0mL of this stock solution was diluted to 10.0mL using distilled water. This solution was further diluted serially to prepare dilutions ranging 2.5-25μg/mL. The samples were analyzed spectrophotometrically at a wavelength of 250nm against corresponding blank. Slope was determined from the regressed line obtained by plotting concentration versus absorbance.
(5) Precision: The accuracy of the technique was investigated by both intra- and inter-day variation analyses. Precision study was carried out on three concentrations from the linearity range i.e., 2.5, 10 and 25μg/mL. Each of three concentrations were investigated three times within a day and for three consecutive days to establish intra-day and inter-day precisions.
2.2.2 Compatibility Study
A physical mixture including rosuvastatin calcium and excipient was created in a 1:1 ratio, and it was subjected to analytical techniques such as DSC, NMR, and FTIR spectroscopy[12,13]. NMR, FTIR, and DSC thermograms of both pure drugs and physical mixes were obtained, and the spectra of the both drugs and mixture of excipient with drug were compared to look for any incompatibilities.
2.2.2.1 FTIR Study
KBr-disc method was used to record the FTIR spectra and KBr pellets were made in 1:100 ratio of sample and KBr. FTIR spectra was recorded using Spectrum RX 1, (Perkin Elmer, UK) in a range of 4000-400cm-1. Different functional groups of test compound for distinctive vibrational frequencies are identified using FTIR spectroscopy. FTIR spectra were used for the investigation of interaction in the physical mixture of drug and excipient through shifting of peaks to lower or higher wavenumbers and appearance or disappearance of characteristic peaks of functional groups for pure drug in physical mixture[14,15].
2.2.2.2 DSC Study
DSC-Q20, TA Instruments, (New Castle Delaware, US) conducted a DSC analysis of the sample. The sample was enclosed in an aluminum pan and heated under nitrogen purge to 300℃, with a scanning rate of 10℃/min. An empty aluminum pan was utilized as a reference. Incompatibility was indicated by a considerable change in the melting of the constituents or variation in the corresponding enthalpies of reaction in DSC thermograms, whether a new exothermic or endothermic peak appeared or disappeared[16].
2.2.2.3 NMR Spectroscopy (NMR) Study of Rosuvastatin Calcium
An NMR spectrometer (Bruker Advance Neo 500MHz) was used to record the Rosuvastatin calcium NMR spectra and its physical mixes in DMSO-d6. Because of changes in the electron density at the interacting atoms, NMR is a highly discriminating technique that can identify interaction through differences in the chemical shift[17].
2.2.2.4 TLC Study of Rosuvastatin Calcium
The foundation of TLC is the dispersion of a compound between a thin layer of applied solid material on a glass or plastic plate and a liquid mobile phase (eluting solvent) that is moving over the solid phase[18-20]. TLC is sensitive and quick technique that is used for identification and purification of compound, determination of number of compounds in a mixture, monitoring progress of reaction and analyzing fractions obtained from column chromatography. Chloroform:methanol in a 9:1 ratio was the mobile phase employed in this investigation. Due to variations in their attraction to the stationary phase and in the solubility of solvent components, the sample mixes with the initial spot and travels with the solvent at varying speeds as it rises higher. UV light can be used for visualization. The fluorescent material that is injected into the silica gel on the plate lights when exposed to UV light, making the spot seem dark against the shining background. Visualization can also be done by placing a TLC plate in closed container containing iodine vapor. After that Rf value was calculated.
2.3 In Vitro Dissolution Study
Using a USP-II type dissolving device (Lab India DS 800 Mumbai), the dissolution studies were conducted. 50mg of Rosuvastatin Calcium was exactly weighed and filled in capsules and capsules were tied to the paddle using copper wire. 900mL of phosphate buffer solution was taken as a dissolution media. The temperature was kept at 37±0.5℃, and 50RPM was the stirring speed. To keep the sink condition, 5.0mL of samples were taken out of each beaker at different times and replaced with new media. The drug-excipient physical mixture dissolution investigation was conducted using the same methodology. The extracted materials were examined at 250nm using a 3200UV/Visible Spectrophotometer after being sieved using a 0.2µm nylon filter. The percentage of the drug dissolved in the dissolving media was calculated from the release data.
2.4 Molecular Docking
An in-silico technique called “Molecular Docking” allows for the molecular level identification of medication interactions[21,22]. The Auto Dock VINA 1.2.0 software was used for it. Molecules’ two-dimensional structures were acquired from the PubChem database. Using the Auto Dock tools, the docking structures were created, and a blind docking with a 40A * 40A * 40A grid size was carried out.
2.5 Formulation Development of Conventional Tablet
In the pharmaceutical sector, direct compression is one of the most popular and cost-effective methods for producing tablets[23]. The procedure of compressing a tablet directly from powdered active drug component and appropriate excipients into a solid compact without using the granulation process was defined using the direct compression method. As a directly equivalent vehicle, MCC and dicalcium phosphate (DP) were employed.
2.5.1 Conventional Tablet of Rosuvastatin Calcium
All ingredients were weighed accurately and passed through 40 number mesh sieves. Required quantity of rosuvastatin calcium was mixed with disintegrant and diluent in an inflated polythene bag with proper mixing for 10 to 15min. Geometric mixing was used for uniform mixing of rosuvastatin calcium. Further, the powder mixture was lubricated by adding of magnesium stearate and talc. Flat faced direct compression tablets (100mg) were prepared using rotary tableting machine. The formula of conventional tablet formulation of all batches was mentioned in the Table 1.
Table 1. Composition for Conventional Tablet of Rosuvastatin Calcium with Different Excipients
Ingredients |
Quantity (mg) |
|||
Batch 1 |
Batch 2 |
Batch 3 |
Batch 4 |
|
Rosuvastatin calcium |
5 |
5 |
5 |
5 |
MCC |
76 |
- |
- |
- |
Anhydrous lactose |
- |
76 |
- |
- |
DP |
- |
- |
76 |
- |
Carbopol |
- |
- |
- |
76 |
Starch |
15 |
15 |
15 |
15 |
Talc |
3 |
3 |
3 |
3 |
Magnesium stearate |
1 |
1 |
1 |
1 |
Total |
100 |
100 |
100 |
100 |
During post-compression studies for the formulated tablets of rosuvastatin calcium, the following parameters were evaluated:
2.5.1.1 Appearance
Keeping the uncoated tablets in the light, they were inspected through a lens to determine their color and shape.
2.5.1.2 Hardness Test
The ability of a tablet to tolerate mechanical shocks during handling is determined by a hardness test[24]. We used a Monsanto hardness tester to examine hardness of tablet. They used kg/cm2 to express it. For the hardness test, tablets were chosen at random and examined. Findings were made regarding the mean and standard deviation.
2.5.1.3 In-Vitro Disintegration Time
The Lab India disintegration apparatus was utilized to ascertain in-vitro disintegration time of the formulated tablets. The amount of time required for a tablet to dissolve and leave no solid residue behind was called the disintegration time. As the immersion liquid, water was used as a disintegration medium kept at 37±2℃. A thermometer was used to continuously check temperature of the medium. The disintegration time of tablet was measured using a digital stopwatch. Each batch had a total of six tablets tested, and the results were given as the mean ± standard deviation. Using a disintegration test apparatus in accordance with I.P. specifications, in-vitro disintegration time of the tablet was ascertained.
2.5.1.4 In-Vitro Dissolution Study
An easy, quick, and accurate method for evaluating the quality of formulations is the in vitro dissolution study[25]. The primary objective of the in vitro dissolving test was to demonstrate the drug's release profile from the created formulation.
2.5.1.5 Dissolution Test Parameters for Formulation of Rosuvastatin Calcium Tablet
The following parameters were utilized through the study to perform the in vitro dissolution test of rosuvastatin calcium tablets and were described in the Table 2.
Table 2. Dissolution Test Parameters for Formulation of Rosuvastatin Calcium Tablet
Dissolution Media |
900mL of Phosphate Buffer (pH 6.8) |
Temperature |
37℃±0.05% |
Stirring speed |
50rpm |
Tablet taken |
One tablet in each basket |
Volume withdrawn |
5.0mL in specific interval of time |
λmax |
250Nm |
3 RESULTS
3.1 Characterization of Rosuvastatin Calcium (Pure Drug)
The important objective for characterization of rosuvastatin Calcium is to know identity, purity, and characteristic of the drug. Rosuvastatin calcium was identified and its purity assessed using a variety of analytical methods, including DSC, NMR, FTIR, and UV-visible spectroscopy.
3.1.1 Physical Identification of Drug
Rosuvastatin calcium is white in color and nature is crystalline.
3.1.2 Characterization of Rosuvastatin Calcium by UV Spectroscopy
The absorption maximum (λmax) of rosuvastatin calcium was observed to be 250nm.
3.1.3 Melting Point
Melting point of rosuvastatin calcium was observed to be 175-176℃. Reported melting point of rosuvastatin calcium is 173-185℃.
3.1.4 Characterization of Rosuvastatin Calcium by FTIR Spectrophotometry
FTIR spectra of pure rosuvastatin calcium was recorded on an IR Spectrophotometer (Spectrum RX 1, Perkin Elmer, UK). The rosuvastatin calcium displayed absorption peaks in its FTIR spectra at 3302 (O-H), 2968 (C-H), 1541 (C=N), 1229 (C=O), and 1075 (S=O) (Figure 1).
|
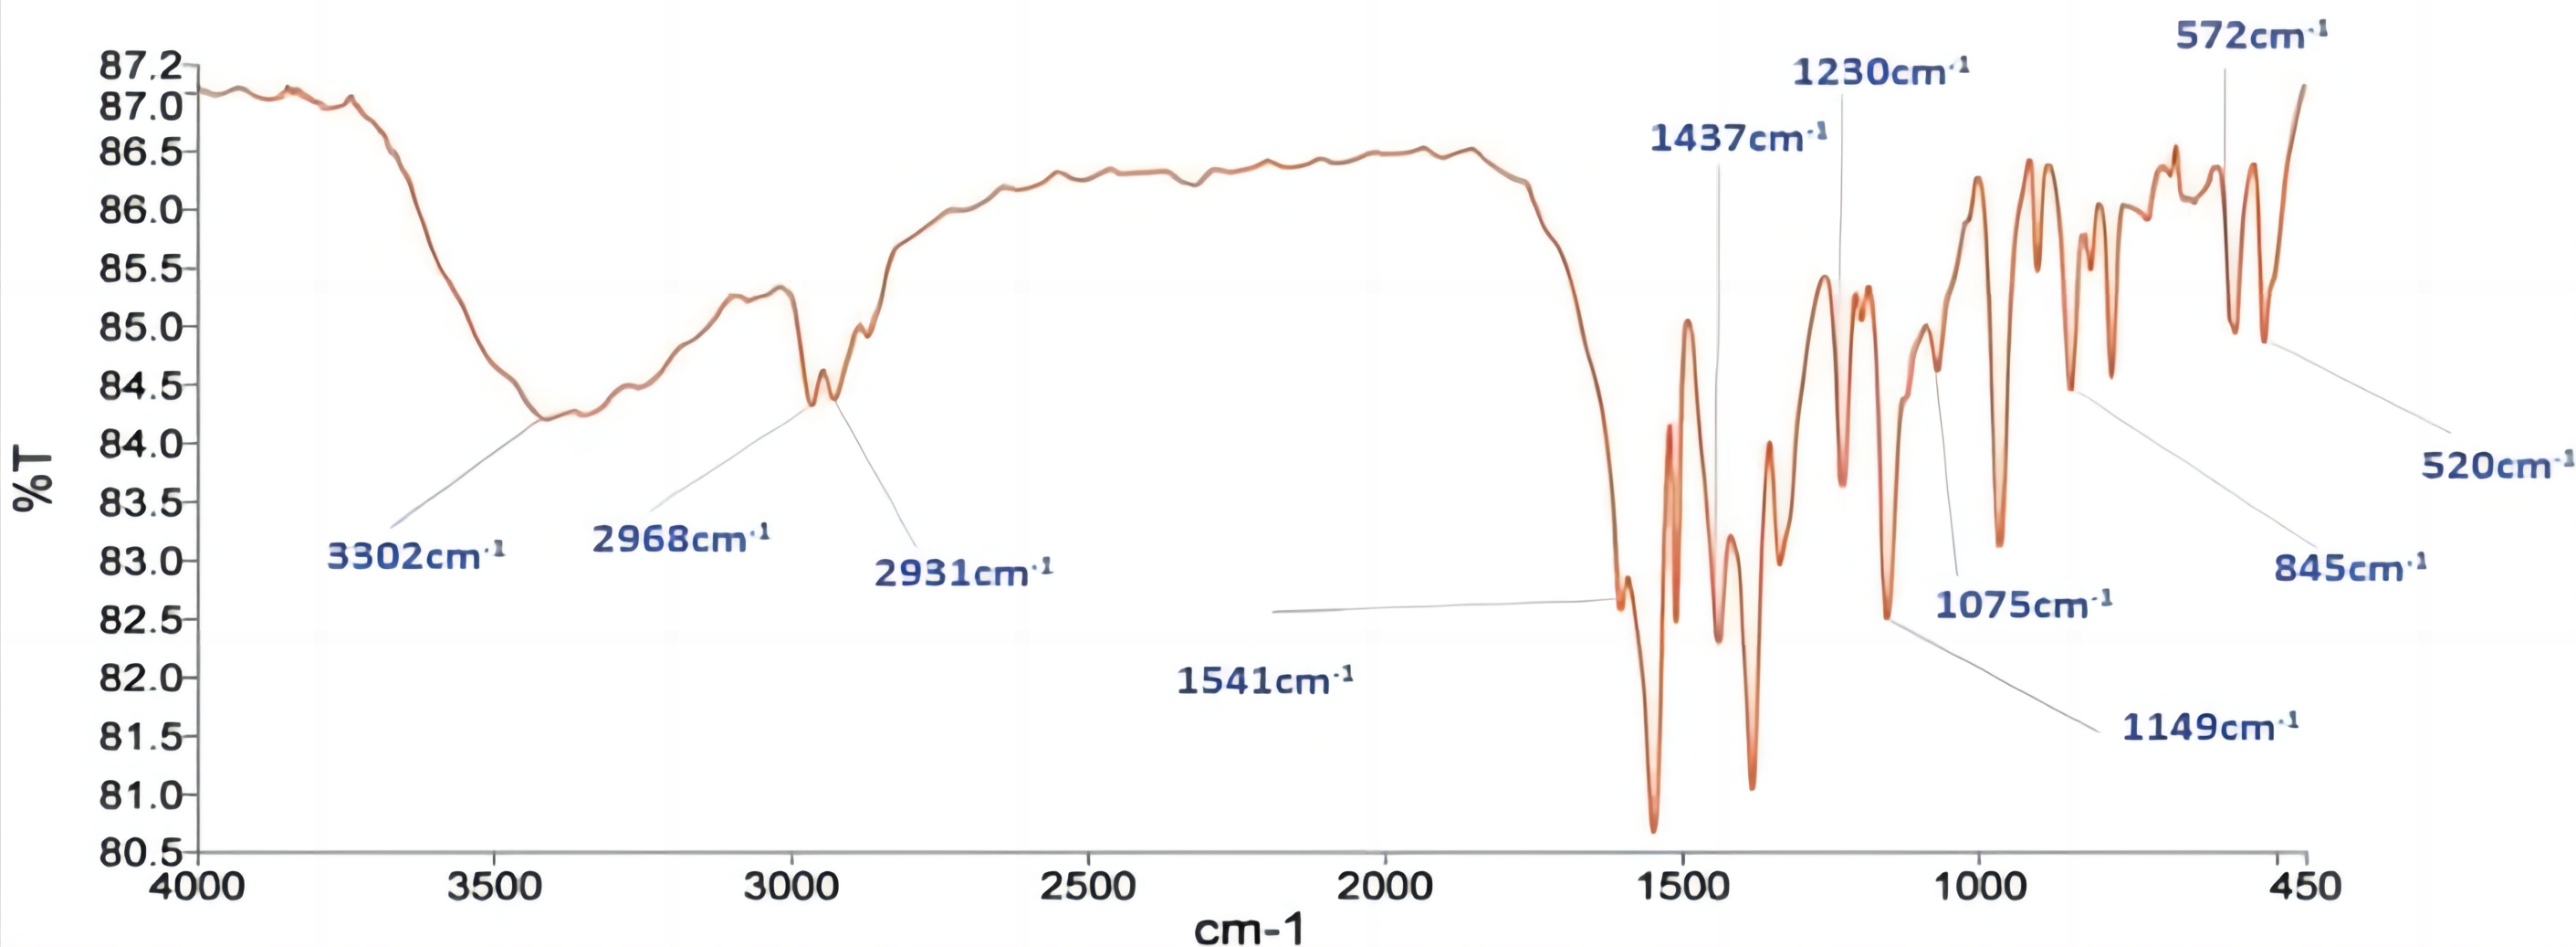
Figure 1. FTIR Spectrum of pure rosuvastatin calcium.
3.1.5 Characterization of Rosuvastatin Calcium by NMR Spectroscopy
The 1H NMR of rosuvastatin calcium demonstrated signals with distinguishing values of chemical shift (δ) for example 1.26 (CH3), 1.32 (CH), 1.50 (CH-CH2), 2.01 (CH2), 2.16 (CH2), 3.44 (CH3), 3.54 (CH3), 3.56 (OH), 3.77 (CH3), 4.21 (OH), 5.53 (CH-CH), 6.52 (CH=CH) (Figure 2).
|
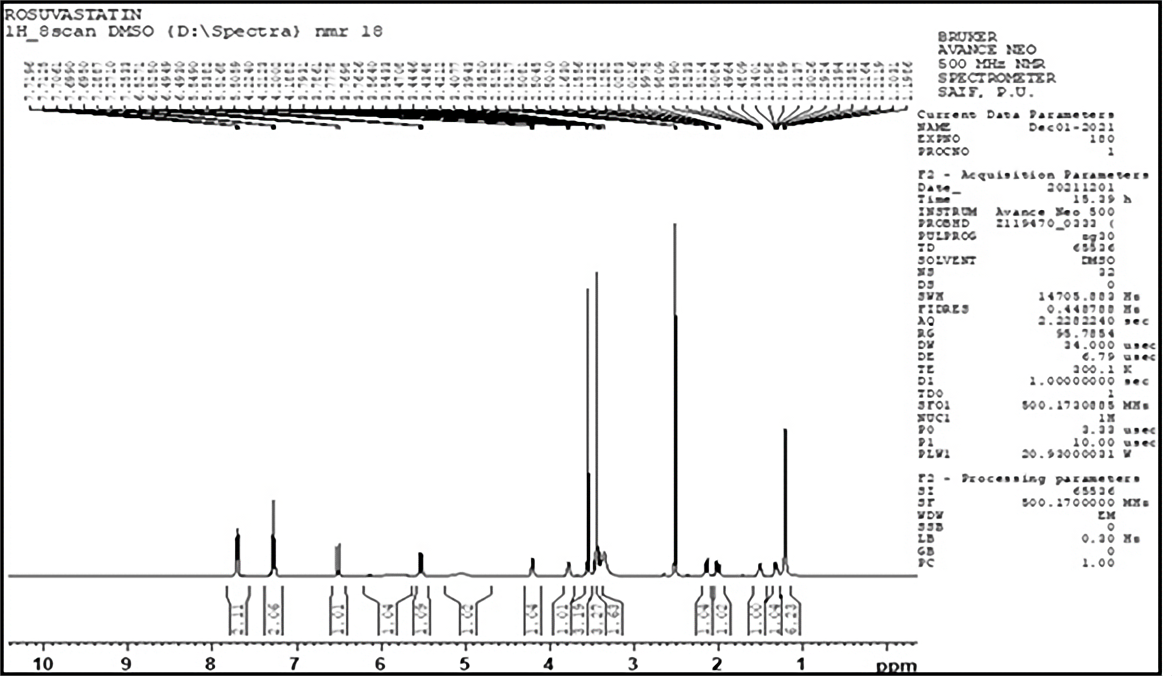
Figure 2. 1H NMR Spectrum of pure rosuvastatin calcium.
3.1.6 Characterization of Rosuvastatin Calcium by DSC Study
The thermogram of drug displayed endothermic peak at 153.34℃ (Figure 3).
|
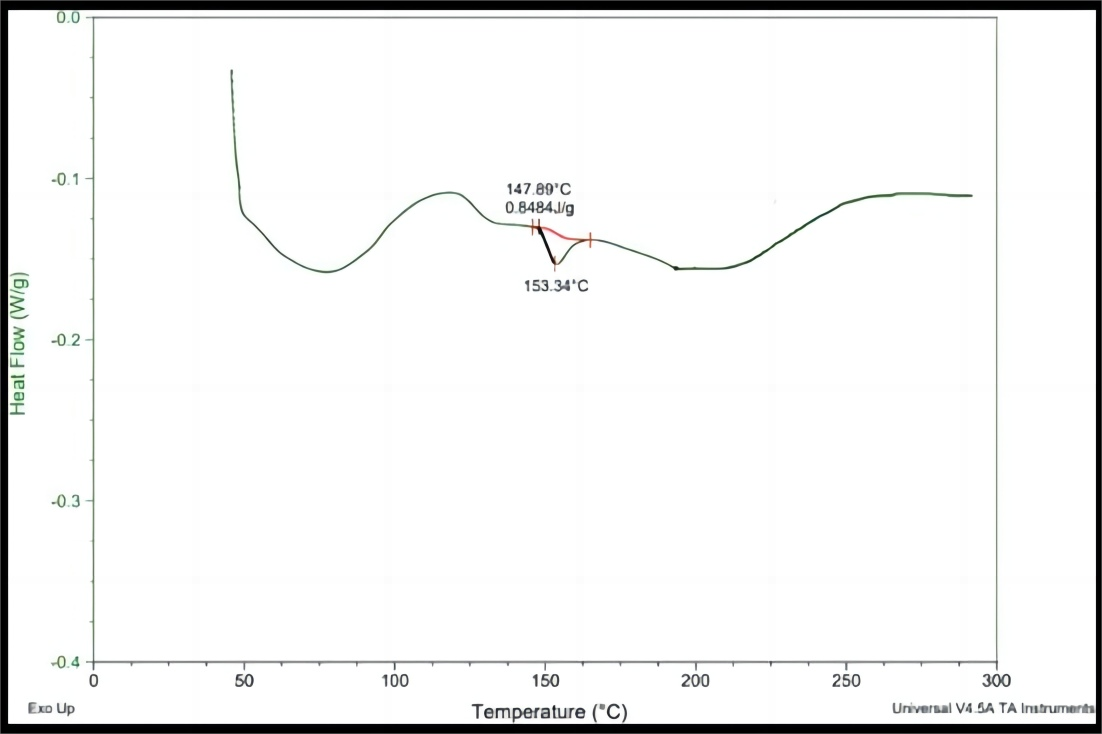
Figure 3. DSC thermogram of pure rosuvastatin calcium.
3.2 Analytical Method Development
3.2.1 Method Development and Validation by UV-Visible Spectroscopy
Stock solution of 100μg/mL of rosuvastatin calcium was made by liquifying 10mg of drug in methanol and volume of 100mL capacity was achieved. To obtain a standard drug solution ranging from 2.5 to 25μg/mL, graded dilutions were made from the stock solution. Using UV-visible spectroscopy, the solution's absorbance was measured at 250nm, and a calibration curve was created (Table 3).
Table 3. Calibration Curve of Rosuvastatin Calcium
Concentration (μg/mL) |
Absorbance±SD |
%RSD |
0.0 |
0.000 |
0.00 |
2.5 |
0.124±0.001 |
0.81 |
5.0 |
0.204±0.0020 |
1.02 |
7.5 |
0.362±0.0032 |
0.89 |
10 |
0.457±0.0017 |
0.38 |
15 |
0.653±0.0015 |
0.23 |
20 |
0.88 ±0.01 |
1.14 |
25 |
1.136±0.014 |
1.23 |
3.2.2 Calibration Curve of Rosuvastatin Calcium
Rosuvastatin calcium calibration curves in methanol and phosphate buffer were created and are shown in Figure 4.
|
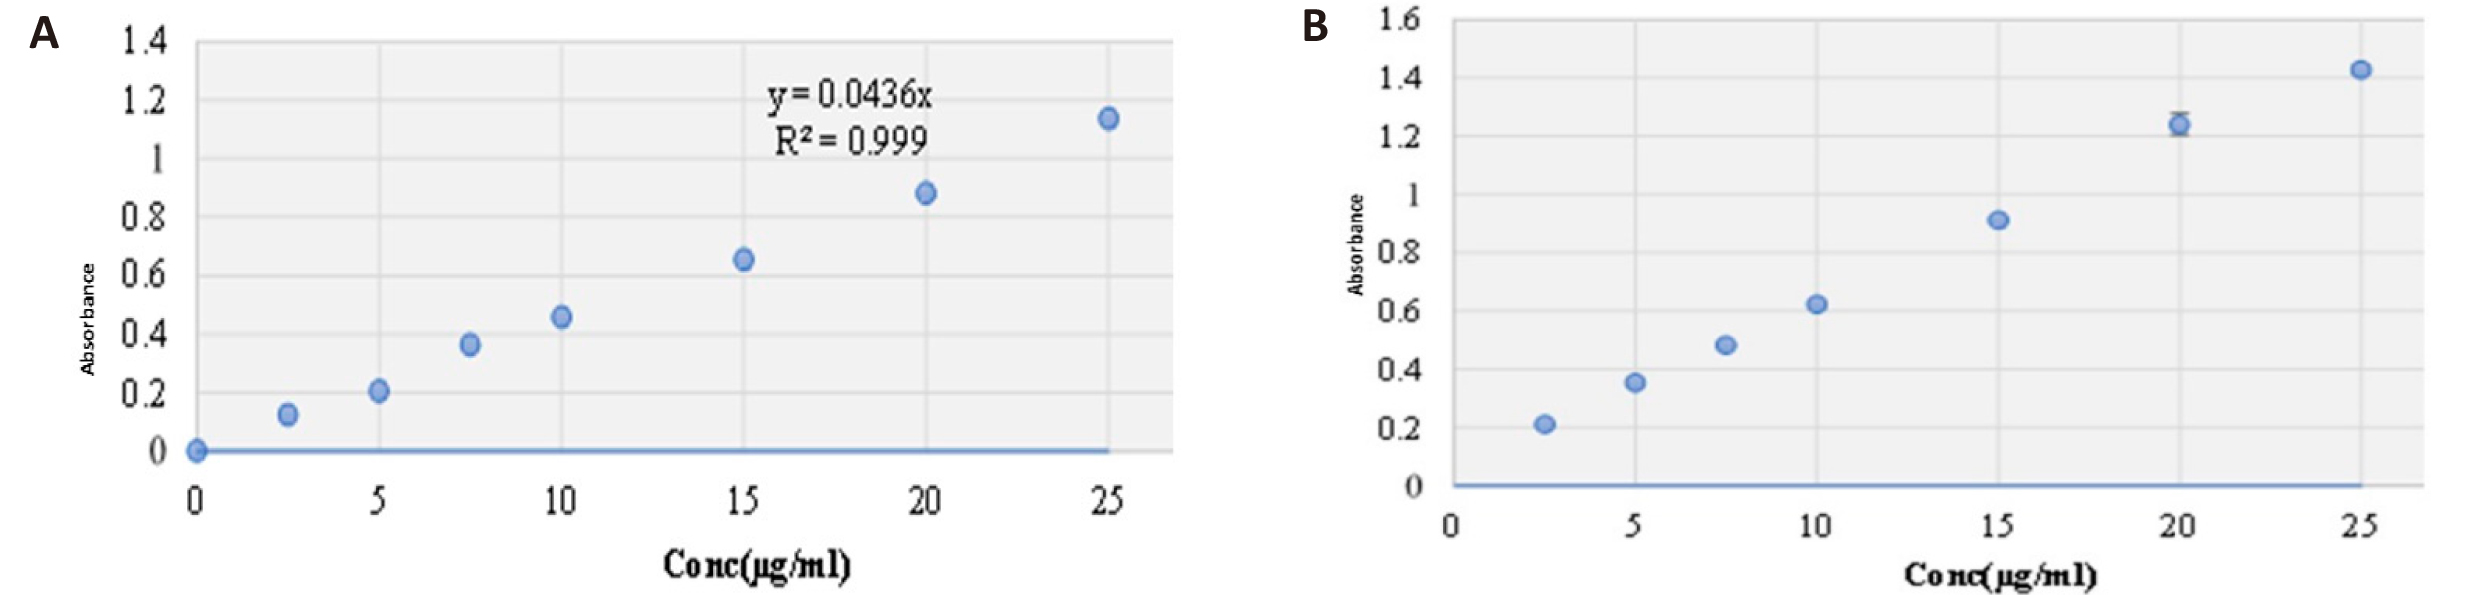
Figure 4. Rosuvastatin calcium calibration curves in methanol (A) and phosphate buffer (B).
3.2.3 Linearity
Linearity is determination of the concentration range of drug that agrees to Beer-Lambert’s Law. For linearity studies, standard solutions of rosuvastatin calcium with different concentrations (2.5-25μg/mL) were used. Analysis was done in triplicates and absorbances of different concentrations were plotted against the concentrations to obtain the calibration curve. Calibration curves of absorbances versus concentrations were found to be linear over a range of 2.5-25μg/mL in methanol and 6.8 phosphate buffer solution as illustrated in Figure 4.
3.2.4 Range
The linearity study was used to determine the range of method, which offered a respectable level of precision and linearity. The range was found to be 2.5-25μg/mL.
3.2.5 Interday and Intraday Precisions
Table 4 presented the mean absorbance, standard deviation, and relative standard deviation for three concentrations (2.5, 10, and 25μg/mL).
Table 4. Interday and Intraday Precisions
Intraday Precision |
Interday Precision |
|||
Conc. (µg/mL) |
Mean Absorbance±SD |
%RSD |
Mean Absorbance±SD |
%RSD |
2.5 |
0.133±0.0011 |
0.88 |
0.127±0.0015 |
1.22 |
10 |
0.444±0.0058 |
1.29 |
0.44±0.0085 |
1.90 |
25 |
1.120±0.0202 |
1.79 |
1.1±0.0170 |
1.58 |
3.3 Preformulation Studies
3.3.1 Drug-Excipients Compatibility Studies
Drug-excipient compatibility study is essential part of preformulation step for the development of new drug. Physical mixture of drug and excipient (1:1) were prepared and compatibility studies were carried out using DSC, NMR and FTIR Spectroscopy to investigate any sign of incompatibility.
3.3.1.1 Visual Observation
It was noted that, under room temperature and humidity conditions, there was no color change or lump formation in any of the drug-excipient mixtures. Based on the observations made, it was determined that there was compatibility between the drug and the excipients used in the experimental study.
3.3.1.2 Compatibility Study of Rosuvastatin Calcium Utilizing FTIR Spectroscopy
The FTIR spectrum demonstrated distinguishing absorption bands of rosuvastatin calcium in the mixture of rosuvastatin with excipients and absorption bands of rosuvastatin calcium were shown in the Table 5 and Figure 5. The FTIR spectrum of pure rosuvastatin calcium was branded by the absorption peaks at 3302 (OH), 2968 (CH Stretch), 1541 (C=N), 1229 (C=O), and 1075 (S=O). The characteristic absorption bands of rosuvastatin calcium in the physical mixtures of rosuvastatin and excipients were compared from the Table 5 and Figure 5.
Table 5. A Comparative Study for the FTIR Absorption Bands of Pure Rosuvastatin Calcium and Physical Mixture of Rosuvastatin Calcium with Different Excipients
Functional group |
Rosuvastatin Calcium |
Rosuvastatin+ Lactose |
Rosuvastatin+ D.P. |
Rosuvastatin+ MCC |
Rosuvastatin+ Carbopol |
Rosuvastatin+ Starch |
Rosuvastatin+ Talc |
OH |
3302 |
3384 |
3382 |
3417 |
3414 |
3405 |
3418 |
C=N |
1541 |
1547 |
1547 |
1551 |
1547 |
1547 |
1547 |
CH stretch |
2968 |
2968 |
2967 |
2928 |
2961 |
2961 |
2967 |
C=O |
1229 |
1225 |
1227 |
1236 |
1229 |
1229 |
1228 |
S=O Sulfone |
1075 |
1033 |
1066 |
1063 |
1154 |
1154 |
1016 |
|
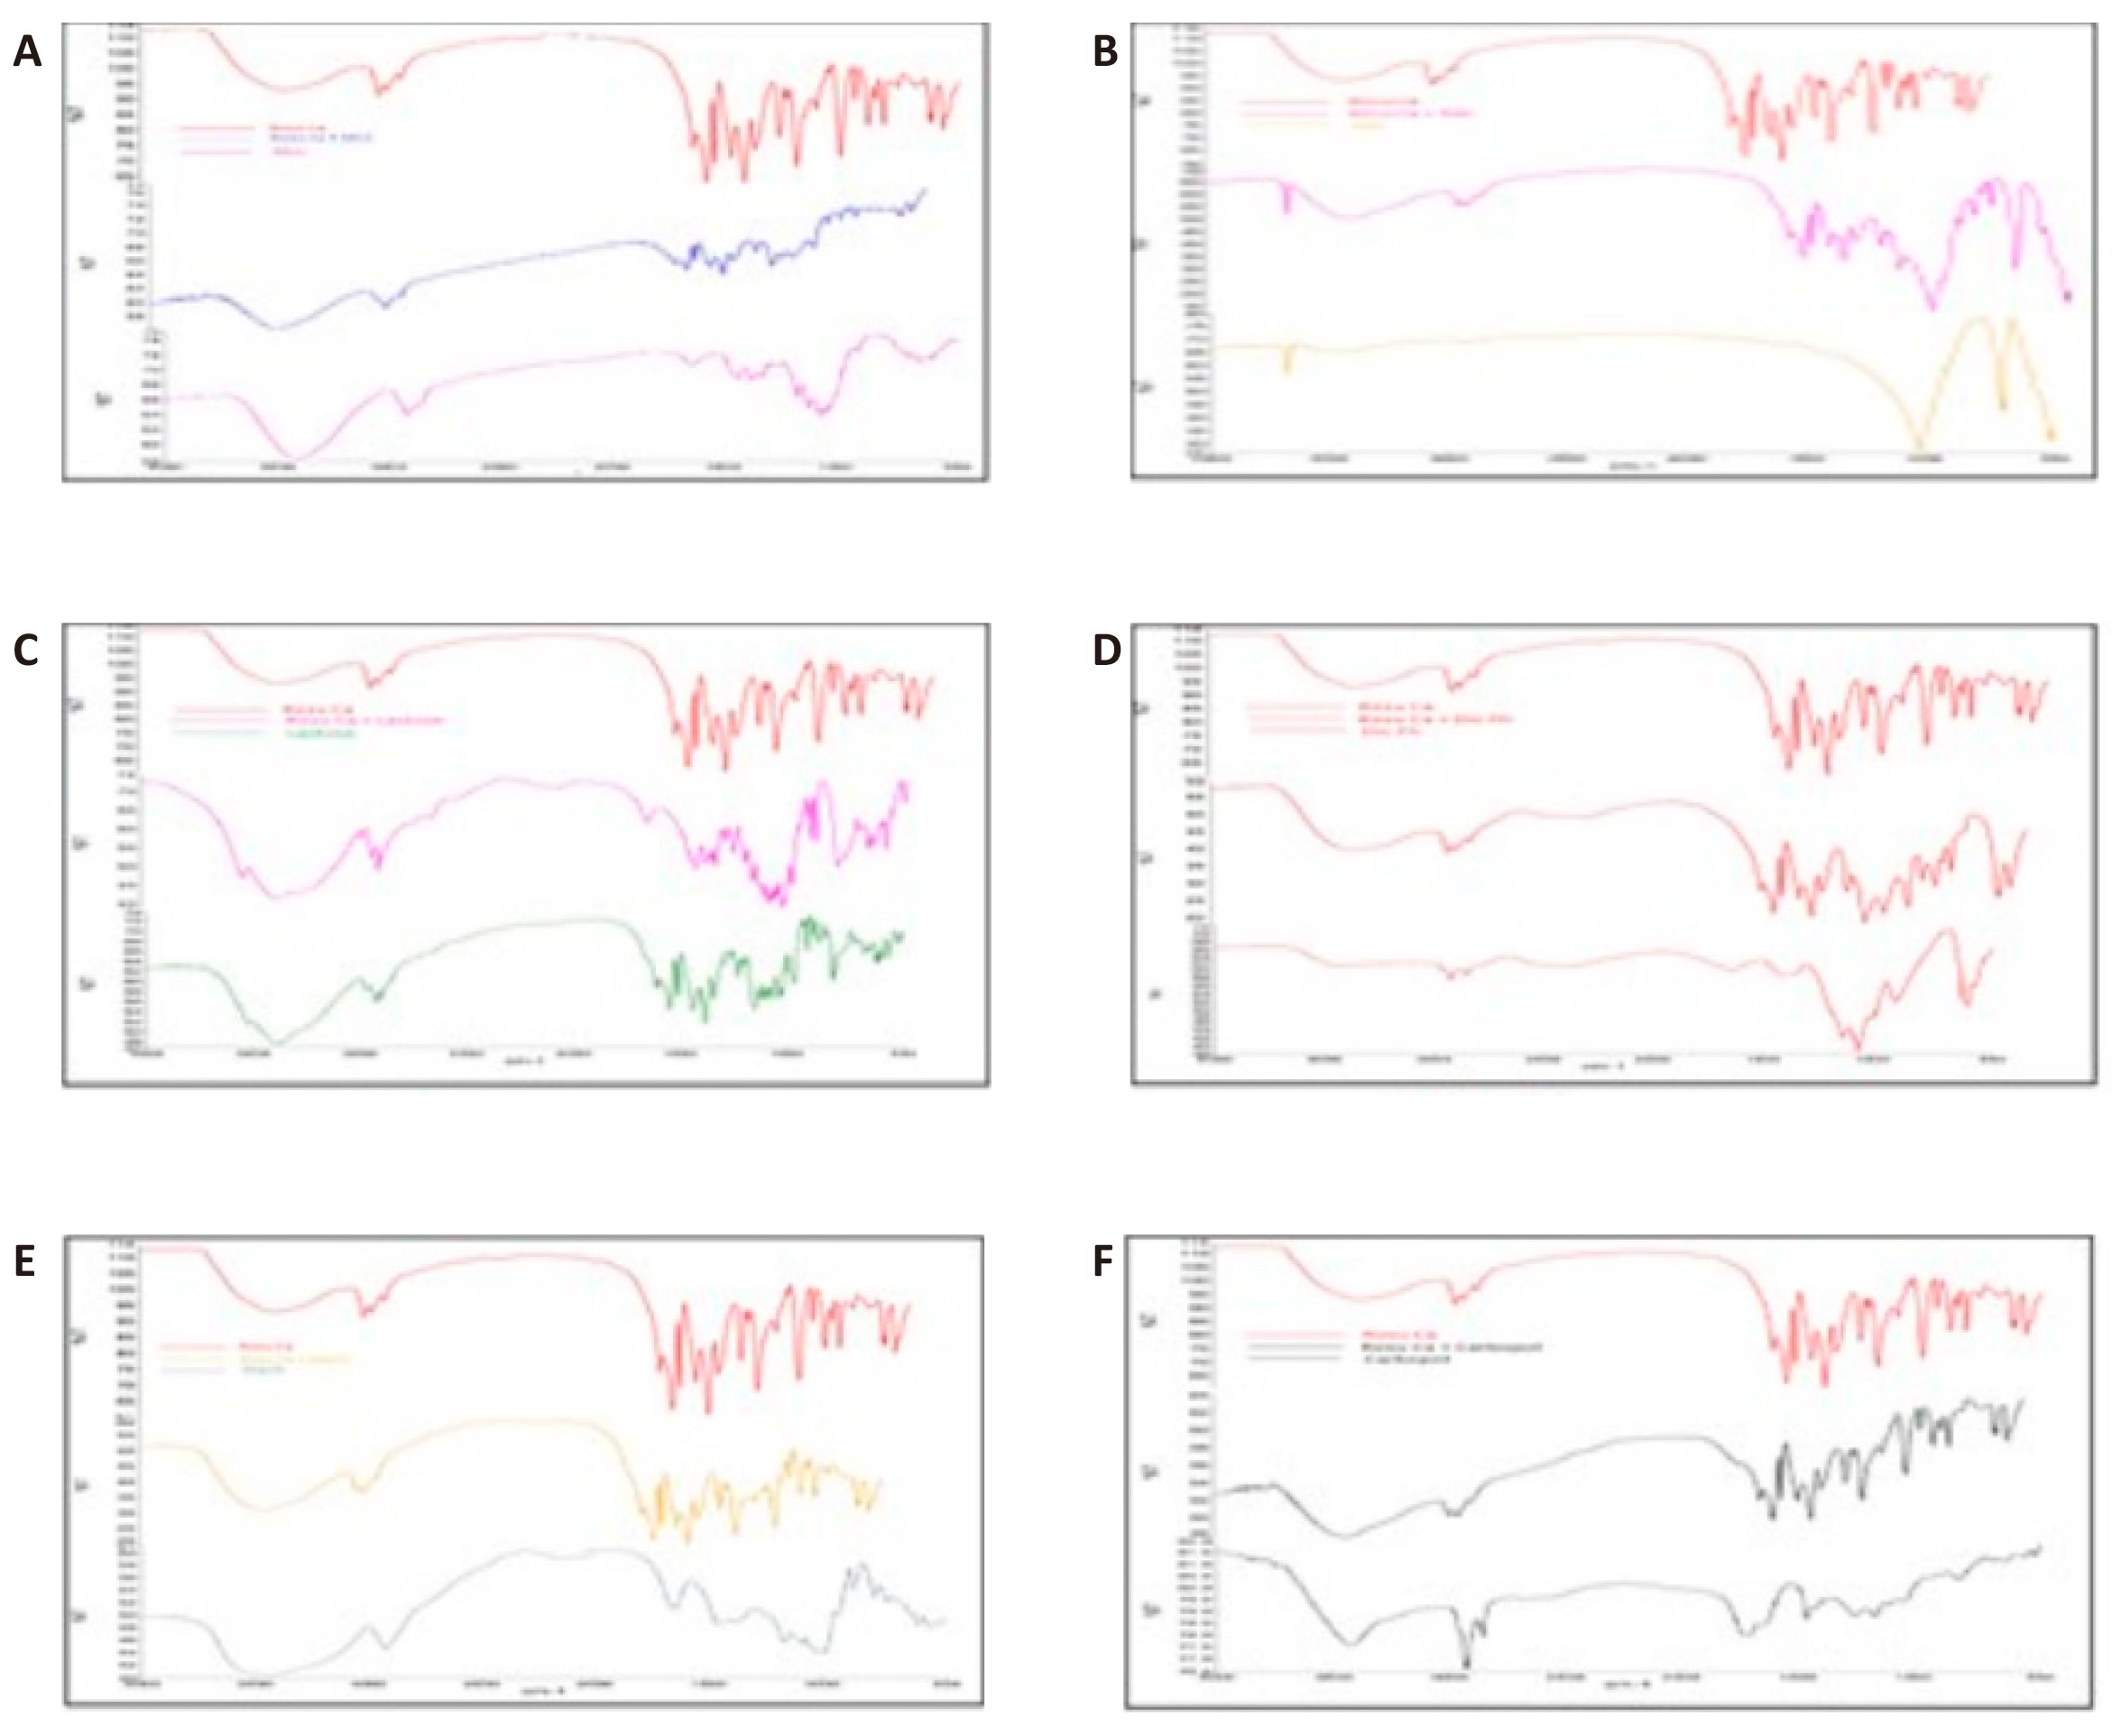
Figure 5. FT IR Spectra for Rosuvastatin calcium. A: MCC; B: Talc; C: Lactose; D: DP; E: Starch; F: Carbopol.
3.3.1.3 Compatibility Studies of Rosuvastatin Calcium Using 1H NMR Spectroscopy
The comparative study of chemical shifts of the rosuvastatin calcium and physical mixtures were demonstrated in the Table 6 and Figure 6. The most important signals for rosuvastatin calcium were 1.26 (CH3), 1.32 (CH), 1.50 (CH-CH2), 2.01(CH2), 2.16 (CH2), 3.44 (CH3), 3.54 (CH3), 3.56 (OH), 3.77 (CH3), 4.21 (OH), 5.53 (CH-CH) and 6.52 (CH=CH).
Table 6. 1H NMR Chemical Shifts for Rosuvastatin Calcium and Physical Mixtures of Drug and Excipients
Posi. of proton |
Chemical Shift |
Ros. |
Ros + Lac |
Ros + M.C.C. |
Ros + Talc |
Ros + D.P. |
Ros + Starch |
Ros + Carb. |
1 |
CH3 |
1.26 |
1.21 |
1.21 |
1.21 |
1.21 |
1.21 |
1.34 |
2 |
CH |
1.32 |
1.32 |
1.32 |
1.33 |
1.32 |
1.32 |
1.36 |
3 |
CH-CH2 |
1.50 |
1.51 |
1.50 |
1.50 |
1.50 |
1.50 |
1.53 |
4 |
CH2 |
2.01 |
2.00 |
2.00 |
2.00 |
2.00 |
1.99 |
2.35 |
5 |
CH2 |
2.16 |
2.14 |
2.14 |
2.14 |
2.14 |
2.13 |
2.41 |
6 |
CH3 |
3.44 |
3.44 |
3.44 |
3.44 |
3.44 |
3.44 |
3.35 |
7 |
CH3 |
3.54 |
3.54 |
3.54 |
3.54 |
3.54 |
3.54 |
4.63 |
8 |
OH |
3.56 |
3.56 |
3.56 |
3.56 |
3.56 |
3.58 |
2.68 |
9 |
CH3 |
3.77 |
3.75 |
3.75 |
3.75 |
3.74 |
3.75 |
3.72 |
10 |
OH |
4.21 |
4.21 |
4.21 |
4.21 |
4.21 |
4.20 |
4.25 |
11 |
CH-CH |
5.53 |
5.54 |
5.54 |
5.54 |
5.54 |
5.55 |
5.51 |
12 |
CH=CH |
6.52 |
6.52 |
6.52 |
6.52 |
6.52 |
6.52 |
6.69 |
|
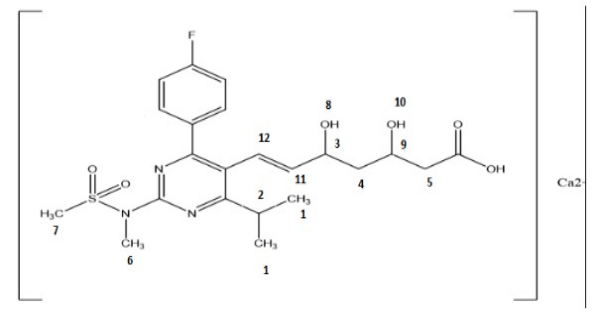
Figure 6. Structure of rosuvastatin calcium.
3.3.1.4 Compatibility Studies of Rosuvastatin Calcium Using DSC
DSC thermograms of pure drug and physical mixture of drug with excipients were given below in the Figure 7. The DSC thermogram of pure rosuvastatin calcium displayed an endothermic peak at 153.34℃ (Figure 7A).
|
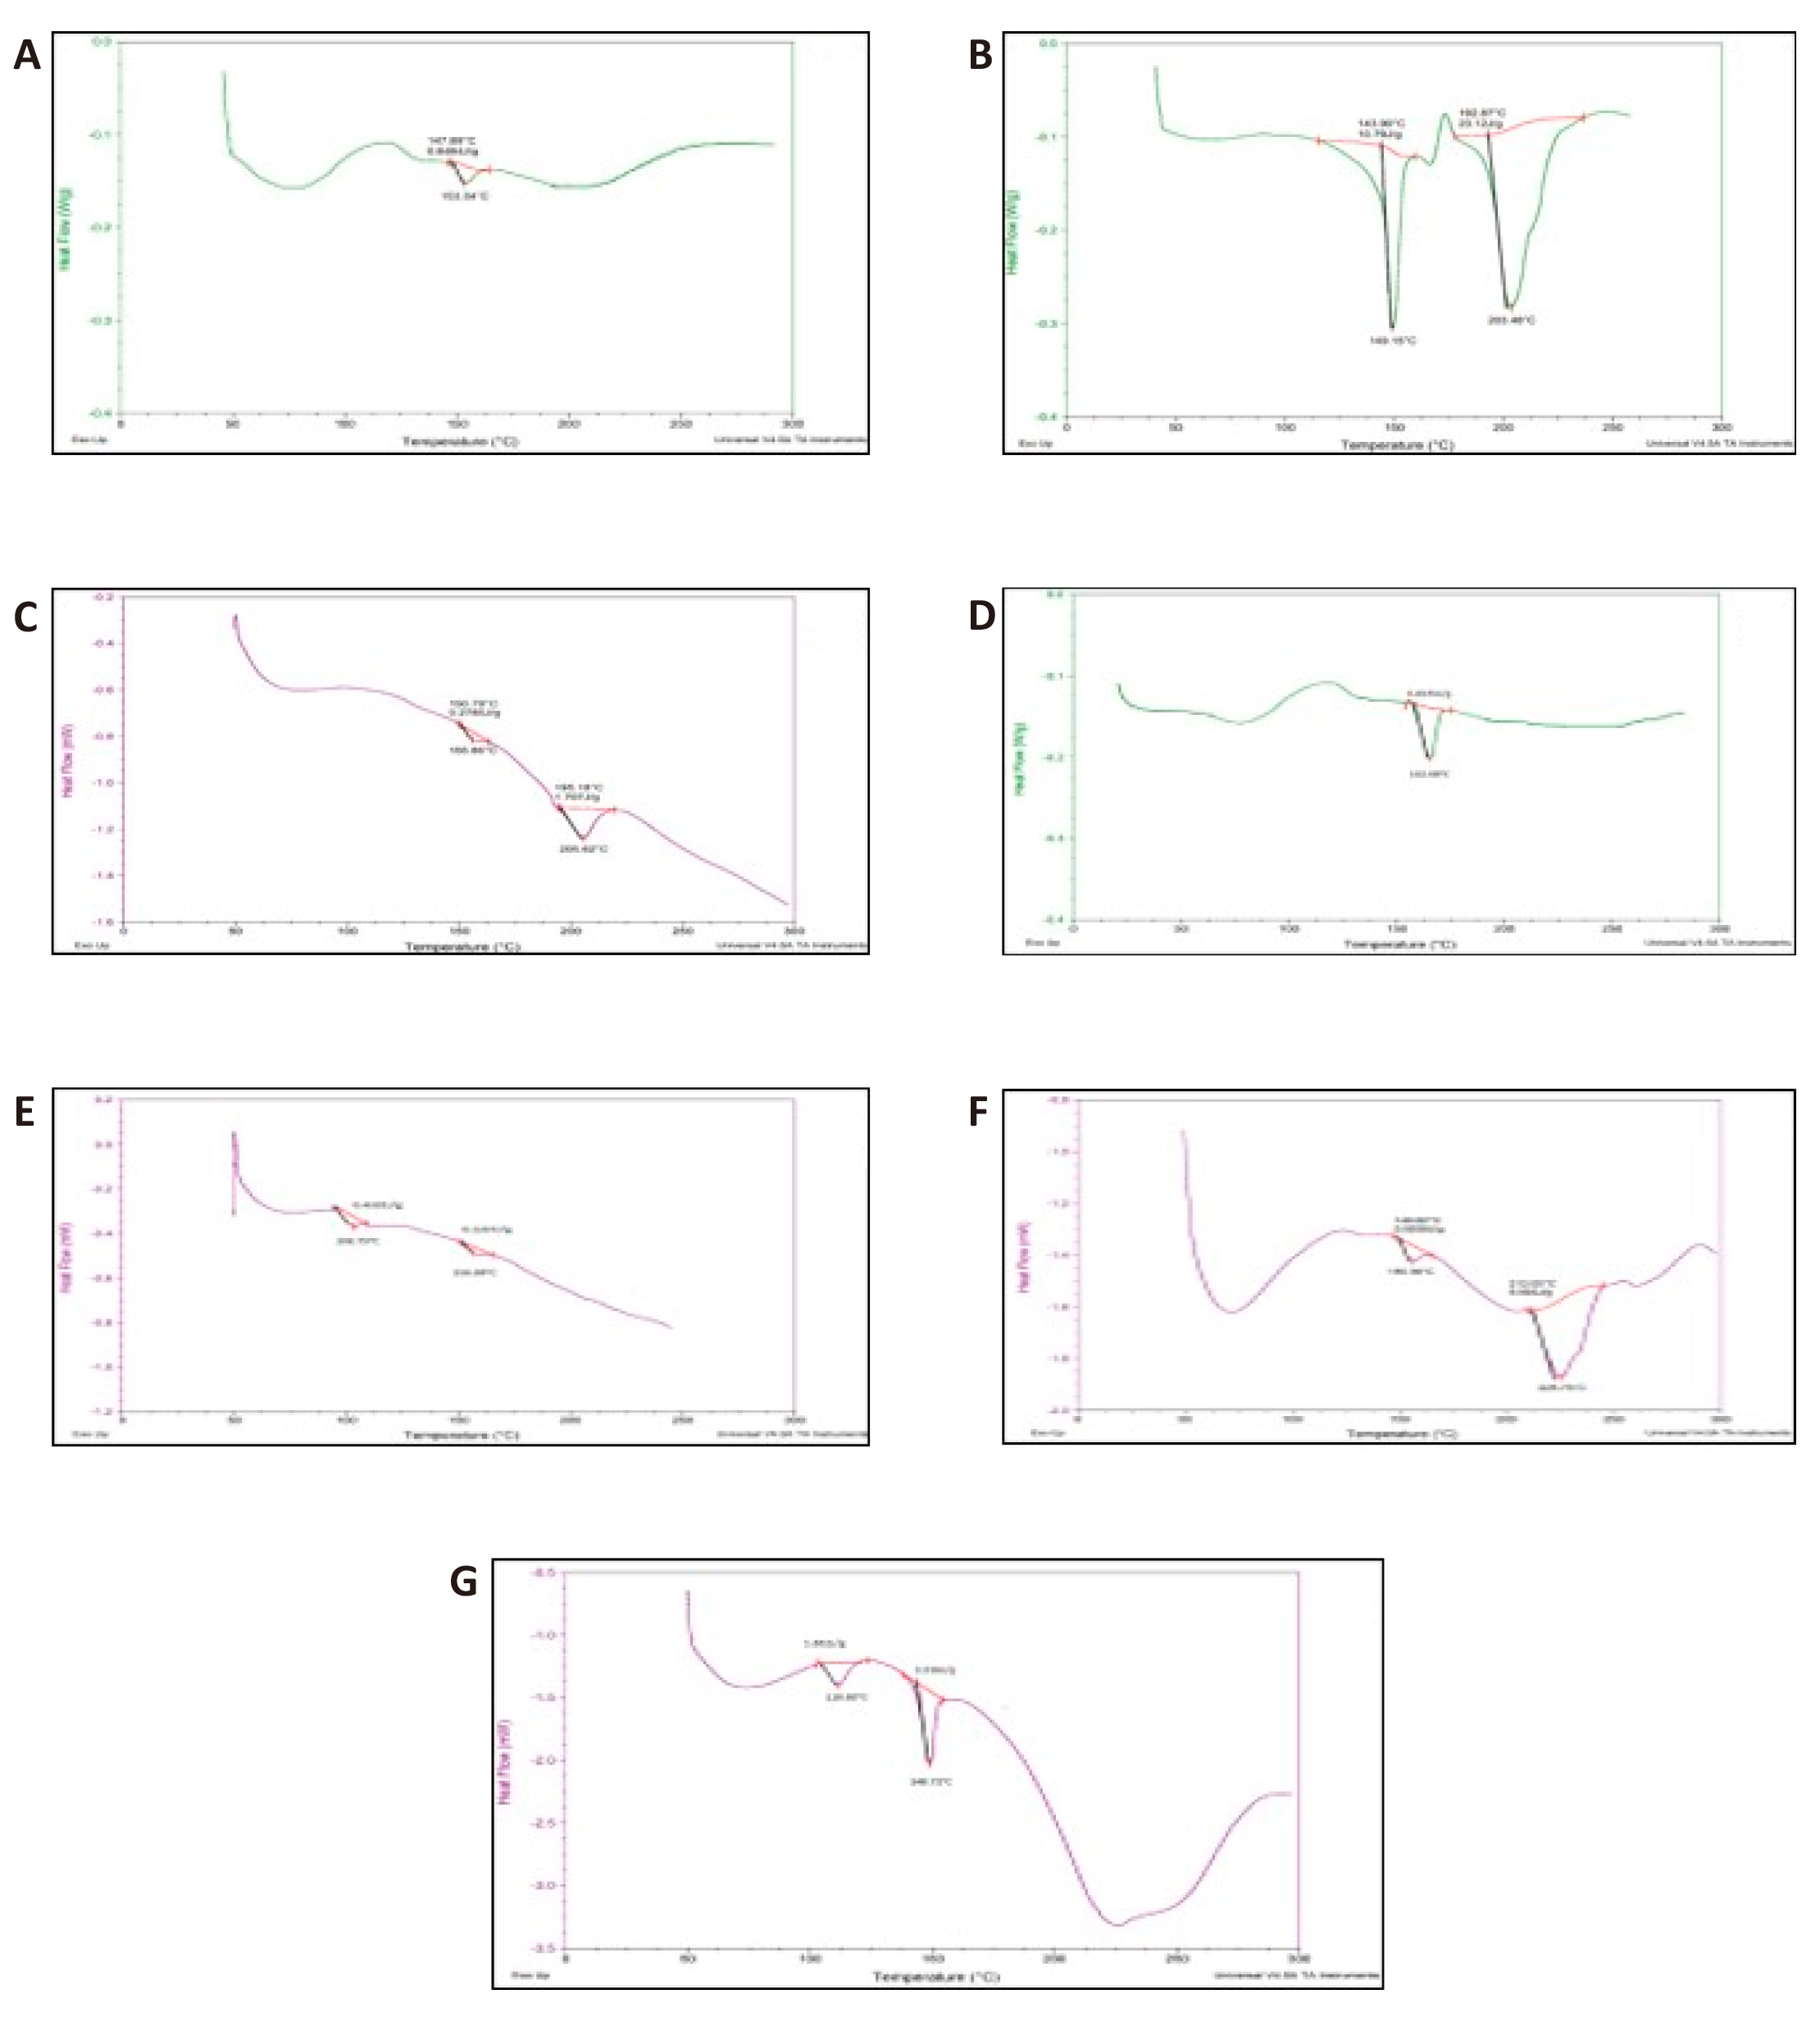
Figure 7. DSC Thermograms of Rosuvastatin calcium (A); Physical Mixtures of Rosuvastatin calcium and lactose (B); Physical Mixtures of Rosuvastatin calcium and MCC (C); Physical Mixtures of Rosuvastatin calcium and Talc (D); Physical Mixtures of Rosuvastatin calcium and Dicalcium Phosphate (E); Physical Mixtures of Rosuvastatin calcium and Mannitol (F); Physical Mixtures of Rosuvastatin calcium and Magnesium Stearate (G).
3.3.1.5 TLC Study
The results showed that the Rf values of physical combinations containing various excipients, such as lactose, MCC, talc, starch, Carbopol, and DP, and rosuvastatin calcium, were 0.84.
3.3.1.6 In-Vitro Drug Release for Physical Mixtures of Rosuvastatin Calcium with Different Excipients
Figure 8 depicts the dissolving behavior of rosuvastatin calcium for physical combinations with various excipients.
|
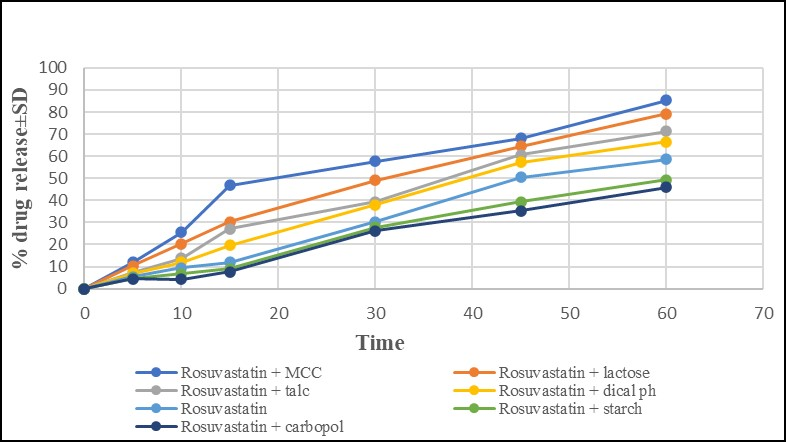
Figure 8. In-Vitro dissolution study for rosuvastatin calcium and physical mixtures of drug and excipients.
3.3.1.7 Molecular Docking Study
An established in-silico technique for identifying drug interactions at the molecular level is called “molecular docking”[19,20]. Table 7 provided each complex's docking score and hydrogen bond count, while Figure 9 showed the 3D position of the molecules in the docked complexes.
Table 7. Docking Score and No. of H-Bonds
Sr. No |
Drug+Excipient |
Docking score |
No. of H-Bond |
1 |
Rosuvastatin calcium+lactose |
-2.1 |
2 |
2 |
Rosuvastatin calcium+DP |
-2.2 |
2 |
3 |
Rosuvastatin calcium+MCC |
-2.1 |
2 |
4 |
Rosuvastatin calcium+carbopol |
-2.8 |
3 |
5 |
Rosuvastatin calcium+starch |
-2.5 |
3 |
6 |
Rosuvastatin calcium+talc |
-2.2 |
2 |
|
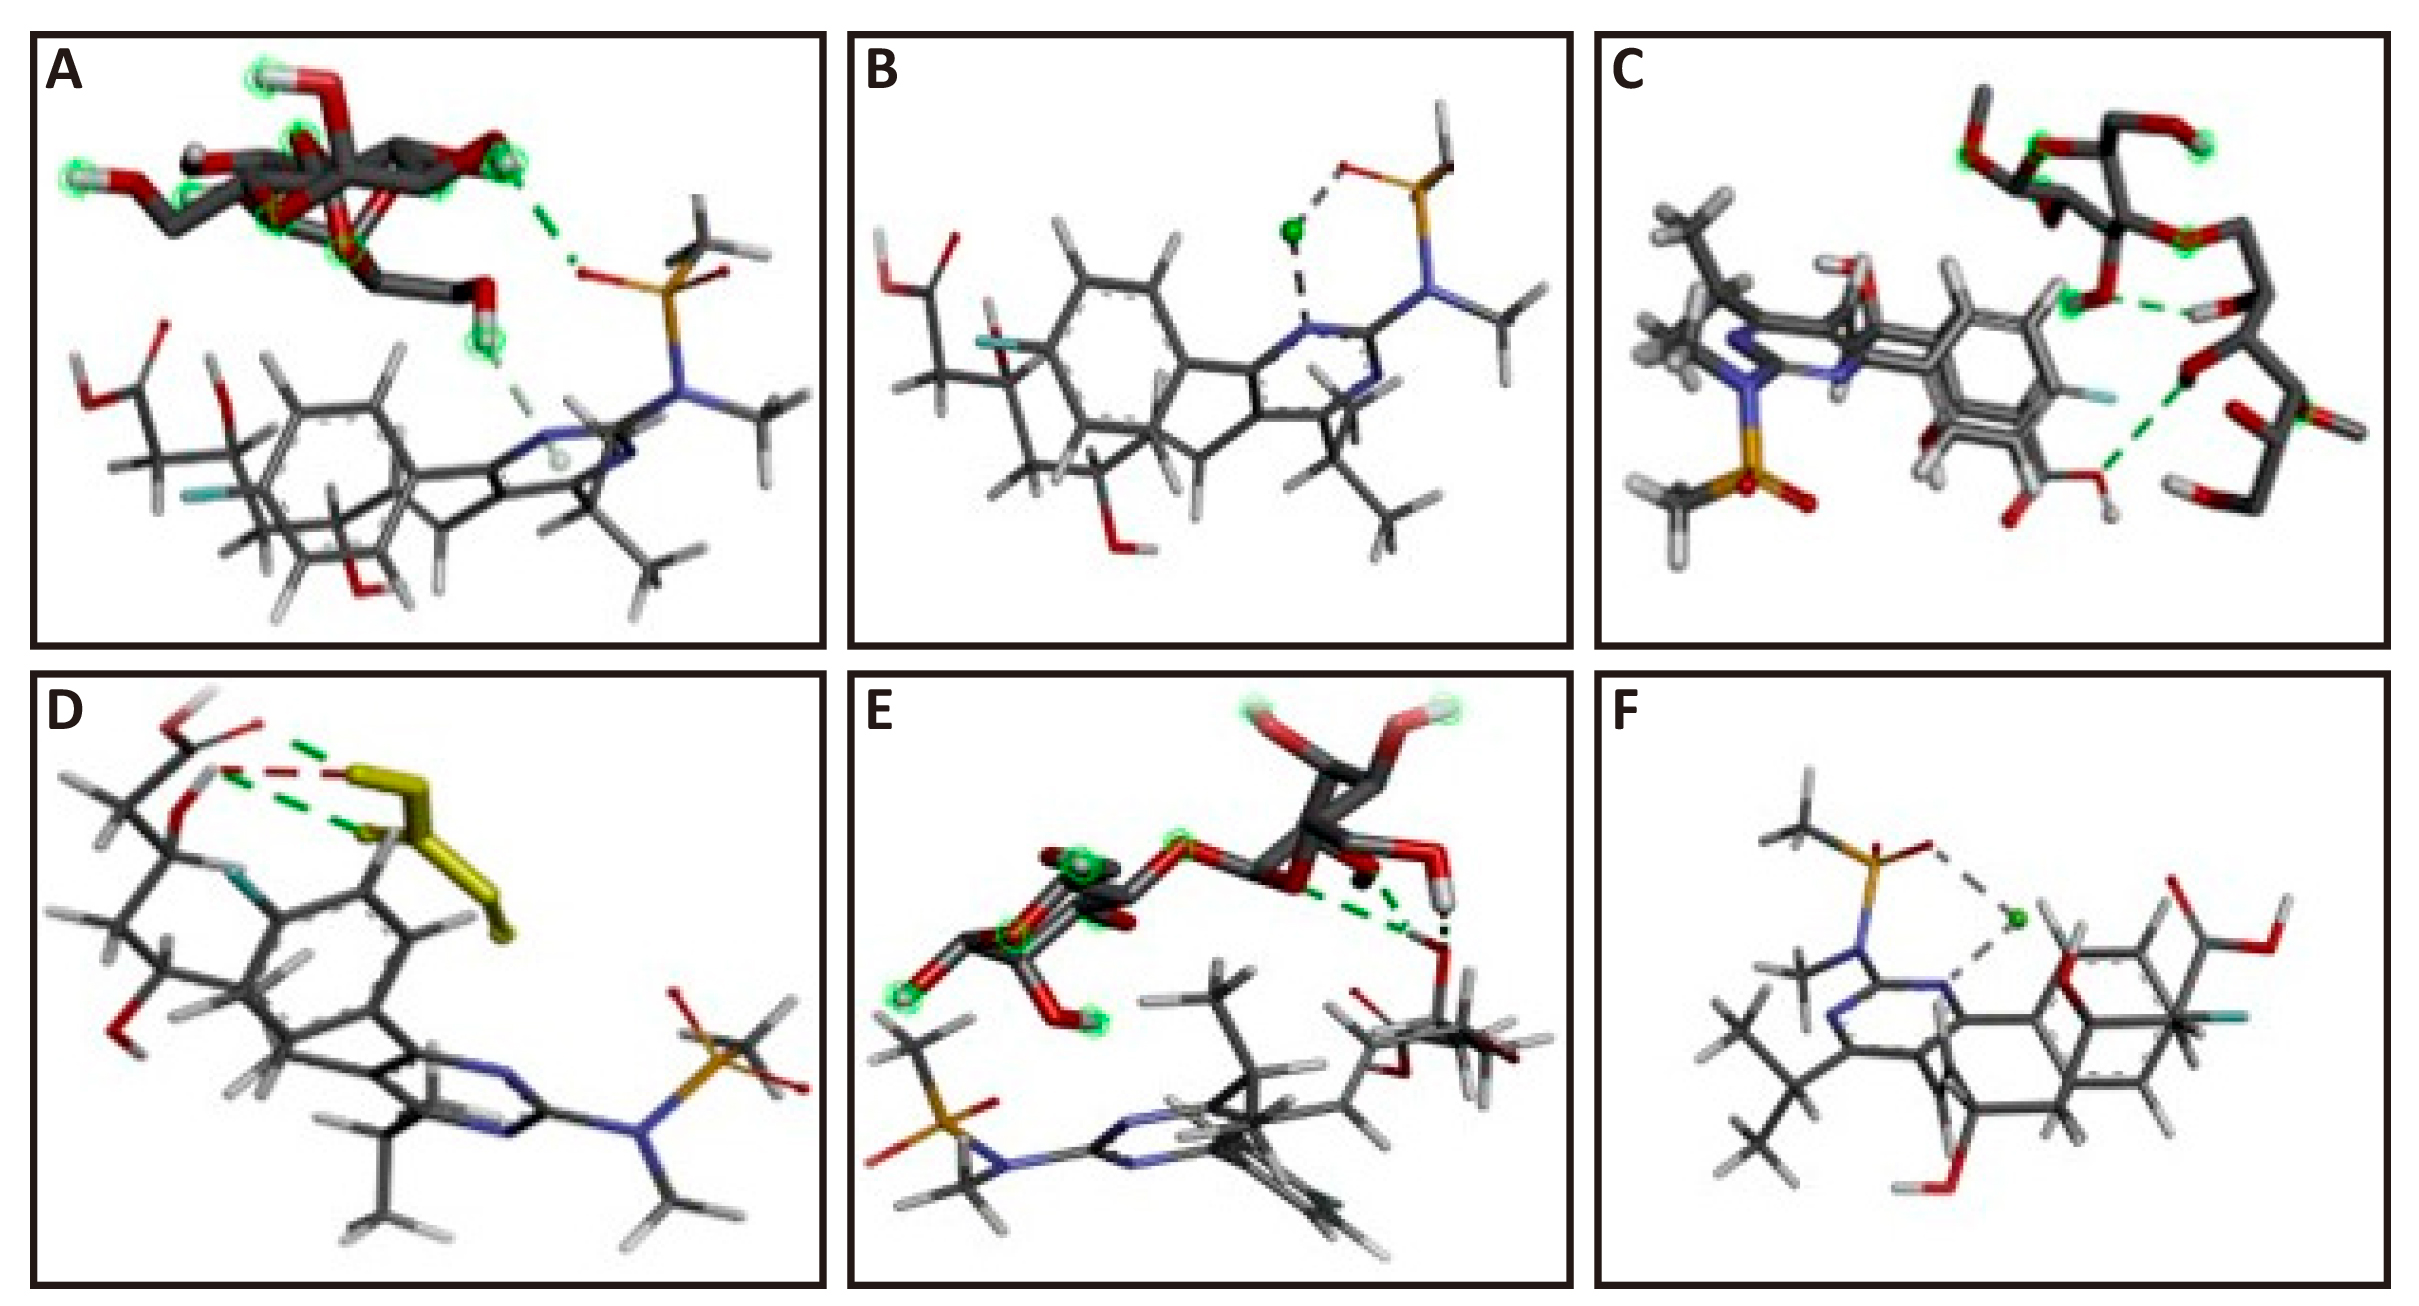
Figure 9. Docked pose of rosuvastatin calcium. A: -Anhydrous lactose complex; B: -DP complex; C: -MCC complex; D: -Carbopol complex; E: -Starch complex; F: -Talc complex.
3.4 Formulation Development of Conventional Tablet for Rosuvastatin Calcium
3.4.1 Post - Compression Study
3.4.1.1 Appearance
Examination of tablets of each batch were found in whitish color and flat circular shape with no cracks.
3.4.1.2 Thickness Test
Using a dial caliper, the thickness of each formulation's tablet was measured by selecting three tablets at random. The mean values of the thickness of tablets were found to be 2.2mm, 1.96mm, 2.04mm, and 1.8mm for batches 1, 2, 3 and 4, respectively.
The hardness of tablets of each formulation were measured using Monsanto hardness tester by picking three tablets randomly and the mean values was found to be 3.0kg/cm2, 3.4kg/cm2, 3.1kg/cm2 and 3.2kg/cm2 for batches 1, 2, 3 and 4, respectively.
3.4.1.3 Disintegration Profile for Rosuvastatin Calcium Oral Formulation
Disintegration study for batches 1, 2, 3 and 4 were done by random selection of tablets from each batch and disintegration times for batches 1, 2, 3 and 4 were found to be 3, 4, 4 and 5min, respectively.
3.4.1.4 In Vitro Dissolution Studies of Formulated Tablet
In addition, an in vitro drug release investigation was conducted using phosphate buffer (pH 6.8). Utilizing the paddle method of the USP Dissolve Testing Apparatus-2, %drug release of prepared batches was ascertained (Lab India). 900cc of phosphate buffer (pH 6.8) was used for the dissolving test, which was conducted at 37°C±0.05 and 50rpm. At certain intervals, a sample of the solution was taken out of the dissolving equipment and replaced with brand-new dissolving media. After the samples were filtered, a double beam UV spectrophotometer (UV-3200, Lab India) was used to measure the absorbances of the samples at 250nm. A drug release percentage was computed. In-vitro dissolution studies for the formulations of batches 1, 2, 3 and 4 were carried out. The comparative dissolution graphs were plotted and analyzed (Figure 10).
|
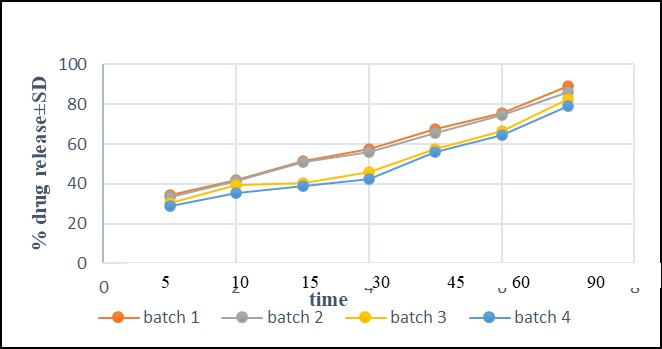
Figure 10. Dissolution profile of rosuvastatin calcium tablet.
4 DISCUSSION
4.1 Characterization of Rosuvastatin Calcium (Pure Drug)
The key objective for characterization of rosuvastatin Calcium is to determine identity, purity, and characteristic of the drug. Different analytical techniques such as UV-visible spectroscopy, NMR, FTIR, and DSC are utilized to identify and determine the purity of rosuvastatin calcium.
4.1.1 Physical Identification of Drug
Color of rosuvastatin calcium is white and nature is crystalline.
4.1.2 Characterization of Rosuvastatin Calcium by UV Spectroscopy
The absorption maximum (λmax) of rosuvastatin calcium was determined by scanning from 400-200nm in methanol and it was found to be 250nm.
4.1.3 Melting Point
Melting point of rosuvastatin calcium was determined utilizing Veego melting point apparatus. Melting point of rosuvastatin calcium was observed to be 175-176℃. Reported melting point of rosuvastatin calcium is 173-185℃.
4.1.4 Characterization of Rosuvastatin Calcium by FTIR Spectrophotometry
Using the KBr pellet technique, the FTIR spectra of pure rosuvastatin calcium were obtained on an IR Spectrophotometer (Spectrum RX 1, Perkin Elmer, U.K.). The 4000-400cm-1 scanning range was used. The interpretation of the peaks served to validate the structure. The rosuvastatin calcium exhibited absorption peaks in its FTIR spectra at 3302 (O-H), 2968 (C-H), 1541 (C=N), 1229 (C=O), and 1075 (S=O) (Figure 1). These absorption peaks of drug are consistent with those found in previous literature report.
4.1.5 Characterization of Rosuvastatin Calcium by NMR Spectroscopy
Using the 1H NMR technique, the hydrogen content and its location were determined. Using a Bruker Avance Neo 500 NMR spectrophotometer, 1H NMR was conducted. A tiny quantity of sample was placed in the sample holder after being dissolved in DMSOd6 in a small glass vial. The 1H NMR of rosuvastatin calcium revealed signals with distinctive values of chemical shift (δ) such as 1.26 (CH3), 1.32 (CH), 1.50 (CH-CH2), 2.01 (CH2), 2.16 (CH2), 3.44 (CH3), 3.54 (CH3), 3.56 (OH), 3.77 (CH3), 4.21 (OH), 5.53 (CH-CH), 6.52 (CH=CH) (Figure 2) and all the signals are matched with the reported signals of rosuvastatin calcium.
4.1.6 Characterization of Rosuvastatin Calcium by DSC Study
The DSC aluminum pan was filled with 2.0mg of sample and sealed. It was heated between 20 and 30℃ under a nitrogen flow at a scanning rate of 10℃ per minute. As a reference, an empty aluminum pan was set in place. The thermogram was taken. The thermogram of drug showed endothermic peak at 153.34℃ (Figure 3), which is almost exactly reported in the literature.
4.2 Analytical Method Development
4.2.1 Method Development and Validation by UV-Visible Spectroscopy
The absorbance of solution was recorded at 250nm on UV-Visible spectroscopy and a calibration curve was designed (Figure 4). The value of correlation coefficient, R2 was found above 0.99 suggesting a good linearity of the calibration curve.
4.2.2 Calibration Curve of Rosuvastatin Calcium
Rosuvastatin calcium calibration curves in methanol and phosphate buffer were plated and are shown in Figure 4.
4.2.3 Linearity
Absorbances of different concentrations were plotted against the concentrations to obtain the calibration curve. Calibration curves of absorbances versus concentrations were founded to be linear in a range of 2.5-25μg/mL in methanol and 6.8 phosphate buffer solution as illustrated in Figure 4. The regression equations in methanol and phosphate buffer were y = 0.0436x and y = 0.06x respectively, where y denoted absorbance and x denoted concentration inμg/mL and regressions were found to be R2 = 0.999 in methanol and R² = 0.988 in 6.8 phosphate buffer solution.
4.2.4 Range
The linearity study was used to control the range of method, which offered a reputable level of precision and linearity. The range was found to be 2.5-25μg/mL.
4.2.5 Interday and Intraday Precisions
Precision is defined as the proximity of two or more measurements to one another. Table 4 demonstrated the mean absorbance, standard deviation, and relative standard deviation for three concentrations (2.5, 10, and 25μg/mL). For intraday precision, %RSD values were measured between 0.52 and 1.60%; whereas for interday precision, %RSD values were measured between 0.64 and 1.89%. These values validated the precision because they were within the allowable limit, which is ≥ 2%.
4.3 Preformulation Studies
4.3.1 Drug-Excipients Compatibility Studies
Drug-excipient compatibility study is essential part of preformulation stage for the creation of new drug. Physical mixture of drug and excipient (1:1) were arranged and compatibility studies were carried out using DSC, NMR and FTIR Spectroscopy to examine any sign of incompatibility.
4.3.1.1 Visual Observation
There was no color change or lump formation in any of the drug-excipient mixtures room temperature and humidity conditions. These data led to the conclusion that the medication and the excipients utilized in the experimental investigation were compatible.
4.3.1.2 Compatibility Study of Rosuvastatin Calcium Using FTIR Spectroscopy
In Table 5 and Figure 5, the combination of rosuvastatin and excipients showed distinctive absorption bands of rosuvastatin calcium in the FTIR spectrum. The absorption peaks at 3302 (OH), 2968 (CH Stretch), 1541 (C=N), 1229 (C=O), and 1075 (S=O) were the characteristics of the pure rosuvastatin calcium. Table 5 and Figure 5 were used to compare the distinctive absorption bands of rosuvastatin calcium in the physical combinations of rosuvastatin and excipients. The FTIR spectra of the physical mixture of MCC, lactose, carbopol, talc, DP, and starch, kept the distinctive bands of the functional groups of pure rosuvastatin, indicating that there were no incompatibilities between the drug and physical mixtures of the drug with excipients. According to the FTIR data, rosuvastatin calcium was shown to be compatible with all of the excipients that were employed, including talc, MCC, lactose, and DP.
4.3.1.3 Compatibility Studies of Rosuvastatin Calcium Using 1H NMR Spectroscopy
1H NMR has been used in several investigations to describe interactions between drugs and excipients. The comparison of the rosuvastatin calcium and physical combinations' chemical shifts were illustrated in the Table 6 and Figure 6. The most important signals for rosuvastatin calcium were 1.26 (CH3), 1.32 (CH), 1.50 (CH-CH2), 2.01(CH2), 2.16 (CH2), 3.44 (CH3), 3.54 (CH3), 3.56 (OH), 3.77 (CH3), 4.21 (OH), 5.53 (CH-CH) and 6.52 (CH=CH) and these peaks were compared from Table 6 and it was noted that in the spectra of the physical mixture of rosuvastatin calcium and excipients such as MCC, lactose, DP, carbopol, starch, and talc, all of the peaks of the physical combination with drugs and excipients were present almost at the same place. There was no discernible chemical shift shifting, indicating that the medication and excipient did not interact as suggested. Rosuvastatin calcium was therefore expected to be compatible with all of the excipients that were employed, including talc, lactose, carbopol, lactose, and MCC.
4.3.1.4 Compatibility Studies of Rosuvastatin Calcium Using DSC
DSC thermograms of pure drug and physical mixture of drug with excipients were given below in the Figure 7. The DSC thermogram of pure rosuvastatin calcium displayed an endothermic peak at 153.34℃ (Figure 7A). DSC thermogram of physical mixtures of rosuvastatin calcium with anhydrous lactose reflected endothermic peaks at 149.15℃ and 203.46℃. Comparing both thermograms of rosuvastatin calcium and lactose, it was observed that the peaks corresponding to pure rosuvastatin calcium and anhydrous lactose were retained with slight modification which showed that that lactose and rosuvastatin calcium did not interact chemically (Figure 7B). Additionally, endothermic peaks at 155.86 and 205.62℃ were revealed in the DSC thermogram of the physical mixture of rosuvastatin calcium with MCC. When the two thermograms were compared, it was discovered that the peak representing pure calcium rosuvastatin was kept, albeit slightly altered, indicating that the medicine and excipient were chemically compatible (Figure 7C). The physical mixing of talc and rosuvastatin calcium produced an endothermic peak at 162.68℃ on the DSC thermogram. There was no discernible chemical interaction between rosuvastatin calcium and talc, as shown by the fact that the peak corresponding to pure rosuvastatin calcium was identified at the same position with a small alteration (Figure 7D). Endothermic peaks were visible in the DSC thermogram of physical mixes of calcium rosuvastatin and DP at 156.69 and 108.75℃. We compared both thermograms, and founded that the peak corresponding to pure rosuvastatin calcium was reserved with slight variation which disclosed that there was no chemical incompatibility between rosuvastatin calcium and DP (Figure 7E). Furthermore, DSC thermogram of physical mixture of rosuvastatin calcium with starch was recorded and endothermic peaks were observed at 155.39℃ and 225.73℃. On comparison of both thermograms, the corresponding peak to pure rosuvastatin calcium was observed with slight change which displayed that there was no chemical interaction between rosuvastatin calcium and starch (Figure 7F). The DSC thermogram of physical mixture of rosuvastatin calcium with carbopol was studied and endothermic peaks were observed at 148.71℃ and 110.65℃. These observations showed that there was compatibility between rosuvastatin calcium and carbopol since peak of rosuvastatin calcium was retained with slight modification (Figure 7G).
4.3.1.5 TLC Study
The materials' movement along the plate was measured by the Rf value. The distance traveled by the substance divided by the solvent's travel distance is known as Rf. The results showed that the Rf values of physical combinations containing various excipients, such as lactose, carbopol, MCC, starch, talc, and DP, and rosuvastatin calcium, were 0.84. All physical mixes with various excipients were visible at the same position as the rosuvastatin calcium spot. Based on Rf values, it was determined that there was no interaction occurring between the physical mixes of various excipients and rosuvastatin calcium.
4.3.1.6 In-Vitro Drug Release for Physical Mixtures of Rosuvastatin Calcium with Different Excipients
Figure 8 depicts the dissolving behavior of rosuvastatin calcium for physical combinations with various excipients. For various excipients, rosuvastatin calcium medication release was detected in a distinct way. The amount of medication released grew together with the passage of time. It was discovered that not all excipients had the same amount of drug release at 15mini.e., physical mixture of drug with MCC showed maximum drug release (46%) while %drug releases for physical mixtures with lactose, talc, DP, starch and carbopol were found to be 30%, 27%, 19%, 8% and 7%, respectively. Physical mixture of rosuvastatin calcium with MCC showed maximum amount of drug release i.e. 85% in 60min. Lactose also showed high drug release of 80% in 60min. owing to its hydrophilic nature. On the other hand, physical mixture of rosuvastatin calcium with carbopol displayed only 45% drug release in 60min.
4.3.1.7 Molecular Docking Study
An established in-silico technique for identifying drug interactions at the molecular level is called “molecular docking”[19,20]. To determine potential interactions between various excipients and rosuvastatin calcium, docking experiments of the medication were conducted. The lowest energy conformations are also shown by the docking study. Docking was done with rosuvastatin calcium molecule with various excipients like MCC, anhydrous lactose, starch, DP, talc and carbopol. Docking results were compared and it was found that highest energy (-2.2) conformer i.e., complexes of rosuvastatin calcium with MCC and lactose showed minimum interactions with each other. Further, it was also observed that complex of rosuvastatin calcium with carbapol has lowest energy conformer (-2.8) that is more stable conformer. From docking study, we observed two hydrogen bonding interactions of rosuvastatin calcium with mcc, lactose, DP and talc. We compared docking score of rosuvastatin calcium with mcc and lactose (-2.1) and docking score of rosuvastatin calcium with DP and talc (-2.2). These docking score demonstrated that DP and talc were interacted more strongly in comparison with mcc, lactose. Docking score and number of hydrogen bonds for the interaction of rosuvastatin calcium with carbapol and starch were -2.8 and -2.5 and number of hydrogen bonds (3 for both), respectively. Carbolpol has bonding score -2.8 which showed that carbapol has stronger interaction with raosuvastatin calcium in compression to starch. The docking score and number of hydrogen bond of each complex were given in the Table 7 and the 3D pose of docked complexes molecules were also mentioned in the Figure 9.
4.4 Formulation Development of Conventional Tablet for Rosuvastatin Calcium
4.4.1 Post - Compression Study
4.4.1.1 Appearance
Examination of tablets of each batch were found in whitish color and flat circular shape with no cracks.
4.4.1.2 Thickness Test
By selecting the three tablets at random, the thickness of each formulation's tablet was measured with a dial caliper. The mean values of the thickness of tablets were found to be 2.2mm, 1.96mm, 2.04mm, and 1.8mm for batches 1, 2, 3 and 4, respectively.
The hardness of tablets of each formulation were measured using Monsanto hardness tester by picking three tablets randomly and the mean values was found to be 3.0kg/cm2, 3.4kg/cm2, 3.1kg/cm2 and 3.2kg/cm2 for batches 1, 2, 3 and 4, respectively.
4.4.1.3 Disintegration Profile for Rosuvastatin Calcium Oral Formulation
Disintegration study for batches 1, 2, 3 and 4 were done by random selection of tablets from each batch and disintegration times for batches 1, 2, 3 and 4 were found to be 3, 4, 4 and 5min, respectively.
4.4.1.4 In Vitro Dissolution Studies of Formulated Tablet
In addition, an in vitro drug release investigation was conducted using phosphate buffer (pH 6.8). Utilizing the paddle method of the USP 2 (Dissolve Testing Apparatus), %drug release of prepared batches was ascertained. 900mL of phosphate buffer (pH 6.8) was used for the dissolving test, which was conducted at 37°C ± 0.05 and 50rpm. At certain intervals, a sample of the solution was taken out of the dissolving equipment and replaced with brand-new dissolving media. After the samples were filtered, a double beam UV spectrophotometer (UV-3200, Lab India) was used to measure the absorbances of the samples at 250nm. A drug release percentage was computed. In-vitro dissolution studies for the formulations of batches 1, 2, 3 and 4 were carried out. The comparative dissolution graphs were plotted and analyzed. The amount of %drug release in 15min for all batches was found to be quite similar i.e., batch 1 showed 51 %, batch 2 showed 50%, batch 3 showed 40% and batch 4 showed 38% drug release. %Drug release increased with increase of time. At 90min, the amount of drug released for batches 1, 2, 3 and 4 were found to be 89%, 85%, 82% and 78%, respectively and batch 1 showed maximum amount of drug release due to presence of MCC. All the four batches should be required %drug release and parameters of excipients showed variation effect in 30min (Figure 10).
5 CONCLUSION
The compatibility studies of physical mixtures of rosuvastatin calcium with different used excipient such as DP, MCC, lactose, talc, starch and carbopol were investigated by IR and NMR and it was detected that there was no variation or minor deviation in the characteristic peaks in IR spectroscopy and NMR signals. Further, DSC of physical mixtures of drug with used excipients were done and compared. Based on DSC study, it was concluded that rosuvastatin calcium was compatible with all used excipients in this study. The drug dissolution behavior of drug was observed. Physical mixture of MCC with drug presented maximum quantity of drug release in shorter period. Docking studies are executed to find the possible interaction between drug molecule and excipient. All above study indicated that both drug and excipients were compatible with each other. Formulation of conventional tablets of rosuvastatin calcium with compatible excipients were done. It is anticipated that conventional tablets will disintegrate quickly and dissolve quickly in the digestive system. Disintegration time for batches 1, 2, 3 and 4 were found to be 3min, 4min, 4min and 5min, respectively. % Drug release for batches 1, 2, 3 and 4 were 89%, 85%, 82% and 79% at 90min, respectively. From the above study, it could be concluded that batch 1 showed maximum drug release and minimum disintegration time.
Acknowledgements
The study was financially supported by the UGC and supported by the DST-FIST Lab, University Institute of Pharmaceutical Sciences, Panjab University, Chandigarh for allowing them to use its facility.
Conflicts of Interest
The authors declared there is no conflict.
Author Contribution
Pawar PA was responsible for methodology, Sinha VR was responsible for planning, Yadav AK was responsible for supervision. All authors read and approved the final manuscript.
Abbreviation List
API, Active pharmaceutical ingredient
DP, Dicalcium phosphate
DSC, Differential scanning calorimetry
FTIR, Fourier transform infrared spectroscopy
MCC, Microcrystalline cellulose
NMR, Nuclear magnetic resonance
TLC, Thin layer chromatography
References
[1] Patel PA, Ahir K, Patel VB et al. Drug-Excipient compatibility studies: First step for dosage form development. Pharm Innov, 2015; 4: 14-20.
[2] Chadha R, Bhandari S. Drug-excipient compatibility screening-role of thermoanalytical and spectroscopic techniques. J Pharmaceut Biomed, 2014; 87: 82-97.[DOI]
[3] Narang AS, Boddu SH. (eds) Excipient Applications in Formulation Design and Drug Delivery. Springer International Publishing. 2015.
[4] Patel R, Barker J, ElShaer A. Pharmaceutical Excipients and Drug Metabolism: A Mini-Review. Int J Mol Sci, 2020; 21.[DOI]
[5] Panakanti R, Narang AS. Impact of excipient interactions on drug bioavailability from solid dosage forms. Pharm Res-Dordr, 2012; 29: 2639-2659.[DOI]
[6] Murillo-Fernández MA, Montero-Zeledón E, Abdala-Saiz A et al. Interaction and Compatibility Studies in the Development of Olmesartan Medoxomil and Hydrochlorothiazide Formulations under a Real Manufacturing Process. Pharmaceut, 2022; 14: 424.[DOI]
[7] da Silveiraa LM, Fiorota AB, Xaviera TP et al. Drug-excipient compatibility assessment of solid formulations containing meloxicam. Eur J Pharm Sci, 2018; 112: 146-151.[DOI]
[8] Cortese F, Gesualdo M, Cortese A et al. Rosuvastatin: Beyond the cholesterol-lowering effect. Pharm Res-Dordr, 2016; 107: 1-18.[DOI]
[9] McTaggart F. Comparative pharmacology of rosuvastatin. Atherosclerosis Supp, 2003; 4: 9-14.[DOI]
[10] Fathima N, Qureshi HK, Anitha N et al. Drug-excipient interaction and its importance in dosage form development. J Appl Pharmaceut Sci, 2011; 1: 66-71
[11] Bele AA, Khale A. An overview on thin layer chromatography. Int J Pharm Pharm Sci, 2011.[DOI]
[12] Mishra A, Sinha VR, Sharma S et al. Molecular and Qualitative Characterization of Compatibility Between Valacyclovir Hydrochloride and Excipients as Raw Materials for Development of Solid Oral Dosage Formulation. Am J Biopharmacy Pharm Sci, 2023.[DOI]
[13] Mishra A, Sinha VR, Sharma S et al. A Comprehensive Compatibility Studies of Ganciclovir with Some Common Excipients. Am J Biopharmacy Pharm Sci, 2023; 3: 8.[DOI]
[14] Volpati D, Aoki PHB, Alessio P et al. Vibrational spectroscopy for probing molecular-level interactions in organic films mimicking biointerfaces. Adv Colloid Interfac, 2014; 207: 199-215.[DOI]
[15] Berthomieu C, Hienerwadel R. Fourier transform infrared (FTIR) spectroscopy. Photosynth Res, 2009; 101: 157-170.[DOI]
[16] Krishna BJ, Satyanarayana J, Rao NR. Rivaroxaban: Compatibility with Pharmaceutical Excipients using DSC and FTIR Spectrophotometry. J Pharm Res Int, 2022; 43-50.[DOI]
[17] Bramham JE, Podmore A, Davies SA et al. Comprehensive Assessment of Protein and Excipient Stability in Biopharmaceutical Formulations Using 1H NMR Spectroscopy. ACS Pharmacol Transl, 2021; 4: 288-295.[DOI]
[18] Geiss F. Fundamentals of thin layer chromatography: Planar chromatography. 1987. Available at:[Web]
[19] Wall PE. Thin-layer chromatography: a modern practical approach. Royal Society of Chemistry, 2007.
[20] Bele AA, Khale A. An overview on thin layer chromatography. Int J Pharm Pharm Sci, 2011; 6: 256-267.[DOI]
[21] Pinzi L, Rastelli G. Molecular Docking: Shifting Paradigms in Drug Discovery. Int J Mol Sci, 2019; 20: 4331.[DOI]
[22] Morris GM, Lim-Wilby M. Molecular docking. Methods Mol Bio, 2008; 443: 365-382.[DOI]
[23] Iqubal MK, Singh PK, Shuaib M et al. Recent advances in direct compression technique for pharmaceutical tablet formulation. Int J Pharm Res Develop, 2014; 6: 49-57.[DOI]
[24] Chavan H, Chhabra G, Gujarathi N et al. Comparative study of In-process and finished products quality control test for tablet and capsules according to pharmacopoeias. Asian J Pharm Res Develop, 2018; 6: 60-68.[DOI]
[25] Bozal-Palabiyik B, Uslu B, Ozkan Y et al. In-Vitro Drug Dissolution Studies in Medicinal Compounds. Curr Med Chem, 2018; 25: 4020-4036.[DOI]
Copyright © 2024 The Author(s). This open-access article is licensed under a Creative Commons Attribution 4.0 International License (https://creativecommons.org/licenses/by/4.0), which permits unrestricted use, sharing, adaptation, distribution, and reproduction in any medium, provided the original work is properly cited.


