Bidirectional Causal Relationship between Inflammatory Cytokines and Benign Prostatic Hyperplasia
Zechao Zhang1#*, Shuping Huang1#, Yu Chen1#, Min Zhu1*
1Ruikang Hospital Affiliated to Guangxi University of Chinese Medicine, Nanning, Guangxi Zhuang Autonomous Region, China
#These authors contributed equally to this manuscript.
*Correspondence to: Zechao Zhang, MD, Lecturer, Ruikang Hospital Affiliated to Guangxi University of Chinese Medicine, No. 10 Huadong Road, Nanning, 530001, Guangxi Zhuang Autonomous Region, China; Email: edwardbangong@163.com;
Min Zhu, MD, Professor, Ruikang Hospital Affiliated to Guangxi University of Chinese Medicine, No. 10 Huadong Road, Nanning, 530001, Guangxi Zhuang Autonomous Region, China; Email: chao616317728@foxmail.com
Abstract
Objective: This study aimed to establish a genetic correlation between inflammatory cytokines (IC) and benign prostatic hyperplasia (BPH) to present an empirical reference for BPH treatment.
Methods: Single nucleotide polymorphism (SNP) data were derived from two genome-wide association studies of IC and BPH. Forward Mendelian randomization (MR) analysis was carried out by the inverse variance weighting method with IC-related SNPs as the instrumental variable and BPH as the outcome, while the reverse MR analysis used BPH-related SNPs as the instrumental variable and IC as the outcome.
Results: The results from forward MR analysis showed that there was no statistical differences between 51 ICs and BPH at the genetic level (P>0.05). Reverse MR analysis showed that BPH was significantly correlated with one type of IC at the genetic level (P<0.05), while the rest were no statistical differences (P>0.05).
Conclusion: There was no bidirectional relationship between IC and BPH at the genetic level, suggesting that genetic exposure of IC may have no effect on BPH.
Keywords: bidirectional Mendelian randomization, benign prostatic hyperplasia, inflammatory cytokines
1 INTRODUCTION
Benign prostatic hyperplasia (BPH) is a prevalent benign disease leading to urination disorder in middle-aged and elderly men, with an incidence rate of 50% in men over the age of 60[1]. Despite extensive research, the precise etiology of BPH remains elusive, with current theories suggesting the involvement of genetics, androgens, hormones, cytokines, chemokines, and stem cells. The number of patients receiving treatment for BPH-related lower urinary tract symptoms is steadily increasing, and the associated healthcare costs are escalating exponentially. However, effective treatments for BPH are still lacking[2,3]. Therefore, exploring the etiology and influencing factors of BPH is crucial for its treatment.
Chronic inflammation leading to tissue damage and the release of pro-inflammatory cytokines has been shown to play a significant role in the pathogenesis of BPH[4]. However, the role of inflammatory cytokines (IC) in BPH remains unclear. Several studies have explored the role of IC in BPH[5,6], but the effect of IC on BPH through genetic pathways remains unknown. This is where Mendelian randomization (MR) offers a new analytical method[7,8] to elucidate the relationship between BPH and IC. The MR method is employed in this study to investigate the relationship between BPH and IC, providing a new research direction for BPH treatment. The design of this study includes bidirectional MR to identify the potential association between IC and BPH.
2 METHODS
2.1 Study Design Description
Figure 1 presented brief steps of this bi-directional MR study between IC and BPH. The aggregated statistical data of genome-wide association studies (GWAS) were used for two MR analyses to identify the association between IC and BPH. In the forward MR analysis, IC was set as the exposure factor and BPH as the outcome. In the reverse MR, BPH was set as the exposure factor and IC as the outcome. The core MR assumptions are displayed in Figure 1. This study was based on a public database, so ethical approval is not required.
|
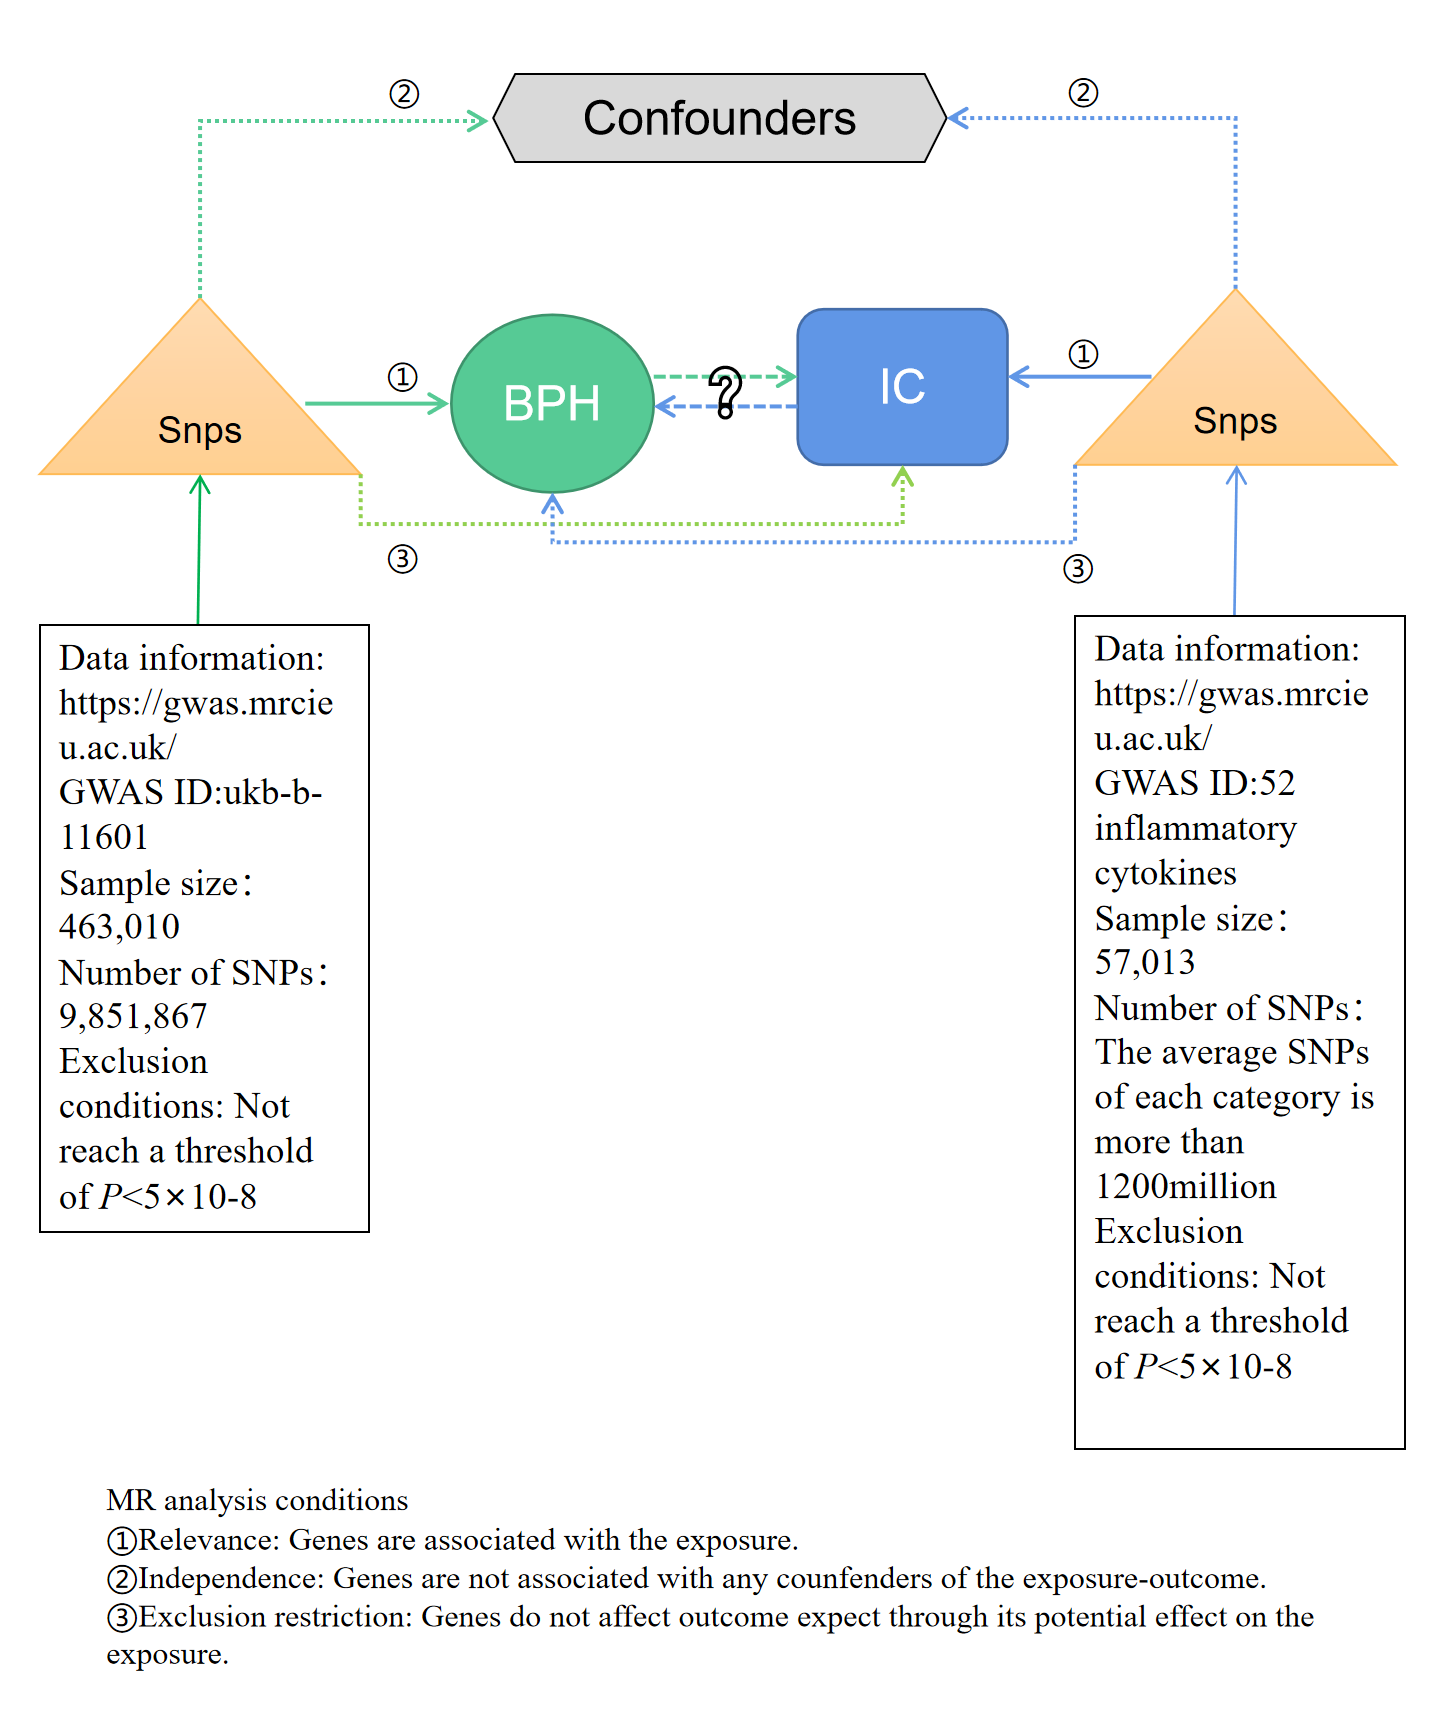
Figure 1. Flow chart of bidirectional MR study. MR analysis depends on three core assumptions ① ② ③. Blue represents positive MR analysis, IC is exposure, and BPH is the result. Green represents reverse MR analysis, BPH is exposure, and IC is the result. IC, inflammatory cytokines; BPH, benign prostatic hyperplasia; MR, Mendelian randomization; SNP, single nucleotide polymorphism.
2.2 MR Tool Variable Selection
The MR analysis tool variable was derived from two different GWAS summary results. Firstly, at the genome-wide significance threshold (P<5×10⁻⁸)[9]. Secondly, the independence between the selected single nucleotide polymorphism (SNP) was evaluated according to the paired linkage disequilibrium. When r2>0.001 (the aggregation window is 10,000kb), SNPs associated with multiple SNP and those associated with higher P will be deleted[10]. Linkage disequilibrium referred to the association of nonrandom between alleles of different locus. In short, as long as the two genes were not inherited completely independently, they would show some degree of linkage. r2: it was the data between 0 and 1. r2=1 meant that there was a complete linkage disequilibrium relationship between the two SNPs. r2=0 meant that there was a complete linkage equilibrium between the two SNPs, that is, the allocation of the two SNPs was completely random. Kb: the length of the linkage disequilibrium area. r2=0.00110000kb, which meant removing SNPs with r2 greater than 0.001 within 10,000kb. Thirdly, F-statistics were calculated to verify the strength of a SNP. When F-statistic was greater than 10, SNP was considered to be strong enough to mitigate the impact of potential bias.
2.3 Data Source and Tool Variable Selection of BPH
BPH data was sourced from MRC IEU UK Biobank GWAS pipeline version 2 (https://data.bris.ac.uk/data/dataset/pnoat8cxo0u52p6ynfaekeigi), including 463,010 participants. BPH was the primary diagnosis in these population data. This GWAS was used to identify SNPs related to BPH, which would be selected as IV (see supporting information Table 1).
Table 1. Forward MR IVW
IC |
Method |
Nsnp |
SE |
P |
Interleukin-17 |
Inverse variance weighted |
8 |
0.002935452 |
0.214101575 |
Interleukin-8 |
Inverse variance weighted |
8 |
0.003114947 |
0.397882909 |
Interleukin-7 |
Inverse variance weighted |
8 |
0.003023686 |
0.695624136 |
Interleukin-4 |
Inverse variance weighted |
8 |
0.003578857 |
0.617855915 |
Eotaxin |
Inverse variance weighted |
8 |
0.003907043 |
0.647388117 |
CCL20 |
Inverse variance weighted |
8 |
0.001501672 |
0.8548931 |
CCL23 |
Inverse variance weighted |
8 |
0.001579185 |
0.720815013 |
CCL25 |
Inverse variance weighted |
8 |
0.000499833 |
0.387923314 |
CCL28 |
Inverse variance weighted |
8 |
0.001788445 |
0.071146213 |
CCL3 |
Inverse variance weighted |
8 |
0.001146789 |
0.440303216 |
CCL4 |
Inverse variance weighted |
8 |
0.000870495 |
0.343262869 |
CXCL1 |
Inverse variance weighted |
8 |
0.000973279 |
0.912729576 |
CXCL10 |
Inverse variance weighted |
8 |
0.002390156 |
0.359762644 |
CXCL11 |
Inverse variance weighted |
8 |
0.001342559 |
0.875606701 |
CXCL5 |
Inverse variance weighted |
8 |
0.001139594 |
0.355520072 |
CXCL6 |
Inverse variance weighted |
8 |
0.000484907 |
0.350758675 |
CXCL9 |
Inverse variance weighted |
8 |
0.001627542 |
0.910523837 |
Interleukin-6 |
Inverse variance weighted |
10 |
0.001206833 |
0.721575772 |
Interleukin-18 |
Inverse variance weighted |
10 |
0.000943676 |
0.404782398 |
Immunoglobulin E |
Inverse variance weighted |
10 |
0.002510549 |
0.699516919 |
Interleukin-11 |
Inverse variance weighted |
10 |
0.001445522 |
0.782413201 |
Interleukin-12 |
Inverse variance weighted |
10 |
0.001287695 |
0.974310917 |
Interleukin-23 |
Inverse variance weighted |
10 |
0.001322687 |
0.805832139 |
Interleukin-13 |
Inverse variance weighted |
10 |
0.001215818 |
0.491209077 |
Interleukin-16 |
Inverse variance weighted |
10 |
0.000500872 |
0.341884533 |
Interleukin-17A |
Inverse variance weighted |
10 |
0.001265806 |
0.751828598 |
Interleukin-17C |
Inverse variance weighted |
10 |
0.001609783 |
0.53928419 |
Interleukin-17F |
Inverse variance weighted |
10 |
0.001140915 |
0.849229352 |
Interleukin-1 receptor antagonist protein |
Inverse variance weighted |
10 |
0.000916442 |
0.113944661 |
Interleukin-21 |
Inverse variance weighted |
10 |
0.002156731 |
0.905301195 |
Interleukin-25 |
Inverse variance weighted |
10 |
0.001443544 |
0.640599435 |
Interleukin-27 |
Inverse variance weighted |
10 |
0.001487102 |
0.884603613 |
Interleukin-2 receptor subunit alpha |
Inverse variance weighted |
10 |
0.002692621 |
0.321763241 |
Interleukin-31 |
Inverse variance weighted |
10 |
0.002344312 |
0.513931555 |
Interleukin-32 |
Inverse variance weighted |
10 |
0.001763086 |
0.553350945 |
Interleukin-34 |
Inverse variance weighted |
10 |
0.001093875 |
0.903655417 |
Interleukin-3 |
Inverse variance weighted |
10 |
0.002919849 |
0.381901902 |
Interleukin-36 alpha |
Inverse variance weighted |
10 |
0.001136349 |
0.930099443 |
Interleukin-36 beta |
Inverse variance weighted |
10 |
0.001343932 |
0.933077043 |
Interleukin-36 gamma |
Inverse variance weighted |
10 |
0.002185628 |
0.713737762 |
Interleukin-5 |
Inverse variance weighted |
10 |
0.0017555 |
0.450343516 |
Interleukin-6 receptor subunit alpha |
Inverse variance weighted |
10 |
0.000188177 |
0.625325369 |
Interleukin-9 |
Inverse variance weighted |
10 |
0.002510621 |
0.553216553 |
Toll-like receptor 4 |
Inverse variance weighted |
10 |
0.001635542 |
0.762943071 |
MCP-1 |
Inverse variance weighted |
8 |
0.001897654 |
0.326612582 |
TNF-a |
Inverse variance weighted |
8 |
0.001605156 |
0.755275219 |
CRP |
Inverse variance weighted |
8 |
0.0013565 |
0.684181349 |
b-NGF |
Inverse variance weighted |
8 |
0.00184724 |
0.707730649 |
TNF-b |
Inverse variance weighted |
8 |
0.001144238 |
0.546801719 |
G-CSF |
Inverse variance weighted |
8 |
0.001760395 |
0.831033896 |
MIF |
Inverse variance weighted |
8 |
0.00059689 |
0.264791729 |
2.4 Data Source and Tool Variable Selection of IC
IC data was sourced from the UK biobank (https://www.ebi.ac.uk/gwas/downloads/summary-statistics), including 57,013 participants (support information Table 2). The GWAS contained 51 IC types. These 51 different ICs were used for subsequent matching and analysis.
Table 2. Forward MR Horizontal Pleiotropy
ID Exposure |
ID Outcome |
SE |
P |
ebi-a-GCST004442 |
ukb-b-11601 |
1.27E-04 |
0.3075908 |
ebi-a-GCST004445 |
ukb-b-11601 |
1.33E-04 |
0.2322862 |
ebi-a-GCST004451 |
ukb-b-11601 |
1.26E-04 |
0.399273 |
ebi-a-GCST004453 |
ukb-b-11601 |
1.11E-04 |
0.7411803 |
ebi-a-GCST004460 |
ukb-b-11601 |
1.17E-04 |
0.8714405 |
ebi-a-GCST90000444 |
ukb-b-11601 |
1.16E-04 |
0.8564033 |
ebi-a-GCST90000445 |
ukb-b-11601 |
1.58E-04 |
0.1935303 |
ebi-a-GCST90000446 |
ukb-b-11601 |
9.37E-05 |
0.5323358 |
ebi-a-GCST90000447 |
ukb-b-11601 |
1.49E-04 |
0.3435592 |
ebi-a-GCST90000448 |
ukb-b-11601 |
1.19E-04 |
0.5946732 |
ebi-a-GCST90000449 |
ukb-b-11601 |
9.70E-05 |
0.6079453 |
ebi-a-GCST90000458 |
ukb-b-11601 |
1.66E-04 |
0.5350311 |
ebi-a-GCST90000459 |
ukb-b-11601 |
1.30E-04 |
0.5232793 |
ebi-a-GCST90000460 |
ukb-b-11601 |
1.11E-04 |
0.3244389 |
ebi-a-GCST90000461 |
ukb-b-11601 |
1.24E-04 |
0.9944352 |
ebi-a-GCST90000462 |
ukb-b-11601 |
1.05E-04 |
0.3578067 |
ebi-a-GCST90000463 |
ukb-b-11601 |
1.49E-04 |
0.28824 |
ebi-a-GCST90012005 |
ukb-b-11601 |
8.34E-05 |
0.5435456 |
ebi-a-GCST90012024 |
ukb-b-11601 |
8.49E-05 |
0.373806 |
prot-a-1456 |
ukb-b-11601 |
1.37E-04 |
0.7654356 |
prot-a-1466 |
ukb-b-11601 |
9.30E-05 |
0.1606427 |
prot-a-1470 |
ukb-b-11601 |
9.85E-05 |
0.613107 |
prot-a-1472 |
ukb-b-11601 |
1.01E-04 |
0.3474789 |
prot-a-1475 |
ukb-b-11601 |
9.27E-05 |
0.8263527 |
prot-a-1479 |
ukb-b-11601 |
7.69E-05 |
0.4965681 |
prot-a-1480 |
ukb-b-11601 |
9.15E-05 |
0.6243055 |
prot-a-1483 |
ukb-b-11601 |
8.56E-05 |
0.2301492 |
prot-a-1485 |
ukb-b-11601 |
8.78E-05 |
0.249381 |
prot-a-1504 |
ukb-b-11601 |
8.71E-05 |
0.7172722 |
prot-a-1506 |
ukb-b-11601 |
1.50E-04 |
0.1767558 |
prot-a-1515 |
ukb-b-11601 |
1.08E-04 |
0.3230504 |
prot-a-1516 |
ukb-b-11601 |
1.13E-04 |
0.4983363 |
prot-a-1518 |
ukb-b-11601 |
1.16E-04 |
0.7502979 |
prot-a-1521 |
ukb-b-11601 |
9.77E-05 |
0.5730969 |
prot-a-1523 |
ukb-b-11601 |
1.35E-04 |
0.3785118 |
prot-a-1524 |
ukb-b-11601 |
8.77E-05 |
0.7658137 |
prot-a-1525 |
ukb-b-11601 |
9.24E-05 |
0.7602778 |
prot-a-1526 |
ukb-b-11601 |
9.82E-05 |
0.8732425 |
prot-a-1527 |
ukb-b-11601 |
9.76E-05 |
0.2242442 |
prot-a-1528 |
ukb-b-11601 |
1.32E-04 |
0.5466671 |
prot-a-1535 |
ukb-b-11601 |
1.24E-04 |
0.4913327 |
prot-a-1540 |
ukb-b-11601 |
7.71E-05 |
0.8674261 |
prot-a-1546 |
ukb-b-11601 |
1.12E-04 |
0.3958118 |
prot-a-2990 |
ukb-b-11601 |
1.44E-04 |
0.8530817 |
prot-c-2578_67_2 |
ukb-b-11601 |
1.08E-04 |
0.4217126 |
prot-c-3722_49_2 |
ukb-b-11601 |
1.25E-04 |
0.8859223 |
prot-c-4337_49_2 |
ukb-b-11601 |
1.26E-04 |
0.955205 |
prot-c-4368_8_2 |
ukb-b-11601 |
1.17E-04 |
0.5367686 |
prot-c-4703_87_2 |
ukb-b-11601 |
1.70E-04 |
0.7176119 |
prot-c-4840_73_1 |
ukb-b-11601 |
1.47E-04 |
0.6138571 |
prot-c-5356_2_3 |
ukb-b-11601 |
1.01E-04 |
0.7106364 |
2.5 MR Statistical Analysis
SNPs of IC and BPH were used for the subsequent forward MR analysis and (see support information Table 1) reverse MR analysis (see support information Table 3). The inverse variance weighted (IVW) method, based on all core assumptions of MR, was the major statistical method for estimating the potential bidirectional causal relationship between BPH and IC[7]. When multiple IVS were available, IVW was the most effective analysis method, because it not only considered the specificity of variation and heterogeneity of causal estimation but also conducted a sensitivity analysis, including simple mode, weighted mode, weighted median and MR egger regression method, to evaluate the robustness of research results[11]. However, IV affected the results in other ways, indicating potential pleiotropic effect, and the causal estimation by IVW might be biased. Therefore, MR egger was used for level pleiotropy test. If P>0.05, it indicated the absence of pleiotropy. MR heterogeneity testing was used to identify the heterogeneity among SNPs. If there was heterogeneity, the random effect model was used. Otherwise, the fixed effect model was used by default. SNPs were sequentially removed from MR and then analyzed as a whole to observe the impact of a SNP on the whole MR analysis results[12]. Two sample mr (v.0.5.6) in R package (v.4.3.0) was used for major statistical analysis and chart making[13]. Odds ratio and 95% confidence interval (CI) indicated the degree of change in the result risk for each additional standard deviation of exposure factors. Statistical significance was set to P<0.05[14].
3 RESULTS
3.1 Influence of IC on BPH
IVW results demonstrated that 51 ICs were not significantly correlated with BPH at the genetic level (P>0.05) (Table 1). There was no significant level pleiotropy among SNPs (Table 2, global>0.05). According to the results of IVW and MR egger methods, we did not find the association accompanied by significant heterogeneity (Table 3, all P of Cochran’s Q>0.05).
Table 3. Forward MR Heterogeneity
ID Exposure |
ID Outcome |
Method |
P |
ebi-a-GCST004442 |
ukb-b-11601 |
Inverse variance weighted |
0.7611525 |
ebi-a-GCST004445 |
ukb-b-11601 |
Inverse variance weighted |
0.6613116 |
ebi-a-GCST004451 |
ukb-b-11601 |
Inverse variance weighted |
0.5930875 |
ebi-a-GCST004453 |
ukb-b-11601 |
Inverse variance weighted |
0.6046444 |
ebi-a-GCST004460 |
ukb-b-11601 |
Inverse variance weighted |
0.5998525 |
ebi-a-GCST90000444 |
ukb-b-11601 |
Inverse variance weighted |
0.5787391 |
ebi-a-GCST90000445 |
ukb-b-11601 |
Inverse variance weighted |
0.590039 |
ebi-a-GCST90000446 |
ukb-b-11601 |
Inverse variance weighted |
0.6650614 |
ebi-a-GCST90000447 |
ukb-b-11601 |
Inverse variance weighted |
0.9310135 |
ebi-a-GCST90000448 |
ukb-b-11601 |
Inverse variance weighted |
0.646764 |
ebi-a-GCST90000449 |
ukb-b-11601 |
Inverse variance weighted |
0.68369 |
ebi-a-GCST90000458 |
ukb-b-11601 |
Inverse variance weighted |
0.5761784 |
ebi-a-GCST90000459 |
ukb-b-11601 |
Inverse variance weighted |
0.6764405 |
ebi-a-GCST90000460 |
ukb-b-11601 |
Inverse variance weighted |
0.5776707 |
ebi-a-GCST90000461 |
ukb-b-11601 |
Inverse variance weighted |
0.6782612 |
ebi-a-GCST90000462 |
ukb-b-11601 |
Inverse variance weighted |
0.6803399 |
ebi-a-GCST90000463 |
ukb-b-11601 |
Inverse variance weighted |
0.5762521 |
ebi-a-GCST90012005 |
ukb-b-11601 |
Inverse variance weighted |
0.7759042 |
ebi-a-GCST90012024 |
ukb-b-11601 |
Inverse variance weighted |
0.8284255 |
prot-a-1456 |
ukb-b-11601 |
Inverse variance weighted |
0.7780214 |
prot-a-1466 |
ukb-b-11601 |
Inverse variance weighted |
0.7709993 |
prot-a-1470 |
ukb-b-11601 |
Inverse variance weighted |
0.76367 |
prot-a-1472 |
ukb-b-11601 |
Inverse variance weighted |
0.7694602 |
prot-a-1475 |
ukb-b-11601 |
Inverse variance weighted |
0.8085848 |
prot-a-1479 |
ukb-b-11601 |
Inverse variance weighted |
0.8465271 |
prot-a-1480 |
ukb-b-11601 |
Inverse variance weighted |
0.7732978 |
prot-a-1483 |
ukb-b-11601 |
Inverse variance weighted |
0.7996094 |
prot-a-1485 |
ukb-b-11601 |
Inverse variance weighted |
0.7670972 |
prot-a-1504 |
ukb-b-11601 |
Inverse variance weighted |
0.9529735 |
prot-a-1506 |
ukb-b-11601 |
Inverse variance weighted |
0.7649522 |
prot-a-1515 |
ukb-b-11601 |
Inverse variance weighted |
0.7846263 |
prot-a-1516 |
ukb-b-11601 |
Inverse variance weighted |
0.765627 |
prot-a-1518 |
ukb-b-11601 |
Inverse variance weighted |
0.8531033 |
prot-a-1521 |
ukb-b-11601 |
Inverse variance weighted |
0.8041772 |
prot-a-1523 |
ukb-b-11601 |
Inverse variance weighted |
0.7972261 |
prot-a-1524 |
ukb-b-11601 |
Inverse variance weighted |
0.7650009 |
prot-a-1525 |
ukb-b-11601 |
Inverse variance weighted |
0.8346096 |
prot-a-1526 |
ukb-b-11601 |
Inverse variance weighted |
0.7643211 |
prot-a-1527 |
ukb-b-11601 |
Inverse variance weighted |
0.7642582 |
prot-a-1528 |
ukb-b-11601 |
Inverse variance weighted |
0.7766351 |
prot-a-1535 |
ukb-b-11601 |
Inverse variance weighted |
0.8173211 |
prot-a-1540 |
ukb-b-11601 |
Inverse variance weighted |
0.7865772 |
prot-a-1546 |
ukb-b-11601 |
Inverse variance weighted |
0.7972484 |
prot-a-2990 |
ukb-b-11601 |
Inverse variance weighted |
0.7724241 |
prot-c-2578_67_2 |
ukb-b-11601 |
Inverse variance weighted |
0.691489 |
prot-c-3722_49_2 |
ukb-b-11601 |
Inverse variance weighted |
0.5863691 |
prot-c-4337_49_2 |
ukb-b-11601 |
Inverse variance weighted |
0.5945791 |
prot-c-4368_8_2 |
ukb-b-11601 |
Inverse variance weighted |
0.5915826 |
prot-c-4703_87_2 |
ukb-b-11601 |
Inverse variance weighted |
0.6184749 |
prot-c-4840_73_1 |
ukb-b-11601 |
Inverse variance weighted |
0.5801843 |
prot-c-5356_2_3 |
ukb-b-11601 |
Inverse variance weighted |
0.7255121 |
3.2 Effect of BPH on IC
IVW results showed that there was no significant correlation between BPH and 50 ICs at the genetic level (P>0.05). BPH was significantly correlated with one IC, prot-a-1525 (interleukin-3) at the genetic level (P<0.05) (see Table 4 and Figure 2 for the results). From the comprehensive results of the shape trend of the scatter diagram and the forest diagram, we can know that with the increase of BPH exposure, the risk of outcome (interleukin-3) decreases. At the same time, the results of eliminating the forest map one by one did not indicate the existence of a SNP affecting the whole result, indicating that the results of MR analysis were supported by all the included SNPs. There was no significant level pleiotropy between SNPs (Table 5, P>0.05). In addition, by combining the Q/P of Cochran in IVW and MR egger methods (Table 6, all P of Cochran’s Q>0.05) with the funnel diagram (Figure 2), no significant heterogeneity was found in the correlation.
Table 4. Reverse MR IVW
ID Exposure |
ID Outcome |
Method |
Nsnp |
SE |
P |
ukb-b-11601 |
ebi-a-GCST004442 |
Inverse variance weighted |
8 |
3.989997923 |
0.618714867 |
ukb-b-11601 |
ebi-a-GCST004445 |
Inverse variance weighted |
8 |
5.839792261 |
0.632711568 |
ukb-b-11601 |
ebi-a-GCST004451 |
Inverse variance weighted |
8 |
5.966260692 |
0.230726929 |
ukb-b-11601 |
ebi-a-GCST004453 |
Inverse variance weighted |
8 |
3.901383959 |
0.985311767 |
ukb-b-11601 |
ebi-a-GCST004460 |
Inverse variance weighted |
8 |
3.886916143 |
0.41244133 |
ukb-b-11601 |
ebi-a-GCST90000444 |
Inverse variance weighted |
8 |
11.22154184 |
0.874104374 |
ukb-b-11601 |
ebi-a-GCST90000445 |
Inverse variance weighted |
8 |
11.22154184 |
0.052093007 |
ukb-b-11601 |
ebi-a-GCST90000446 |
Inverse variance weighted |
8 |
11.90989162 |
0.889576139 |
ukb-b-11601 |
ebi-a-GCST90000447 |
Inverse variance weighted |
8 |
12.05228732 |
0.561739717 |
ukb-b-11601 |
ebi-a-GCST90000448 |
Inverse variance weighted |
8 |
11.34099825 |
0.608819274 |
ukb-b-11601 |
ebi-a-GCST90000449 |
Inverse variance weighted |
8 |
11.22154184 |
0.366957688 |
ukb-b-11601 |
ebi-a-GCST90000458 |
Inverse variance weighted |
8 |
15.27549838 |
0.765498806 |
ukb-b-11601 |
ebi-a-GCST90000459 |
Inverse variance weighted |
8 |
11.22154184 |
0.743832644 |
ukb-b-11601 |
ebi-a-GCST90000460 |
Inverse variance weighted |
8 |
11.22154184 |
0.900698273 |
ukb-b-11601 |
ebi-a-GCST90000461 |
Inverse variance weighted |
8 |
17.47032801 |
0.456852076 |
ukb-b-11601 |
ebi-a-GCST90000462 |
Inverse variance weighted |
8 |
11.22154184 |
0.719485811 |
ukb-b-11601 |
ebi-a-GCST90000463 |
Inverse variance weighted |
8 |
11.22154184 |
0.19542469 |
ukb-b-11601 |
ebi-a-GCST90012005 |
Inverse variance weighted |
11 |
2.839315658 |
0.429351259 |
ukb-b-11601 |
ebi-a-GCST90012024 |
Inverse variance weighted |
11 |
2.32158884 |
0.357404456 |
ukb-b-11601 |
prot-a-1456 |
Inverse variance weighted |
11 |
5.311140513 |
0.642154338 |
ukb-b-11601 |
prot-a-1466 |
Inverse variance weighted |
11 |
5.310812432 |
0.14282234 |
ukb-b-11601 |
prot-a-1470 |
Inverse variance weighted |
11 |
5.973046559 |
0.07189565 |
ukb-b-11601 |
prot-a-1472 |
Inverse variance weighted |
11 |
5.311140513 |
0.972400033 |
ukb-b-11601 |
prot-a-1475 |
Inverse variance weighted |
11 |
7.333932027 |
0.446795511 |
ukb-b-11601 |
prot-a-1479 |
Inverse variance weighted |
11 |
5.311140513 |
0.76549001 |
ukb-b-11601 |
prot-a-1480 |
Inverse variance weighted |
11 |
7.659498885 |
0.849393747 |
ukb-b-11601 |
prot-a-1483 |
Inverse variance weighted |
11 |
5.312157506 |
0.215935302 |
ukb-b-11601 |
prot-a-1485 |
Inverse variance weighted |
11 |
5.708772477 |
0.73978062 |
ukb-b-11601 |
prot-a-1504 |
Inverse variance weighted |
11 |
5.780946404 |
0.492466078 |
ukb-b-11601 |
prot-a-1506 |
Inverse variance weighted |
11 |
5.36913288 |
0.146802435 |
ukb-b-11601 |
prot-a-1515 |
Inverse variance weighted |
11 |
5.411103207 |
0.377038934 |
ukb-b-11601 |
prot-a-1516 |
Inverse variance weighted |
11 |
5.311140513 |
0.775461954 |
ukb-b-11601 |
prot-a-1518 |
Inverse variance weighted |
11 |
5.311140513 |
0.211713825 |
ukb-b-11601 |
prot-a-1521 |
Inverse variance weighted |
11 |
5.311140513 |
0.181496567 |
ukb-b-11601 |
prot-a-1523 |
Inverse variance weighted |
11 |
6.280096594 |
0.794333905 |
ukb-b-11601 |
prot-a-1524 |
Inverse variance weighted |
11 |
5.311140513 |
0.894032941 |
ukb-b-11601 |
prot-a-1525 |
Inverse variance weighted |
11 |
5.311140513 |
0.006048732 |
ukb-b-11601 |
prot-a-1526 |
Inverse variance weighted |
11 |
5.312157506 |
0.590475533 |
ukb-b-11601 |
prot-a-1527 |
Inverse variance weighted |
11 |
5.311140513 |
0.536628658 |
ukb-b-11601 |
prot-a-1528 |
Inverse variance weighted |
11 |
5.822865106 |
0.328926843 |
ukb-b-11601 |
prot-a-1535 |
Inverse variance weighted |
11 |
6.388625288 |
0.794721137 |
ukb-b-11601 |
prot-a-1540 |
Inverse variance weighted |
11 |
6.597614873 |
0.888034071 |
ukb-b-11601 |
prot-a-1546 |
Inverse variance weighted |
11 |
5.640737349 |
0.133968345 |
ukb-b-11601 |
prot-a-2990 |
Inverse variance weighted |
11 |
5.312157506 |
0.315610712 |
ukb-b-11601 |
prot-c-2578_67_2 |
Inverse variance weighted |
5 |
19.25253096 |
0.74824847 |
ukb-b-11601 |
prot-c-3722_49_2 |
Inverse variance weighted |
5 |
17.38963557 |
0.881189273 |
ukb-b-11601 |
prot-c-4337_49_2 |
Inverse variance weighted |
5 |
12.03369169 |
0.798664515 |
ukb-b-11601 |
prot-c-4368_8_2 |
Inverse variance weighted |
5 |
13.25921741 |
0.916792634 |
ukb-b-11601 |
prot-c-4703_87_2 |
Inverse variance weighted |
5 |
18.19590512 |
0.920701561 |
ukb-b-11601 |
prot-c-4840_73_1 |
Inverse variance weighted |
5 |
18.08078028 |
0.803742876 |
ukb-b-11601 |
prot-c-5356_2_3 |
Inverse variance weighted |
5 |
18.67203327 |
0.793757526 |
Table 5. Reverse MR Horizontal Pleiotropy
ID Exposure |
ID Outcome |
SE |
P |
ukb-b-11601 |
ebi-a-GCST004442 |
0.0518095 |
0.42193223 |
ukb-b-11601 |
ebi-a-GCST004445 |
0.07602007 |
0.329835 |
ukb-b-11601 |
ebi-a-GCST004451 |
0.0799223 |
0.94195004 |
ukb-b-11601 |
ebi-a-GCST004453 |
0.05071123 |
0.55834458 |
ukb-b-11601 |
ebi-a-GCST004460 |
0.05055511 |
0.96798188 |
ukb-b-11601 |
ebi-a-GCST90000444 |
0.14461264 |
0.26149178 |
ukb-b-11601 |
ebi-a-GCST90000445 |
0.14461264 |
0.48962242 |
ukb-b-11601 |
ebi-a-GCST90000446 |
0.16200163 |
0.61371851 |
ukb-b-11601 |
ebi-a-GCST90000447 |
0.15937052 |
0.45134944 |
ukb-b-11601 |
ebi-a-GCST90000448 |
0.14540474 |
0.07228067 |
ukb-b-11601 |
ebi-a-GCST90000449 |
0.14461264 |
0.1941975 |
ukb-b-11601 |
ebi-a-GCST90000458 |
0.21174536 |
0.83017889 |
ukb-b-11601 |
ebi-a-GCST90000459 |
0.14461264 |
0.77332733 |
ukb-b-11601 |
ebi-a-GCST90000460 |
0.14461264 |
0.26839864 |
ukb-b-11601 |
ebi-a-GCST90000461 |
0.24310839 |
0.95445802 |
ukb-b-11601 |
ebi-a-GCST90000462 |
0.14461264 |
0.60866866 |
ukb-b-11601 |
ebi-a-GCST90000463 |
0.14461264 |
0.43863626 |
ukb-b-11601 |
ebi-a-GCST90012005 |
0.03487753 |
0.48973444 |
ukb-b-11601 |
ebi-a-GCST90012024 |
0.02785514 |
0.65395994 |
ukb-b-11601 |
prot-a-1456 |
0.06396801 |
0.23703579 |
ukb-b-11601 |
prot-a-1466 |
0.06398886 |
0.47440535 |
ukb-b-11601 |
prot-a-1470 |
0.07572 |
0.87422117 |
ukb-b-11601 |
prot-a-1472 |
0.06396801 |
0.17844129 |
ukb-b-11601 |
prot-a-1475 |
0.0864342 |
0.26021111 |
ukb-b-11601 |
prot-a-1479 |
0.06396801 |
0.25564824 |
ukb-b-11601 |
prot-a-1480 |
0.09522202 |
0.54722899 |
ukb-b-11601 |
prot-a-1483 |
0.06399811 |
0.70124936 |
ukb-b-11601 |
prot-a-1485 |
0.07162621 |
0.65394515 |
ukb-b-11601 |
prot-a-1504 |
0.06395879 |
0.02188069 |
ukb-b-11601 |
prot-a-1506 |
0.06394594 |
0.18781891 |
ukb-b-11601 |
prot-a-1515 |
0.06869111 |
0.93682176 |
ukb-b-11601 |
prot-a-1516 |
0.06396801 |
0.10243591 |
ukb-b-11601 |
prot-a-1518 |
0.06396801 |
0.07162234 |
ukb-b-11601 |
prot-a-1521 |
0.06396801 |
0.25918187 |
ukb-b-11601 |
prot-a-1523 |
0.07304269 |
0.22146516 |
ukb-b-11601 |
prot-a-1524 |
0.06396801 |
0.31158527 |
ukb-b-11601 |
prot-a-1525 |
0.06396801 |
0.25132819 |
ukb-b-11601 |
prot-a-1526 |
0.06399811 |
0.48413786 |
ukb-b-11601 |
prot-a-1527 |
0.06396801 |
0.38007206 |
ukb-b-11601 |
prot-a-1528 |
0.06396801 |
0.07029675 |
ukb-b-11601 |
prot-a-1535 |
0.07662751 |
0.32396215 |
ukb-b-11601 |
prot-a-1540 |
0.08324986 |
0.74684853 |
ukb-b-11601 |
prot-a-1546 |
0.07140164 |
0.82526962 |
ukb-b-11601 |
prot-a-2990 |
0.06399811 |
0.51998361 |
ukb-b-11601 |
prot-c-2578_67_2 |
0.20341704 |
0.09380869 |
ukb-b-11601 |
prot-c-3722_49_2 |
0.2921604 |
0.56737612 |
ukb-b-11601 |
prot-c-4337_49_2 |
0.18681962 |
0.81555819 |
ukb-b-11601 |
prot-c-4368_8_2 |
0.20579558 |
0.93534172 |
ukb-b-11601 |
prot-c-4703_87_2 |
0.20549511 |
0.11599532 |
ukb-b-11601 |
prot-c-4840_73_1 |
0.32319863 |
0.93218255 |
ukb-b-11601 |
prot-c-5356_2_3 |
0.23684545 |
0.18214001 |
Table 6. Reverse MR Heterogeneity
ID Exposure |
ID Outcome |
Method |
P |
ukb-b-11601 |
ebi-a-GCST004442 |
Inverse variance weighted |
0.716066045 |
ukb-b-11601 |
ebi-a-GCST004445 |
Inverse variance weighted |
0.751450603 |
ukb-b-11601 |
ebi-a-GCST004451 |
Inverse variance weighted |
0.498497997 |
ukb-b-11601 |
ebi-a-GCST004453 |
Inverse variance weighted |
0.692793128 |
ukb-b-11601 |
ebi-a-GCST004460 |
Inverse variance weighted |
0.630138361 |
ukb-b-11601 |
ebi-a-GCST90000444 |
Inverse variance weighted |
0.519990211 |
ukb-b-11601 |
ebi-a-GCST90000445 |
Inverse variance weighted |
0.979296685 |
ukb-b-11601 |
ebi-a-GCST90000446 |
Inverse variance weighted |
0.342832452 |
ukb-b-11601 |
ebi-a-GCST90000447 |
Inverse variance weighted |
0.32604413 |
ukb-b-11601 |
ebi-a-GCST90000448 |
Inverse variance weighted |
0.424201435 |
ukb-b-11601 |
ebi-a-GCST90000449 |
Inverse variance weighted |
0.845300206 |
ukb-b-11601 |
ebi-a-GCST90000458 |
Inverse variance weighted |
0.072810575 |
ukb-b-11601 |
ebi-a-GCST90000459 |
Inverse variance weighted |
0.967469382 |
ukb-b-11601 |
ebi-a-GCST90000460 |
Inverse variance weighted |
0.732754467 |
ukb-b-11601 |
ebi-a-GCST90000461 |
Inverse variance weighted |
0.017612757 |
ukb-b-11601 |
ebi-a-GCST90000462 |
Inverse variance weighted |
0.685105364 |
ukb-b-11601 |
ebi-a-GCST90000463 |
Inverse variance weighted |
0.944569143 |
ukb-b-11601 |
ebi-a-GCST90012005 |
Inverse variance weighted |
0.368359806 |
ukb-b-11601 |
ebi-a-GCST90012024 |
Inverse variance weighted |
0.999208304 |
ukb-b-11601 |
prot-a-1456 |
Inverse variance weighted |
0.564281049 |
ukb-b-11601 |
prot-a-1466 |
Inverse variance weighted |
0.51089201 |
ukb-b-11601 |
prot-a-1470 |
Inverse variance weighted |
0.244033484 |
ukb-b-11601 |
prot-a-1472 |
Inverse variance weighted |
0.575528866 |
ukb-b-11601 |
prot-a-1475 |
Inverse variance weighted |
0.03941124 |
ukb-b-11601 |
prot-a-1479 |
Inverse variance weighted |
0.794655031 |
ukb-b-11601 |
prot-a-1480 |
Inverse variance weighted |
0.022604901 |
ukb-b-11601 |
prot-a-1483 |
Inverse variance weighted |
0.611012982 |
ukb-b-11601 |
prot-a-1485 |
Inverse variance weighted |
0.316056424 |
ukb-b-11601 |
prot-a-1504 |
Inverse variance weighted |
0.294989165 |
ukb-b-11601 |
prot-a-1506 |
Inverse variance weighted |
0.420996058 |
ukb-b-11601 |
prot-a-1515 |
Inverse variance weighted |
0.408147972 |
ukb-b-11601 |
prot-a-1516 |
Inverse variance weighted |
0.522737382 |
ukb-b-11601 |
prot-a-1518 |
Inverse variance weighted |
0.786502048 |
ukb-b-11601 |
prot-a-1521 |
Inverse variance weighted |
0.60619726 |
ukb-b-11601 |
prot-a-1523 |
Inverse variance weighted |
0.173508272 |
ukb-b-11601 |
prot-a-1524 |
Inverse variance weighted |
0.714050761 |
ukb-b-11601 |
prot-a-1525 |
Inverse variance weighted |
0.462768905 |
ukb-b-11601 |
prot-a-1526 |
Inverse variance weighted |
0.809674825 |
ukb-b-11601 |
prot-a-1527 |
Inverse variance weighted |
0.792219256 |
ukb-b-11601 |
prot-a-1528 |
Inverse variance weighted |
0.283732375 |
ukb-b-11601 |
prot-a-1535 |
Inverse variance weighted |
0.15288066 |
ukb-b-11601 |
prot-a-1540 |
Inverse variance weighted |
0.11711558 |
ukb-b-11601 |
prot-a-1546 |
Inverse variance weighted |
0.335715644 |
ukb-b-11601 |
prot-a-2990 |
Inverse variance weighted |
0.928348807 |
ukb-b-11601 |
prot-c-2578_67_2 |
Inverse variance weighted |
0.071569084 |
ukb-b-11601 |
prot-c-3722_49_2 |
Inverse variance weighted |
0.14198205 |
ukb-b-11601 |
prot-c-4337_49_2 |
Inverse variance weighted |
0.813624882 |
ukb-b-11601 |
prot-c-4368_8_2 |
Inverse variance weighted |
0.929012656 |
ukb-b-11601 |
prot-c-4703_87_2 |
Inverse variance weighted |
0.110747527 |
ukb-b-11601 |
prot-c-4840_73_1 |
Inverse variance weighted |
0.114019846 |
ukb-b-11601 |
prot-c-5356_2_3 |
Inverse variance weighted |
0.083531295 |
Figure 2A showed the scatter plot. Each point on the graph represented an IV, the line on each point actually reflecting the 95% CI, the abscissa was the effect of SNP on exposure, the ordinate was the effect of SNP on outcome, and the colored line represented the MR fitting results (light blue for IVW, dark blue for MR egger, light green for simple mode, dark green for weighted medium, and red for weighted mode). Figure 2B showed the forest plot. Each horizontal solid line in the figure reflected the result estimated by a SNP using the Wald ratio method. If the solid line was entirely on the left side of 0, it meant that the result estimated by this SNP was that increased exposure can reduce the risk of the result; If the solid line was entirely on the right side of 0, it meant that the result estimated by this SNP was that increased exposure can increase the risk of the result. Figure 2C was eliminating individual SNPs one by one forest plot. Each horizontal solid line in the figure reflected the result estimated by Wald ratio method after a SNP was eliminated. This method was to test the effect of a SNP on the whole result. Figure 2D was funnel plot. The abscissa in the figure was the value of IVW and MR, the ordinate was the value of tool variable IV, the solid blue line was MR egger, and the light blue line was IVW.
|
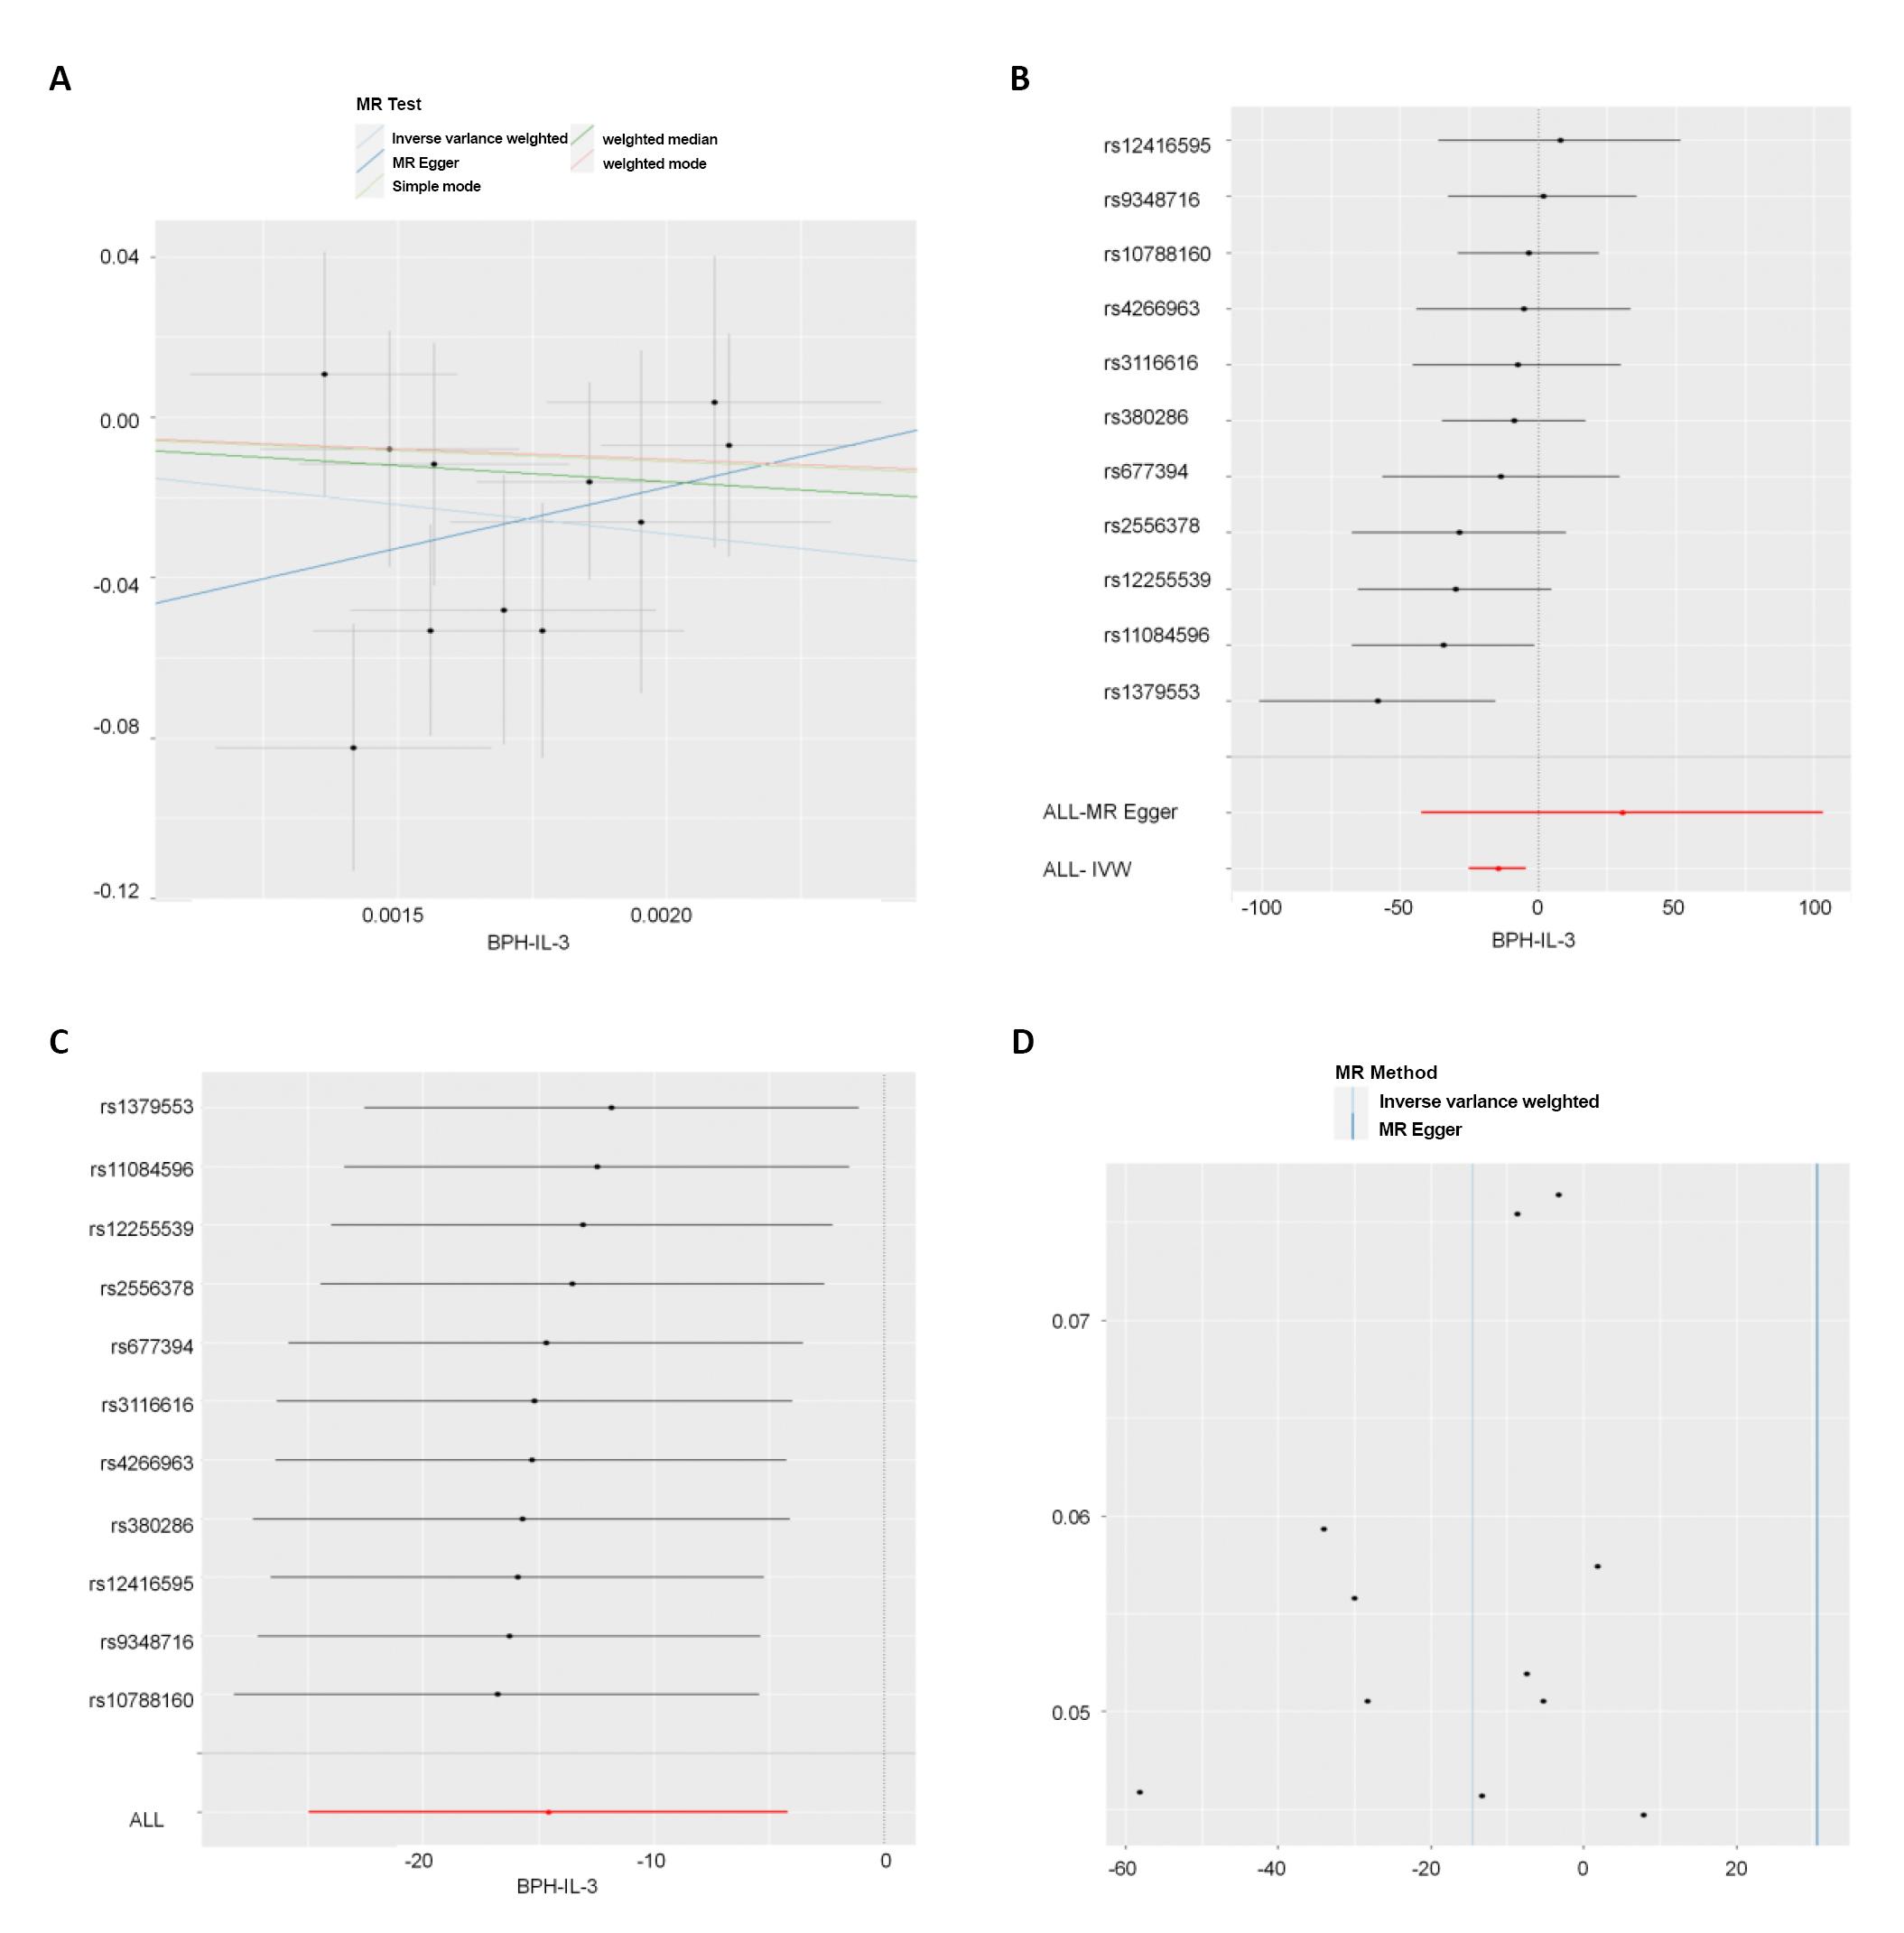
Figure 2. Reverse MR analysis results. A showed the scatter plot. B showed the forest plot. C was eliminating individual SNPs one by one forest plot. D was funnel plot.
4 DISCUSSION
Despite the extensive research on the role of ICs in BPH, our study presented results that contradict the traditionally held belief that the local inflammatory response exacerbated BPH. This discrepancy warranted further investigation and explanation. Previous studies showed that some ICs played a critical role in BPH. However, our study did not find any significant genetic association between ICs and BPH. One possible explanation for this discrepancy could be the inherent limitations of our study, which included a predominantly European study population and database constraints that precluded the inclusion of all ICs. Inflammatory changes often occur in glands of BPH patients[15]. But this process may not play a role through IC directly. Previous studies showed that the above IC has pro-inflammatory effect in various diseases. Studies showed that some ICs also play an important role in BPH. For example, IL-17 in BPH cases increased[16]; The expression of IL-8 was also increased in BPH[17]. IL-4 was associated with BPH[18]. Inflammation was not only affiliated with BPH, but also influenced epigenetics in certain diseases[19]. Epigenetic alterations was observed in BPH patients[20], suggesting the involvement of epigenetics in the pathogenesis and progression of BPH. Epigenetic mechanisms influenced various physiological and pathological processes by modulating the local and global accessibility of the epigenetic code to chromatin, thereby regulating gene expression. The three major well-studied epigenetic codes include DNA methylation, histone modification, and non-coding RNA (ncRNA)[21]. Epigenetics plays a significant role in numerous diseases such as BPH, cancer, and neurological disorders[22,23]. As the modern evolution of Mendelian genetics, the study of epigenetics is gaining momentum[24]. IC might indirectly have negative effects on BPH through inflammatory environments or epigenetic pathways.
5 CONCLUSION
In this bidirectional MR study, our results indicated that there was no significant genetic bidirectional association between BPH and IC. This suggested that IC may not exert a genetic exposure influence on BPH, contradicting previous studies that suggested otherwise. Further research is needed to elucidate the role of IC in BPH and to validate the findings of this study.
Our findings provided a unique perspective on the genetic interplay between IC and BPH, which could potentially reshape our understanding of BPH’s pathophysiology. Given the high prevalence of BPH in the elderly male population and the significant impact on their quality of life, it was crucial to gain a comprehensive understanding of its etiology.
However, our study did not support a significant genetic exposure influence of IC on BPH. This conclusion, while derived from rigorous MR analysis, was in contrast to previous studies, suggesting a complex interplay of genetic and non-genetic factors in BPH’s development and progression.
It was also worth noting that our study population was predominantly European, which may limit the generalizability of our findings to other ethnic groups. Future studies involving diverse populations are warranted to confirm our findings and further explore the genetic associations between IC and BPH.
Furthermore, due to database constraints, not all ICs, including those yet undiscovered, were included in this study. As our understanding of ICs continues to expand with ongoing research, future studies should incorporate these additional ICs to provide a more comprehensive view of the relationship between IC and BPH.
In summary, while our study did not find a significant genetic relationship between IC and BPH, it does highlight the need for further research in this area. Understanding the precise role of IC in BPH could have significant implications for the development of novel therapeutic strategies and personalized medicine approaches for BPH management.
Acknowledgements
The authors received funding, staff, and equipment support for the following research projects: Fundamental Research Ability Improvement Project for Young and Middle-aged Teachers in Guangxi Universities (Natural Science), Agreement No. 2022KY0300. Innovation Project of Guangxi Graduate Education of GXUCM, Agreement No. YCBXJ2023040. Administration of Traditional Chinese Medicine of Guangxi Zhuang Autonomous Region Self-funded Scientific Research Project (Natural Science), Agreement No. GXZYZ20210346. Health Commission of Guangxi Zhuang Autonomous Region self-funded scientific research project (Youth Fund), Agreement No. Z20211659. Natural Science Research Project of Guangxi University of Traditional Chinese Medicine (Youth Fund), Agreement No. 2021QN029. The funders had no role in study design, data collection and analysis, decision to publish, or preparation of the manuscript.
Conflicts of Interest
The authors declared no conflict of interest.
Author Contribution
Zhang Z conceived and designed the study. Zhu M conducted data analysis. Zhang Z, Chen Y and Huang S wrote the paper. Huang S reviewed and edited the manuscript. All authors approved the final version of the article. Zhang Z, Huang S and Chen Y contributed equally to this work and are co-first authors.
Data Availability
The following supporting information can be downloaded at: https://figshare.com/account/home (DOI: 10.6084/m9.figshare.23393915), Tables 1-3. The datasets generated and analyzed during the current study are available at https://gwas.mrcieu.ac.uk/
Abbreviation List
BPH, Benign prostatic hyperplasia
CI, Confidence interval
GWAS, Genome-wide association studies
IC, Inflammatory cytokines
IVW, Inverse variance weighted
MR, Mendelian randomization
SNP, Single nucleotide polymorphism
References
[1] Ding K, Tang R, Yu J. Recommendations for the Management of Patients with Benign Prostatic Hyperplasia in the Context of the COVID-19 Pandemic: A Retrospective Study of 314 Cases. Biomed Res Int, 2022; 19: 5739574.[DOI]
[2] Devlin CM, Simms MS, Maitland NJ. Benign prostatic hyperplasia - what do we know? BJU Int, 2021; 127: 389-399.[DOI]
[3] Robert G, De La Taille A, Descazeaud A. Epidemiological data related to the management of BPH [Benign Prostatic Hyperplasia] [In French]. Prog Urol, 2018; 28: 803-812.[DOI]
[4] Naiyila X, Li JZ, Huang Y et al. A Novel Insight into the Immune-related Interaction of Inflammatory Cytokines in Benign Prostatic Hyperplasia. J Clin Med, 2023; 12: 1821.[DOI]
[5] Lloyd GL, Marks JM, Ricke WA. Benign Prostatic Hyperplasia and Lower Urinary Tract Symptoms: What Is the Role and Significance of Inflammation? Curr Urol Rep, 2019; 20: 54.[DOI]
[6] Bostanci Y, Kazzazi A, Momtahen S et al. Correlation between benign prostatic hyperplasia and inflammation. Curr Opin Urol, 2013; 23: 5-10.[DOI]
[7] Huang D, Lin S, He J et al. Association between COVID-19 and telomere length: A bidirectional Mendelian randomization study. J Med Virol, 2022; 94: 5345-5353.[DOI]
[8] Sekula P, Del Greco MF, Pattaro C et al. Mendelian Randomization as an Approach to Assess Causality Using Observational Data. J Am Soc Nephrol, 2016; 27: 3253-3265.[DOI]
[9] Wang Y, Yang L, Deng Y et al. Causal relationship between obesity, lifestyle factors and risk of benign prostatic hyperplasia: a univariable and multivariable Mendelian randomization study. J Transl Med, 2022; 20: 495.[DOI]
[10] Lee YH. Overview of Mendelian Randomization Analysis. J Rheum Dis, 2020; 27: 241-246.[DOI]
[11] Burgess S, Davey Smith G, Davies NM et al. Guidelines for performing Mendelian randomization investigations: update for summer 2023. Wellcome Open Res, 2020; 4: 186.[DOI]
[12] Yang M, Wan X, Zheng H et al. No Evidence of a Genetic Causal Relationship between Ankylosing Spondylitis and Gut Microbiota: A Two-sample Mendelian Randomization Study. Nutrients, 2023; 15: 1057.[DOI]
[13] Hemani G, Zheng J, Elsworth B et al. The MR-base platform supports systematic causal inference across the human phenome. eLife, 2018; 7: 1-29.[DOI]
[14] Lu H, Wu P, Zhang W et al. Circulating Interleukins and Risk of Multiple Sclerosis: A Mendelian Randomization Study. Front Immunol, 2021; 12: 647588.[DOI]
[15] Lloyd GL, Ricke WA, McVary KT. Inflammation, Voiding and Benign Prostatic Hyperplasia Progression. J Urol, 2019; 201: 868-870.[DOI]
[16] Arivazhagan J, Nandeesha H, Dorairajan LN et al. Association of elevated interleukin-17 and angiopoietin-2 with prostate size in benign prostatic hyperplasia. Aging Male, 2017; 20: 115-118.[DOI]
[17] Schauer IG, Ressler SJ, Tuxhorn JA et al. Elevated epithelial expression of interleukin-8 correlates with myofibroblast reactive stroma in benign prostatic hyperplasia. Urology, 2008; 72: 205-213.[DOI]
[18] Sheng J, Yang Y, Cui Y et al. M2 macrophage-mediated interleukin-4 signalling induces myofibroblast phenotype during the progression of benign prostatic hyperplasia. Cell Death Dis, 2018; 9: 755.[DOI]
[19] Shen J, Abu-Amer Y, O'Keefe RJ et al. Inflammation and epigenetic regulation in osteoarthritis. Connect Tissue Res, 2017; 58: 49-63.[DOI]
[20] Bechis SK, Otsetov AG, Ge R et al. Age and Obesity Promote Methylation and Suppression of 5α-Reductase 2: Implications for Personalized Therapy of Benign Prostatic Hyperplasia. J Urol, 2015; 194: 1031-1037.[DOI].
[21] Li Y. Modern epigenetics methods in biological research. Methods, 2021; 187: 104-113.[DOI]
[22] Santaló J, Berdasco M. Ethical implications of epigenetics in the era of personalized medicine. Clin Epigenetics, 2022; 14: 44.[DOI]
[23] Dobosy JR, Roberts JL, Fu VX et al. The expanding role of epigenetics in the development, diagnosis and treatment of prostate cancer and benign prostatic hyperplasia. J Urol, 2007; 177: 822-831.[DOI]
[24] Gayon J. From Mendel to epigenetics: History of genetics. C R Biol, 2016; 339: 225-230.[DOI]
Copyright © 2023 The Author(s). This open-access article is licensed under a Creative Commons Attribution 4.0 International License (https://creativecommons.org/licenses/by/4.0), which permits unrestricted use, sharing, adaptation, distribution, and reproduction in any medium, provided the original work is properly cited.


