Development and Validation of Total Levothyroxine and Total Liothyronine in Human Serum using Chemiluminescence Micro Particle Immunoassay and Its Application to Bioequivalence Study
Naveen Kumar Dubey1*, Peeyush Jain1, Sheela Bedi1
1Jubilant Generics Limited, Noida, Uttar Pradesh, India
*Correspondence to: Naveen Kumar Dubey, PhD, Associate Director, Jubilant Generics Limited, Plot No. 15, Knowledge Park II, Greater Noida, Uttar Pradesh 201307, India; Email: nd005@rediffmail.com
Abstract
Objective: The purpose of this study was to develop and validate a bioanalytical method to analyze total levothyroxine and total liothyronine in human serum using chemiluminescence micro particle immunoassay (CMIA) and its application to bioequivalence study. Bioanalysis of human biomarkers such as levothyroxine (T4) and liothyronine (T3) serve the purpose to identify and control the disease progression, if detected timely in the patient. Analysis of these endogenous compounds requires very high technical expertise in terms of sample preparation and its result interpretation. Unless necessary, regulatory guidance discourages to work with surrogate matrix for calibration curve (CC) standard preparation.
Methods: We developed and validated a method to use CC standards and quality control samples made from stripped human serum in the simultaneous determination of T4 and T3 in human serum using CMIA. The human serum was treated with activated charcoal to minimize or remove endogenous level of T4 and T3 compounds. This treated serum was used for the preparation of CC standards for analysis.
Results: The method was developed and validated from 0.498 to 5.621ng/mL for T3 and 2.030 to 17.721µg/dL for T4. No difference (Absence of matrix effect and parallelism) were noticed in unstripped and stripped serum for T4 and T3. The validated method enabled the simultaneous analysis of T4 and T3 in samples from clinical pharmacokinetic studies. The method was used for T3 20µg tablet bioequivalence study. The peak concentration of T3 was 3.975ng/mL and 4.601ng/Ml, respectively, in test and reference formulation for 100µg dose (20µg×5=100µg dose). The terminal half-life values for T3 in test and reference formulation ranged between 1.75 to 6.00h and 1.25 to 3.00h, respectively.
Conclusion: Challenge of endogenous concentration can be overcome by applying proper scientific allowable approach permitted in the regulatory guidelines which enable the scientific fraternity to use the surrogate matrix such as stripped serum to prepare the CC standards. The developed method was successfully employed to many bioequivalence studies for the analysis of T3.
Keywords: levothyroxine, liothyronine, chemiluminescence micro particle immunoassay, bioequivalence, human serum
1 INTRODUCTION
The thyroid gland produces and secretes thyroid hormones which regulate growth and development in humans[1]. Chemically, liothyronine (T3) is (2S)-2-amino-3-[4-(4-hydroxy-3-iodophenoxy)-3,5-diiodophenyl] propanoic acid and levothyroxine (T4) is (2S)-2-amino-3-[4-(4-hydroxy-3,5-diiodophenoxy)-3,5-diiodophenyl] propanoic acid. They both are tyrosine based hormones with iodine in their structure. Excess and deficiency of these hormones cause hyperthyroidism and hypothyroidism, respectively[2]. Synthetic forms of T3 and T4 are used for treatment of hypo/hyperthyroidism[3]. In healthy, total serum thyroxine (TT4, which includes both total protein bound and unbound thyroxine) is present in about 60-fold higher concentration than total serum thyronine (TT3, which includes both total protein bound and unbound thyronine)[4]. The measurement of thyroid hormone levels in humans gives information about thyroid function. Solubility and permeability data suggest that T3 and T4 belong to biopharmaceutical classification category III, which means these drugs are highly soluble but low permeable[5]. As per reported publication[6,7], the peak plasma concentration (Cmax) of 100µg dose (50µg×2=100µg) of T3 was 8.01ng/mL whereas the Cmax of 600µg dose (200µg×3=6100µg) of T4 was 14.79µg/dL. The nonbinding guidelines from United States Food And Drug Administration (USFDA) suggests the bioequivalence to be conducted at 600µg dose for T4 and 100µg dose for T3[8,9].
Many analytical methods have already been developed using techniques like high performance liquid chromatography (HPLC), gas chromatography mass spectrometry (GC-MS), liquid chromatography mass spectrometry (LC-MS)/MS and automated radioimmunoassay kits for the determination of free or total liothyronine (TT3) and T4, but these methods were developed for quantitation of thyroid hormones for diagnostic purpose only[10-12]. Dutt et al.[13] developed and validated ultra-performance liquid chromatography tandem mass spectrometry (UPLC-MS/MS) for simultaneous determination of T3 and T4 in human serum, but they not documented the elimination of endogenous levels from the serum which was used for calibration curve (CC) standard preparation. Wang et al.[14] analyzed the thyroid hormone in bovine serum by LC-MS/MS which again was not the actual matrix (human serum). Methods on GC-MS were developed to determine TT3 and T4, but they require laborious sample cleanup and derivatization[15-17].
Chemiluminescent immunoassay analyzer (Architect i-1000SR) works on the chemiluminescent microparticle immunoassay (CMIA) principle which involves two step process. In the first step, sample, antigen coated paramagnetic microparticles are combined in the reaction vessel. Antibody present in the sample binds to the antigen coated microparticles. After incubation, anti-human acridinium-labeled conjugate is added (in the second step). Following the wash cycle, pre-trigger and trigger solutions are added to the reaction mixture. The resulting chemiluminescent reaction is measured as relative light unit (RLU). A direct/indirect relationship exists between the amount of analyte present in the sample and the RLU detected by the architect i-system optics. The presence or absence of analyte in the specimen is determined by comparing the chemiluminescent signal in the reaction to the CC/cut-off signal determined from a previous architect analyte calibration.
To the best of our knowledge, there are no bioanalytical method published for the use of CC standards and quality control (QC) samples made from stripped human serum in the simultaneous determination of T4 and T3 in human serum using chemiluminescence microparticle immunoassay that could be employed for a bioequivalence study of low dose (20µg) formulation under fasting condition, which is mandatory as per the current regulatory requirement by USFDA[8]. In addition, there are no published reports where the assessment of stripped serum was employed for the preparation of CC standard using CMIA instrument.
2 MATERIALS AND METHODS
2.1 Chemicals and Reagents
T4 sodium and T3 standards were procured from Clearsynth Labs (P) Ltd. Serum of healthy volunteers was procured from Laxmi Sai Clinical Labs, India. Methanol (HPLC grade) was procured from JT Baker, Germany. Liquor ammonia was procured from Merck, Germany. A Milli-Q water (Millipore Co. MA, USA) purification system was used to obtain the purified water for the HPLC.
2.2 Instrumentation
A chemiluminescence microparticle fully automated immuno-analyzer (Manufacturer: Architect, Model: i1000SR and Software: V8) was used for the analysis. The instrument is based on the principle of chemiluminescence, where the specific labeled enzymes excite the substrate to an intermediate reaction product, which emits photons of light when it returns to its ground state (Figure 1).
|
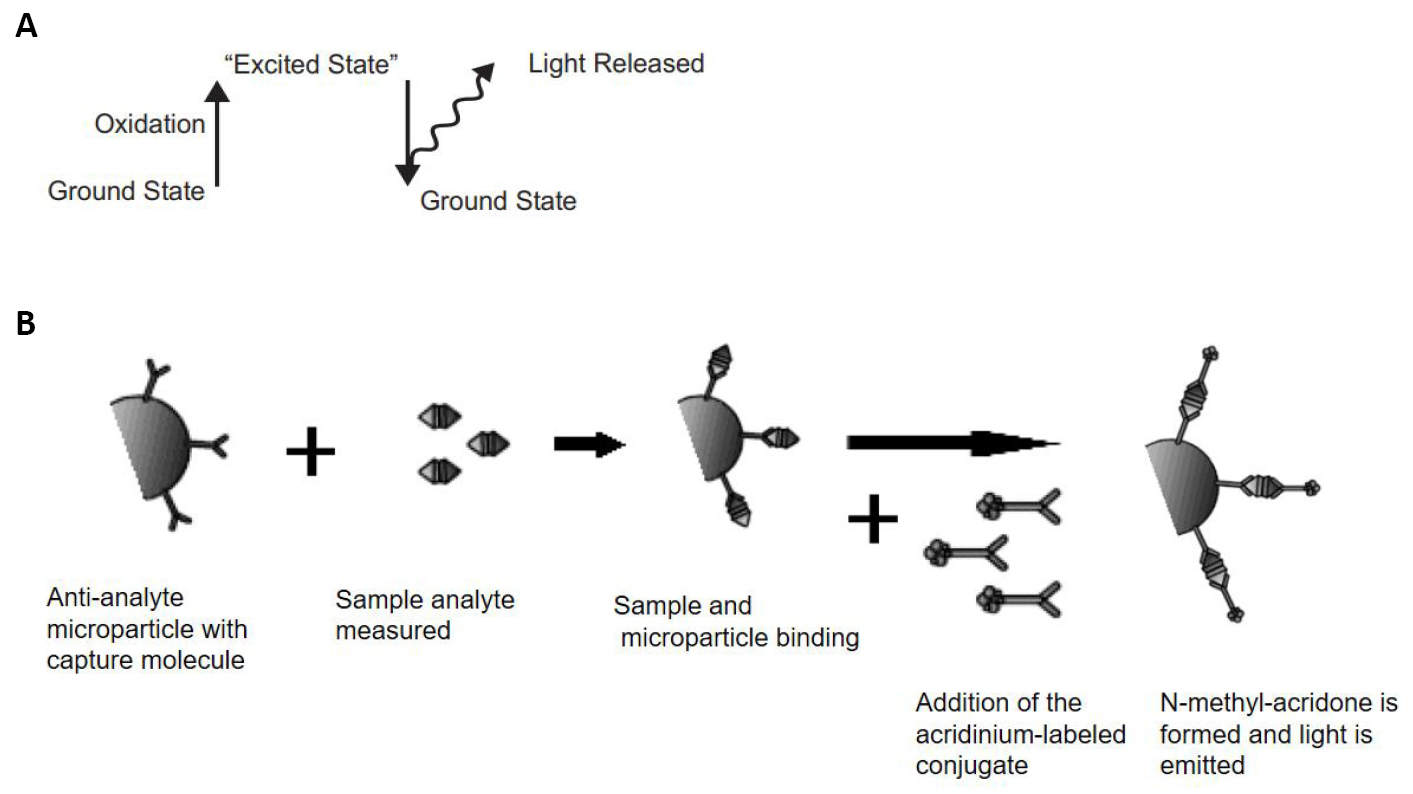
Figure 1. Representation of release of light from ground state (A) and flow diagram for Chemiluminescence reaction (B).
The emitted light is then detected by the luminescence signal detector. The luminescence indicates the presence of the antigen. The quantity of the biological molecule (TT3/TT4) to be measured is inversely proportional to the intensity of the luminescence observed and is measured as RLUs by the ARCHITECT i-optical system.
2.3 Study Design
A two-way crossover study protocol was used for the single-dose (5×20µg) bioequivalence assessment between the test formulation and reference formulations of T3 at a dose of 100µg. The protocol was approved by Rational Independent Ethics Committee and the office of Drug Controller general of India. In total, sixteen healthy volunteers participated in the study. After an overnight fasting of at least 10h, three Predose samples were followed by, a single dose of drug product (either 5 tablets of 20µg test or reference product), was administered orally with at least 240mL of drinking water to each subject in sitting position with sorrounding monochromatic light conditions at ambient temperature. Dosing was followed by 22 post dose samples. Three pre-dose samples of 6mL plus 22 post-dose blood samples of 4mL each were collected from each subject in each period, using red-top plain vacutainers. Vacutainers were kept in upright position (without any disturbance) for 60min to facilitate the clotting process. Blood samples were centrifuged at 4000 rotation per min (rpm) for 10min at 4°C as within 2h of sample collection to separate the serum from the cells. Samples were collected at three pre-dose points (-0.50, -0.25, 0.0) and 22 post dose points at 0.25, 0.50, 0.75, 1.00, 1.25, 1.50, 1.75, 2.00, 2.25, 2.50, 2.75, 3.00, 3.50, 4.00, 6.00, 8.00, 12.00, 16.00, 24.00, 36.00, 48.00 and 72.00h in each period. The separated serum samples were transferred to pre-labeled duplicate aliquots of polypropylene tubes and stored upright at -65ºC deep freezer, until analysis.
2.4 Preparation of Standards and QC Samples
A stock solution of 2mg/10mL was prepared by dissolving reference standard of T3 and T4 in diluent solution (0.1% ammoniated methanol solution). These stock solutions were further diluted by diluent solution (Methanol: Milli-Q Water: 20:80, v/v) to prepare working solutions. All stock solutions and dilutions were stored in Deep Freezer at -20C. CC standard was prepared by charcoal stripped human serum. Further on, charcoal stripped human serum is referred to as stripped serum. CC standard was prepared by spiking 1% of aqueous dilutions for T3 and T4 each, in stripped serum. CC ranges between 0.498 to 5.621ng/mL for TT3 and 2.030 to 17.721µg/dL for TT4 were prepared with lower anchor point (LAP) 0.374ng/mL for TT3 & 1.522µg/dL for TT4 and upper anchor point (UAP) 6.223ng/mL for TT3 & 19.718µg/dL for TT4.
Similarly, QC standards were prepared in stripped serum at five levels, namely, lower limit of quantification (LLOQ), lower quality control (LQC), medium quality control (MQC), higher quality control (HQC) and upper limit of quantification (ULOQ). QCs were prepared by spiking 2% of aqueous dilutions (1% TT3 and 1% TT4 each) in stripped serum.
QC samples 0.499ng/mL (LLOQ QC), 1.414ng/mL (LQC), 2.356ng/mL (MQC), 4.516ng/mL (HQC), 5.301ng/mL (ULOQ) for TT3 and 2.031µg/dL (LLOQ QC), 5.505µg/dL (LQC), 8.878µg/dL (MQC), 14.737µg/dL (HQC), 17.217µg/dL (ULOQ) for TT4 were prepared. Aliquots of the QC were stored in polypropylene tubes for long term stability at -65°C deep freezer, until analysis.
2.5 Charcoal Stripping Procedure
Since both T3 and T4 are endogenous substances within the human serum, in order to eliminate the interference of these endogenous levels, serum was treated with charcoal to remove them. Stripped serum was prepared by adding 100mg of charcoal to 1mL serum. The charcoal mixture was vortexed for ~2.0 Hr. at ~2,000rpm prior to incubation (at ~37°C for ~2.0h). The charcoal was subsequently separated from serum by first filtering it with cotton, followed by centrifugation at 15,000rpm (for 40min at 4°C). The resultant serum was stripped off the endogenous T3 and T4 as was demonstrated during subsequent screening analysis (Data not shown).
2.6 Validation
The method was validated by analyzing QC samples during three independent validation batches. Each batch was included within a two sets of seven different non-zero concentrations of T3 and T4 [known as CC standards]. These terminal points of each set of CC standards served as the anchor points. The CC standards were prepared in stripped serum to determine the accuracy and precision of the method. Average of both sets of CC standards was considered for further calculation of each of the three batches.
Precision and accuracy (PA) batches were analyzed by CMIA. RLU values for T3 and T4 were measured and considered for the quantification. All the data interpretation for T3 and T4 were performed by four-parameters logistic (Marquardt) method (non-linear regression method), with weighing factor 1 (none) using Watson LIMS 7.4 software.
System suitability was performed by analyzing aqueous mixture (AQSMIX) containing the two analytes i.e. T3 and T4. Result of back calculated concentration from each CC for T3 and T4 are provided in Tables 1 and 2.
Table 1. Back Calculated Concentrated of TT3 & TT4
|
LAP |
STD A |
STD B |
STD C |
STD D |
STD E |
STD F |
STD G |
UAP |
Slope |
r2 |
TT3 |
|
|
|
|
|
|
|
|
|
|
|
Nominal Conc |
0.374 |
0.498 |
0.997 |
2.004 |
2.863 |
3.516 |
4.543 |
5.621 |
6.223 |
|
|
Unit |
ng/mL |
ng/mL |
ng/mL |
ng/mL |
ng/mL |
ng/mL |
ng/mL |
ng/mL |
ng/mL |
|
|
Mean |
0.348 |
0.530 |
0.968 |
2.162 |
2.945 |
3.670 |
4.126 |
4.797 |
6.363 |
2.830267 |
0.9995 |
SD |
0.018 |
0.008 |
0.032 |
0.115 |
0.190 |
0.021 |
0.122 |
0.227 |
1.464 |
0.123 |
0.021 |
%CV |
5.17 |
1.51 |
3.31 |
5.32 |
6.45 |
0.57 |
2.96 |
4.73 |
23.01 |
4.34 |
2.10 |
%Bias |
-6.95 |
6.43 |
-2.91 |
7.88 |
2.86 |
4.38 |
-9.18 |
-14.66 |
2.25 |
|
|
n |
3 |
3 |
3 |
3 |
3 |
3 |
3 |
3 |
3 |
3 |
3 |
TT4 |
|
||||||||||
Nominal Conc |
1.552 |
2.030 |
4.059 |
6.950 |
9.267 |
11.042 |
14.985 |
17.721 |
19.718 |
|
|
Unit |
µg/dL |
µg/dL |
µg/dL |
µg/dL |
µg/dL |
µg/dL |
µg/dL |
µg/dL |
µg/dL |
|
|
Mean |
1.456 |
2.120 |
3.995 |
7.019 |
9.357 |
10.773 |
15.262 |
18.168 |
19.091 |
1.742607 |
0.9990 |
SD |
0.115 |
0.234 |
0.001 |
0.088 |
0.166 |
0.034 |
0.314 |
0.199 |
0.310 |
0.174 |
0.024 |
%CV |
7.90 |
11.04 |
0.03 |
1.25 |
1.77 |
0.32 |
2.06 |
1.10 |
1.62 |
9.98 |
2.40 |
%Bias |
-4.34 |
4.43 |
-1.58 |
0.99 |
0.97 |
-2.44 |
1.85 |
2.52 |
-3.18 |
|
|
n |
3 |
3 |
3 |
3 |
3 |
3 |
3 |
3 |
3 |
3 |
3 |
Notes: SD, Standard deviation; CV (%), Coefficient of varience.
Table 2. PA Batch Accuracy and Precision Data for TT3 & TT4
|
TT3 |
TT4 |
||||||||
LLOQ QC |
LQC |
MQC |
HQC |
ULOQ QC |
LLOQ QC |
LQC |
MQC |
HQC |
ULOQ QC |
|
|
PA Bach 1 |
PA Bach 1 |
||||||||
Nominal Conc |
0.499 |
1.414 |
2.356 |
4.516 |
5.301 |
2.031 |
5.505 |
8.878 |
14.737 |
17.217 |
ng/mL |
ng/mL |
ng/mL |
ng/mL |
ng/mL |
ng/mL |
µg/dL |
µg/dL |
µg/dL |
µg/dL |
µg/dL |
n |
6 |
6 |
6 |
6 |
6 |
6 |
6 |
6 |
6 |
6 |
Mean (Cal. Conc) |
0.506 |
1.403 |
2.449 |
3.727 |
0.646 |
2.024 |
5.056 |
8.175 |
13.991 |
16.778 |
SD (±) |
0.032 |
0.031 |
0.073 |
0.273 |
0.646 |
0.226 |
0.206 |
0.335 |
0.900 |
0.286 |
CV (%) |
6.32 |
2.21 |
2.98 |
7.32 |
12.17 |
11.17 |
4.07 |
4.10 |
6.43 |
1.70 |
% Bias |
1.40 |
-0.78 |
3.95 |
-17.47 |
0.15 |
-0.34 |
-8.16 |
-7.92 |
-5.06 |
-2.55 |
|
PA Batch 2 |
PA Batch 2 |
||||||||
Nominal Conc |
0.499 |
1.414 |
2.356 |
4.516 |
5.301 |
2.031 |
5.505 |
8.878 |
14.737 |
17.217 |
ng/mL |
ng/mL |
ng/mL |
ng/mL |
ng/mL |
ng/mL |
µg/dL |
µg/dL |
µg/dL |
µg/dL |
µg/dL |
n |
6 |
6 |
6 |
6 |
6 |
6 |
6 |
6 |
6 |
6 |
Mean: |
0.523 |
1.499 |
2.691 |
4.107 |
4.925 |
2.016 |
4.729 |
8.171 |
14.768 |
17.042 |
SD (±) |
0.022 |
0.032 |
0.083 |
0.162 |
0.303 |
0.118 |
0.107 |
0.384 |
0.536 |
0.235 |
CV (%) |
4.21 |
2.13 |
3.08 |
3.94 |
6.15 |
5.85 |
2.26 |
4.70 |
3.63 |
1.38 |
% Bias |
4.81 |
6.01 |
14.22 |
-9.06 |
-7.09 |
-0.74 |
-14.10 |
-7.96 |
0.21 |
-1.02 |
|
PA Batch 3 |
PA Batch 3 |
||||||||
Nominal Conc |
0.499 |
1.414 |
2.356 |
4.516 |
5.301 |
2.031 |
5.505 |
8.878 |
14.737 |
17.217 |
ng/mL |
ng/mL |
ng/mL |
ng/mL |
ng/mL |
ng/mL |
µg/dL |
µg/dL |
µg/dL |
µg/dL |
µg/dL |
n |
6 |
6 |
6 |
6 |
6 |
6 |
6 |
6 |
6 |
6 |
Mean: |
0.505 |
1.457 |
2.487 |
3.948 |
5.474 |
1.980 |
5.172 |
8.496 |
14.609 |
16.639 |
SD (±) |
0.039 |
0.043 |
0.077 |
0.115 |
0.316 |
0.122 |
0.233 |
0.365 |
0.369 |
0.236 |
CV (%) |
7.72 |
2.95 |
3.10 |
2.91 |
5.77 |
6.16 |
4.51 |
4.30 |
2.53 |
1.42 |
% Bias |
1.20 |
3.04 |
5.56 |
-12.58 |
3.26 |
-2.51 |
-6.05 |
-4.30 |
3.39 |
-3.36 |
Notes: SD, Standard deviation; CV (%), Coefficient of varience.
3 RESULTS
3.1 Precision and Accuracy
Repeatability and reproducibility of the method were assessed by running the multiple CC standards and QC samples at five different levels. The inter-day precision and accuracy was determined over 3 days by analyzing 90 QC samples. CC was non-linear over a concentration range of 0.498-5.621ng/mL for T3 (Figure 2A) and 2.030-17.721µg/dL for T4 (Figure 2B), respectively.
|
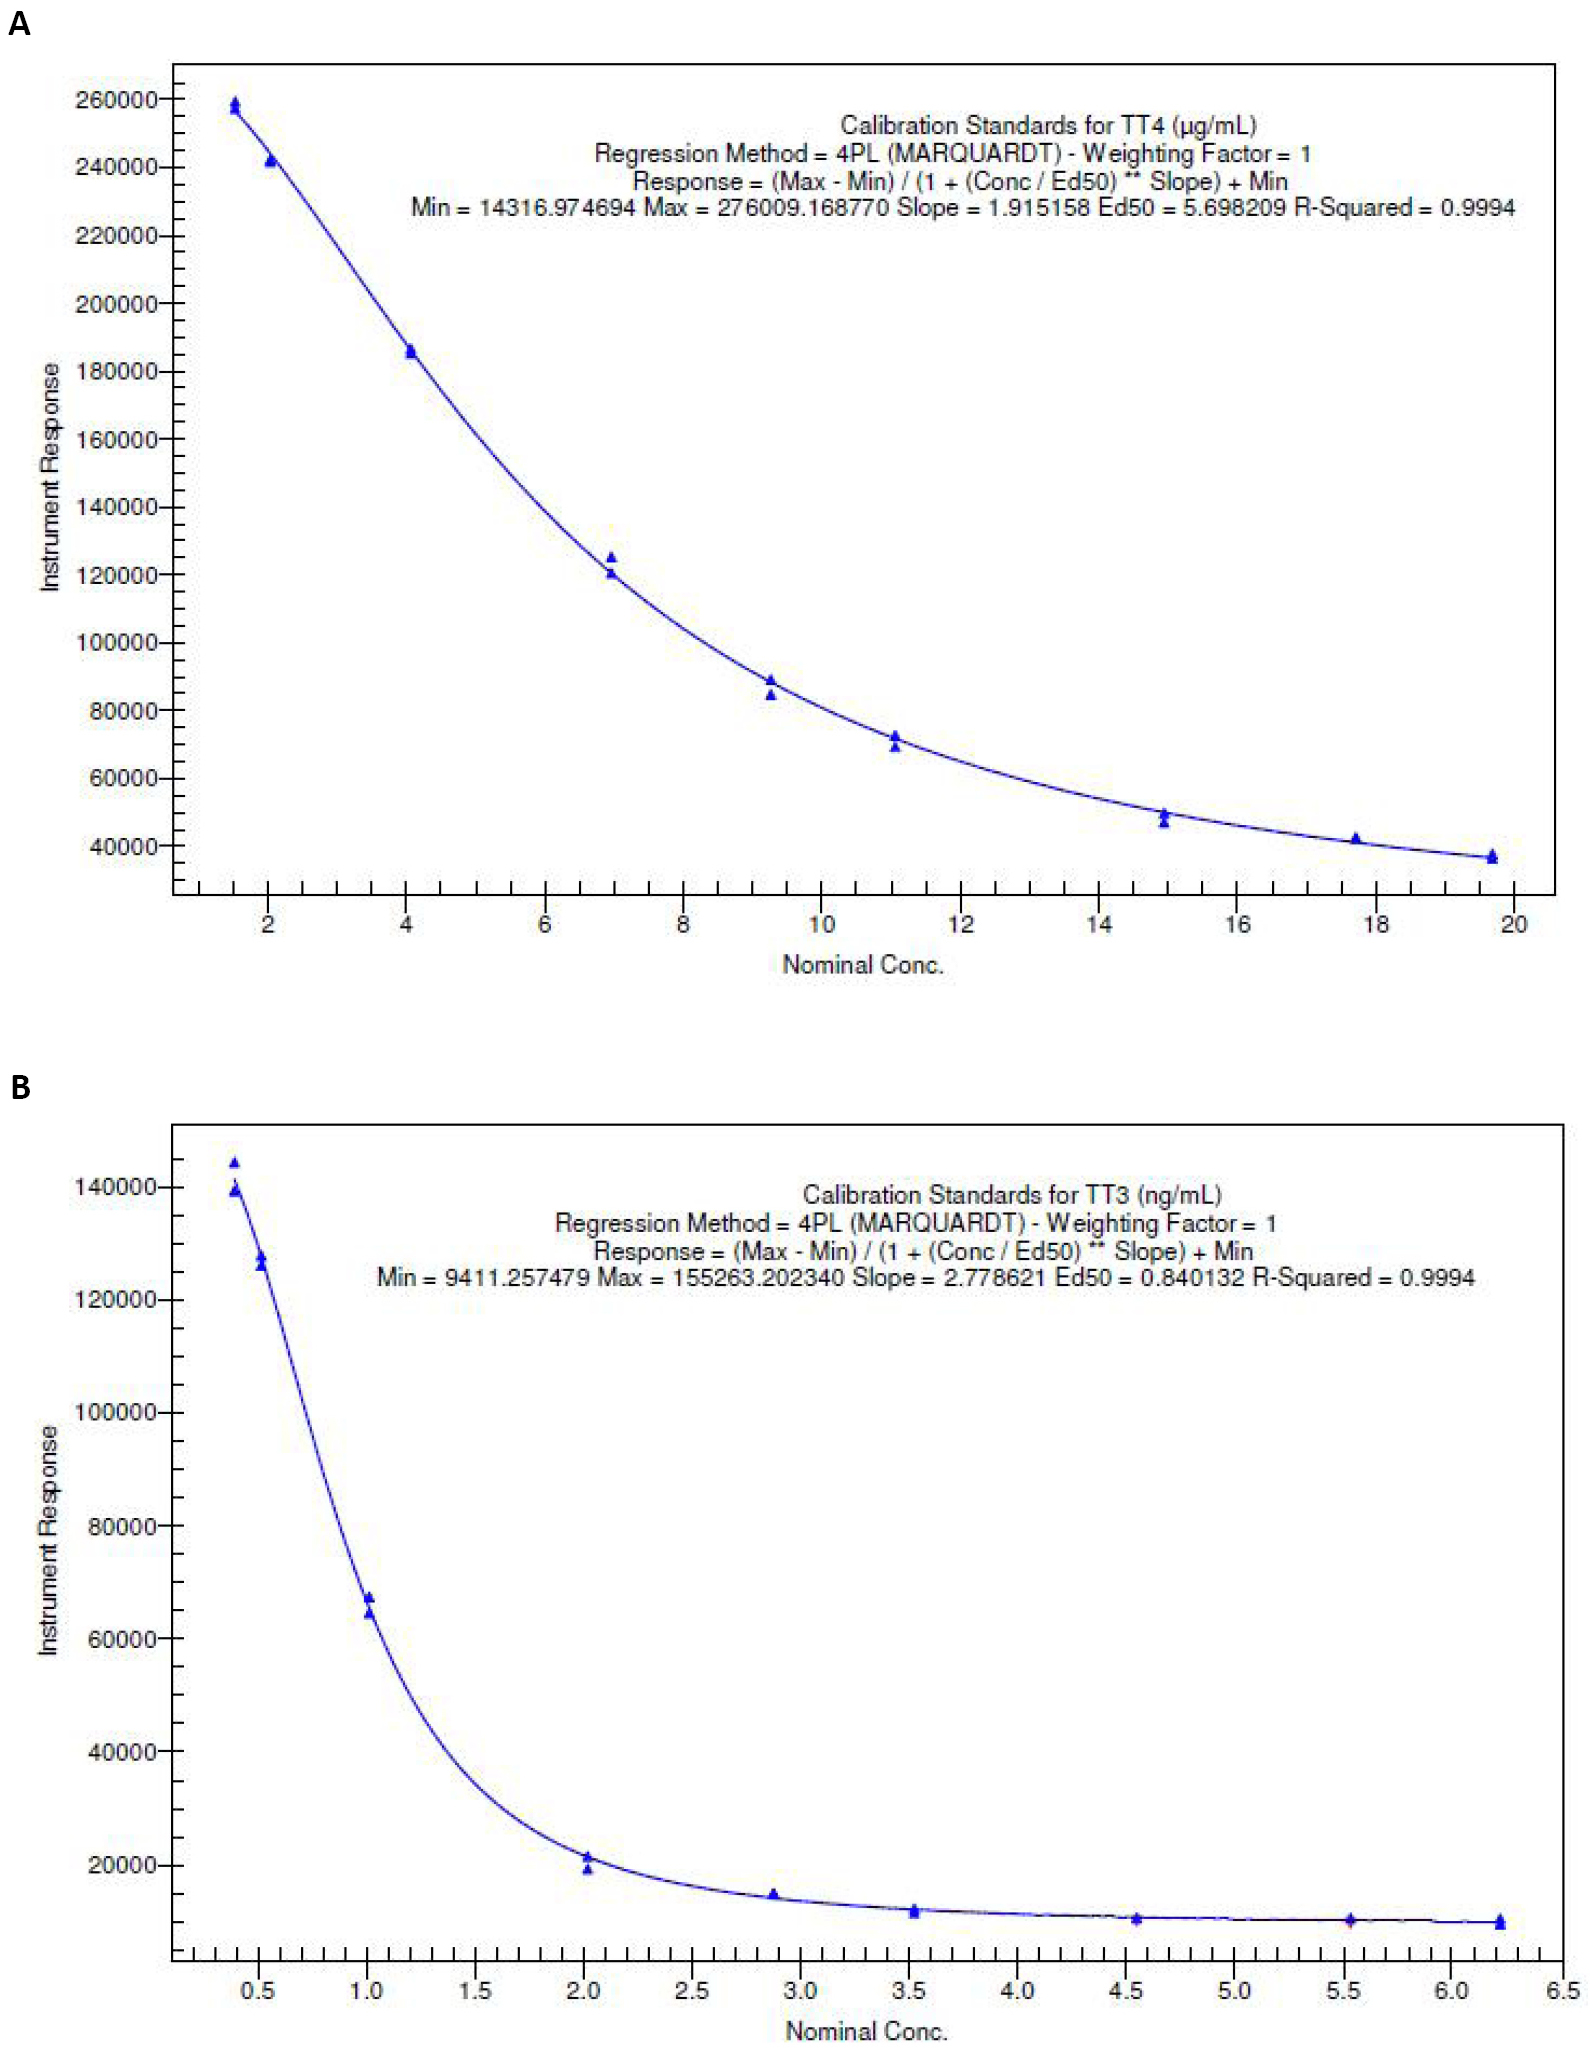
Figure 2. Representative calibration curve of levothyroxine and liothyronine over a concentration range from 2.030 to 17.721µg/dL and 0.498 to 5.621ng/mL, respectively. A: Representative calibration curve of TT3 over a concentration range from 0.498-5.621ng/mL; B: Representative calibration curve of TT4 over a concentration range from 2.030-17.721µg/dL.
3.2 Stability
The stability of the analyte (s) in human serum, under different temperatures and time duration, was investigated. For short term stability (Bench top) determination, stored serum aliquots were thawed and kept at room temperature for around 21h. Serum samples containing known concentrations of T3 and T4 were subjected to five freeze-thaw cycle to ascertain freeze-thaw stability. The freeze-thaw stability was evaluated at the end of the fifth cycle, comparing with values of freshly prepared samples. The calculated values of this stability (test) samples showed no apparent changes in concentration. T3 and T4 were stable in diluent solution at 2°C to 8°C for 16 days.
Long-term stability in biological matrix kept at -65°C was assessed over a period of 85 days using two different concentrations of T3 and T4. Both analytes were stable in serum when stored at -65°C in polypropylene tubes for at least 85 days. Stability of T3 and T4 compounds was found to be within ±15% in above processed conditions (Table 3).
Table 3. Stabilities for TT3 & TT4 in Human Serum
|
TT3 |
TT4 |
||
|
% Bias |
|||
|
LQC |
HQC |
LQC |
HQC |
Bench top (21h at 25°C),(n=6) |
1.50 |
4.99 |
1.02 |
2.25 |
Freeze-thaw (5-Cycle),(n=6) |
2.70 |
6.42 |
1.87 |
0.76 |
Refrigerator stability (44h at -2-8 °C),(n=6) |
2.26 |
2.63 |
5.11 |
2.69 |
Long term (85 days at -65°C),(n=6) |
1.92 |
4.49 |
2.20 |
1.43 |
|
%Change |
|||
Stock solution stability |
-1.47% |
0.34% |
1.2% |
1.6% |
3.3 Method Application
This assay method was also employed to analyze T3 and T4 in serum samples from male volunteers after administrating a single dose of 100µg (5×20µg tablet) of T3 under fasting condition. The Cmax and area under curve parameters have been presented and are comparable of the test and reference formulation (Table 4).
Table 4. Pharmacokinetic Parameters for TT3 in Human Plasma under Fasting Condition for 20mcg (5×20mcg tablet) Dose
Fasting Condition |
TT3 |
|
Test |
Reference |
|
Cmax (ng/mL) |
3.975±0.874 |
4.601±0.883 |
Tmax (h) |
2.938 |
2.156 |
n |
16 |
16 |
Notes: Cmax, Peak concentration; Tmax, Peak time.
3.3.1 Incurred Sample Reanalysis (ISR)
ISR is the way to assess any bioanalytical method reproducibility for the unknown samples and numerous of regulatory recommendations and various publications suggest repeat of random study samples as the incurred samples[18-26]. A validated method, which is reproducible and shows satisfactory data of long-term stability of drug in matrix, may not adequately indicate the stability and reproducibility of actual subject samples (incurred samples). Individual subject matrix variability, sample heterogeneity, metabolites back converting to the parent species, protein binding differences in the subject samples and matrix effects, are the factors that can affect both the reproducibility and accuracy of the analyte concentration determined in incurred samples.
Hence, the suitability of the bioanalytical methods cannot solely rely on surrogate QC samples alone; demonstration and proper evaluation of incurred sample reproducibility and stability is essential to produce a reliable study data. In the bio-study, 10% of samples (from the vicinity of Tmax and elimination phase) were randomly selected for incurred samples reanalysis for both the compounds (T3 and T4).
Out of 10% of incurred samples, 99% samples met (data not shown) the acceptance criteria (The percent difference between the concentration obtained for the initial analysis and the concentration measured during ISR should be within ±20% of the mean of the two concentrations for at least two thirds (67%) of ISR results) which demonstrate the reproducibility of method and stability of compound in the serum matrix.
4 DISCUSSION
Before the initiation of our planned development work, while going through the literature on T3 and T4, endogenous nature of T3 and T4 was noticed. Selection of analytical tool for the quantification was the main challenge as there were two analytical instruments present (LC-MS/MS and Architect I 10000). Challenge on LC-MS/MS analysis was associated with endogenous levels of T3 and T4, which were interfering with actual retention time of these compounds. Due to this interference problem, analysis on LC-MS/MS was ruled out. The remaining analytical instrument option was Architect I 10000 where analysis was to be performed in serum/plasma based on the antigen and antibody relationship. Debate on choosing plasma vs. serum was concluded in the FDA document[6] where justification to use serum was acceptable. Architect I 10000 being a diagnostic equipment has got many limitations such as (1) limited analytical measurement range (AMR), (2) insufficient number for CC standard and QC samples kits. AMR range was discussed with vendor (Abbott) because the document claimed to have AMR range from 0.2 to 8ng/mL for T3 whereas upon testing with actual samples, it was found to be less than 6.5ng/mL. Several communications/telecommunications were exchanged with vendor for the reason for this deviation, but they could not come up with any justification except one where they said equipment is meant for diagnostic purpose in humans and the level will never shoot up to beyond 5ng/mL. Similar AMR limitation was seen for T4 where the document claimed to have AMR range from 1 to 24µg/dL for T3 whereas upon investigation with actual samples it was found to be less than 18µg/dL. Regulatory requirement[21,22] of at-least six non zero calibration standards was also a limitation with the Abbott equipment as the readymade kits provided by them only contained two-point CC standards and three-point QC samples.
After rigorous brain storming between internal technical team, the problem of limited AMR and six non-zero standard were resolved by the employment of WATSON LIMS quantification software where the CMIA output data generated in RLUs were exported into WATSON LIMS and the regression was performed using four parameters logistic (Marquardt) method (non-linear regression method), with weighing factor 1 (none). Reliable concentration values were observed in WATSON LIMS for those concentration where CMIA was not able to sense due to its limitation (showing value beyond AMR range) and this happened because of the quantification ability of the WATSON software using CMIA raw data.
Anchor points inclusion in the CC standards were very useful and have also been suggested by regulatory guidelines[21,22]. The benefit of adding anchor points was to ensure the actual CC standards met the acceptance criteria whereas the anchor points (also called terminal points) may or may not meet acceptance criteria. There was no boundation, from regulatory guidance, for these anchor points to meet the acceptance criteria meant for CC standards.
Basal level in human serum for T3 range from 0.2 to1.0ng/mL and for T4 range from 1.8 to 5.6µg/dL. These endogenous levels were removed from serum using activated charcoal followed by vortexing and incubation. Actual recovery volume of serum after stripping with charcoal was 40% which means only 60% of the serum volume was lost with this stripping procedure.
This stripped serum was employed for the preparation of seven non-zero CC standards apart from anchor points and five QC samples. These CC standards and QC samples were used for development, validation and study sample assessment. The CC standards obtained from vendor’s kit were used for equipment calibration only and the QC sample provided in vendor’s kit was used to monitor the equipment response on daily basis. The kit CC-QC samples were not used for any quantification purpose.
To assess the impact of stripped serum vs. unstripped serum behavior, matrix effect experiment was performed wherein CC was prepared in stripped serum whereas the QC samples were prepared in unstripped serum. QC samples in triplicate were analyzed against the CC standards. Matrix effect results suggested absence of any matrix effect. Parallelism was the another experiment performed to see the dilution linearity wherein samples from Cmax region were selected and diluted serially and analyzed against a CC standard prepared in stripped serum[22]. Result of parallelism experiment suggested absence of any difference between stripped and unstripped serum. Other validation experiments like sensitivity, precision and accuracy batches, ruggedness, robustness, stability were performed as per the recommended regulatory guidelines and all these experiments met the acceptance criteria.
The continued reliability of ISR in regulatory submissions of bioanalytical data has been recently reviewed. The importance of ISR has now also been extended to discovery bioanalysis in order to understand if method issues do not lead to wrong choice of clinical candidates for development. In this regard, the newly developed method was subjected to ISR analysis and the ISR values were found to be remarkably close to the original values, supporting the validity of the pharmacokinetic data generated using the simultaneous assay for TT3 and TT4.
The current guidelines (FDA-BMV, 2018) recommends conducting bioequivalence under both fasting and fed conditions[8]. We have done 20µg T3 tablet study under fasting condition only and baseline correction factor was applied to all subject concentration for TT3.
5 CONCLUSION
A rapid, sensitive and highly selective method for the simultaneous determination of TT3 and TT4 in serum has been developed, using CMIA technique. This newly developed assay method was used to conduct the bioequivalence study of T3 in healthy male volunteers who had received a single dose of 100µg (5×20µg) T3 tablet orally. The advantage of CMIA technique over LC-MS/MS is its ease of performance without any manual sample processing while maintaining the precision and accuracy (within 15%) of the method. Due to elimination of manual sample processing, steps like extraction of molecules using solvents are not required. This reduces the time of analysis by approximately 50%. At the same time chemical footprint of analysis is reduced leading to a more environment friendly experiment. This method is an excellent bioanalytical option for rapid quantification of TT3 and TT4 simultaneously in human serum.
No publication was available in public domain on the use of CMIA technique for bioequivalence study of TT3/TT4.
Acknowledgements
We are thankful to the bioanalytical and clinical laboratory staff who have supported the bioanalytical aspects during method development, validation and clinical sample analysis.
Conflicts of Interest
The authors declared that there was no conflict of interest with respect to the reported research and contents of the manuscript.
Author Contribution
Authors were the project managers for the entire studies.
Abbreviation List
AMR, Analytical measurement range
CC, Calibration curve
Cmax, Peak concentration
CMIA, Chemiluminescence micro particle immunoassay
CV (%), Coefficient of varience
FDA, Food and Drug Administration
GC-MS, Gas chromatography mass spectrometry
HPLC, High performance liquid chromatography
HQC, Higher quality control
ISR, Incurred sample reanalysis
LAP, Lower anchor point
LC-MS, Liquid chromatography mass spectrometry
LOQ, Limit of quantification
LQC, Lower quality control
MQC, Medium quality control
PA, Precision and accuracy
QC, Quality control
RLU, Relative light unit
rpm, Rotation per minute
T3, Liothyronine
T4, Levothyroxine
Tmax, Peak time
TT3, Total liothyronine
TT4, Total levothyroxine
UAP, Upper anchor point
ULOQ, Upper limit of quantification
USFDA, United States Food and Drug Administration
References
[1] Mondal S, Raja K, Schweizer U et al. Chemistry and biology in the biosynthesis and action of thyroid hormones. Angew Chem Int Ed, 2016; 55: 7606-7630. DOI: 10.1002/anie.201601116
[2] Taylor PN, Albrecht D, Scholz A et al. Global epidemiology of hyperthyroidism and hypothyroidism. Nat Rev Endocrinol, 2018; 14: 301-316. DOI: 10.1038/nrendo.2018.18
[3] Mandel SJ, Brent GA, Larsen PR. Levothyroxine therapy in patients with thyroid disease. Ann Intern Med, 1993; 119: 492-502. DOI: 10.7326/0003-4819-119-6-199309150-00009
[4] Lum SM, Nicoloff JT, Spencer CA et al. Peripheral tissue mechanism for maintenance of serum triiodothyronine values in a thyroxine-deficient state in man. J Clin Invest, 1984; 73: 570-575. DOI: 10.1172/JCI111245
[5] Kocic I, Homsek I, Dacevic M et al. An investigation into the influence of experimental conditions on in vitro drug release from immediate-release tablets of levothyroxine sodium and its relation to oral bioavailability. AAPS Pharm Sci Tech, 2011; 12: 938-948. DOI: 10.1208/s12249-011-9660-8
[6] USFDA. Liothyronine sodium tablets, center for drug evaluation and research approval package for: Application number: Anda 90-097, 2009. Accessed 2022. Available at https://www.accessdata.fda.gov/drugsatfda_docs/anda/2009/090097Orig1s000.pdf
[7] USFDA. Clinical pharmacology and biopharmaceutics review, NDA: 21-210. Accessed 2022. Available at https://www.accessdata.fda.gov/drugsatfda_docs/nda/2000/21210_Unithroid_clinphrmr.pdf
[8] USFDA. Nonbinding recommendations draft guidance on liothyronine sodium. Accessed 2022. Available at https://www.accessdata.fda.gov/drugsatfda_docs/psg/Liothyronine%20Sodium_draft_Oral%20tab_RLD%2010379_RC12-12.pdf
[9] USFDA. Nonbinding recommendations draft guidance on levothyroxine sodium. Accessed 2022. Available at https://www.accessdata.fda.gov/drugsatfda_docs/psg/Levothyroxine_Sodium%20capsules_NDA%20021924_RC%20Oct%202018.pdf
[10] Chopra IJ, Santini F, Hurd RE et al. A radioimmunoassay for measurement of thyroxine sulfate. J Clin Endocrinol Metab, 1993; 76: 145-150. DOI: 10.1210/jcem.76.1.8421080
[11] Shah RB, Bryant A, Collier J et al. Stability indicating validated HPLC method for quantification of levothyroxine with eight degradation peaks in the presence of excipients. Int J Pharm, 2008; 360: 77-82. DOI: 10.1016/j.ijpharm.2008.04.018
[12] Kazemifard AG, Moore DE, Aghazadeh A. Identification and quantitation of sodium-thyroxine and its degradation products by LC using electrochemical and MS detection. J Pharm Biomed Anal, 2001; 25: 697-711. DOI: 10.1016/S0731-7085(01)00370-3
[13] Dutt R, Malik KC, Karwa M et al. Development and validation of UPLC-MS/MS method for rapid simultaneous determination of levothyroxine and liothyronine in human serum. J Drug Delivery Ther, 2020; 10: 176-181. DOI: 10.22270/jddt.v10i3-s.4189
[14] Wang D, Stapleton HM. Analysis of thyroid hormones in serum by liquid chromatography tandem mass spectrometery. Anal Bioanal Chem, 2010; 397: 1831-1839. DOI: 10.1007/s00216-010-3705-9
[15] Hantson AL, De Meyer M, Guérit N. Simultaneous determination of endogenous and 13C-labelled thyroid hormones in plasma by stable isotope dilution mass spectrometry. J Chromatogr B, 2004; 807: 185-192. DOI: 10.1016/j.jchromb.2004.03.055
[16] De Brabandere VI, Hou P, Stöckl D et al. Isotope dilution-liquid chromatography/electrospray ionization-tandem mass spectrometry for the determination of serum thyroxine a potential reference method. Rapid Commun Mass Spectrom, 1998; 12: 1099-1103. DOI: 10.1002/(SICI)1097-0231(19980831)12:16<1099::AID-RCM290>3.0.CO;2-J
[17] Thienpont LM, Fierens C, De Leeheer AP et al. Isotope dilution-gas chromatography/mass spectrometry and liquid chromatography/electrospray ionization-tandem mass spectrometry for the determination of triiodo-L-thyronine in serum. Rapid Commun Mass Spectrom, 1999; 13: 1924-1931. DOI: 10.1002/(SICI)1097-0231(19991015)13:19<1924::AID-RCM734>3.0.CO;2-U
[18] Giri P, Patel N, Joshi V et al. Incurred sample reanalysis in drug discovery bioanalysis. Biomed Chromatogr, 2019; 33: e4430. DOI: 10.1002/bmc.4430
[19] Kall MA, Michi M, van der Strate B et al. Incurred sample reproducibility: 10 years of experiences: Views and recommendations from the European Bioanalysis Forum. Bioanal, 2018; 10: 1723-1732. DOI: 10.4155/bio-2018-0194
[20] Vazvaei F. A look back at the incurred sample reanalysis. Bioanal, 2018; 10: 1711-1713. DOI: 10.4155/bio-2018-0263
[21] Guidance for industry bioanalytical method validation. Accessed 2022. Available at https://www.fda.gov/media/70858/download
[22] Guideline on bioanalytical method validation. Accessed 2022; Available at https://www.ema.europa.eu/en/documents/scientific-guideline/guideline-bioanalytical-method-validation_en.pdf
[23] Dubey NK, Haq KU, Fozdar BI. Overcoming the charged ion competition in triple quad chemical ionization ion source for estimation of celecoxib in biological matrix and its application to bioequivalence study. Drug Res, 2019; 69: 621-629. DOI: 10.1055/a-0983-1303
[24] Dubey NK, Fozdar BI. Interconversion from N-desmethyl clomipramine to clomipramine and its impact on a bioequivalence study. Sep Sci Plus, 2018; 1: 714-725. DOI: 10.1002/sscp.201800113
[25] Dubey NK, Jain P, Fozdar BI. Sensitive and rapid simultaneous quantitation of raloxifene and its two major active metabolites 4-glucuronide raloxifene and 6-glucuronide raloxifene in healthy volunteers using a liquid chromatography coupled with triple quadruple mass spectrometer. Int J Pharm Sci Res, 2020; 11: 3392-3402. DOI: 10.13040/IJPSR.0975-8232.11(7).3392-02
[26] Dubey NK. Sensitive and rapid simultaneous quantitation of leucovorin and its major active metabolite 5-methyl-tetrahydrofolate in human plasma using a liquid chromatography coupled with triple quadruple mass spectrometry. Biomed Chromatogr, 2022; 36: e5299. DOI: 10.1002/bmc.5299
Copyright © 2023 The Author(s). This open-access article is licensed under a Creative Commons Attribution 4.0 International License (https://creativecommons.org/licenses/by/4.0), which permits unrestricted use, sharing, adaptation, distribution, and reproduction in any medium, provided the original work is properly cited.


