Hexagonal Lead Ferrite Magnetic Separation Catalysts: Synthesis, Optical Characterization, Ultrasonic Catalytic Activity and Performance Prediction
Xiangyu Chen1,2, Hao Liu1,2, Maoyuan Li 1,2, Shifa Wang1,2*
1School of Electronic and Information Engineering, Chongqing Three Gorges University, Chongqing, China
2Chongqing Key Laboratory of Geological Environment Monitoring and Disaster Early-warning in Three Gorges Reservoir Area, Chongqing Three Gorges University, Chongqing, China
*Correspondence to: Shifa Wang, PhD, Research Fellow, Chongqing Key Laboratory of Geological Environment Monitoring and Disaster Early-warning in Three Gorges Reservoir Area, Chongqing Three Gorges University, Shalong Road 7802, Wanzhou District, Chongqing 404000, China; Email: wangshifa2006@yeah.net
Objective: This study was performed to explore a new method to synthesize PbFe12O19 magnetic separation catalysts and analyze its ultrasonic catalytic activity for the degradation of rhodamine B (RhB) dye under ultrasonic vibration.
Methods: A polyacrylamide gel method was developed to synthesize the hexagonal lead ferrite (PbFe12O19) magnetic separation catalysts with different Fe/Pb molar ratios and sintering temperatures.
Results: The phase structure and composition of PbFe12O19 magnetic separation catalysts altered with the change in the Fe/Pb mole ratio and sintering temperature. The color properties, energy band values and degradation percentages of PbFe12O19 magnetic separation catalysts for the degradation of RhB dye under ultrasonic vibration were linearly independent of Fe/Pb mole ratio and sintering temperature. The maximum degradation percentage of 78.99% for the PbFe12O19 magnetic separation catalysts for the removal of RhB from wastewater was found at 2g/L of initial catalyst concentration, 50mg/L of initial dye concentration, and 180min of vibration time.
Conclusion: The PbFe12O19 magnetic separation catalysts exhibited high catalytic activity for the degradation of RhB dye under ultrasonic vibrations. Based on the experiment parameters, a neural network model was established to predict the effect of synthesis parameters on the degradation percentage of PbFe12O19 catalysts. This work further confirmed that the neural network algorithm was available to predict the ultrasonic catalytic activity of semiconductor materials.
Keywords: PbFe12O19, polyacrylamide gel method, neural network model, rhodamine B, degradation percentage
Catalysts are preferred materials for the degradation of organic dye wastewater due to their high specific surface area, high charge transfer and separation efficiency, and high degradation activity[1-6]. Depending on the different degradation methods of organic dyes, various catalysts, including the photocatalysts, thermal catalysts, electrocatalysts, piezoelectric catalysts, ultrasonic catalysts, and adsorbents have been developed to effectively use of various physical and chemical effects to degrade organic dyes[7-13]. Among these catalysts, ultrasonic catalyst is an efficient catalyst that uses the energy generated by ultrasonic vibration to promote the transfer and separation of electrons and holes inside the catalyst, which consequently results in oxidation or reduction reaction with dyes[14,15]. However, this technology is still rudimentary, so it is of great significance to explore a new ultrasonic catalyst and study its ultrasonic catalytic activity.
In addition to the effective degradation of organic wastewater, catalysts may also cause secondary pollution to water bodies[16,17]. To effectively utilize the degraded wastewater, catalysts and water must be efficiently separated[18]. Magnetic separation of catalyst and water using magnetic field is an effective way to solve the above issues[19-21]. Hexagonal lead ferrite (PbFe12O19) is a magnetic semiconductor material, which is often used in magnetic devices, magnetic recording medias, catalysts, and other related fields[22-25]. Moreover, the ultrasonic catalytic activity of PbFe12O19 has been sporadically. Therefore, using a special preparation method to synthesize PbFe12O19 and study its ultrasonic catalytic activity may provide technical guidance for the field of ultrasonic catalysis.
The polyacrylamide gel method is an effective method for the synthesis of metal oxide semiconductor materials by our research group[26-29]. Different morphologies and properties of metal oxide semiconductor materials can be obtained by adjusting and controlling the experimental parameters[30-32]. By collecting multiple experimental data, the establishment of reasonable models and prediction of the physical and chemical properties of semiconductor materials constitute a major development trend of material synthesis research. Through predicting the physical and chemical properties of semiconductor materials, the experimental cost can be greatly reduced. Artificial neural network algorithm model shows unique advantages in solving such problems because of its unique predictive function[33]. In the current research, the PbFe12O19 magnetic separation catalysts with different Fe/Pb molar ratios and sintering temperatures were prepared by a polyacrylamide gel method. The effects of different the Fe/Pb molar ratios and sintering temperatures on the physicochemical properties of PbFe12O19 magnetic separation catalysts were studied systematically. According to the nonlinear relationship between synthetic parameters and experimental results, an appropriate artificial neural network model was established to predict the physicochemical properties of PbFe12O19.
2 MATERIALS AND METHODS
2.1 Materials
Ferrous chloride tetrahydrate, lead acetate trihydrate, citric acid, glucose, acrylamide, N,N’-methylene diacrylamide, and rhodamine B (RhB) were purchased from Chengdu Aike Reagent Co., Ltd. All the above reagents were of analytical grade and were used without further purification.
2.2 Synthesize of PbFe12O19 Magnetic Separation Catalysts
Stoichiometric amounts of ferrous chloride tetrahydrate and lead acetate trihydrate were dissolved in the distilled water in turn to obtain a solution of 0.015mol/L with the total cations. To study the effect of Fe/Pb molar ratio on the phase purity of PbFe12O19 magnetic separation catalysts, the molar ratios of Fe/Pb were 2, 3, 4, 5, 6, 9 and 12, respectively. The Pb/Fe molar ratios of 2, 3, 4, 5, 6, 9 and 12 were labeled as samples S1, S2, S3, S4, S5, S6 and S7, respectively. After the above reagents were completely dissolved, 4.7282g citric acid, 20g glucose, 9.5958g acrylamide, and 1.9192g N,N’-methylene diacrylamide were added to the above solution in turn. The citric acid, glucose and N, N’-methylene diacrylamide were used as chelating agents and prevention of gel collapse during drying and a cross-linking agent. After all reagents were completely dissolved, the solution was heated to 80-100℃ to initiate the polymerization of acrylamide and N, N’-methylene diacrylamide to obtain a jelly-like gel. The jelly-like gel was then placed in a drying oven to dry at 120℃ for 24h. The final PbFe12O19 magnetic separation catalysts were obtained by sintering the xerogel at different temperatures. The PbFe12O19 magnetic separation catalysts with different Fe/Pb molar ratios including 2, 3, 4, 5, 6, 9 and 12 and calcined at 600, 700, 800, 900, 1000 and 1100℃ are labeled as S1-600, S2-600, S3-600, S4-600, S5-600, S6-600, S7-600, S1-700, S2-700, S3-700, S4-700, S5-700, S6-700, S7-700, S1-800, S2-800, S3-800, S4-800, S5-800, S6-800, S7-800, S2-900, S2-1000, S2-1100, S5-900, S5-1000, S5-1100, S1-1100, S3-1100, S4-1100, S6-1100 and S7-1100, respectively. The preparation flow chart of PbFe12O19 magnetic separation catalysts prepared by the polyacrylamide gel method with different Fe/Pb molar ratios is shown in Figure 1.
|
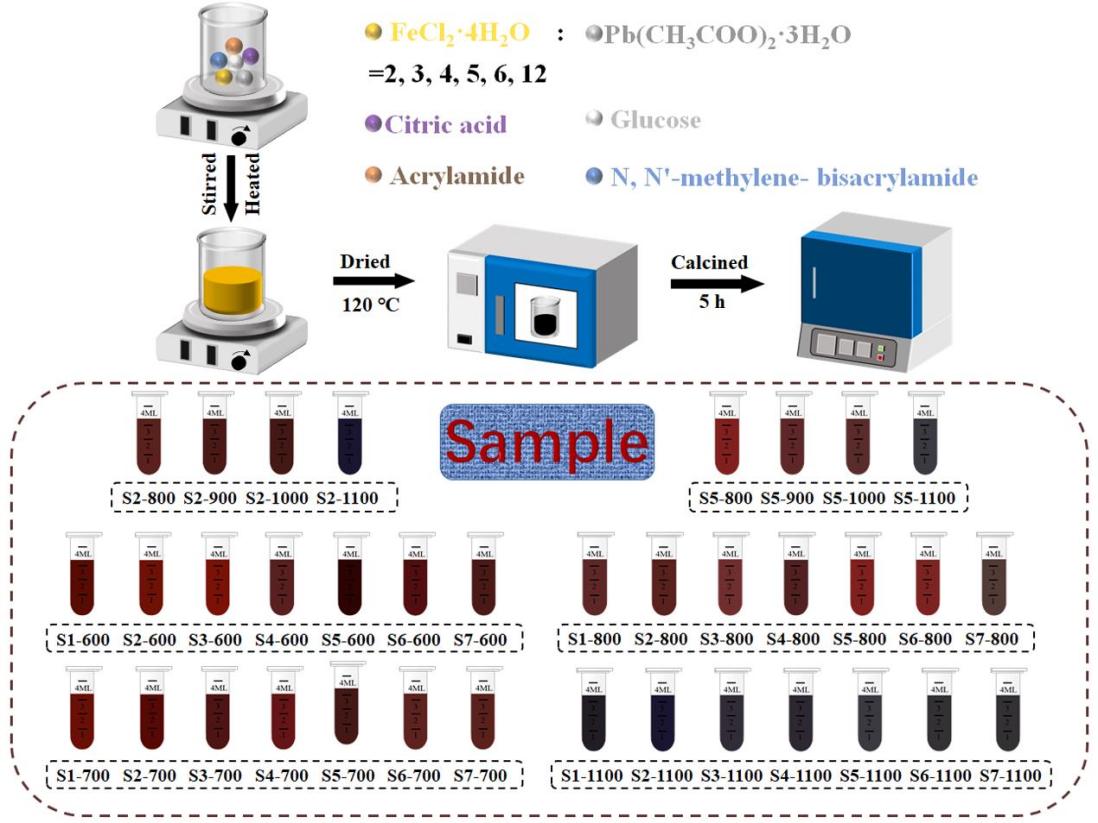
Figure 1. Preparation flow chart of PbFe12O19 magnetic separation catalysts prepared by the polyacrylamide gel method with different Fe/Pb molar ratios.
2.3 Material Characterization
The crystal structure and phase purity of PbFe12O19 magnetic separation catalysts were recorded using a DX-2007BH X-ray diffractometer (XRD). Fourier transform infrared (FTIR) spectra of PbFe12O19 magnetic separation catalysts in the range 400-4000cm-1 were recorded using a FTIR-650 spectrometer. Ultraviolet-visible (UV-Visible) diffuse reflectance spectra of PbFe12O19 magnetic separation catalysts were measured by a UV1800 UV-Visible spectrophotometer. The charge state of PbFe12O19 magnetic separation catalysts was characterized by a KRATOS X SAM 800 X-ray photoelectron spectrometer (XPS). The surface morphology of PbFe12O19 magnetic separation catalysts was characterized by a scanning electron microscopy (SEM) and transmission electron microscopy (TEM). The magnetic properties of PbFe12O19 magnetic separation catalysts were measured by a superconducting quantum interference device.
2.4 Ultrasonic Catalytic Experiments
The ultrasonic catalytic experiments of PbFe12O19 magnetic separation catalysts for the degradation of RhB were performed using a UV1800 UV-Visible spectrophotometer. The initial dye concentration and catalyst content were 50mg/L and 2.0g/L, respectively. The dye solution was absorbed for 30min in the darkroom. Subsequently, the ultrasonic cleaning instrument with the frequency of 40kHz and power of 180W was turned on to generating ultrasonic vibration. After the elapse a small amount of dye solution was used for the examination of dye absorbance. The whole ultrasonic catalytic experiment was completed until 180min. The absorbance of dye at different time intervals was obtained by a UV1800 UV-Visible spectrophotometer. The degradation percentage of dye is defined as (A0-At)/A0), where A0 and At are the absorbance of dye before and after irradiation, respectively.
3 RESULTS AND DISCUSSION
3.1 Phase Purity and Structure Analysis
The phase structure and purity of PbFe12O19 magnetic separation catalysts with different Fe/Pb molar ratios and sintering temperatures are shown in Figure 2. Figure 2A shows the XRD patterns of PbFe12O19 magnetic separation catalysts with a Fe/Pb molar ratio of 2. It was observed that all samples exhibited a mixed phase with low crystallinity including rhombohedral Fe2O3, PbO (), or PbFe4O7 (). With the increase in sintering temperature, the diffraction peak intensity of the host lattice gradually increased, while the diffraction peaks of PbO disappeared. A similar phenomenon was observed when the Fe/Pb molar ratio was 3, as shown in Figure 2B. Figure 2C shows the XRD patterns of PbFe12O19 magnetic separation catalysts with the Fe/Pb molar ratio of 4. The diffraction peak of PbFe4O7 was absent when the sintering temperature increased from 600℃ to 800℃. When the Fe/Pb molar ratio reached 5, the PbFe4O7 impurity disappeared, as shown in Figure 2D. When the Fe/Pb molar ratio exceeded 6, a pure rhombohedral Fe2O3 phase was observed above 600℃, as shown in Figure 2E-G. When the Fe/Pb molar ratio was 2, pure rhombohedral Fe2O3 could be obtained by increasing the sintering temperature to 1100℃, as shown in Figure 2H. For the Fe/Pb molar ratio of 6, the sintering temperature above 600℃ was pure rhombohedral Fe2O3 phase. Comparing the samples of Fe/Pb molar ratios of 2, 3, 4, 5, 6, 9 and 12, only the samples for the Fe/Pb molar ratios of 2, 3 and 4 did not obtain pure rhombohedral Fe2O3 at 800℃ (Figure 2A-G), and only the samples for the Fe/Pb molar ratios of 2 did not obtain pure rhombohedral Fe2O3 at 1100℃ (Figure 2H). With the increase in temperature, the lead loss was more serious, which requires validation by XPS characterization. Figure 2I shows the XRD refinement result of Sample S7-800. All the diffracted lines for Sample S7-800 were consistent with the standard JCPDS card no. 33-0664 (rhombohedral Fe2O3). The space group of rhombohedral Fe2O3 was R-3c (167). The XRD diffraction peaks of Sample S7-800 were consistent with those of PbFe12O19 reported in prior literature[25].
|

Figure 2. XRD patterns of PbFe12O19 magnetic separation catalysts. A: Samples S1-600, S1-700 and S1-800; B: Samples S2-600, S2-700 and S2-800; C: Samples S3-600, S3-700 and S3-800; D: Samples S4-600, S4-700 and S4-800; E: Samples S5-600, S5-700 and S5-800; F: Samples S6-600, S6-700 and S6-800; G: Samples S7-600, S7-700 and S7-800; H: Samples S1-1100, S2-1100, S3-1100, S4-1100, S5-1100, S6-1100 and S7-1100; I: AXRD refinement result of Sample S7-800. The pink, blood red, blue curves and the vertical lines represent the observed value, the theoretically calculated values, the difference between the observed value and theoretically calculated value, and the Bragg peaks, respectively.
Sözeri et al.[34] reported that the pure BaFe12O19 particles could be obtained by the citrate sol-gel combustion method with an initial Fe/Ba molar ratio of 4. Rostami et al.[35] synthesized the pure PbFe12O19 nanoparticles by the sol-gel method with the Fe/Pb molar ratio of 10. Thus, the influence of Fe/Pb molar ratio on the phase structure of PbFe12O19 cannot be ignored. In the case of high Pb content, the excess Pb ions could not coordinate with Fe ions to form PbFe12O19 but exist as PbO and PbFe4O7. During the process of high temperature sintering, the shortage of Pb in the system due to the volatilization of PbO gas in the reaction system causes the sample to show a phase that resembles Fe2O3. When the molar ratio of Fe/Pb reached 6 or above, Pb ions fully coordinated with Fe ions to form PbFe12O19. With the volatilization of PbO gas, a phase that resembles Fe2O3 was obtained by high temperature treatment.
The crystallite size (D) of PbFe12O19 magnetic separation catalysts was calculated by the Debye-Scherrer Equation (1) and the line broadening of the (104) diffraction peak.
|
Where k is the shape factor, the k value is 0.62. λ is the X-ray wavelength and θ is the Bragg diffraction angle. β is the full-width at half maximum (FWHM) on the basis of the pseudo-Voigt function[32]. The FWHM value of PbFe12O19 magnetic separation catalysts is a sum of the Gaussian and Lorentzian components.
Gaussian component:
|
Lorentzian component:
|
Sample |
(104) |
Crystallite Size (eV) |
||
d (Å) |
2θ (°) |
FWHM (°) |
||
Fe2O3 |
2.6994 |
0.181 |
45.285 |
|
S1-600℃ |
2.6993 |
50.597 |
||
S1-700℃ |
2.6993 |
33.162 |
46.838 |
|
S1-800℃ |
2.6993 |
33.160 |
0.140 |
58.547 |
S1-1100℃ |
2.6952 |
33.213 |
0.106 |
77.337 |
S2-600℃ |
2.6993 |
43.599 |
||
S2-700℃ |
2.6979 |
51.231 |
||
S2-800℃ |
2.6978 |
33.180 |
0.150 |
54.647 |
S2-900℃ |
2.6993 |
33.161 |
0.129 |
63.540 |
S2-1000℃ |
2.6986 |
33.170 |
0.146 |
56.143 |
S2-1100℃ |
2.6961 |
33.202 |
0.127 |
64.547 |
S3-600 ℃ |
2.7057 |
26.957 |
||
S3-700℃ |
2.7010 |
45.034 |
||
S3-800℃ |
2.7002 |
33.150 |
0.144 |
56.919 |
S3-1100℃ |
2.6967 |
33.194 |
0.149 |
55.016 |
S4-600℃ |
2.6964 |
30.934 |
||
S4-700℃ |
2.7008 |
38.845 |
||
S4-800℃ |
2.6986 |
33.170 |
0.126 |
65.054 |
S4-1100℃ |
2.6963 |
33.161 |
0.125 |
65.573 |
S5-600 ℃ |
2.7009 |
49.079 |
||
S5-700℃ |
2.7008 |
53.923 |
||
S5-800℃ |
2.6961 |
33.201 |
0.171 |
47.939 |
S5-900℃ |
2.6981 |
33.176 |
0.158 |
51.879 |
S5-1000℃ |
2.6980 |
33.178 |
0.131 |
62.572 |
S5-1100℃ |
2.6919 |
33.255 |
0.142 |
57.737 |
S6-600℃ |
2.7010 |
42.912 |
||
S6-700℃ |
2.7025 |
43.595 |
||
S6-800℃ |
2.6933 |
33.238 |
0.168 |
48.799 |
S6-1100℃ |
2.6976 |
33.183 |
0.134 |
61.172 |
S7-600℃ |
2.7011 |
42.912 |
||
S7-700℃ |
2.7010 |
33.139 |
40.981 |
|
S7-800℃ |
2.6961 |
51.557 |
||
2.6977 |
60.273 |
|||
3.2 FTIR Analysis
To further analyze the functional groups of PbFe12O19 magnetic separation catalysts, Figure 3 shows the FTIR spectra of PbFe12O19 magnetic separation catalysts. For all samples, two characteristic peaks at 3453 and 1638cm-1 were observed in the wavenumber range of 4000-1500cm-1, which could be assigned to the stretching vibration of O-H bond and the bending vibration of H-O-H bond for the absorbed water, respectively[34,36,37]. The peak at 2365cm-1 could be ascribed to the adsorbed carbon dioxide[37,38]. For the Samples S1 (Figure 3A), S2 (Figure 3B) and S3 (Figure 3C), two characteristic peaks at 1172 and 1122cm-1 appear for samples sintered below 800℃, which can be attributed to C-O stretching vibrations[37,38]. When excessive Pb ions were introduced into the reaction system, the characteristic peaks of C-O stretching vibrations emerged at low sintering temperatures due to the presence of more carboxyl groups in Pb acetate, which need to be completely removed at higher sintering temperatures. At a low temperature, almost all PbFe12O19 samples (Figure 3A-H) showed three characteristic peaks of 634, 533 and 458cm-1. The peaks at 533 and 458cm-1 corresponded to the Fe-O and Pb-O bonds from PbFe12O19 hexagonal ferrite, respectively[39-44]. The peak at 634cm-1 was attributed to Pb-O bond from PbO or PbFe4O7[45]. A characteristic peak at 442cm-1 was also observed in Samples S1-700 and S2-700, which was mainly attributed to the Fe-O bond in PbFe4O7. When the sintering temperature increased, the characteristic peak disappeared, indicating that high temperature led to the loss of lead ions. Figure 3I shows the FTIR spectrum of Fe2O3. It could be seen from the figure that the two characteristic peaks in the low wavenumber segment were obviously different from those of PbFe12O19. The lead loss in PbFe12O19 samples did not result in complete lead loss.
|
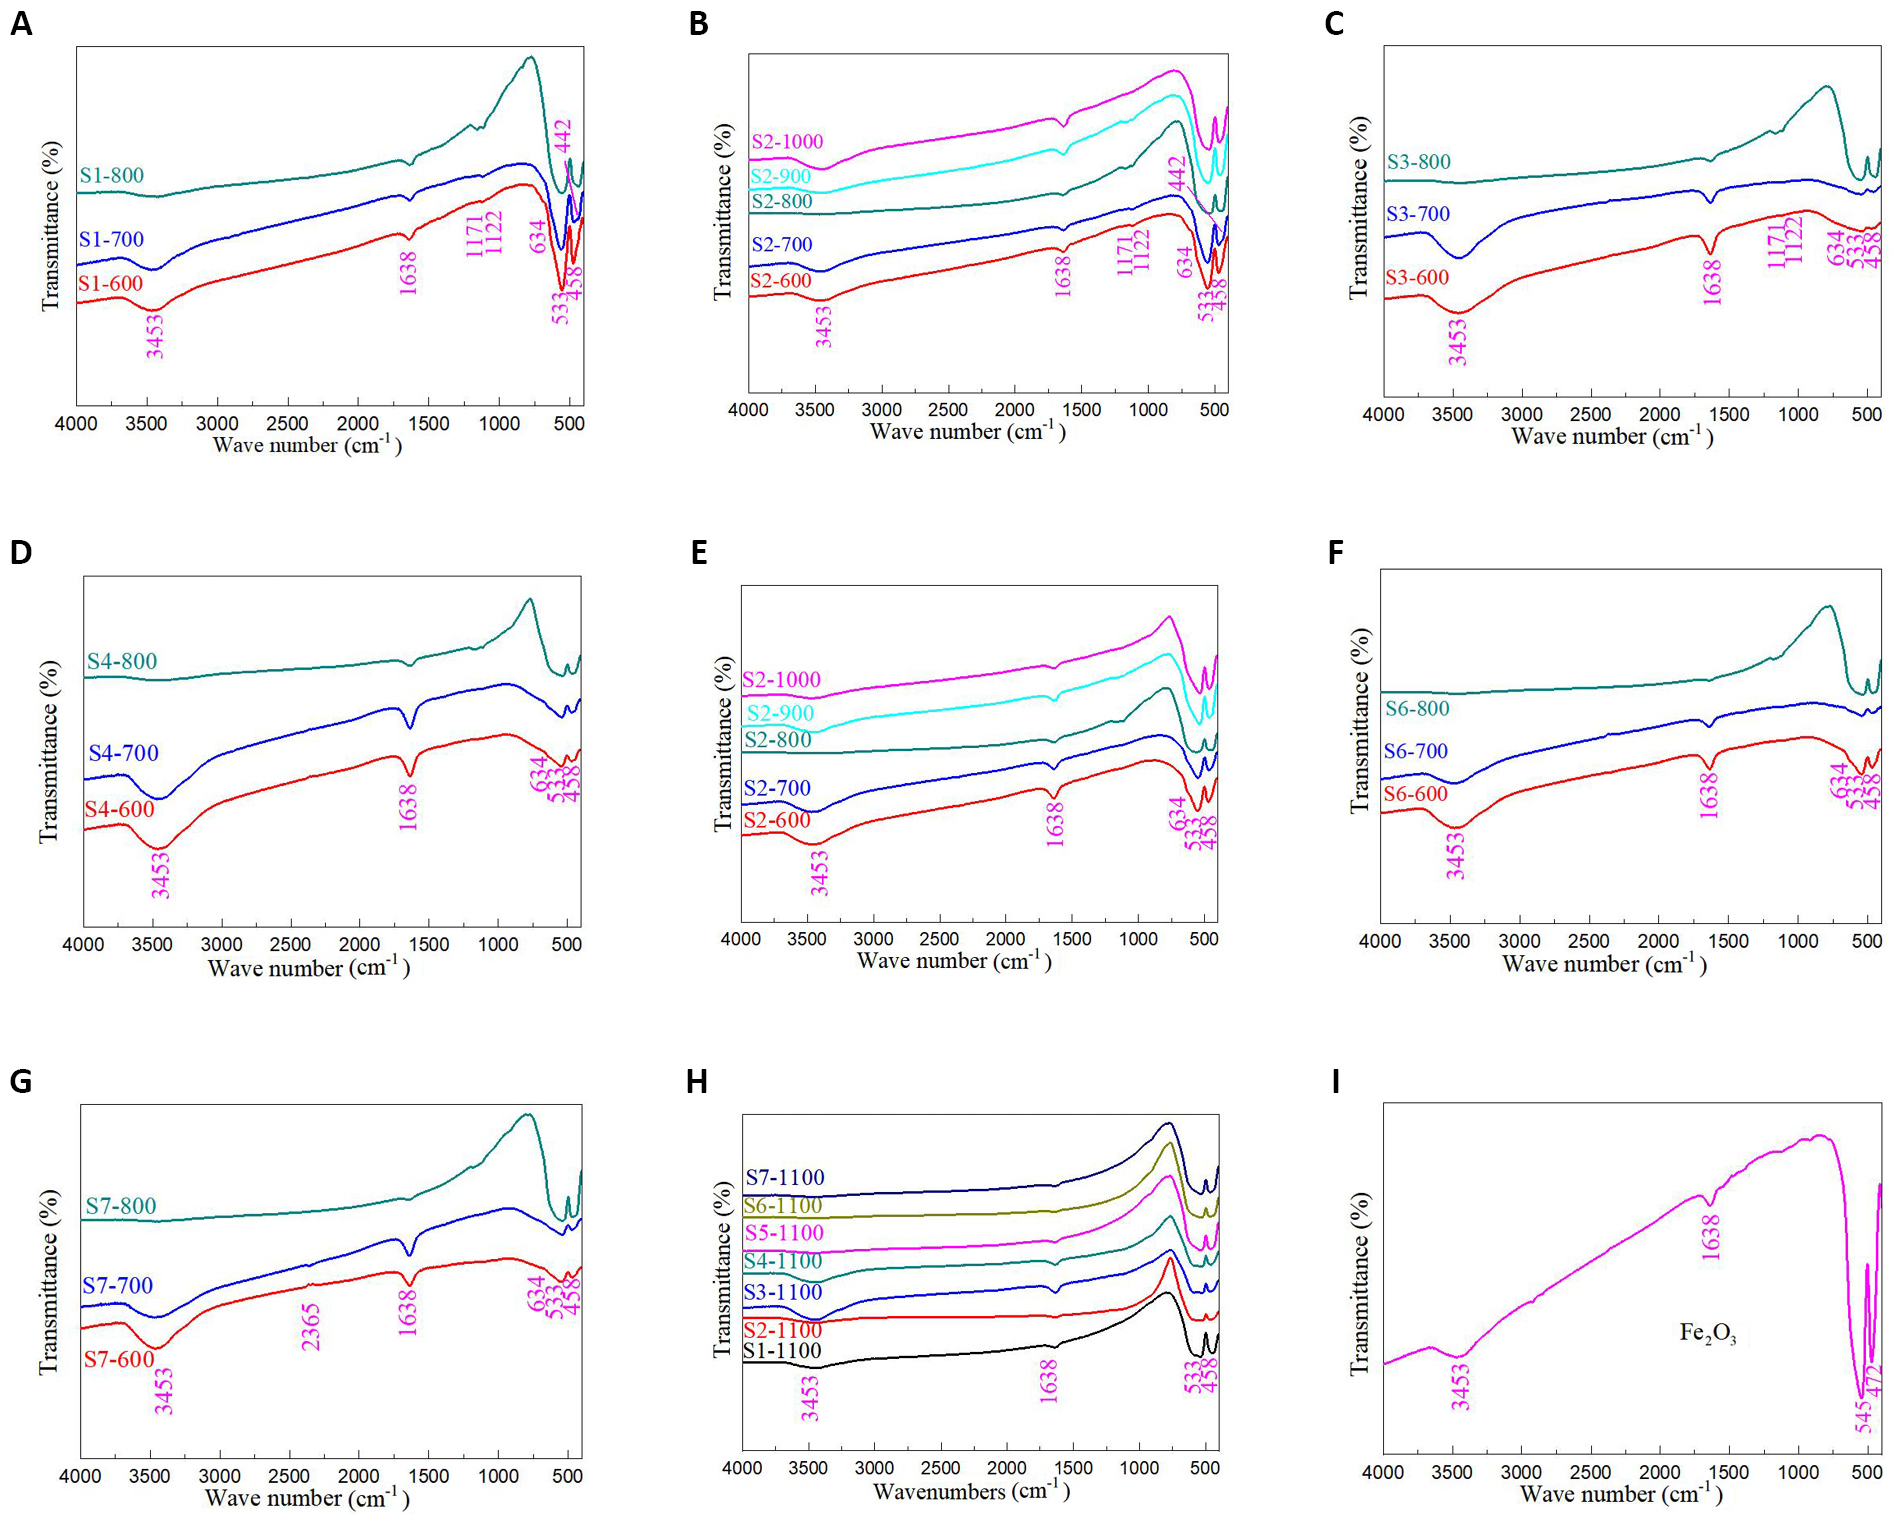
Figure 3. FTIR spectra of PbFe12O19 magnetic separation catalysts. A: Samples S1-600, S1-700 and S1-800; B: Samples S2-600, S2-700 and S2-800; C: Samples S3-600, S3-700 and S3-800; D: Samples S4-600, S4-700 and S4-800; E: Samples S5-600, S5-700 and S5-800; F: Samples S6-600, S6-700 and S6-800; G: Samples S7-600, S7-700 and S7-800; H: Samples S1-1100, S2-1100, S3-1100, S4-1100, S5-1100, S6-1100 and S7-1100; I: Fe2O3.
3.3 XPS Analysis
The chemical compositions, surface electronic states, and electronic energy levels of PbFe12O19 magnetic separation catalysts were studied by XPS, and the survey spectra, Pb 4d, Fe 2p, and O1s energy levels are shown in Figure 4. Figure 4A shows the survey spectra of PbFe12O19 magnetic separation catalysts, revealing the presence of C, Pb, Fe and O elements. The result indicates that the Samples S5-800, S2-1100, S5-1100, and S6-1100 exhibit high crystallinity and contain no other impurity elements due to the C peak from the XPS instrument[46]. It could be seen from the figure that the characteristic peaks of Pb elements in Samples S2-1100, S5-1100, and S6-1100 were weaker than those in Sample S5-800, indicating that Pb loss emerged in PbFe12O19 samples during high temperature sintering.
|
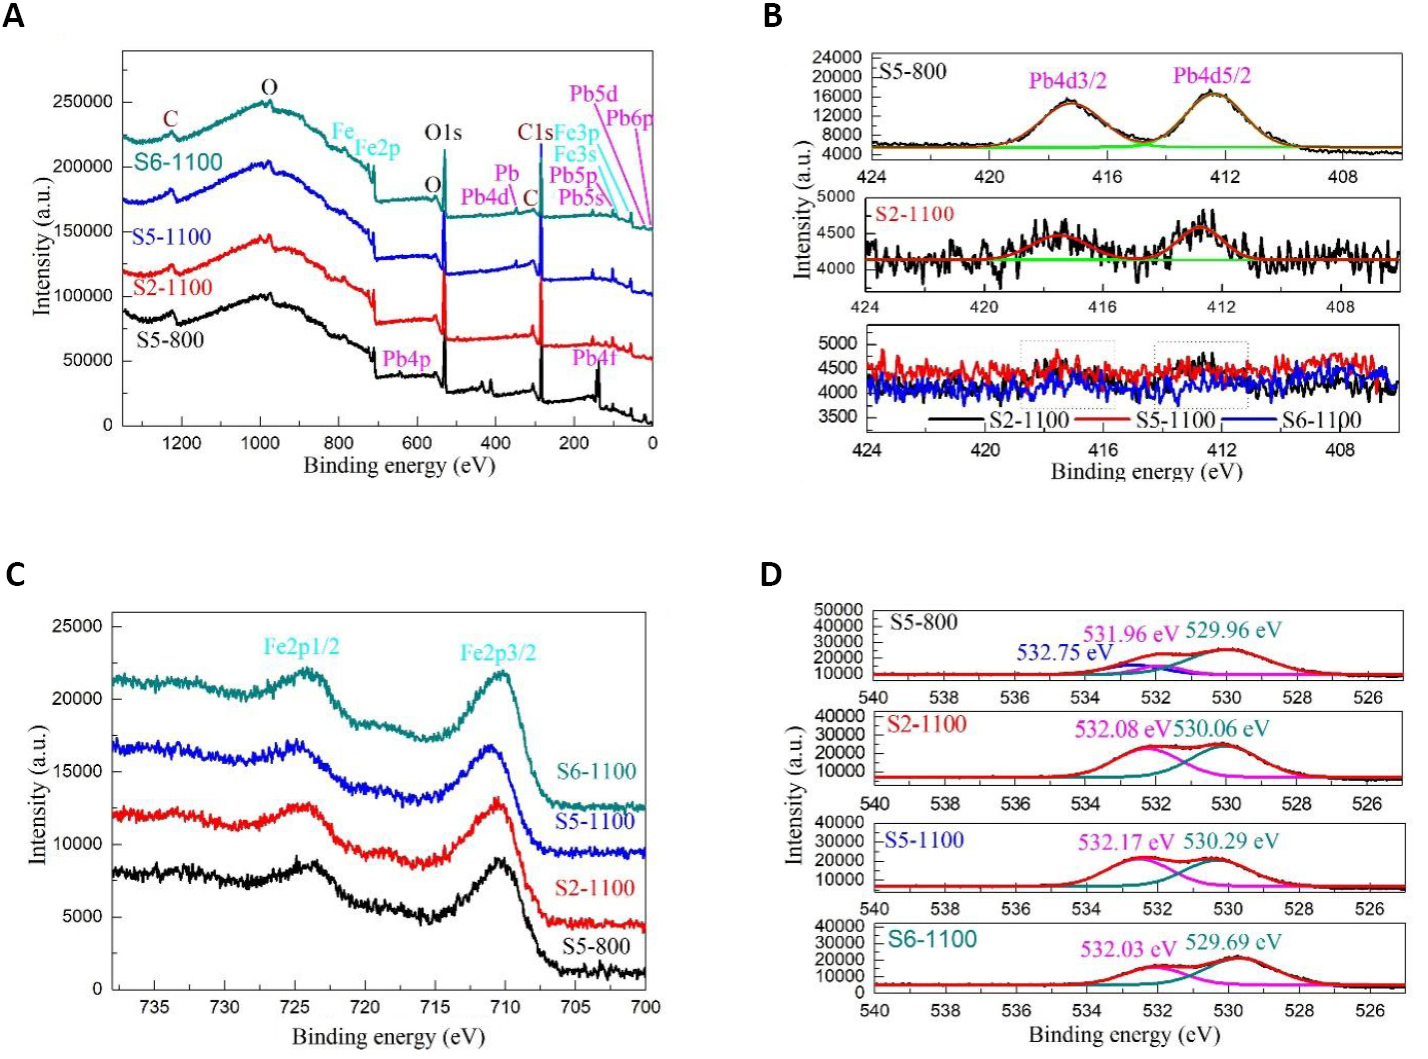
Figure 4. XPS spectra of Samples S5-800, S2-1100, S5-1100 and S6-1100. A: Survey spectra; B: Pb 4d energy level; C: Fe 2p energy level; D: O1s energy level.
The Pb 4d spectra of PbFe12O19 magnetic separation catalysts are presented in Figure 4B. Table 2 shows the XPS parameters of Samples S5-800, S2-1100, S5-1100, and S6-1100. As shown in Figure 4B, two characteristic peaks at 412.39-413.26 and 417.26-417.80eV were observed for the Pb 4d5/2 and Pb 4d3/2 from PbFe12O19, respectively. The characteristic peaks of Pb 4d in Samples S2-1100, S5-1100 and S6-1100 were characterized due to the obvious loss of lead in the high-temperature sintering process, which then results in an insignificant characteristic peak of Pb 4f.
Table 2. XPS Parameters of Samples S5-800, S2-1100, S5-1100 and S6-1100
Samples |
Pb4d (eV) |
Fe2p (eV) |
O1s (eV) |
||||
Pb4d5/2 |
Pb4d3/2 |
Fe2p1/2 |
|||||
S5-800 |
412.39 |
417.26 |
710.32 |
723.64 |
532.15 |
531.96 |
529.96 |
S2-1100 |
412.75 |
417.57 |
710.54 |
724.26 |
532.08 |
/ |
530.06 |
S5-1100 |
413.26 |
417.74 |
710.84 |
724.87 |
532.17 |
/ |
530.29 |
S6-1100 |
412.83 |
417.80 |
710.15 |
724.09 |
532.03 |
/ |
529.69 |
The high-resolution Fe 2p spectra of PbFe12O19 magnetic separation catalysts in Figure 4C show two major characteristic peaks at 710.15-710.84 and 723.64-724.87eV, with spin separation energy of 13.49eV, which is similar to a previous report of PbFe12O19 and can be assigned to the Fe 2p3/2 and Fe 2p1/2, respectively[47,48]. Figure 4D shows the O 1s spectra of PbFe12O19 magnetic separation catalysts. The peak of O 1s spectra for the Samples S5-800 could be resolved into three components, indicating that three types of oxygen species were present on the surface of Samples S5-800, while the Samples S2-1100, S5-1100 and S6-1100 only exhibited two peaks. The peak at the binding energy of 531.96eV was typical for lattice oxygen of PbFe12O19 magnetic separation catalysts. The peak located at highest binding energy of 532.03-532.17eV could be assigned to adsorbed oxygen. The peaks at 529.69-530.29eV could be ascribed to the lattice oxygen of Fe2O3. Thus, PbFe12O19 could also be written as (PbO)∙6(Fe2O3). When the sintering temperature further increased, the energy levels of lattice oxygen and adsorbed oxygen shifted to higher energy levels. The characteristic peak of PbFe12O19 lattice oxygen in Sample S5-800 was obvious, but the characteristic peak of PbFe12O19 lattice oxygen in Samples S2-1100, S5-1100 and S6-1100 disappeared. The results indicate that the lead loss causes PbFe12O19 to phase transition to Fe2O3 and PbO↑.
3.4 Surface Morphology Analysis
With the increase in sintering temperature, the particle size of PbFe12O19 increased, and the agglomeration between particles became more and more obvious. Figure 5A-G shows the SEM images of Samples S1-1100, S2-1100, S3-1100, S4-1100, S5-1100, S6-1100 and S7-1100. When the sintering temperature rose to 1100℃, the adhesion agglomeration phenomenon between PbFe12O19 particles with Fe/Pb mole ratio of 2 was more obvious, and the interaction between particles grew into irregular lotus root particles, as shown in Figure 5A. However, the samples with Fb/Pb mole ratio of 3 showed human bone-like particles, as shown in Figure 5B. The ingot-shaped particles were bonded into flake particles mixed with fine lotus root-shaped particles, as shown in Figure 5C. The rice-like grains grew further and became nearly spherical particles, as shown in Figure 5D. Figure 5E shows the SEM image of S5-1100. The rhomboid particles and fine particles were further grown and bonded into dense blocks with very clear grain boundaries between the particles. In Figure 5F, the uniform rhomboid particles grew to cohesive and agglomerated spherical particles, which may be related to the loss of lead ions. In Figure 5G, the homogeneous lamellar PbFe12O19 particles obtained at 1100℃ also grew into dense spherical particles with a small number of lamellar particles. Figure 5H shows the TEM image of Sample S7-1100. As can be seen from Figure 5H, adhesion agglomeration between particles was particularly evident, and the particles grew to cross-link with each other. Figure 5I shows the high-resolution transmission electron microscope image of Sample S7-1100. The result shows that the lattice spacing of 0.2514nm corresponded to the d-spacing of (110) planes, and 0.2671nm corresponded to (104) planes. The grain growth for the PbFe12O19 particles was dominated by (110) and (104) crystal planes. The surface morphology of PbFe12O19 magnetic separation catalysts could be effectively adjusted by adjusting Fe/Pb molar ratio and sintering temperature.
|

Figure 5. SEM images of Samples. A: S1-1100; B: S2-1100; C: S3-1100; D: S4-1100; E: S5-1100; F: S6-1100; G: S7-1100; H: TEM; I: High-resolution transmission electron microscope images of Sample S7-1100.
3.5 Optical Properties
To investigate the effects of Fe/Pb molar ratio and sintering temperature on the color properties, optical absorption coefficients and optical band-gap (Eg) values of PbFe12O19 magnetic separation catalysts, Figure 6 shows the UV-Vis diffuse reflection spectra of PbFe12O19 magnetic separation catalysts. Based on the data on color properties, it can be further confirmed that the PbFe12O19, which resembles the Fe2O3 phase, is not Fe2O3. With an increase in the wavelength from 190 to 1100nm, the reflectivity altered obviously. In the range of 190-550nm, the reflectivity remained constant and hardly varied with wavelength. In the range of 550-750nm and 900-110nm, the reflectivity increased sharply with the increase in wavelength. With the increase in sintering temperature and Fe/Pb mole ratio, the reflectance trend was disordered. The color coordinated (L* (black (0)/white (100)), a* (green (-)/red (+)), b* (blue (-)/yellow (+))), the chroma parameter (c*), the hue angle (Ho) and the total color difference (ECIE*) of PbFe12O19 magnetic separation catalysts were calculated on the basis of UV-visible diffuse reflectance spectrum and previous reports[49].
|
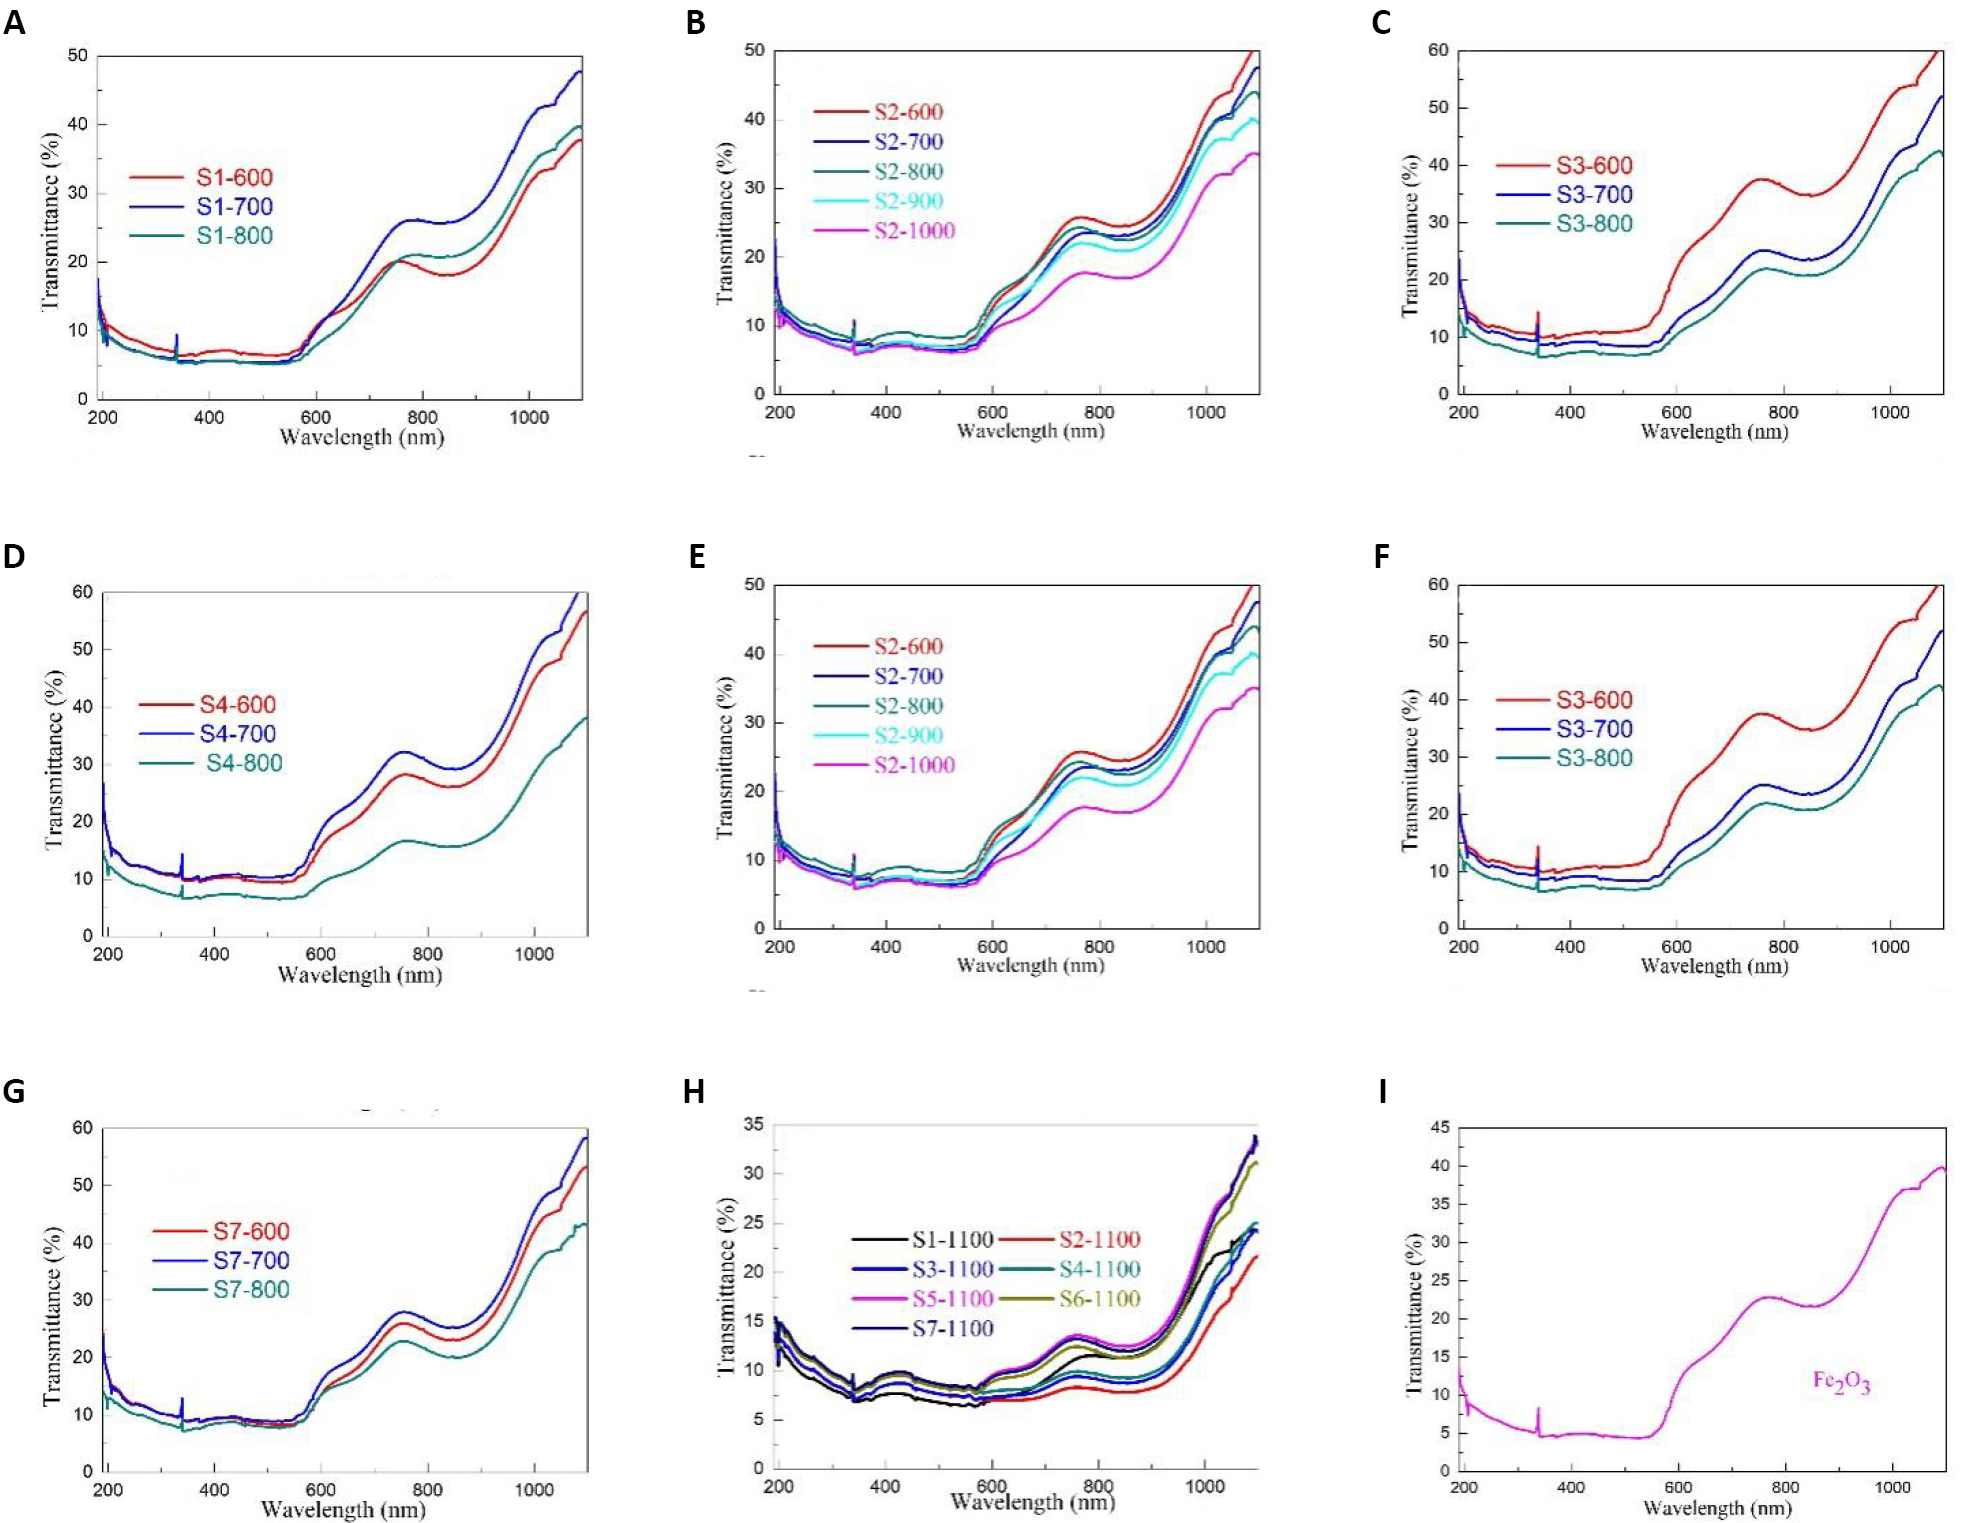
Figure 6. UV-Vis diffuse reflection spectra of PbFe12O19 magnetic separation catalysts. A: Samples S1-600, S1-700 and S1-800; B: Samples S2-600, S2-700 and S2-800; C: Samples S3-600, S3-700 and S3-800; D: Samples S4-600, S4-700 and S4-800; E: Samples S5-600, S5-700 and S5-800; F: Samples S6-600, S6-700 and S6-800; G: Samples S7-600, S7-700 and S7-800; H: Samples S1-1100, S2-1100, S3-1100, S4-1100, S5-1100, S6-1100 and S7-1100; I: Fe2O3.
The (L*, a*, b*), c*, Ho, and ECIE* values of PbFe12O19 magnetic separation catalysts are shown in Table 3. There was no linear relationship between (L*, a*, b*), c*, Ho and ECIE* values of PbFe12O19 magnetic separation catalysts and sintering temperature or Fe/Pb molar ratio. This kind of nonlinear relation is especially suitable for the study of artificial neural network model. It is noteworthy that the b* values of all samples obtained by sintering at 1100℃ are negative, indicating the presence of blue components in these samples, which is consistent with the real photos in Figure 7. The color of Fe2O3 is light red, and the presence of this blue component indicates that the phase structure that resembles Fe2O3 should be ascribed to PbFe12O19. Based on the Kubelka-Munk and Tauc relationship (Equations (4) and (5)), the Eg values of PbFe12O19 magnetic separation catalysts are given in Table 3. Similarly, Eg value is linearly independent of sintering temperature or Fe/Pb molar ratio.
|
Where R is the reflectance, α is the optical absorption coefficient and S is the scattering coefficient.
|
Where h is the photon energy and A is a constant.
|
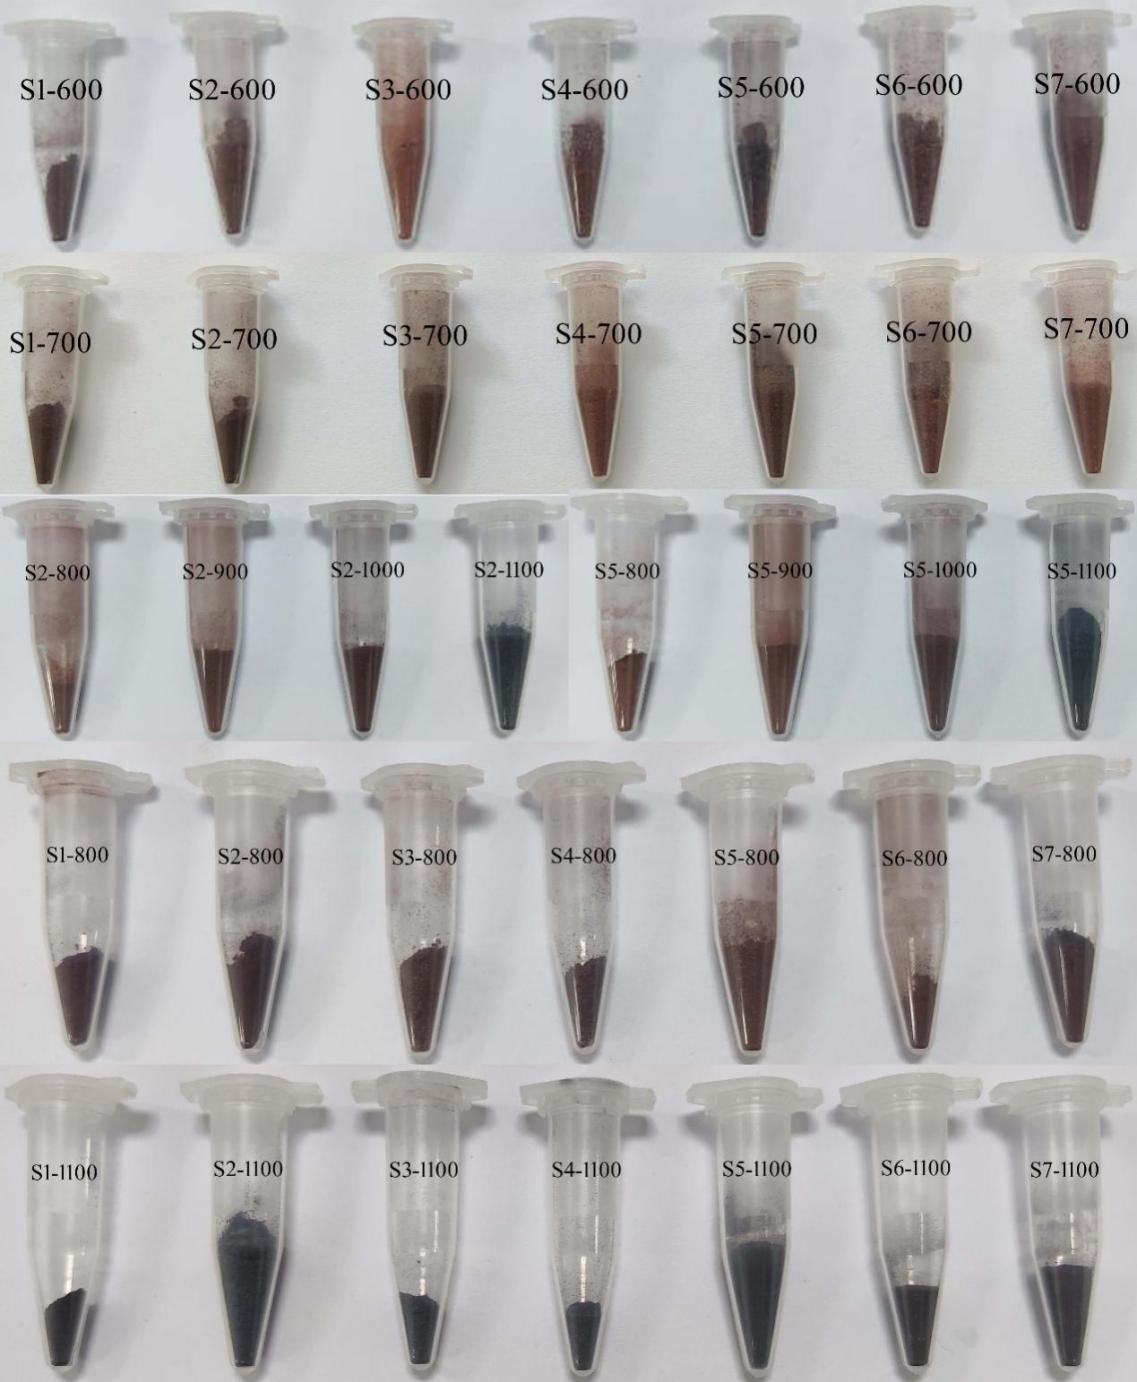
Figure 7. Real photos of Samples S1, S2, S3, S4, S5, S6 and S7 sintered at different temperatures.
Table 3. Color Correlation Parameters and Eg Values of PbFe12O19 Magnetic Separation Catalysts
Sample |
Color Coordinates |
Eg Value (eV) |
|||||
L* |
a* |
b* |
c* |
Ho |
ECIE* |
||
Fe2O3 |
31.319 |
18.522 |
9.015 |
20.599 |
25.953 |
37.486 |
1.97 |
39.194 |
18.590 |
12.522 |
22.414 |
33.964 |
45.150 |
1.96 |
|
S1-600℃ |
33.698 |
10.675 |
3.700 |
11.298 |
19.117 |
35.542 |
1.81 |
S1-700℃ |
32.061 |
13.212 |
6.520 |
14.733 |
26.266 |
35.284 |
1.84 |
S1-800℃ |
29.921 |
9.140 |
3.166 |
9.673 |
19.106 |
31.446 |
1.73 |
S1-1100℃ |
31.168 |
2.520 |
-2.215 |
3.355 |
-41.314 |
31.348 |
1.34 |
S2-500℃ |
42.570 |
19.125 |
14.520 |
24.012 |
37.206 |
48.875 |
1.94 |
S2-600℃ |
36.119 |
12.858 |
6.111 |
14.236 |
25.420 |
38.823 |
1.83 |
S2-700℃ |
33.544 |
10.310 |
3.419 |
10.862 |
18.347 |
35.259 |
1.75 |
S2-800℃ |
38.256 |
11.561 |
4.752 |
12.450 |
22.344 |
40.246 |
1.87 |
S2-900℃ |
35.341 |
11.522 |
4.548 |
12.387 |
21.540 |
37.449 |
1.84 |
S2-1000℃ |
32.332 |
8.913 |
1.778 |
9.089 |
11.281 |
33.585 |
1.77 |
S2-1100℃ |
32.516 |
0.148 |
-3.536 |
3.539 |
-87.603 |
32.708 |
1.14 |
45.938 |
18.181 |
15.778 |
24.073 |
40.952 |
51.863 |
1.98 |
|
S3-600℃ |
45.801 |
16.061 |
11.188 |
19.574 |
34.861 |
49.808 |
1.94 |
S3-700℃ |
37.830 |
10.233 |
3.361 |
10.771 |
18.183 |
39.333 |
1.78 |
S3-800℃ |
34.367 |
9.472 |
3.415 |
10.069 |
19.826 |
35.812 |
1.82 |
S3-1100℃ |
32.764 |
0.858 |
-3.170 |
3.284 |
-74.855 |
32.928 |
1.19 |
45.657 |
18.556 |
16.029 |
24.520 |
40.821 |
51.825 |
1.95 |
|
S4-600℃ |
40.606 |
12.324 |
4.738 |
13.203 |
21.029 |
42.699 |
1.86 |
S4-700℃ |
43.106 |
13.770 |
7.282 |
15.577 |
27.871 |
45.834 |
1.90 |
S4-800℃ |
32.943 |
7.831 |
1.487 |
7.971 |
10.752 |
33.894 |
1.78 |
S4-1100℃ |
34.157 |
0.773 |
-3.416 |
3.502 |
-77.249 |
34.336 |
1.23 |
42.942 |
16.372 |
10.886 |
19.661 |
33.621 |
47.229 |
1.93 |
|
S5-600℃ |
34.502 |
9.027 |
2.009 |
9.248 |
12.547 |
35.720 |
1.77 |
S5-700℃ |
33.845 |
7.128 |
0.969 |
7.194 |
7.741 |
34.601 |
1.69 |
S5-800℃ |
37.234 |
8.818 |
2.891 |
9.280 |
18.152 |
38.373 |
1.76 |
S5-900℃ |
39.710 |
11.212 |
3.669 |
11.797 |
18.120 |
41.425 |
1.89 |
S5-1000℃ |
37.009 |
8.088 |
1.021 |
8.152 |
7.195 |
37.896 |
1.78 |
S5-1100℃ |
35.469 |
3.821 |
-2.013 |
4.319 |
-27.781 |
35.731 |
1.39 |
S6-500℃ |
36.839 |
18.491 |
12.113 |
22.105 |
33.228 |
42.962 |
1.94 |
S6-600℃ |
38.661 |
12.077 |
3.659 |
12.619 |
16.855 |
40.668 |
1.89 |
S6-700℃ |
40.085 |
10.671 |
3.327 |
11.178 |
17.316 |
41.614 |
1.86 |
S6-800℃ |
37.089 |
12.992 |
6.134 |
14.367 |
25.274 |
39.775 |
1.88 |
S6-1100℃ |
34.681 |
3.059 |
-2.411 |
3.895 |
-38.244 |
34.899 |
1.36 |
S7-500 ℃ |
41.417 |
21.707 |
15.950 |
26.937 |
36.308 |
49.406 |
1.99 |
S7-600℃ |
37.916 |
11.941 |
3.111 |
12.340 |
14.603 |
39.873 |
1.89 |
S7-700℃ |
39.962 |
13.314 |
5.685 |
14.477 |
23.122 |
42.503 |
1.93 |
S7-800℃ |
37.335 |
11.803 |
4.347 |
12.578 |
20.219 |
39.397 |
1.86 |
S7-1100℃ |
35.410 |
3.296 |
-2.265 |
3.999 |
-34.497 |
35.635 |
1.38 |
Notes: L*, a*, b*: the color coordinates; c*: the chroma parameter; Ho: the hue angle; ECIE*: the total color difference.
3.6 Magnetic Properties and Ultrasonic Catalytic Activity
3.6.1 Magnetic Properties
Figure 8A shows the hysteresis loops of Samples S7-600, S7-700, S7-800, and S7-1100, and the saturation magnetization of Samples S7-600, S7-700, S7-800 and S7-1100 are 0.53, 0.65, 0.76 and 0.72emu/g, respectively. The remaining magnetization of Samples S7-600, S7-700, S7-800 and S7-1100 were 0.23, 0.28, 0.53 and 0.45emu/g, respectively. The squareness ratio (remaining magnetization/saturation magnetization) of Samples S7-600, S7-700, S7-800 and S7-1100 were 0.43, 0.43, 0.70 and 0.63, respectively. The intrinsic coercivity (Hc) of Samples S7-600, S7-700, S7-800 and S7-1100 were 2752.43, 2882.73, 1742.67 and 1221.49Oe, respectively. This result confirms that the Samples S7-600, S7-700, S7-800 and S7-1100 exhibit the isotropic characteristic, so PbFe12O19 can be applied as a promising material for the magnetic separation catalysts.
|
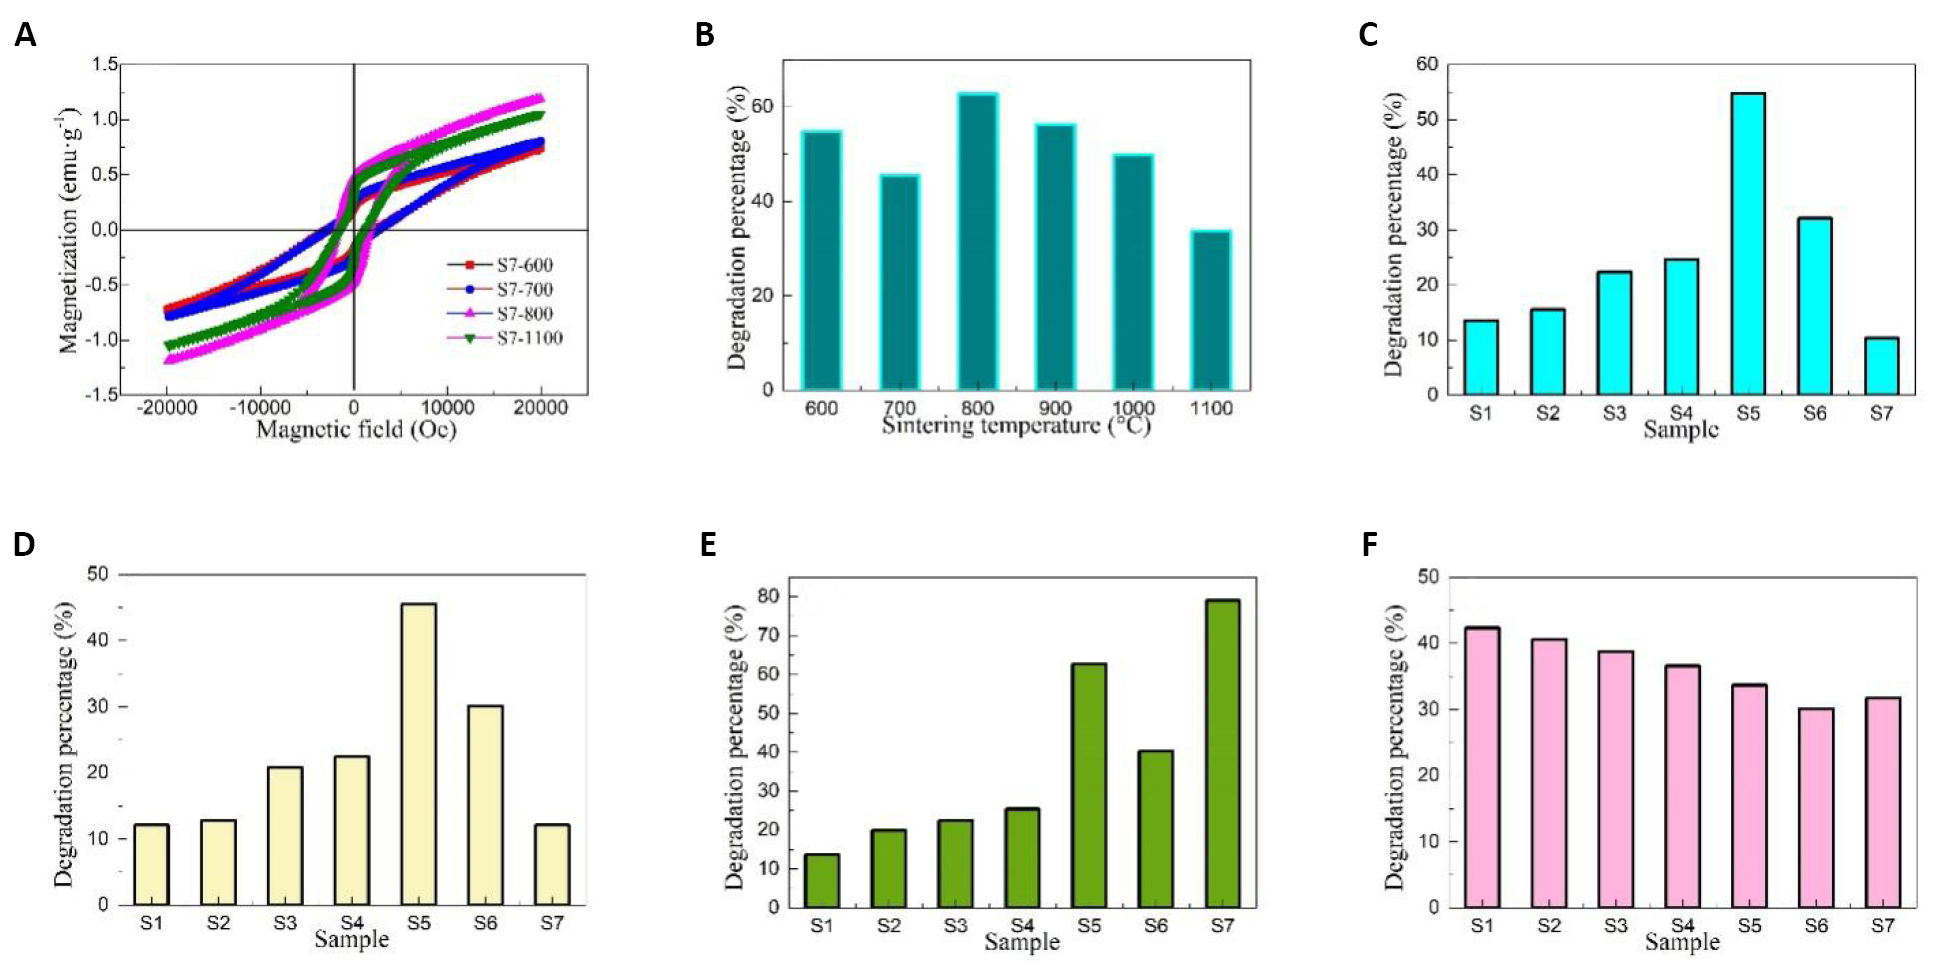
Figure 8. Hysteresis loops of Samples S7-600, S7-700, S7-800, and S7-1100 (A), degradation percentage of Sample S5 obtained at different temperatures (B), and degradation percentage of different samples obtained at (C) 600, (D) 700, (E) 800 and (F) 1100℃.
3.6.2 Effect of Different Sintering Temperatures on the Ultrasonic Catalytic Activity
Figure 8B shows the degradation percentage of Samples S5-600, S5-700, S5-800, S5-900, S5-1000, and S5-1100. With the increase in sintering temperature, the ultrasonic catalytic activity of PbFe12O19 magnetic separation catalyst decreased first, increased, then decreased. There are two main reasons: first, the phase structure of the sample sintered at above 600℃ changed significantly, and the other is that the coordination environment of PbFe12O19 changes due to the loss of some lead ions during high temperature treatment, which affects the surface oxygen vacancy concentration of PbFe12O19.
3.6.3 Effect of Different Fe/Pb Mass Ratios on the Ultrasonic Catalytic Activity
Figure 8C-F shows the degradation percentage of different samples obtained at 600, 700, 800, and 1100℃. When Samples S1-S7 were sintered at 600 (Figure 8) and 700℃ (Figure 8D), the degradation percentage increased first and then decreased with the increase in Fe/Pb mole ratio, and Sample S5 showed the best degradation percentage. When the sintering temperature reaches 800℃ (Figure 8E), the degradation percentage of PbFe12O19 magnetic separation catalysts increased first, decreased, and increased with the increase in the mole ratio of Fe/Pb, and reached the maximum value when the mass ratio of Fe/Pb was 12. When the sintering temperature reached 1100℃ (Figure 8F), the degradation percentage decreased with the increase of Fe/Pb mole ratio, and the Sample S7 appeared abnormal. The degradation percentage varied significantly with the mass ratio of Fe/Pb at different sintering temperatures due to the loss of Pb and the change in the structure and composition of PbFe12O19.
3.7 Multi-parameter Coupling Artificial Neural Network Algorithm Simulation
An artificial neural network algorithm is an efficient method to predict the physical and chemical properties of semiconductor materials[50,51]. On the basis of obtaining a large number of data, the artificial neural network model was established to train the data to conform to the corresponding rules. The known input parameters were then used as the test set to predict the output results. In this experiment, various parameters including d, 2θ, FWHM, D, degradation percentage, Eg, L*, a*, b*, c*, H° and ECIE* values were obtained by controlling Fe/Pb mole ratio, the mass of Fe and Pb metal salts and sintering temperature. By analyzing the necessity of the experiment, some experimental data were not obtained. To study the influence of different parameters on the ultrasonic catalytic activity of PbFe12O19 magnetic separation catalysts, three different artificial neural network models were established to predict the related parameters. Artificial neural network algorithm model I (Figure 9) was established by using the Fe/Pb molar ratio, the mass of Fe and Pb metal salts, sintering temperature, d, 2θ, FWHM, L*, a*, c*, H° and ECIE* values as the input parameters, and the most important parameters including D, degradation percentage, Eg and b* values as the output parameters. The effects of different parameters on the D, degradation percentage, Eg and b* values of PbFe12O19 magnetic separation catalysts were observed. The R2 value was close to 1, and the predicted value was highly consistent with the experimental value, as shown in Figure 10. Figure 9B shows the artificial neural network algorithm model II for prediction of degradation percentage for different samples. This model mainly uses all parameters except degradation percentage as input parameters. The synergistic effect of multiple parameters has a great influence on the degradation percentage, and the R2 value is closer to 1 than model I. Figure 11A shows the experimental values of the degradation rate of different samples by Matlab software and the simulated values by the artificial neural network algorithm. The experimental values of the seven test samples were in good agreement with the predicted values. To predict the physical and chemical properties of PbFe12O19 magnetic separation catalysts with only the experimental parameters, an artificial neural network model III was designed. Figure 9C shows the artificial neural network algorithm model III for prediction of d, 2θ, FWHM, D, degradation percentage, Eg, L*, a*, b*, c*, H° and ECIE* values for different samples. With only four input parameters of Fe/Pb mole ratio, the mass of Fe and Pb metal salts and sintering temperature, the d, 2θ, FWHM, D, degradation percentage, Eg, L*, a*, b*, c*, H° and ECIE* values of PbFe12O19 magnetic separation catalysts were predicted. The experimental value and the simulated value of artificial neural network algorithm of d, 2θ, FWHM, D, degradation percentage, Eg, L*, a*, b*, c*, H° and ECIE* values for different samples by Matlab software are shown in Figure 11B. Based on artificial neural network model III, other physical and chemical properties of PbFe12O19 magnetic separation catalysts not obtained in this experiment can be predicted.
|
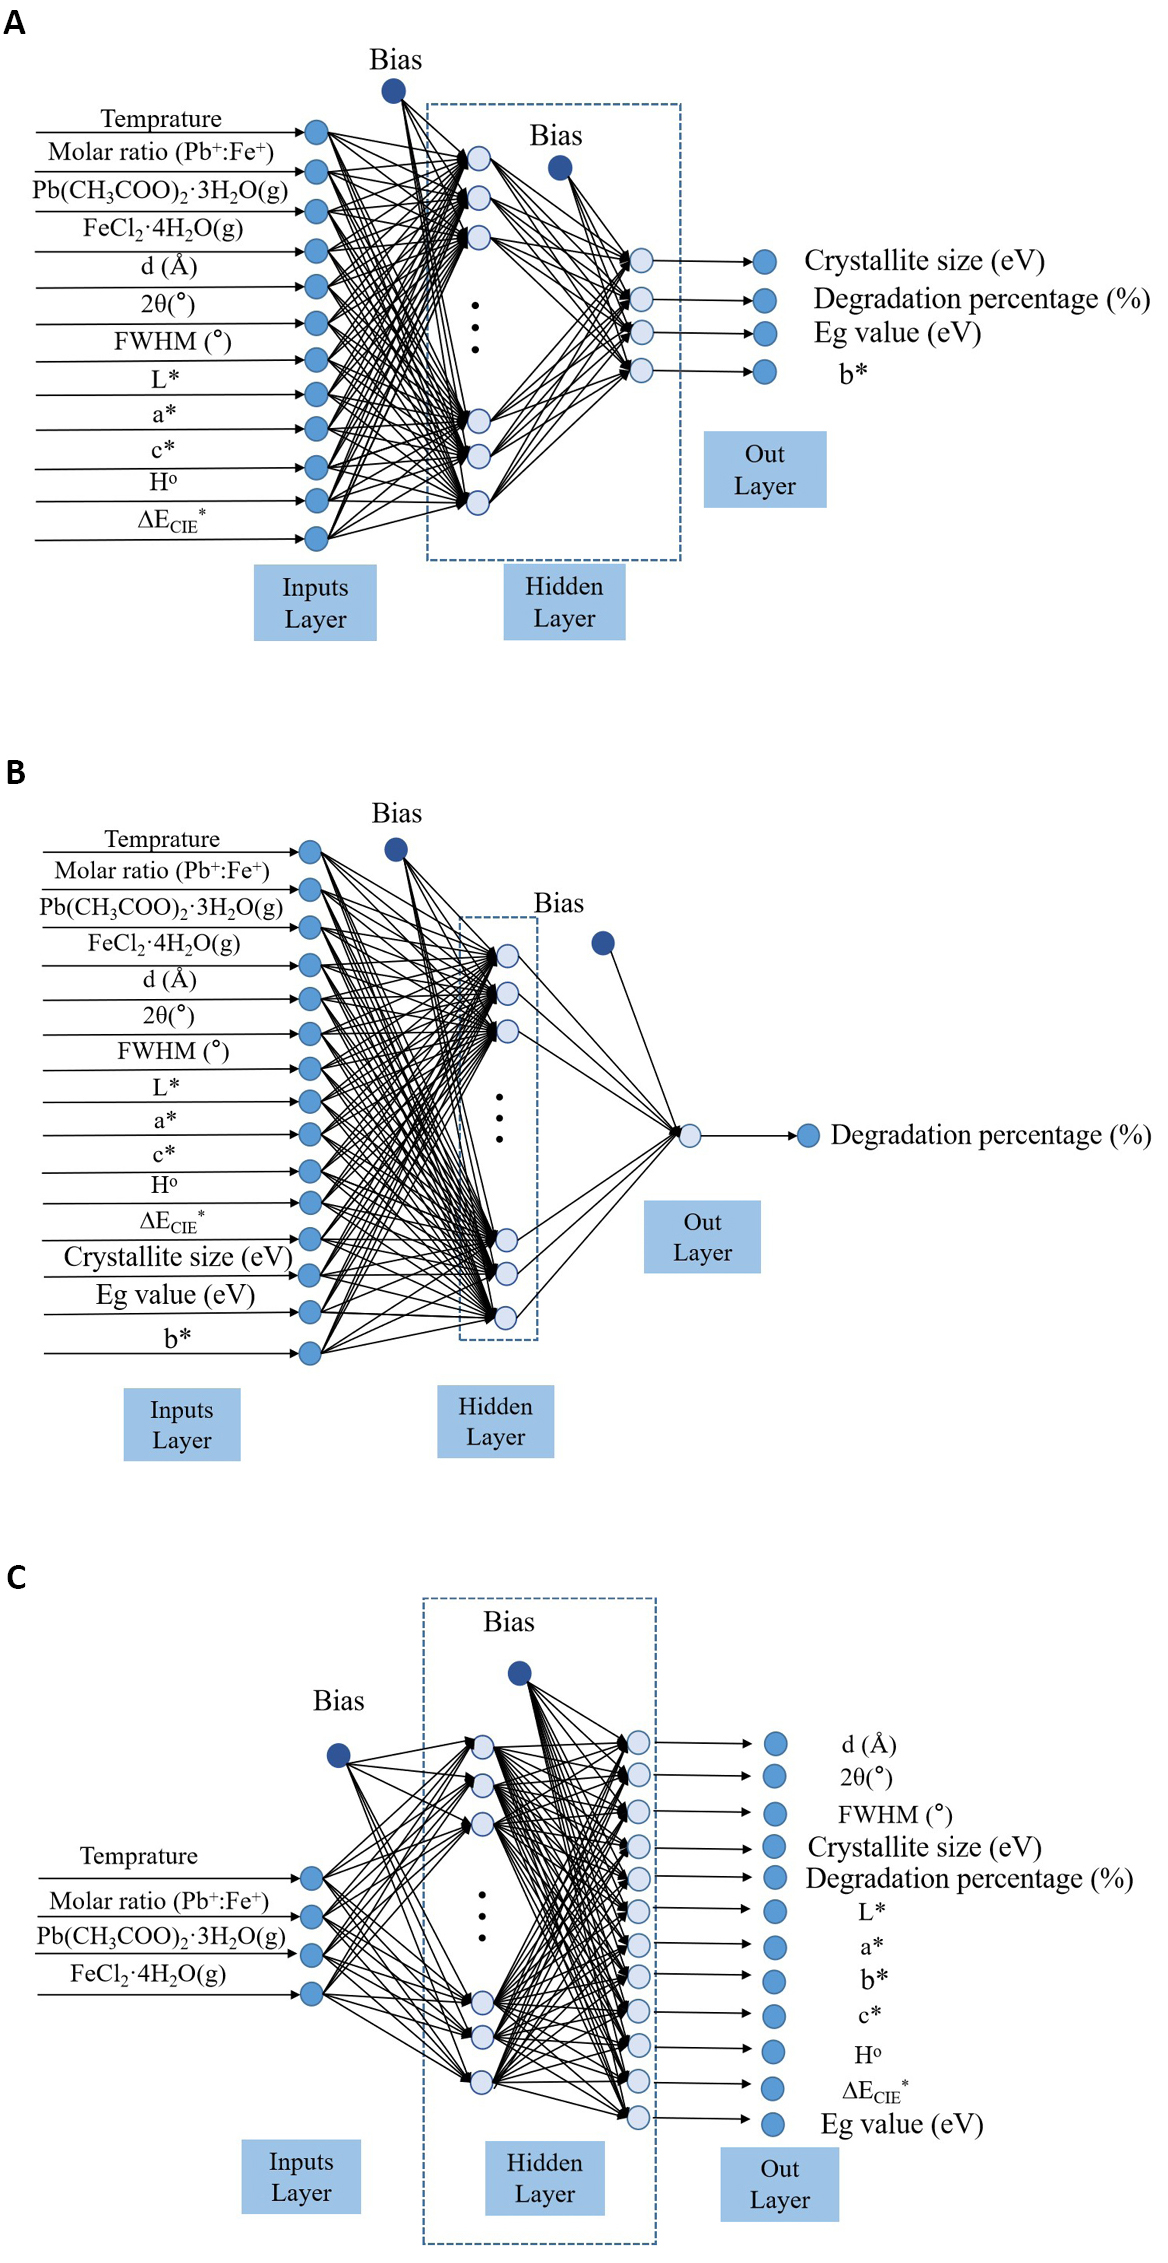
Figure 9. Artificial neural network algorithm models. A: Artificial neural network algorithm model I for prediction of D, degradation percentage, Eg and b* values for different samples; B: Artificial neural network algorithm model II for prediction of degradation percentage for different samples; C: Artificial neural network algorithm model III for prediction of d, 2θ, FWHM, D, degradation percentage, Eg, L*, a*, b*, c*, H° and ECIE* values for different samples.
|
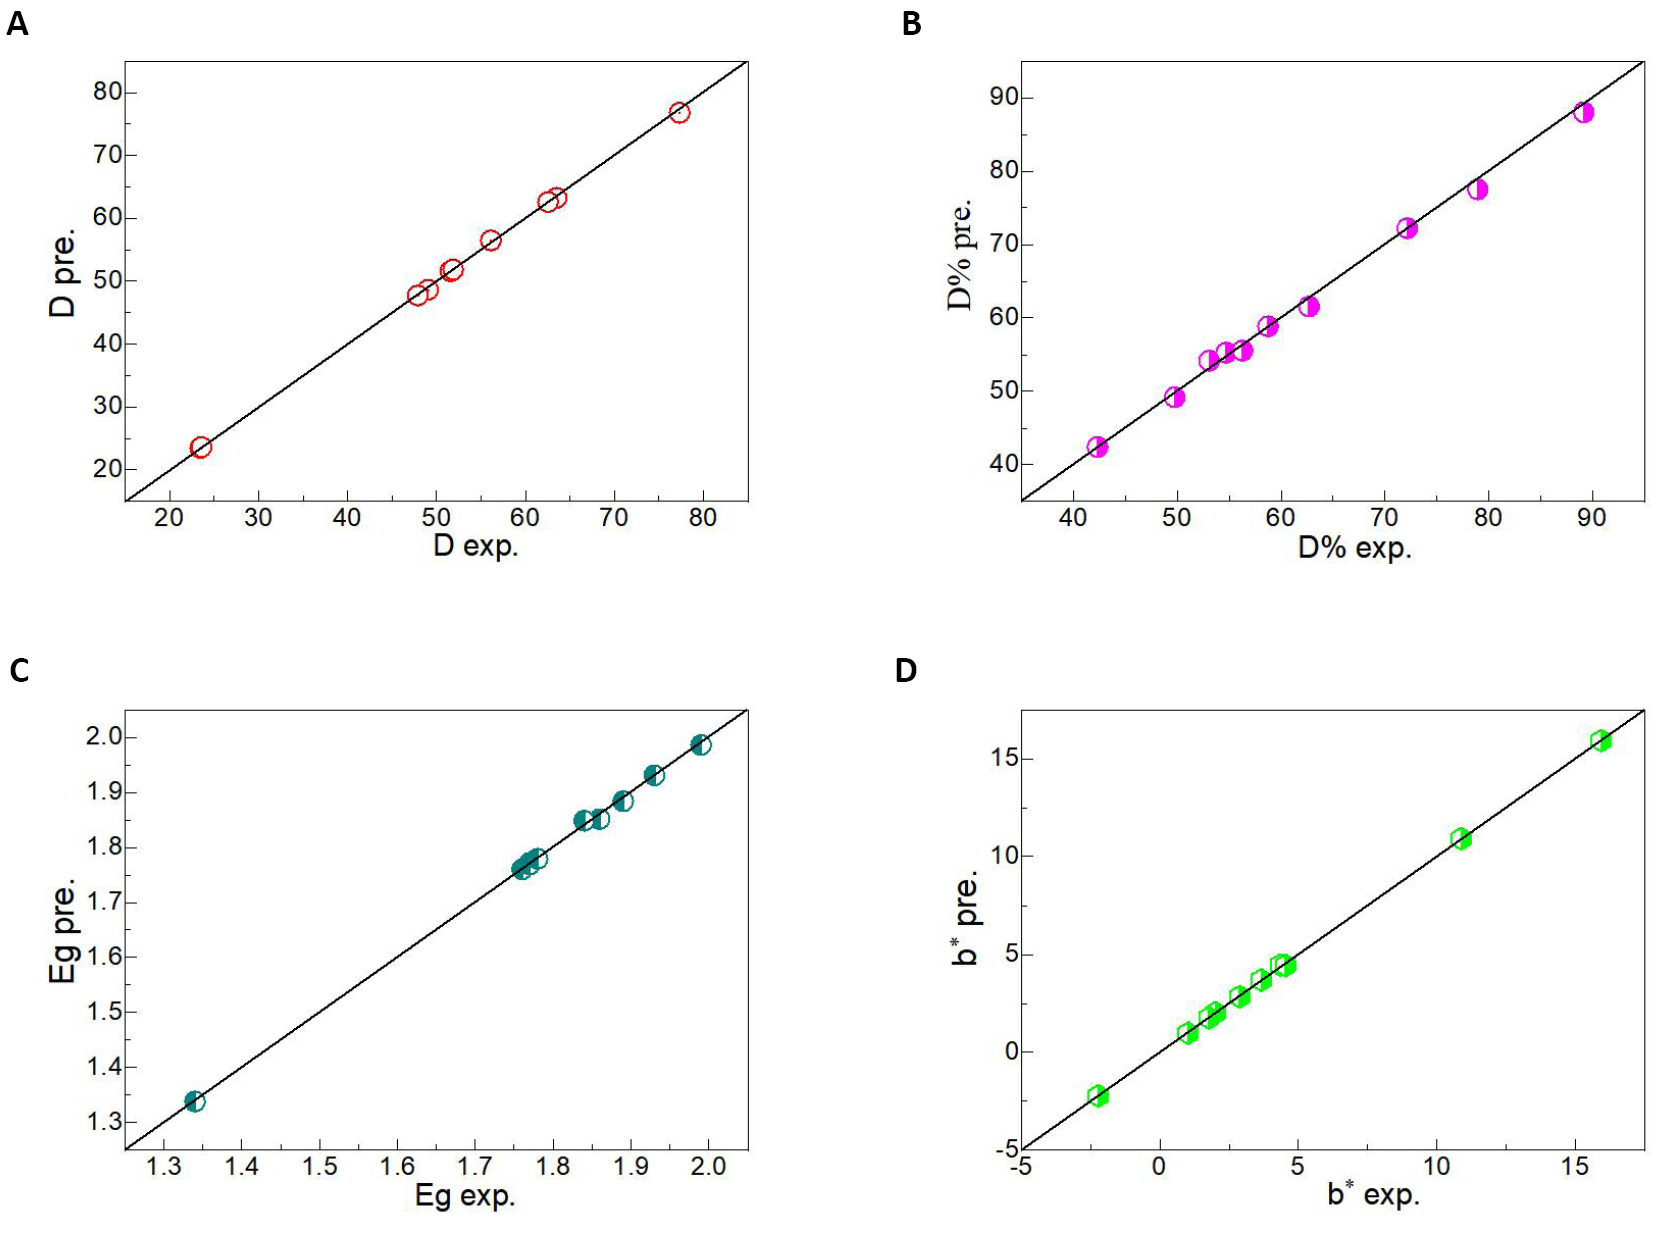
Figure 10. The experimental value and the simulated value of artificial neural network algorithm of (A) D, (B) degradation percentage, (C) Eg and (D) b* values for different samples by Matlab software.
|
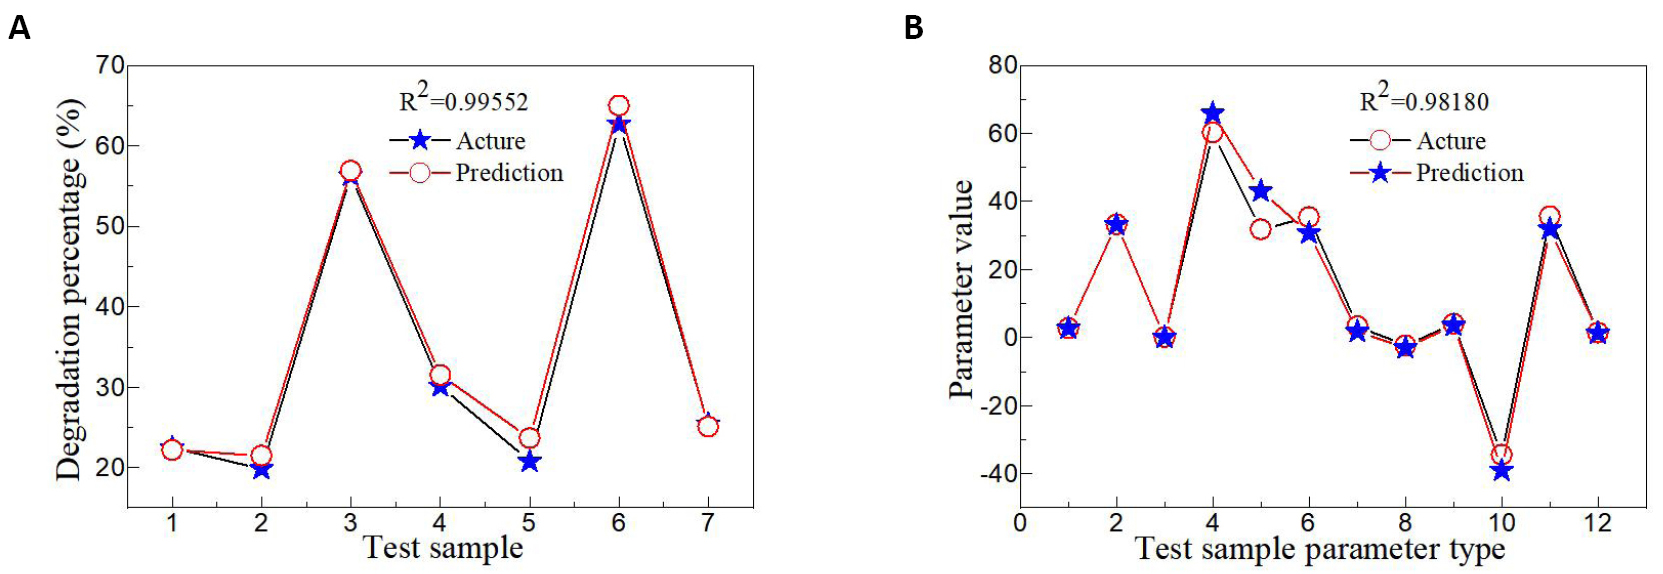
Figure 11. The experimental value and the simulated value of artificial neural network algorithms. A: The experimental value and the simulated value of artificial neural network algorithm of degradation percentage for different samples by Matlab software; B: The experimental value and the simulated value of artificial neural network algorithm of d, 2θ, FWHM, D, degradation percentage, Eg, L*, a*, b*, c*, H° and ECIE* values for different samples by Matlab software.
4 CONCLUSION
The PbFe12O19 magnetic separation catalysts with different Fe/Pb molar ratios were synthesized by a simple polyacrylamide gel method. XRD, FTIR, and XPS characterizations confirmed that the crystal structure and composition of PbFe12O19 magnetic separation catalysts altered with the change in Fe/Pb mole ratio and sintering temperature. The surface morphology of PbFe12O19 magnetic separation catalysts could be regulated and controlled by different Fe/Pb molar ratios and sintering temperatures. The color relative parameters and Eg values of PbFe12O19 magnetic separation catalysts were linearly independent of Fe/Pb mole ratio and sintering temperature. The PbFe12O19 magnetic separation catalysts exhibiting a ferromagnetic behavior indicate that the catalysts could be separated through a magnetic field. The maximum degradation percentage of 78.99 % for the PbFe12O19 magnetic separation catalysts with Fe/Pb mole ratio of 12 was found at 2g/L of initial catalyst concentration, 50mg/L of initial dye concentration, 180min of vibration time for removal of RhB dye from wastewater. Based on the experimental parameters, including Fe/Pb molar ratio, sintering temperature, the mass of lead and iron metal salts, and analysis results including the interplanar spacing, FWHM, D, colorimetric parameter, Eg value and degradation percentage of the target product, a neural network algorithm model was established to predict the effects of different experimental parameters on the D, colorimetric parameter, Eg value and degradation percentage of PbFe12O19 magnetic separation catalysts. The application of neural network algorithm to predict the physical and chemical properties of other semiconductor materials provides theoretical guidance. Simultaneously, this technology provides experimental basis for the development of novel magnetic separation ultrasonic catalysts.
Acknowledgements
This work was supported by the NSAF Joint Foundation of China (U2030116), the Science and Technology Research Program of Chongqing Education Commission of China (KJQN202201204, KJZD-K202001202), the Chongqing Key Laboratory of Geological Environment Monitoring and Disaster Early-warning in Three Gorges Reservoir Area (No. ZD2020A0401), the Talent Introduction Project (09924601) of Chongqing Three Gorges University.
Conflicts of Interest
The authors declared that they have no competing interests.
Author Contribution
Chen X: Experiment, data analysis and paper writing; Liu H and Li M: Performance prediction; Wang S: Supervision and paper revision.
Abbreviation List
D, Crystallite size
Eg, Optical band-gap
FTIR, Fourier transform infrared
FWHM, Full-width at half maximum
PbFe12O19, Hexagonal lead ferrite
RhB, Rhodamine B
SEM, Scanning electron microscopy
TEM, Transmission electron microscopy
UV-Visible, Ultraviolet-visible
XPS, X-ray photoelectron spectrometer
XRD, X-ray diffractometer
References
[1] Khalilzadeh MA, Kim SY, Jang HW et al. Carbohydrate-based nanostructured catalysts: applications in organic transformations. Mater Today Chem, 2022; 24: 100869. DOI: 10.1016/j.mtchem.2022.100869
[2] Han M, Wang S, Chen X et al. Spinel CuB2O4 (B=Fe, Cr, and Al) oxides for selective adsorption of Congo red and photocatalytic removal of antibiotics. ACS Appl Nano Mater, 2022; 5: 11194-11207. DOI: 10.1021/acsanm.2c02349
[3] Pan X, Tang S, Chen X et al. Temperature-controlled synthesis of TiO2 photocatalyst with different crystalline phases and its photocatalytic activity in the degradation of different mixed dyes. J Phys Chem A, 2022; 96: S210-S218. DOI: 10.1134/S0036024422140187
[4] Wang S, Chen X, Fang L et al. Double heterojunction CQDs/CeO2/BaFe12O19 magnetic separation photocatalysts: Construction, structural characterization, dye and POPs removal, and the interrelationships between magnetism and photocatalysis. Nucl Anal, 2022; 1: 100026. DOI: 10.1016/j.nucana.2022.100026
[5] Sanchis I, Diaz E, Pizarro AH et al. Nitrate reduction with bimetallic catalysts: A stability-addressed overview. Sep Purif Technol, 2022; 290: 120750. DOI: 10.1016/j.seppur.2022.120750
[6] Han X, Sun M, Chai X et al. Progress in synthesis and photocatalytic activity of MAl2O4 (M=Mg, Sr, Ba) based photocatalysts. Front Mater, 2022; 9: 845664. DOI: 10.3389/fmats.2022.845664
[7] Cheng T, Ma Q, Gao H et al. Enhanced photocatalytic activity, mechanism and potential application of I doped-Bi4Ti3O12 photocatalysts. Mater Today Chem, 2022; 23: 100750. DOI: 10.1016/j.mtchem.2021.100750
[8] Petrović M, Rančev S, Velinov N et al. Triclinic ZnMoO4 catalyst for atmospheric pressure non-thermal pulsating corona plasma degradation of reactive dye; role of the catalyst in plasma degradation process. Sep Purif Technol, 2021; 269: 118748. DOI: 10.1016/j.seppur.2021.118748
[9] Wang S, Gao H, Chen C et al. Irradiation assisted polyacrylamide gel route for the synthesize of the Mg1–xCoxAl2O4 nano-photocatalysts and its optical and photocatalytic performances. J Solgel Sci Technol, 2019; 92: 186-199. DOI: 10.1007/s10971-019-05062-8
[10] Karuppasamy L, Gurusamy L, Anandan S et al. Defect-enriched heterointerfaces N-MoO2-Mo2C supported Pd nanocomposite as a novel multifunctional electrocatalyst for oxygen reduction reaction and overall water splitting. Mater Today Chem, 2022; 24: 100799. DOI: 10.1016/j.mtchem.2022.100799
[11] Tang S, Gao H, Wang S et al. Piezoelectric catalytic, photocatalytic and adsorption capability and selectivity removal of various dyes and mixed dye wastewater by ZnO nanoparticles (Preprint). Main Group Chem, 2022; 21: 1-19. DOI: 10.3233/MGC-210150
[12] Guan J, Jia Y, Chang T et al. Highly efficient piezo-catalysis of the heat-treated cellulose nanocrystal for dye decomposition driven by ultrasonic vibration. Sep Purif Technol, 2022; 286: 120450. DOI: 10.1016/j.seppur.2022.120450
[13] Gao HJ, Wang SF, Fang LM et al. Nanostructured spinel-type M (M=Mg, Co, Zn) Cr2O4 oxides: novel adsorbents for aqueous Congo red removal. Mater Today Chem, 2021; 22: 100593. DOI: 10.1016/j.mtchem.2021.100593
[14] Ansarian Z, Khataee A, Arefi-Oskoui S et al. Ultrasound-assisted catalytic activation of peroxydisulfate on Ti3GeC2 MAX phase for efficient removal of hazardous pollutants. Mater Today Chem, 2022; 24: 100818. DOI: 10.1016/j.mtchem.2022.100818
[15] ElShafei GMS, Yehia FZ, Eshaq G et al. Enhanced degradation of nonylphenol at neutral pH by ultrasonic assisted-heterogeneous Fenton using nano zero valent metals. Sep Purif Technol, 2017; 178: 122-129. DOI: 10.1016/j.seppur.2017.01.028
[16] Wang S, Gao H, Jin Y et al. Defect engineering in novel broad-band gap hexaaluminate MAl12O19 (M=Ca, Sr, Ba)-Based photocatalysts boosts near ultraviolet and visible light-driven photocatalytic performance. Mater Today Chem, 2022; 24: 100942. DOI: 10.1016/j.mtchem.2022.100942
[17] Wang S, Li M, Yin Z et al. Skillfully grafted C-O functional group to enhance the adsorption/photocatalytic mechanism of YMnO3/MgAl2O4 heterojunction photocatalysts. Adv Powder Technol, 2022; 33: 103771. DOI: 10.1016/j.apt.2022.103771
[18] Sun H, Yang X, Zhao L et al. One-pot hydrothermal synthesis of octahedral CoFe/CoFe2O4 submicron composite as heterogeneous catalysts with enhanced peroxymonosulfate activity. J Mater Chem B, 2016; 4: 9455-9465. DOI: 10.1039/C6TA02126C
[19] Prasiwi ODI, Saraswati TE, Anwar M et al. Magnetic Carbon nanofibers prepared with Ni and Ni/graphitic carbon nanoparticle catalysts for glycine detection using surface-enhanced Raman spectroscopy. ACS Appl Nano Mater, 2021; 4: 6594-6608. DOI: 10.1021/acsanm.1c00111
[20] Hu Z, He Q, Ge M. Photocatalytic degradation of organic contaminants by magnetic Ag3PO4/MFe2O4 (M=Zn, Ni, Co) composites: a comparative study and a new insight into mechanism. J Mater Sci Mater Electron, 2021; 32: 827-842. DOI: 10.1007/s10854-020-04861-y
[21] Kaur P, Singh S, Kumar V et al. Development of emphatic catalysts for waste water remediation via synchronized free radical and non-free radical routes with composites of strontium hexaferrite, graphene and multi-walled carbon nanotubes. Ceram Int, 2022; 48: 4795-4811. DOI: 10.1016/j.ceramint.2021.11.016
[22] Prathap S, Madhuri W, Meena SS. Multiferroic properties and Mössbauer study of M-type hexaferrite PbFe12O19 synthesized by the high energy ball milling. Mater Charact, 2021; 177: 111168. DOI: 10.1016/j.matchar.2021.111168
[23] Lahijani B, Hedayati K, Goodarzi M. Magnetic PbFe12O19-TiO2 nanocomposites and their photocatalytic performance in the removal of toxic pollutants. Main Group Met Chem, 2018; 41: 53-62. DOI: 10.1515/mgmc-2017-0055
[24] Ghahfarokhi SEM, Rostami ZA, Kazeminezhad I. Fabrication of PbFe12O19 nanoparticles and study of their structural, magnetic and dielectric properties. J Magn Magn Mater, 2016; 399: 130-142. DOI: 10.1016/j.jmmm.2015.09.063
[25] Asiabani N, Nabiyouni G, Khaghani S et al. Green synthesis of magnetic and photo-catalyst PbFe12O19-PbS nanocomposites by lemon extract: Nano-sphere PbFe12O19 and star-like PbS. J Mater Sci Mater Electron, 2017; 28: 1101-1114. DOI: 10.1007/s10854-016-5635-6
[26] Wang S, Tang S, Yang H et al. A novel heterojunction ZnO/CuO piezoelectric catalysts: Fabrication, optical properties and piezoelectric catalytic activity for efficient degradation of methylene blue. J Mater Sci Mater Electron, 2022; 33: 7172-7190. DOI: 10.1007/s10854-022-07899-2
[27] Wang S, Gao H, Wang Y et al. Effect of the sintering process on the structure, colorimetric, optical and photoluminescence properties of SrWO4 phosphor powders. J Electron Mater, 2020; 49: 2450-2462. DOI: 10.1007/s11664-020-07941-1
[28] Gao H, Yang H, Wang S et al. A new route for the preparation of CoAl2O4 nanoblue pigments with high uniformity and its optical properties. J Solgel Sci Technol, 2018; 86: 206-216. DOI: 10.1007/s10971-018-4609-y
[29] Wang S, Wang Y, Gao H et al. Synthesis and characterization of BaAl2O4: Ce and Mn-Ce-co-doped BaAl2O4 composite materials by a modified polyacrylamide gel method and prediction of photocatalytic activity using artificial neural network (ANN) algorithm. Optik, 2020; 221: 165363. DOI: 10.1016/j.ijleo.2020.165363
[30] Wang SF, Lv HB, Zhou XS et al. Magnetic nanocomposites through polyacrylamide gel route. Nanosci Nanotechnol Lett, 2014; 6: 758-771. DOI: 10.1166/nnl.2014.1796
[31] Wang SF, Zu XT, Sun GZ et al. Highly dispersed spinel (Mg, Ca, Ba)-ferrite nanoparticles: Tuning the particle size and magnetic properties through a modified polyacrylamide gel route. Ceram Int, 2016; 42: 19133-19140. DOI: 10.1016/j.ceramint.2016.09.075
[32] Wang SF, Zhang C, Sun G et al. Effect of carbon and sintering temperature on the structural and magnetic properties of SrFe12O19 nanoparticles. J Solgel Sci Technol, 2015; 73: 371-378. DOI: 10.1007/s10971-014-3543-x
[33] Liu H, Wang S, Gao H et al. A simple polyacrylamide gel route for the synthesis of MgAl2O4 nanoparticles with different metal sources as an efficient adsorbent: Neural network algorithm simulation, equilibrium, kinetics and thermodynamic studies. Sep Purif Technol, 2022; 281: 119855. DOI: 10.1016/j.seppur.2021.119855
[34] Sözeri H, Durmuş Z, Baykal A et al. Preparation of high quality, single domain BaFe12O19 particles by the citrate sol-gel combustion route with an initial Fe/Ba molar ratio of 4. Mater Sci Eng B Solid State Mater Adv Technol, 2012; 177: 949-955. DOI: 10.1016/j.mseb.2012.04.023
[35] Rostami ZA,Ghahfarokhi SEM, Kazeminezhad I. Effect of Fe/Pb molar ratio on the structure, magnetic and dielectric properties of PbFe12O19 nanoparticles. J Phys Condens Matter, 2018; 56: 760-769. DOI: 10.1016/j.cjph.2018.01.005
[36] Wang Y, Gao H, Wang S et al. Facile synthesis of BaMoO4 and BaMoO4/BaWO4 heterostructures with type-I band arrangement and enhanced photoluminescence properties. Adv Powder Technol, 2021; 32: 4186-4197. DOI: 10.1016/j.apt.2021.09.028
[37] Li J, Wang S, Sun G et al. Facile preparation of MgAl2O4/CeO2/Mn3O4 heterojunction photocatalyst and enhanced photocatalytic activity. Mater Today Chem, 2021; 19: 100390. DOI: 10.1016/j.mtchem.2020.100390
[38] Wang S, Gao H, Li J et al. Comparative study of the photoluminescence performance and photocatalytic activity of CeO2/MgAl2O4 composite materials with an n-n heterojunction prepared by one-step synthesis and two-step synthesis methods. J Phys Chem Solids, 2021; 150: 109891. DOI: 10.1016/j.jpcs.2020.109891
[39] Ansari F, Salavati-Niasari M. Simple sol-gel auto-combustion synthesis and characterization of lead hexaferrite by utilizing cherry juice as a novel fuel and green capping agent. Adv Powder Technol, 2016; 27: 2025-2031. DOI: 10.1016/j.apt.2016.07.011
[40] Ansari F, Soofivand F, Salavati-Niasari M. Utilizing maleic acid as a novel fuel for synthesis of PbFe12O19 nanoceramics via sol-gel auto-combustion route. Mater Charact, 2015; 103: 11-17. DOI: 10.1016/j.matchar.2015.03.010
[41] Mahdiani M, Soofivand F, Salavati-Niasari M. Investigation of experimental and instrumental parameters on properties of PbFe12O19 nanostructures prepared by sonochemical method. Ultrason Sonochem, 2018; 40: 271-281. DOI: 10.1016/j.ultsonch.2017.06.023
[42] Prathap S, Madhuri W. Evidence of magnetism in electrospun PbFe12O19 nanofibers. Appl Phys A, 2019; 125: 1-8. DOI: 10.1007/s00339-019-2613-x
[43] Yang N, Yang H, Jia J et al. Formation and magnetic properties of nanosized PbFe12O19 particles synthesized by citrate precursor technique. J Alloys Compd, 2007; 438: 263-267. DOI: 10.1016/j.jallcom.2006.08.037
[44] Mahdiani M, Sobhani A, Salavati-Niasari M. Enhancement of magnetic, electrochemical and photocatalytic properties of lead hexaferrites with coating graphene and CNT: Sol-gel auto-combustion synthesis by valine. Sep Purif Technol, 2017; 185: 140-148. DOI: 10.1016/j.seppur.2017.05.029
[45] Borhade AV, Tope DR, Uphade BK. An efficient photocatalytic degradation of methyl blue dye by using synthesised PbO nanoparticles. E-J Chem, 2012; 9: 705-715. DOI: 10.1155/2012/362680
[46] Wang SF, Zhang C, Sun G et al. Fabrication of a novel light emission material AlFeO3 by a modified polyacrylamide gel route and characterization of the material. Opt Mater, 2013; 36: 482-488. DOI: 10.1016/j.optmat.2013.10.014
[47] Wang M, Lin Y, Yang H et al. A novel plate-like BaFe12O19@MoS2 core-shell structure composite with excellent microwave absorbing properties. J Alloys Compd, 2020; 817: 153265. DOI: 10.1016/j.jallcom.2019.153265
[48] Shawky A, Tashkandi NY, Albukhari SM et al. Ag2O/BaFe12O19 nanoheterojunctions for rapid photoelimination of atrazine herbicide in water under visible light. Ceram Int, 2021; 47: 25721-25728. DOI: 10.1016/j.ceramint.2021.05.298
[49] Wang S, Tang S, Gao H et al. Microstructure, optical, photoluminescence properties and the intrinsic mechanism of photoluminescence and photocatalysis for the BaTiO3, BaTiO3/TiO2 and BaTiO3/TiO2/CeO2 smart composites. Opt Mater, 2021; 118: 111273. DOI: 10.1016/j.optmat.2021.111273
[50] Wang S, Li M, Gao H et al. Construction of CeO2/YMnO3 and CeO2/MgAl2O4/YMnO3 photocatalysts and adsorption of dyes and photocatalytic oxidation of antibiotics: Performance prediction, degradation pathway and mechanism insight. Appl Surf Sci, 2022; 608: 154977. DOI: 10.1016/j.apsusc.2022.154977
[51] Salem S, Jafarzadeh-Ghoushchi S. Estimation of optimal physico-chemical characteristics of nano-sized inorganic blue pigment by combined artificial neural network and response surface methodology. Chemometr Intell Lab Syst, 2016; 159: 80-88. DOI: 10.1016/j.chemolab.2016.10.006
Copyright ©2022 The Author(s). This open-access article is licensed under a Creative Commons Attribution 4.0 International License (https://creativecommons.org/licenses/by/4.0), which permits unrestricted use, sharing, adaptation, distribution, and reproduction in any medium, provided the original work is properly cited.


