Effect of Deposition Time on Electrochemical Properties of Polyaniline Samples Prepared by Chemical Bath Deposition
S P Thokale1, Balkrishna J Lokhande1*
1Lab of Electrochemical Studies, School of Physical Sciences, Punyashlok Ahilyadevi Holkar Solapur University, Maharashtra, India
*Correspondence to: Balkrishna J Lokhande, PhD, Professor, Lab of Electrochemical Studies, School of Physical Sciences, Punyashlok Ahilyadevi Holkar Solapur University, Solapur Pune National Highway, Solapur, Maharashtra 413255, India; Email: bjlokhande@yahoo.com
Abstract
Objective: The objective of the current work is to synthesize the conducting polymer, i.e. polyaniline electrodes, with different reaction times using the chemical bath deposition (CBD) method. The further study involves its effect on structural, morphological, and electrochemical characteristics of the PANI electrodes.
Methods: The CBD method is used to synthesize the PANI electrodes. The analysis of the electrodes was carried out using X-Ray diffraction, contact angle, FESEM with EDX, Fourier-transform infrared spectroscopy, and electrochemical characterizations.
Results: The structural and wettability analysis confirmed the amorphous and hydrophilic properties of the PANI electrodes. The contact angle increased with an increase in the reaction time of the PANI electrodes. The morphological images of all samples showed that the thickness of the interconnected nanofibres increased with the deposition time. Electrochemical analysis of the PANI electrodes was carried out by cyclic voltammetry (CV), galvanostatic charge-discharge (GCD), and electrochemical impedance spectroscopy. The evaluated highest value of specific capacitance (SC) by CV was 601F/g at 5mV/s in 1M KOH. GCD provided specific energy of 9.10Whg−1, specific power of 22kW kg−1, and an efficiency of 92.89%.
Conclusion: It is feasible to synthesize PANI samples with the CBD method. The physical and electrochemical properties of electrodes prepared at different deposition times change with increasing deposition times. Deposition time does not affect the amorphous nature of the sample, and the sample deposited for 60min exhibited the highest SC 601F/gm at 5mVs-1.
Keywords: polyaniline, chemical bath deposition, electrochemical study, time variation
1 INTRODUCTION
The supercapacitor is a novel energy storage device with high energy and power. Hence, it is usually utilized for energy storage and power delivery. Electrochemical supercapacitors are (a) electric double layer capacitors (EDLCs) that stores charges electro-statically at the electrode-electrolyte boundary, (b) pseudo-capacitor stores that charge electrochemically, and (c) hybrid Supercapacitor that stores charges electrostatically and electrochemically. Generally, carbon composites are preferred as electrode materials for EDLCs[1-4], whereas the composites and transition metal oxides conducting polymers (CPs) were for pseudo-capacitors[2].
Recently, CP has seen significant demand in the technology sector. There are various CPs used in supercapacitors, actuators, and electronic devices, such as polythiophene, polyaniline (PANI), polypyrrole, polyacetylene, and polyindole. The organo-metallic composites, organic materials, and polymers have been employed in batteries and supercapacitors[4-9]. The different electrical CPs have also been used in batteries and supercapacitors[10-13]. PANI is synthesized either by chemical oxidative polymerization or electrochemically oxidative polymerization[14]. Synthesis of the PANI electrode can be done by multiple methods such as spray pyrolysis[15], electrodeposition[16], chemical vapour deposition[17], and chemical bath deposition (CBD)[18]. The PANI is seen as a suitable electrode material because of its high electrical conductivity, water-soluble monomer, good environmental stability, room-temperature synthesis, good redox reversibility, and high charge storage ability[19]. PANI is the most advantageous CP used for various electrochemical devices such as electrochemical supercapacitors, fuel cells, and batteries[20]. Belanger et al observed a 5% loss of specific capacitance (SC) of PANI up to 20,000 cycles[21]. Amongst all methods, CBD is exceptionally manageable and cost-effective and does not require any sophisticated instrumentation. Thus, the present study focused on the synthesis of PANI on the stainless steel (SS) current collector at various dip times by CBD technique. Physical and electrochemical analyses were performed on the prepared samples to optimize the sample electrodes.
2 MATERIALS AND METHODS
2.1 Synthesis of PANI
Aniline, sulfuric acid, and ammonium perdioxysulfate (APS) used for synthesis were purchased from Sigma-Aldrich. All reagents are of AR grade. The deposition bath was prepared with 1M (40mL) aniline, 1.5M (40mL) H2SO4 and 1.25M (20mL) APS dissolve separately in double distilled water (DDW). Oxidizing agents such as ammonium dichromate, ammonium predioxysulphate, ammonium cerium, nitrate mixture, and hydrogen peroxide were used. Among all these oxidizers APS can form cation-radicals from aniline monomers that are used to initiate the polymerization of PANI, and APS also yields larger polymer chains within an extremely short reaction time. Here, APS acts as an oxidizing agent in the polymerization of aniline at various deposition periods. The well-polished conducting SS substrates were used as a current collector for the deposition of PANI. The deposition was carried out at room temperature at the constant stirring of 1500rpm for 60, 90, 120, 150, and 180min. The deposition time periods varied because uniform and adherent PANI thin films were expected. Initially, the bath solution is bluish in color and over time, it turns green in color due to the polymerization of aniline (Figure 1). After completion of the deposition process, samples were washed using DDW three to four times to remove loosely bound particles and then dried at room temperature. These prepared samples were denoted as MN1, MN2, MN3, MN4, and MN5.
|
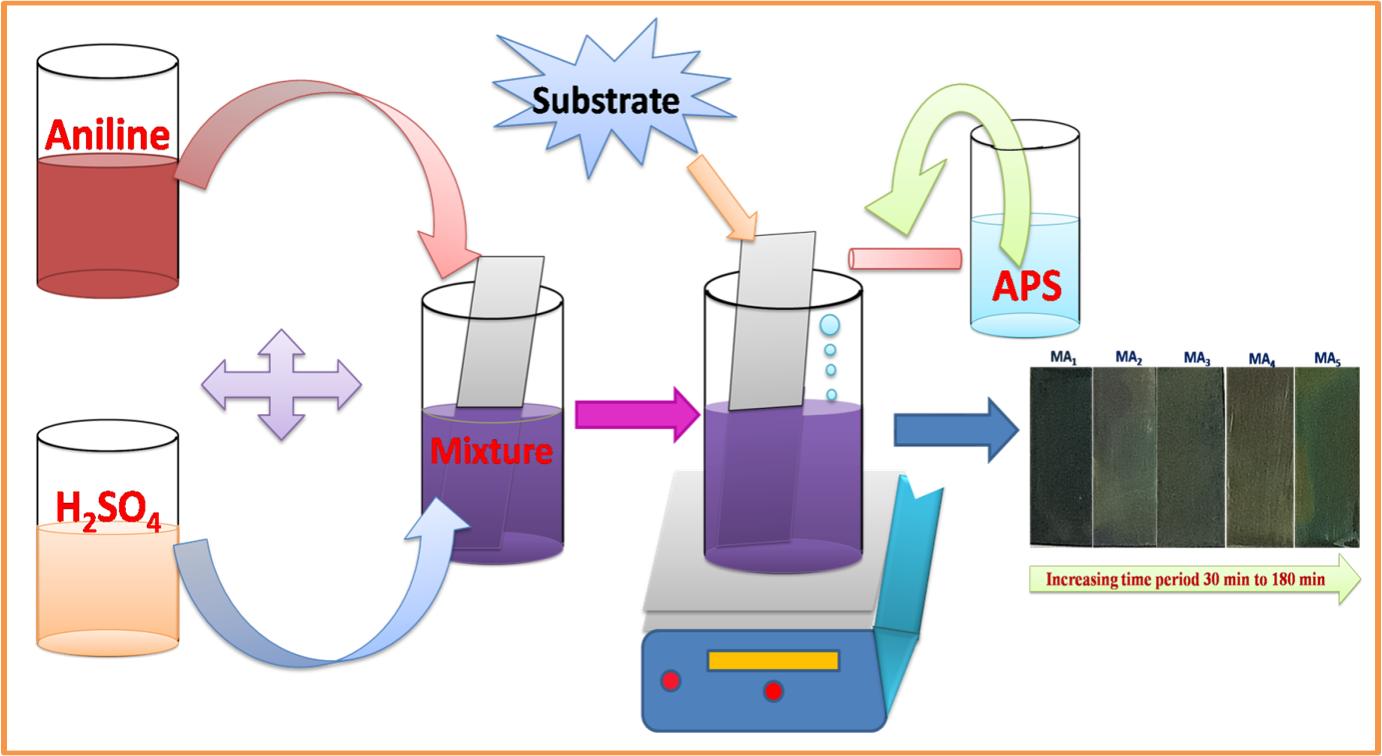
Figure 1. The CBD method for the deposition of PANI thin films.
2.2 Growth Mechanism of PANI Thin Films
The deposition techniques of thin-film deposition can be divided into two groups based on the nature of the deposition process viz, physical or chemical methods. Among all these methods, the CBD technique is well known and of simple operation. For the chemical polymerization of the solution, monomers must be oxidized initially, as shown in schematic Figure 1.
Oxidation of the aniline monomer with oxidizing agent generates radical cations for further polymerization. The oxidizing agent removes a proton from an aniline monomer. The addition of the proton takes place by adding protonic acid at the completion of the polymerization reaction. The same was observed by Saini et al[22]. The emeraldine form is associated with the partially oxidized or reduced state. They are distinguished by four different colors, namely, Leucoemeraldine- white/clear and colorless, Emeraldine salt- green, Emeraldine base-blue, Pernigraniline-blue/violet. The prepared PANI thin-film electrodes showed blue-green in color. The possible chemical reaction is as in Figure 2.
|
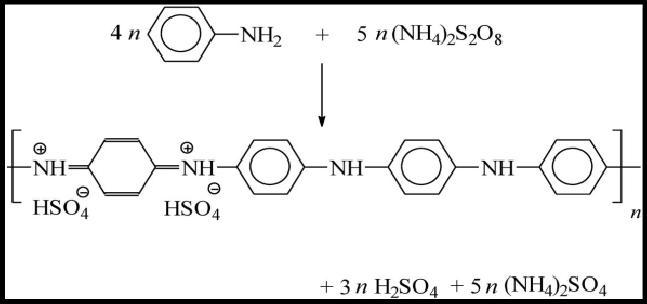
Figure 2. The reaction mechanism of aniline polymerization.
2.3 Characterizations
The prepared PANI thin films were characterized by different characterization techniques. The surface morphology and energy dispersive X-ray were analyzed by Field Emission Scanning Electron Microscopy (FE-SEM). The crystallographic studies of deposited PANI thin-film electrodes were analyzed using the diffractometer (Ultima IV Rigaku D/max 2550Vb+18kw with CuKα radiation =1.54056 Å, Japan) with diffraction angles of (2) 20-80. The thickness of PANI thin films was measured by the conventional weight difference method using a highly sensitive analytical microbalance (Tapson-100TS, USA) of a minimum count of 10–5g. The wettability study was performed using Holmarc contact angles. The electrochemical analysis of PANI thin-film electrodes was performed by cyclic voltammetry (CV) and galvanostatic charge-discharge (GCD) using an electrochemical analyzer (CHI 408C, USA), of a three-electrode system. The Nyquist impedance plot was carried out using Zip Win software over a frequency range of 1mHz-1MHz with an open circuit potential of -0.043V.
3 RESULTS AND DISCUSSION
3.1 X-ray Diffraction
Figure 3 depicts the X-ray diffraction pattern of the synthesized PANI electrodes. All samples exhibited the same amorphous nature, indicated by XRD patterns[23-24]. The amorphous nature of the PANI electrode contributed to the better performance of the electrochemical capacitive device.
|
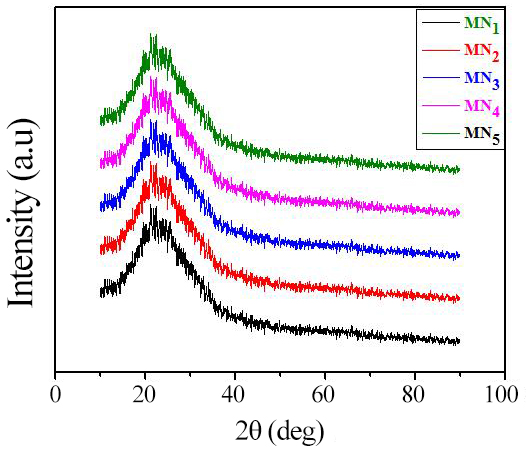
Figure 3. XRD patterns of all the PANI samples.
3.2 Wettability Study
To study the wettability nature of the prepared PANI films, contact angle measurement was conducted for all samples (Figure 4). In this process, a liquid electrolyte drop was kept on the sample surface, and a contact angle meter was used to photograph the interaction of the liquid with the sample surface.
|
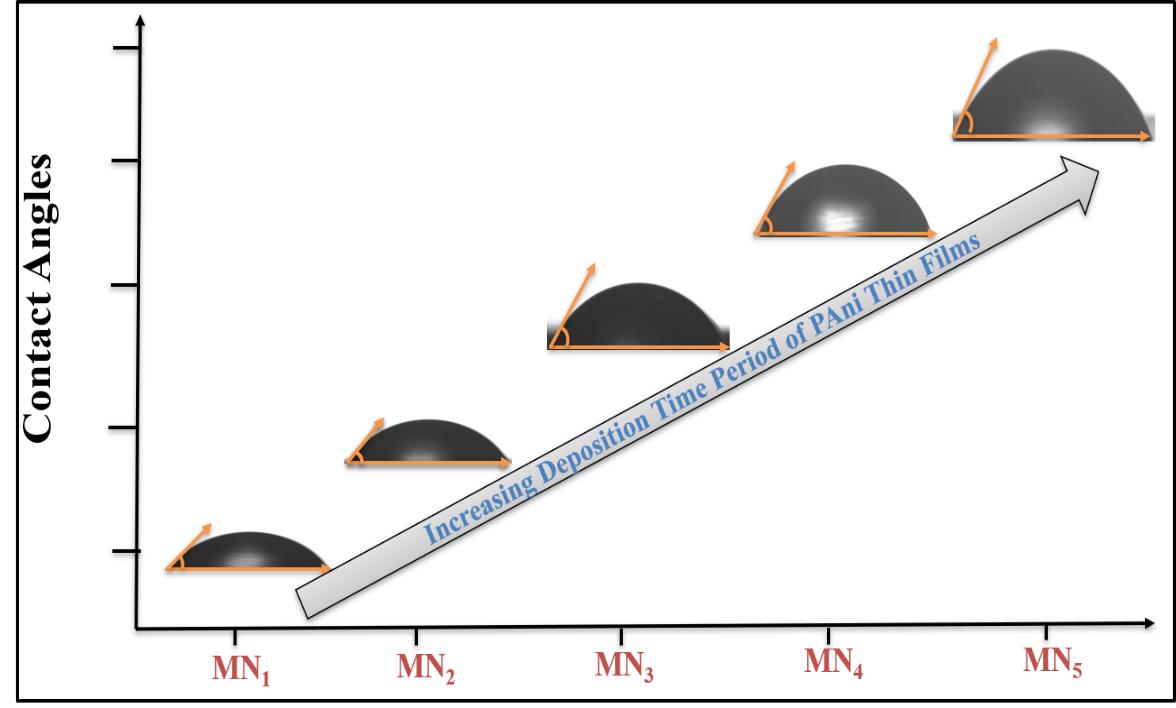
Figure 4. Contact angles of the various PANI samples.
Figure 4 shows that the observed contact angles are less than 90°. The contact angle increases with increasing deposition time, indicating a decrease in the hydrophilicity of the sample. This may be due to the strong cohesive force between hydroxide present in nanofibres, water, and electrolyte droplets (electrolyte 1M KOH). In general, a low contact angle results in high wettability, and the surface is thus considered hydrophilic[25].
3.3 Fourier-Transform Infrared Spectroscopy (FTIR)
FTIR patterns of prepared PANI electrodes show a number of peaks (Figure 5). The molecular structure of PANI samples displays a range of 4000 to 500cm-1. The IR bands (3210, 3262cm-1) show N-H stretching vibrations[26-28], and C-H stretching vibrations are observed in CH3 at 2971, 2935cm-1[26]. C-H vibrations in CH2 are observed at 2862, 2854cm-1[26], and C=N stretching vibrations of the quinoid ring are observed at 1739cm-1[26]. The peaks at 1571 and 1574 demonstrate the C=C stretching vibrations of the quinoid ring[29-30], and at 1451 and 1571cm-1, stretching vibrations of the benzene ring are observed. The peak at 1451cm-1 shows C-N+ stretching vibrations[26]. The peak at 1301cm-1 shows C-N stretching vibrations of aromatic ring[31], at 1206cm-1 shows stretching vibrations in an aromatic primary ring [27], at 1100 and 1118cm-1 shows plane bending vibrations of aromatic C-H[29], at 913cm-1 shows quinoid ring -NH+- benzoic ring stretching vibrations[26], at 904cm-1 shows C-H out of the plane bending vibrations[28], at 810cm-1 and 671cm-1 shows meta substitutions, 1,3 disubstitution in benzene ring[33], at 713,501cm-1 shows ortho substitutions, 1,2 disubstitutions in benzene ring[30], and at 608,603cm-1 vibrations in aryl nitro compounds are observed[29]. Therefore, it can be concluded that the samples obtained are PANI.
|
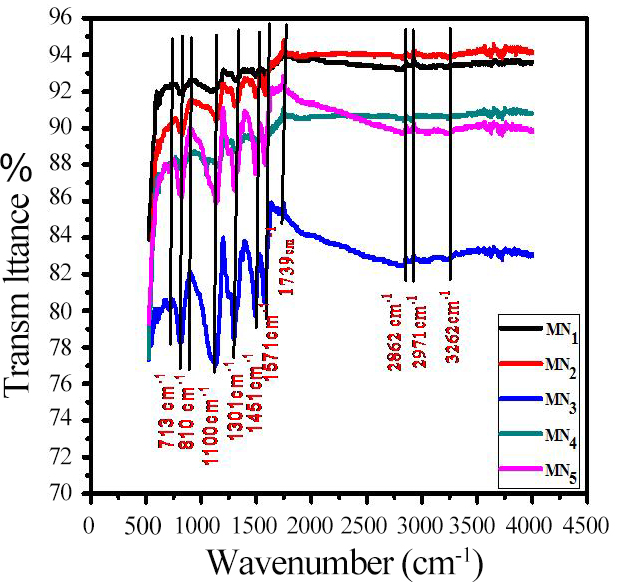
Figure 5. FT-IR patterns of the deposited PANI samples.
3.4 FE-SEM and EDX Spectra of PANI
The surface morphology of the CBD method prepared by diffused interconnected nanofibres samples is studied by FE-SEM images, as shown in Figure 6 MN5-MN1. From FE-SEM images, nanofibres are diffused and are highly porous with a mean diameter of 40nm to 160nm, providing a large surface area for supercapacitor[34]. Figure 6 (MN5-MN1) shows the surface morphology variations of PANI electrodes, which are observed using FE-SEM at 5000x. With an increase in dip time, the morphology changes from a compact dense mud-like structure to a large number of diffused nanofibres produced, and the size of nanofibres also are changed. Such porous diffused nanofibres morphology definitely enhances the performance of PANI films[35]. Figure 6 (MN5) shows surface morphological images of 180min (MN5), which displays a mud-like structure with an extremely small particle size of nearly 40 to 50cm nm. Figure 4 (MN4-MN3) time period (150-120min) for the deposition of the synthesized PANI electrode material on the SS substrate decreases, the number of diffused nanofibers increases and the size of the nanofibers is 55nm to 100nm. Further, the time was again reduced to 90-60min (MN2 to MN1), the PANI material was converted to a very large number of diffused nanofibres, and the size was also increased by 109nm to 159.6nm, as observed in FE-SEM image Figure 6 (MN1).
|
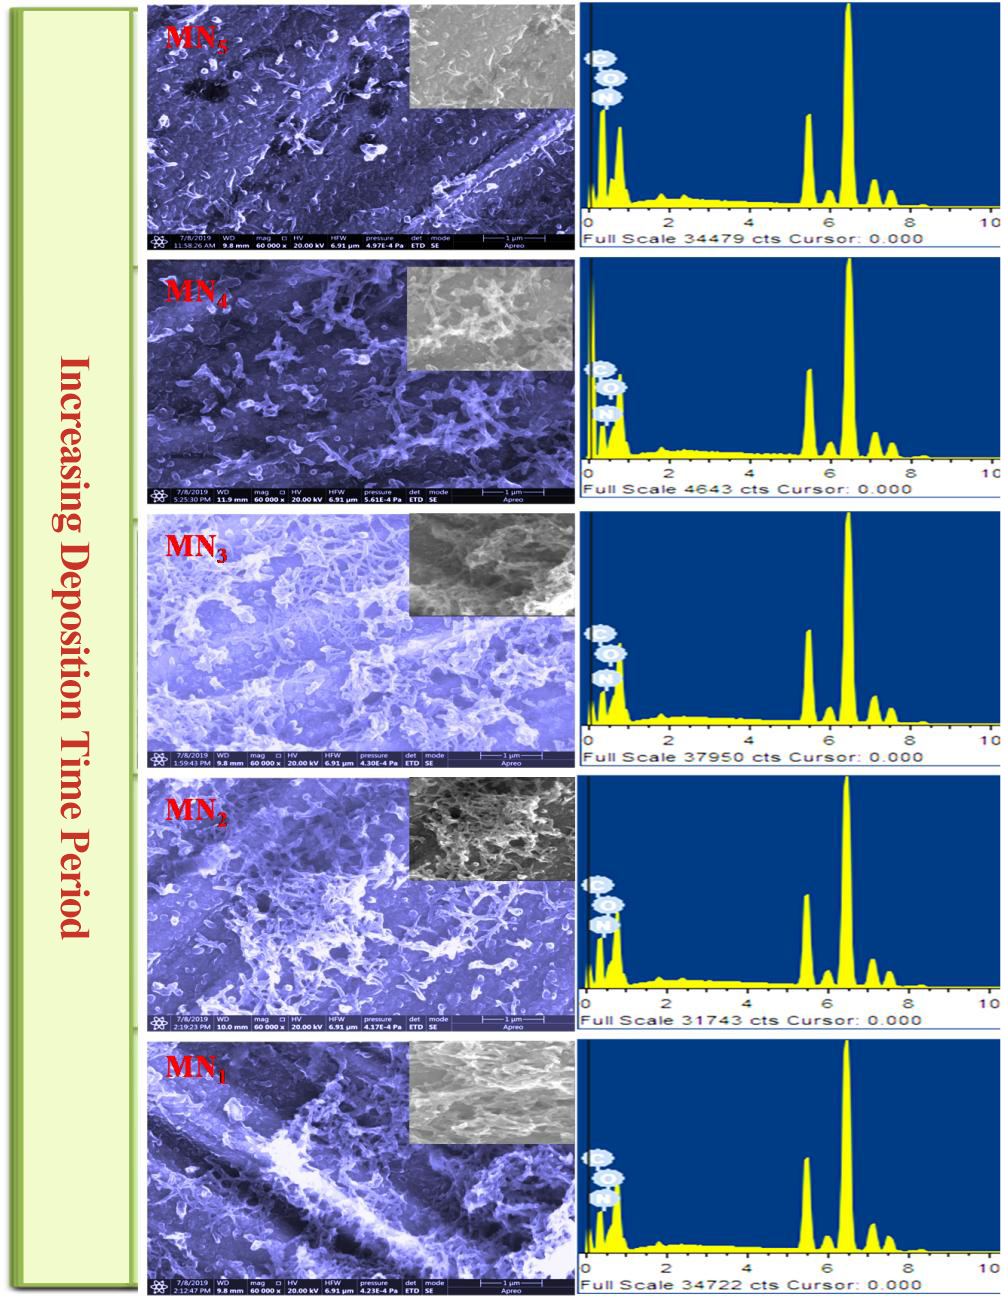
Figure 6. FE-SEM and EDX of PANI electrodes.
Figure 6 shows that MN1 MN1 PANI shows a very large number of diffused nanofibres and an increase in size from 109nm to 159.6nm, as observed in FE-SEM image Figure 6 (MN1). This porous diffused nanofibres nature is vital for the better performance of electrochemical supercapacitor application, as it provides an improvement in the surface area of the electrodes. Again, the porous structure of the nanofibers decreases with increasing time. MN1 displays extremely long nanofibres of nearly 159.6nm, which helps to store more charge in the active electrode (PANI), as most of the active electrode materials undergo pseudocapacitive behavior.
The FE-SEM images show that the number of nanofibers decreases with increasing deposition time. The diffuse interconnected nanofiber morphology is obtained at 60min of the MN1 polymerization. With the increase in polymerization time, the conversion of nanofibers decreases and becomes a compact mud-like structure. The corresponding EDX spectra and SEM images in Figure 6 show only N, O, H, and a C element signal in weight percentage and atomic percentage.
3.5 Electrochemical Analysis
3.5.1 CV Study
CV is used to analyze the capacitive behavior of synthesized PANI samples. Figure 7A shows CV curves of MN1, MN2, MN3, MN4, and MN5 electrodes at the scan rate of 5mVs-1 within -1.5 to 0.5V in 1M KOH aqueous electrolyte. It indicates the significant differences in the CV curves of different PANI samples. The SC values of PANI samples were estimated using the following relation[36].
|
The estimated SC values for PANI MN5, MN4, MN3, MN2, and MN1 samples at 5mVs-1 scan rate are given in Table 1. Sample MN1 produces the highest SC value. Further CV curves of the MN1 sample at different scan rates of 5, 10, 20, 50, and 100mVs-1 are shown in Figure 7B for the MN1 PANI electrode. The redox peaks seen in the curves are due to oxidation and reduction of active sites at the electrode. The arrival of redox peaks indicates the pseudocapacitive nature of the PANI electrodes[15]. The calculated SC values for the MN1 electrode at different scan rates are given in Table 1. The sample MN1 exhibits the highest SC of 601F/g at 5mVs-1. With the rise in the scan rate, the current response also increases, which is a sign of ideal capacitive behavior. The value of SC decreases with increasing scan rate, which indicates the existence of the inner active materials that do not undergo the redox reactions in bulk materials, as well as the inaccessibility of the electrode surface reactive materials at higher charge and discharge rates[37]. Figure 7C shows variation in SC values of PANI samples with the scan rate.
|
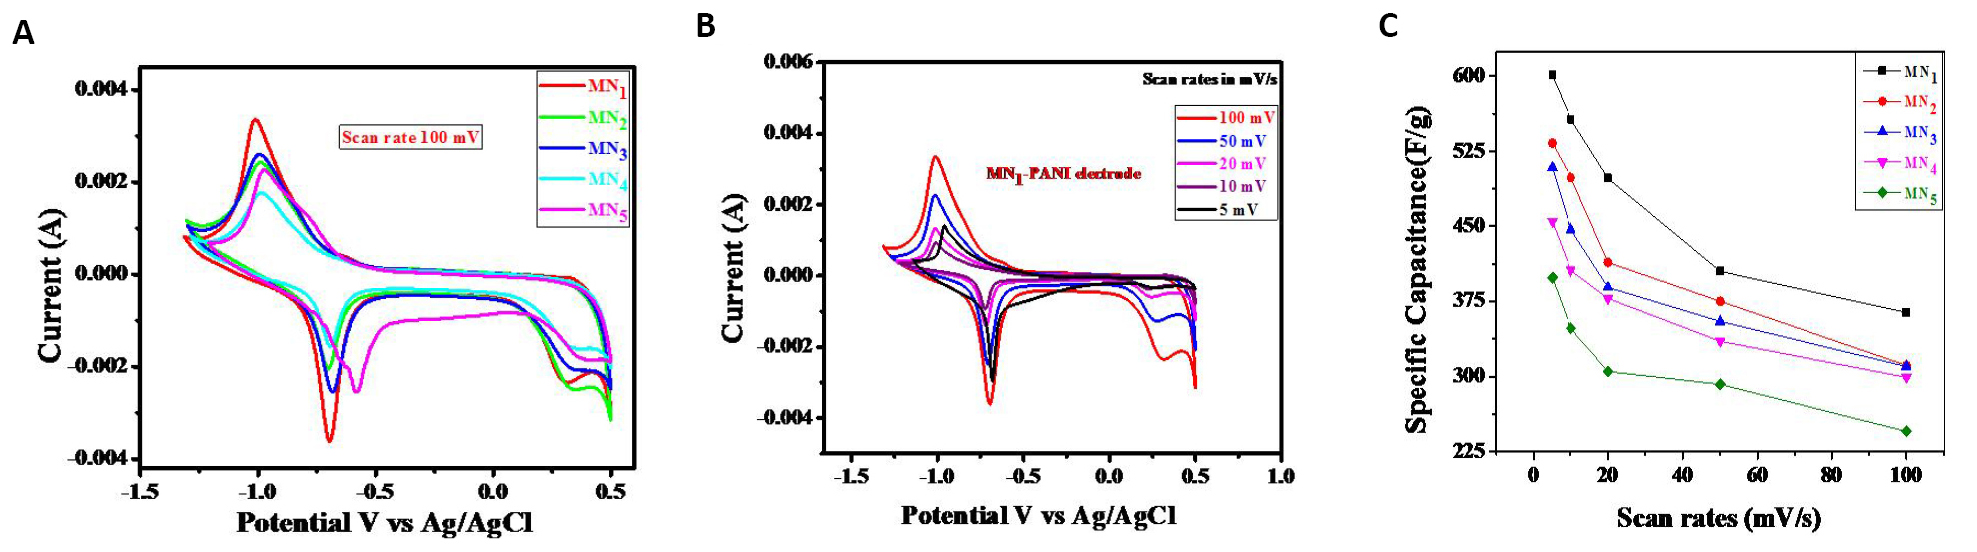
Figure 7. Analyzing the capacitance behavior of synthetic PANI samples. A: CVs of MN1, MN2, MN3, MN4, and MN5 at 100mV/s; B: CVs of MN1 at different scan rates; C: Variation in the SC vs scan rate for different samples.
Table 1. SC Values of Different PANI Electrodes at Different Scan Rates
SC in (F/g) |
|||||
Electrodes Scan Rates (mV/s) |
MN1 60min |
MN2 90min |
MN3 120min |
MN4 150min |
MN5 180min |
5 |
601 |
533.2 |
509 |
455 |
399 |
10 |
557 |
499 |
447 |
406 |
348 |
20 |
498 |
414 |
389 |
378 |
305 |
50 |
405 |
375 |
355 |
335 |
292 |
100 |
364 |
311 |
310 |
299 |
245 |
Table 2. Shows SC Data of Some PANI Electrodes Deposited by CBD Available in the Literature[38-40]
Sr. No. |
Dischage Current (mA) |
Charge Time (tc) (s) |
Discharge Time (td) (s) |
Specific Power (Watt/g) |
Specific Energy (watt hr/kg) |
Efficiency (η %) |
1 |
2 |
18.19 |
15.81 |
1.17 |
5.13 |
86.92 |
2 |
4 |
4.13 |
3.71 |
8.83 |
9.10 |
89.83 |
3 |
6 |
2.39 |
2.22 |
13.25 |
8.17 |
92.89 |
4 |
8 |
1.87 |
1.57 |
17.66 |
7.70 |
83.96 |
5 |
10 |
1.57 |
1.05 |
22.08 |
6.42 |
66.69 |
3.5.2 GCD Study
The GCD analysis also helps to test the performance of electrochemical behavior of the PANI samples. Figure 8A and B show the GCD curves of PANI samples in an aqueous 1M KOH within the potential range of -1.2 to 0.5V. Figure 8A clearly shows that the charging and discharging curves of all samples at different current densities are not symmetrical and exhibit a pseudocapacitive nature. Similar behavior has been observed by Thokale et al[41].
|
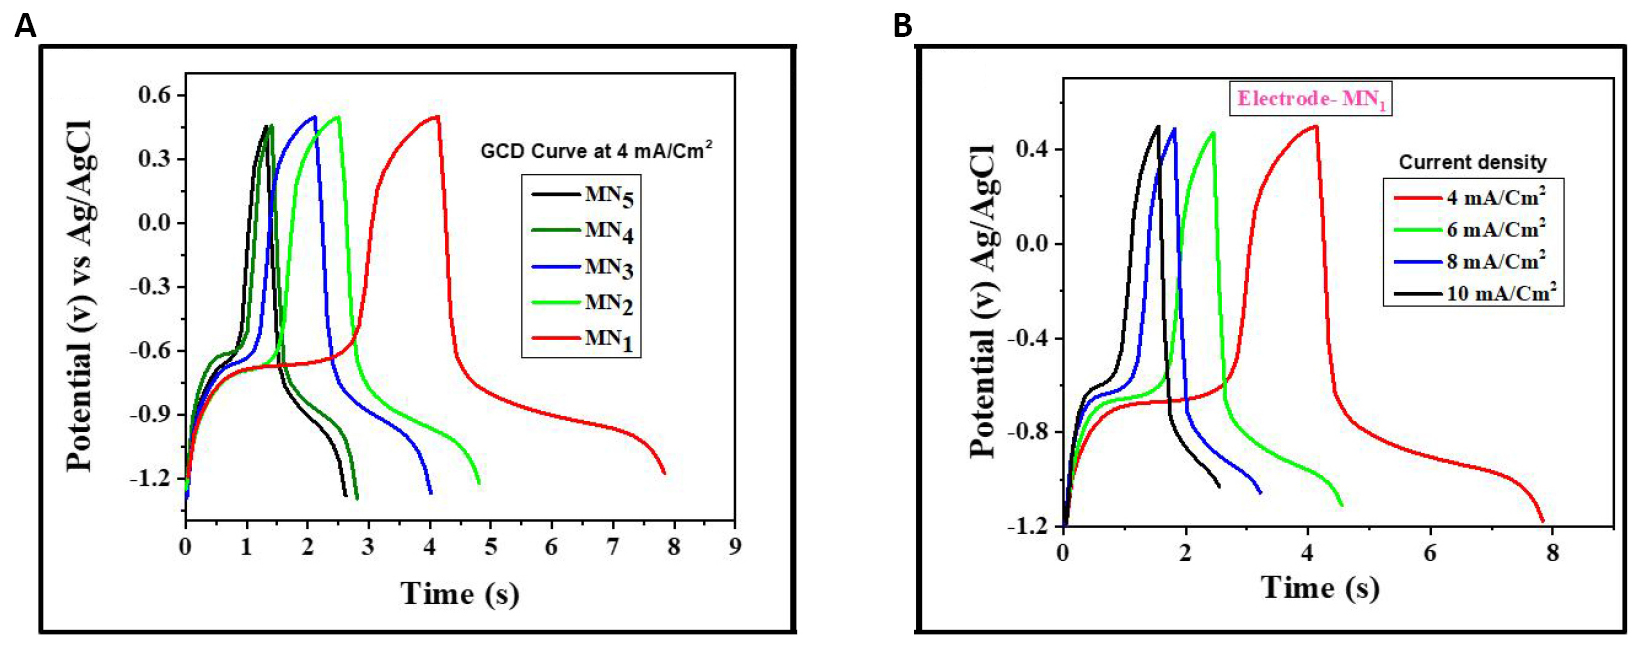
Figure 8. GCD curves of PANI samples. A: GCD curves of MN1, MN2, MN3, MN4, MN5 at 4mA/cm2; B: GCD curve of MN1 at the different current densities.
Specific energy and specific power of PANI samples were calculated using GCD curves and are estimated by the following relations[2-4]:
|
|
|
Here, Id is the discharging current, Tc and Td are the charging and discharging times, V is the potential and W is the weight of deposited active material. All the values of the specific power, specific energy, and columbic efficiency of the MN1 PANI sample at variable current densities are given in Table 3. The maximum specific energy and specific power observed in aqueous 1M KOH are 22.08W/g and 9.10Wh/kg.
Table 3. Specific Power, Specific Energy, and Columbic Efficiency of MN1 Sample at Different Current Densities
Material |
Crystal Structure |
Synthesis Method |
Concentration of Solution and Deposition Time |
Contact Angle |
Potential Range |
Electrolyte |
Sp. Capacitane (F/g) |
Ref. |
PANI |
Nanocrystalline |
CBD |
0.2M aniline 0.2M APS 0.2M H2SO4 2-6h |
- |
-0.1 to 0.8 |
1M H2SO4 |
503 |
1 |
PANI |
Amorphous |
MW-CBD |
- |
Hydrophilc |
-0.2 to 0.8 |
1M H2SO4 |
546 |
2 |
PANI |
Amorphous |
MW-CBD |
- |
Hydrophilc |
-0.2 to 0.8 |
0.5 M H2SO4 |
753 |
3 |
PANI |
Amorphous |
CBD |
1.0M aniline 1.25M APS 1.5M H2SO4 60, 90, 120, 150, 180min |
Hydrophilc |
-1.5 to 1 |
1M H2SO4 |
601 |
Present work |
3.5.3 Electrochemical Impedance Spectrometry (EIS)
EIS is a fundamental technique used for the analysis of resistive and capacitive behaviors of material used in supercapacitors. Figure 9 shows the Nyquist plot of the optimized MN1 sample analyzed using the electrochemical impedance analyzer/spectrometer in an aqueous 1M KOH electrolyte solution operated at an AC frequency of 1MHz to 1mHz. The higher frequency region consists of the faradic resistance, charge transfer resistance (Rct), or electrolyte resistance. In a lower frequency region, the electrolytes diffuse to the active electrode sites, creating diffusion resistance called Warburg resistance. The electrolyte resistance, i.e. an equivalent series resistance (ESR), is composed of the ionic resistance of the KOH, the resistance of the SS, and the contact resistance of the deposited PANI and SS. Rct is observed in the redox reaction between the electrode material and the electrolyte[38]. The total internal resistance or ESR of the MN1 sample is observed to be 1.30Ω/cm2.
|
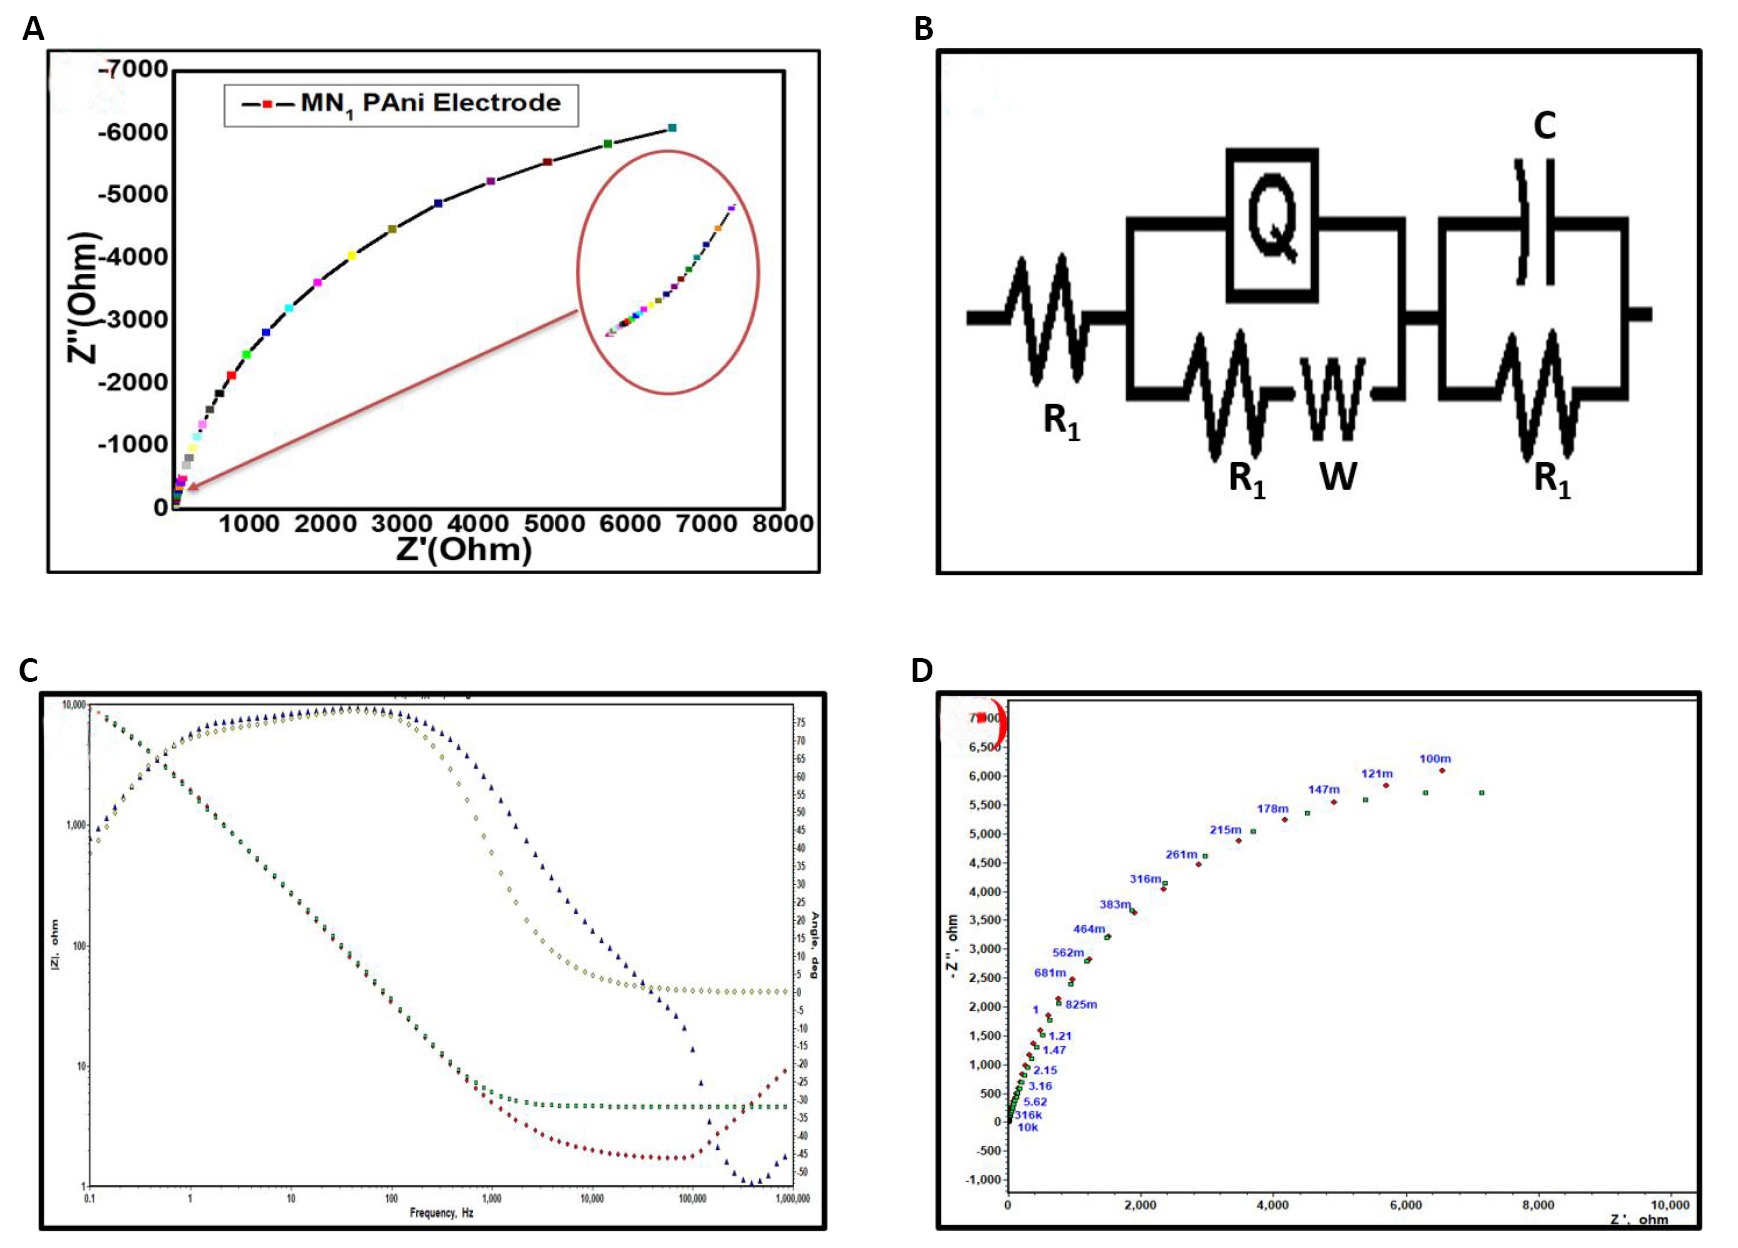
Figure 9. MN1 sample analyzed using the electrochemical impedance analyzer/spectrometer. A: Nyquist plot of optimized MN1 sample; B: An ESR; C: Bode plot; D: Matched nyquist plot.
4 CONCLUSION
In a CBD method, it is possible to synthesize PANI samples at different deposition times. The deposition time does not affect the amorphous nature of the samples. It was observed that the sample deposited for 60min showed the highest SC value of 601F/gm at 5mVs-1. The morphology changed from compact mud-like to diffused nanotube with deposition time. All deposited samples were hydrophilic. The observed highest specific energy was 9.10Whg−1, the specific power was 22.08kWkg−1, and the coulombic efficiency was 92.89%. Overall, a sample, deposited for 60min, exhibited good capacitive behavior.
Acknowledgments
Not applicable.
Conflicts of Interest
The authors declared no conflict of interest.
Author Contribution
Thokale SP and Lokhande BJ designed, wrote and revised the article. Both authors approved the final version.
Abbreviation List
CBD, Chemical bath deposition
CV, Cyclic voltammetry
GCD, Galvanostatic charge-discharge
EIS, Electrochemical impedance spectroscopy/spectrometry
SC, Specific capacitance
PANI, Polyaniline
CPs, Conducting polymers
EDLCs, Electric double layer capacitors
SS, Stainless steel
APS, Ammonium perdioxysulfate
DDW, Double distilled water
FE-SEM, Field emission scanning electron microscopy
FTIR, Fourier-transform infrared spectroscopy
ESR, Equivalent series resistance
Rct, Charge transfer resistance
References
[1] Booth TJ, Blake P, Nair RR et al. Macroscopic graphene membranes and their extraordinary stiffness. Nano Lett, 2008; 8: 2442-6. DOI: 10.1021/nl801412y
[2] Turky AO, Rashad MM, Hassan AM et al. Optical, electrical and magnetic properties of lanthanum strontium manganite La1-xSrxMnO3 synthesized through the citrate combustion method. Phys Chem Chem Phys, 2017; 19: 6878-6886. DOI: 10.1039/c6cp07333f
[4] Turky AO, Rashad MM, Kandil Ael-H et al. Tuning the optical, electrical and magnetic properties of Ba0.5Sr0.5TixM1-xO3 (BST) nanopowders. Phys Chem Chem Phys, 2015; 17: 12553-60. DOI: 10.1039/C5CP00319A
[5] Wu G, Cheng Y, Wang K et al. Fabrication and characterization of OMMt/BMI/CE composites with low dielectric properties and high thermal stability for electronic packaging. J Mater Sci: Mater Electron, 2016; 27: 5592-5599. DOI: 10.1007/s10854-016-4464-y
[6] Li M, Cao X, Zhang S et al. Ternary composite RGO/MoS2@Fe3O4: synthesis and enhanced electromagnetic wave absorbing performance. J Mater Sci: Mater Electron, 2017; 28: 16802-16812. DOI: 10.1007/s10854-017-7595-x
[7] Wu G, Cheng Y, Ren Y et al. Synthesis and characterization of γ Fe2O3@Cnanorod-carbon sphere composite and its application as microwave absorbing material. J Alloys Compd, 2015; 652: 346-350. DOI: 10.1016/j.jallcom.2015.08.236
[8] Vidyasagar GM, Sonawane S, Rao KP et al. Biosynthesis of Ag: C20H9CLO5Ag: carbon using opuntia cochenillifera fruit extract and its electrochemical study for antioxidant applications. Int J Adv Sci Eng Tech, 2017; 5: 36-38.
[9] Thakur A, Lokhande B. Effect of number of SILAR cycles on on cyclic voltammetric performance of PPy: CoO(OH) flexible hybrid electrodes prepared using pyrrole and Co(NO3)2. Int J Ind Electron Electr Eng, 2017; 5: 146-149.
[10] Vidal JC, Garcia E, Castillo JR. In situ preparation of a cholesterol biosensor: entrapment of cholesterol oxidase in an over oxidized polypyrrole film electrodeposited in a flow system: Determination of total cholesterol in serum. Anal Chim Acta, 1999; 385: 213-22. DOI: 10.1016/S0003-2670(98)00838-1
[11] Campbell TE, Hodgson AJ, Wallace GG. Incorporation of erythrocytes into polypyrrole to form the basis of a biosensor to screen for rhesus (D) blood groups and rhesus (D) antibodies. Electroanal, 1999; 11: 215-222. DOI: 10.1002/(SICI)1521-4109(199904)11:4<215::AID-ELAN215>3.0.CO;2-%23
[12] Kincal D, Kumer A, Child AD et al. Conductivity switching in polypyrrole-coated textile fabrics as gas sensors. Synth Met, 1998; 92: 53-6. DOI: 10.1016/S0379-6779(98)80022-2
[13] Kemp NT, Fianagan GU, Kaiser AB et al. Temperature-dependent conductivity of conducting polymers exposed to gases. Synth Met, 1999; 101: 434-5. DOI: 10.1016/S0379-6779(98)01118-7
[14] Nicolas-Debarnot D, Poncin-Epaillard F. Polyaniline as a new sensitive layer for gas sensors. Anal Chim Acta, 2003; 475: 1-15. DOI: 10.1016/S0003-2670(02)01229-1
[15] Fugare BY, Thakur AV, Kore RM et al. Spray pyrolysed Ru: TiO2 thin film electrodes prepared for electrochemical supercapacitr. AIP Conf Proc, 2018; 1942: 140010. DOI: 10.1063/1.5029141
[16] Nagarajan N, Zhitomirsky I. Cathodic electrosynthesis of iron oxide films for electrochemical supercapacitors. J Appl Electrochem, 2006; 36: 1399-1405. DOI: 10.1007/S10800-006-9232-X
[17] Maruyama T, Shinyashiki Y. Iron-iron oxide composite thin films prepared by chemical vapor deposition from iron pentacarbonyl. Thin Solid Films, 1998; 333: 203-206. DOI: 10.1016/S0040-6090(98)00999-7
[18] Deshmukh PR, Bulakhe RN, Pusawale SN et al. Polyaniline-RuO2 composite for high performance supercapacitors: chemical synthesis and properties. RSC Adv, 2015; 5: 28687-28695. DOI: 10.1039/c4ra16969g
[19] Stejskal J, Gilbert RG. Polyaniline. Preparation of a conducting polymer (IUPAC Technical Report). Pure Appl Chem, 2002; 74: 857-867. DOI: 10.1351/pac200274050857
[20] Conway BE. Electrochemical supercapacitors: scientific fundamentals and echnological applications. Springer New York: New York, USA, 1999. DOI: 10.1007/978-1-4757-3058-6
[21] Hodes G. Chemical solution deposition of semiconductor films. CRC Press: New York, USA, 2002. DOI: 10.1201/9780203909096
[22] Saini P, Choudhary V, Singh BP et al. Polyaniline-MWCNT nanocomposites for microwave absorption and EMI shielding. Mater Chem Phys, 2009; 113: 919-26. DOI: 10.1016/j.matchemphys.2008.08.065
[23] Deshmukh PR, Pusawale SN, Shinde NM et al. Growth of polyaniline nanofibers for supercapacitor applications using successive ionic layer adsorption and reaction (SILAR) method. J Korean Phys Soc, 2014; 65: 80-86. DOI: 10.3938/jkps.65.80
[24] Kuang H, Cao Q, Wang X et al. Influence of the reaction temperature on polyaniline morphology and evaluation of their performance as supercapacitor electrode. J Appl Polym Sci, 2013; 130: 3753-3758. DOI: 10.1002/APP.39650
[25] Shinde PA, Lokhande VC, Chodankar NR et al. Enhanced electrochemical performance of monoclinic WO3 thin film with redox additive aqueous electrolyte. J Colloid Interface Sci, 2016; 483: 261-267. DOI: 10.1016/j.jcis.2016.08.011
[26] Du X, Xu Y, Xiong L et al. Polyaniline with high crystallinity degree: Synthesis, structure, and electrochemical properties. J Appl Polym Sci, 2014; 131: 40827. DOI: 10.1002/app.40827
[27] Jarad AN, Ibrahim K, Ahmed NM et al. Synthesis and characterization of thin films of conductive polymer (PANI) for optoelectronic device application. AIP Conf Proc, 2016; 1733: 020020. DOI: 10.1063/1.4948838
[28] Coates J. Interpretation of Infrared Spectra, A Practical Approach. In Encyclopedia of Analytical Chemistry: Applications, Theory and Instrumentation. Meyers RA Ed. John Wiley & Sons Ltd: Chichester, UK, 2000; 10815-10837. DOI: 10.1002/9780470027318.a5606
[29] Gong X, Dai L, Mau AWH et al. Plasma-polymerized polyaniline films: synthesis and characterization. J Polym Sci A, 1998; 36: 633-643. DOI: 10.1002/(SICI)1099-0518(199803)36:4<633::AID-POLA12>3.0.CO;2-N
[30] Tamirisa PA, Liddell KC, Pedrow PD et al. Pulsed-plasma-polymerized aniline thin films. J Appl Polym Sci, 2004; 93: 1317-1325. DOI: 10.1002/app.20498
[31] Lakshmi GBVS, Dhillon A, Siddiqui AM et al, RF-plasma polymerization and characterization of polyaniline. Eur Polym J, 2009; 45: 2873-2877. DOI: 10.1016/j.eurpolymj.2009.06.027
[32] Ohsaka T, Ohnuki Y, Oyama N et al. IR absorbtion spectroscopic identification of electroactive and electroinactive polyaniline films prepared by the electrochemical polymerization of aniline. J Electroanal Chem Interfacial Electrochem, 1984; 161: 399-405. DOI: 10.1016/S0022-0728(84)80198-9
[33] Cruz GJ, Morales J, Castillo-Ortega MM et al. Synthesis of polyaniline films by plasma polymerization. Synth Met, 1997; 88: 213-218. DOI: 10.1016/S0379-6779(97)03853-8
[34] Dhawale DS, Dubal DP, Jamadade VS et al. Fuzzy nanofibrous network of polyaniline electrode for supercapacitor application. Synth Met, 2010; 160: 519-522. DOI: 10.1016/j.synthmet.2010.01.021
[35] Thakur AV, Lokhande BJ. Impact of aging on the electrochemical performance of RuO2@PPy hybrid flexible electrodes: Electrochemical study in aqueous Na2SO4. J Electron Mater, 2022; 51: 1533-1540. DOI: 10.1007/s11664-021-09403-8
[36] Wang K, Huang J, Wei Z. Conducting polyaniline nanowire arrays for high performance supercapacitors. J Phys Chem C, 2010; 114: 8062-8067. DOI: 10.1021/jp9113255
[37] Yuan Y, Zhu W, Du G et al. Two-step method for synthesizing polyaniline with bimodal nanostructures for high performance supercapacitors. Electrochim Acta, 2018; 282: 286-294. DOI: 10.1016/j.elect Acta.2018.06.006
[38] Dhawale DS, Vinu A, Lokhande CD. Stable nanostructured polyaniline electrode for supercapacitor application. Electrochim Acta, 2011; 56: 9482-9487. DOI: 10.1016/j.electacta.2011.08.042
[39] Deshmukh PR, Shinde NM, Patil SV et al. Supercapacitive behavior of polyaniline thin films deposited on fluorine doped tin oxide (FTO) substrates by microwave-assisted chemical route. Chem Eng J, 2013; 223: 572-577. DOI: 10.1016/j.cej.2013.03.056
[40] Deshmukh PR, Pusawale SN, Jamadade VS et al. Microwave assisted chemical bath deposited polyaniline films for supercapacitor application. J Alloys Compd, 2011; 509: 5064-5069. DOI: 10.1016/j.jallcom.2010.12.009
[41] Thokale SP, Kore RM, Kambale SV et al. Aqueous route synthesis of PAni electrodes by chemical bath deposition and their cyclic voltammetric analyses at different scan rates. Macromol Symp, 2018; 387: 1800215. DOI: 10.1002/masy.201800215
Copyright ©2022 The Author(s). This open-access article is licensed under a Creative Commons Attribution 4.0 International License (https://creativecommons.org/licenses/by/4.0), which permits unrestricted use, sharing, adaptation, distribution, and reproduction in any medium, provided the original work is properly cited.


