Investigation on a PV-T System Using Direct Heat Exchange between the Coolant and the PV Panel: The Electrical Performance Aspect
Mohammad Yacoub Al Shdaifat1, Abeer Adel Salih1*, Rozli Zulkifli1
1Department of Mechanical and Manufacturing Engineering, Universiti Kebangsaan Malaysia, Bangi 43600, Malaysia
*Correspondence to: Abeer Adel Salih, PhD, Department of Mechanical and Manufacturing Engineering, Universiti Kebangsaan Malaysia, Bangi 43600, Malaysia; Email: abeeralnami@yahoo.com
DOI: https://www.doi.org/10.53964/jmpcm.2022004
Abstract
Objective: The purpose of this paper is to investigate a new method of photovoltaic (PV) panel cooling by direct heat exchange between the panel and the coolant without any mediator. This experimental study evaluates the cooling efficiency of a novel system using a direct water-cooling technique for the backside surface of the PV panel.
Methods: The system was designed through the preparation of a coolant channel by closing the backside of the PV panel. The control system is the fundamental part of the system that allows water to flow through the channel or to be stored in the channel based on the standard conditions established by the researchers. The control system also ensures a good inlet water cooling temperature to achieve promising heat exchange between the PV panel and water.
Results: The results of the present study were compared with those of a non-cooled PV panel from different aspects: the impact degree of environmental factors on each module, the operating temperatures, and the electrical performance. The maximum average temperature of the photovoltaic-thermal (PV-T) module and PV panel was 51.8˚C and 59.4˚C at 12pm, respectively. Power output measurement was conducted for 10 days from 3rd to 13th October 2020. The maximum output power for the PV-T module was 68.9W and 63.9W for non-cooling PV panel respectively for the latitude of Zarqa, Jordan (32.0608°N, 36.0942°E). Meanwhile, the maximum efficiency percentage of the PV-T module and PV panel was 13.5% at 9am and 12.5% at 11am, respectively.
Conclusion: The overall results showed higher electrical performance of the new PV-T module system versus the non-cooling PV panel system.
Keywords: photovoltaic-thermal system, heat exchange, control system, electrical performance
1 INTRODUCTION
Renewable energy sources (water, solar, and wind) are the fastest-growing energy source, producing heat and electricity with a 2.3% year average consumption increase between 2015 and 2040[1]. Solar photovoltaic (PV) is considered the mostly used renewable energy resource and plays a main role in the power generation to lead a low-carbon and sustainable economy[2]. However, the absorbed solar radiation and the ambient temperature increase the temperature of the PV module significantly, causing a reduction in the electrical conversion efficiency[3]. Experiments stated that every 1oC increase in operating temperature leads to 0.5% of reduction in the electrical conversion efficiency[4]. The falling in temperature results in higher voltage generated by the PV module, and vice versa[5].
Researchers have been developing different cooling systems to achieve a significant reduction in the temperature of the PV panels to gain better conversion efficiency. There are four types of available working media currently being used in photovoltaic-thermal (PV-T) module: refrigerant[6], air[7], water[8], and nanofluids[9,10]. The collectors have a typical heat pipe[11], flat-box type[12,13] or sheet-tube configuration (serpentine tube, parallel-tubed flat plate, etc.)[14]. The PV-T module can achieve more than 50% efficiency by generating electricity and profitable thermal energy, depending on the conditions of the environment[15]. Each PV-T module type has different features; the air type features lower costs and maintenance, while the liquid one is the most efficient type. Flat plate PV-T collectors are the most common type in the case of using liquid. Helden et al.[16] performed a study on a flat PV-T collector and found a slightly higher electrical efficiency than PV panel due to its lower temperature (18oC was constant temperature for the inlet), which shows better electrical gain benefits of cooling the PV panel by water than the optical loss because of the reflection at the glass cover in a flat PV-T collector. Rosa-Clot et al.[17] compared the flat PV-T collectors using either liquid or air and reported 2%-3% higher electrical yield by the liquid PV-T collector with a lower average working temperature of about 20-30oC versus the air PV-T collector. He et al.[18] observed 40% daily thermal efficiency of the PV-T having aluminium-alloy channel with water as heat transfer fluid. Xu et al.[19] developed a novel low-concentrating solar PV-T assisted by heat pump system for water heating and reported that the average system coefficient of performance for heating water from 30°C to 70°C on a clear sunny day in summer was 4.8, with an reported electrical efficiency of 17.5%, which is 1.36 times higher than that of the same PV system without any cooling mechanism. A liquid based flat plate solar collector, constructed with mono-crystalline silicon PV cells on selective aluminium thermal absorber plate produced higher output density than individual PV module and solar thermal collector[20].
Great efforts have been made by many researchers to track the maximum power generation of photovoltaic and thermal panels by developing various algorithms and electronics. Nevertheless, scarce studies performed developments in control systems to track the maximum power generation from PV-T modules. Ammar et al.[21] used an algorithm applying the Artificial Neural Network method on PV-T system to gain the optimum operating point through computing the optimum flow rate for a given ambient temperature and solar radiation. The results showed that the approach delivered accurate and fast control on the PV-T flow rate. Siecker et al.[22] developed a mathematical model that dealt with the optimal switching of flow for different designs of PV-T systems and different operating conditions (surface temperature, solar radiation, and ambient temperature). The study concluded that the model could increase the generated electrical power from the PV-T module and utilize the absorbed heat by the fluid for varied hot fluid applications.
This paper presents a simple novel design for the PV-T system by covering the backside of the PV panel and transforming it into a water tank, which leads to direct heat exchange between the backside of the PV cells and water. This system is also connected to an appropriate control system that works to provide optimum working conditions for the PV-T module to increase power production. The study provides a full experimental analysis for the suggested system.
2 Materials and Methods
2.1 Test Section
The direct heat exchange between the coolant (water) and the surface of the PV panel is the main feature of the present PVT cooling performance, and this improvement reflects on the amount of thermal energy absorbed by the water from the surface of the PV, which leads to rapid and efficient cooling and an increase in the power generation from the PV panel. The components of the system include two categories (mechanical and electrical parts): two monocrystalline solar panels, a source water tank, an isolated hot water tank, water pipes, a solenoid valve, temperature sensors (submerged and K-type thermocouples (MI) with an absolute uncertainty of ±0.5°C), a level sensor (wire and potentiometer), a water pump, a microcontroller board (Arduino/Uno), and a PC.
The study contained two PV panels for comparison; one is set to the thermal management system and the other is a free one, Figure 1 shows a preview of the experiment. The microcontroller board, as shown in Figure 2, is responsible for receiving and analysing the signals from different sensors, and then giving the correct response as per the programmed criteria of the system. Solenoid valves run/stop the water flow from the source water tank to the PV-T system or from PV-T system to the isolated hot water tank. The temperature sensor measures the water temperature inside the PVT system. Two types of level sensors are used in the system; the wire type is used inside the bottom tank of the PV-T module, and the potentiometer is used in the isolated hot water tank. The thermal resistors are used for the electrical circuit of the system, and the PC is responsible for monitoring. The water pump is for emergency case only, once the water reaches a certain level. Table 1 shows the used components and their main information.
|
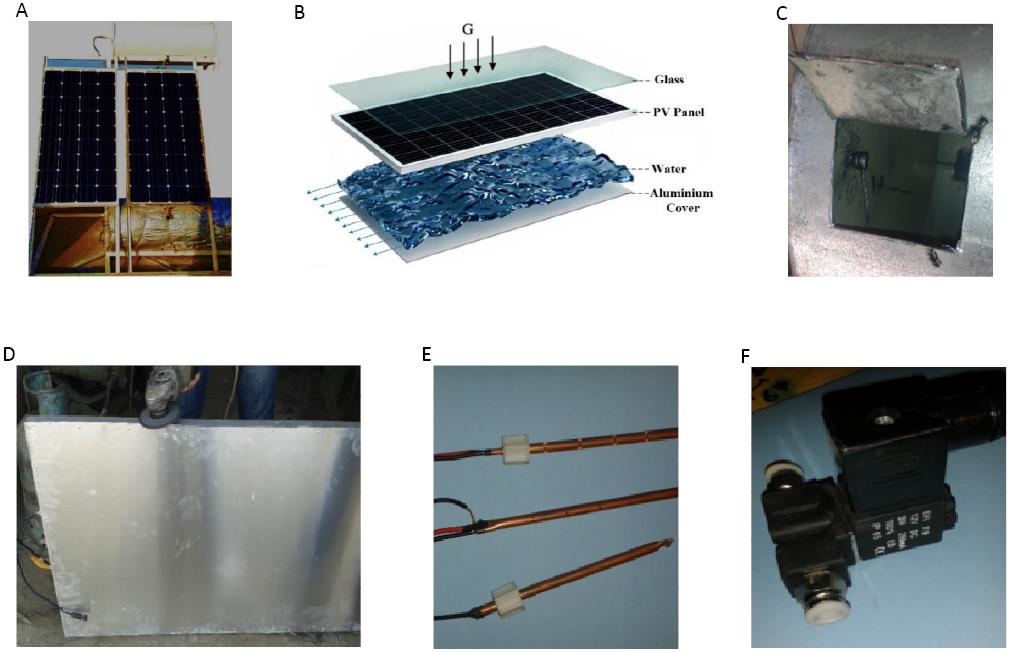
Figure 1. The PV-T system. A: The PV cells are set on the base (on the right is the PV-T module, on the left is the non-cooled PV panel); B: Schematic cross-section view of the PV-T system,; C: The level sensor in the isolated hot water tank; D: The aluminium cover; E: The submerged temperature sensors; F: Solenoid valve.
|
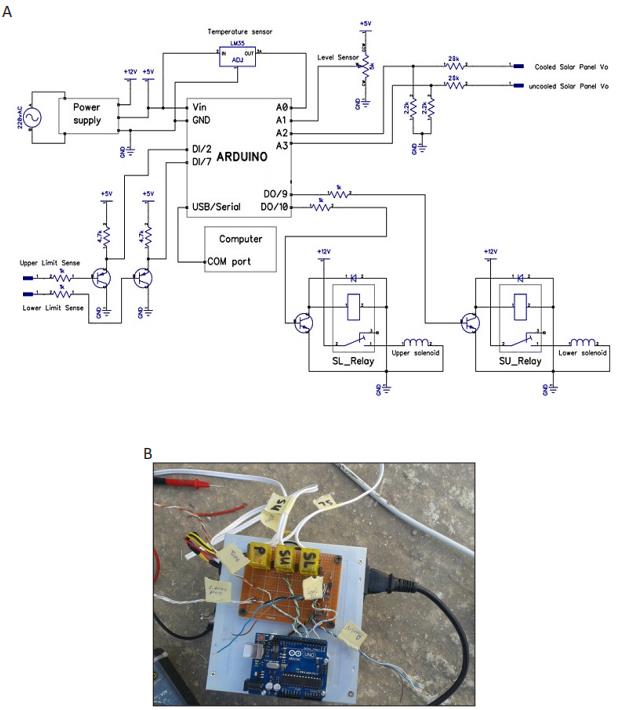
Figure 2. The control system. A: The top view of the Arduino with processing parts; B: The control schematic diagram.
Table 1. Used Components and Technical Information
Components |
Purpose |
Company |
Operating Condition |
Monocrystalline PV panels |
For the experimental study |
Philadelphia |
1) Rated power 510W 3) NOCT is 45±2oC |
Analog potentiometer |
To reduce the water in the hot water tank in case of excess |
Arduino |
Closed system when the potentiometer is at range degrees of (0oC-45oC) |
Aluminum cover |
To make the direct cooling storage tank |
ــ |
ــ |
Analog LM35 temperature sensor |
To measure the temperature of the PV panel temperature and the temperature of the water |
Arduino |
Work at a temperature range of -55oC-150oC |
Solenoid valve |
To pass/stop the water from flowing into the pipes |
Arduino |
1) the upper solenoid valve, where it closes when the PV-T direct cooling storage tank is full 2) The lower solenoid valve opens when the water temperature in the storage is ≥40oC |
ATmega2560 |
To control the system and generate the data |
Arduino |
9V battery |
The different sensors and devices of the present PV-T system are processed and analysed by a code written by C++ with an addition of special methods and functions. A data logger was added to the Arduino controller to record all the actual physical readings (surface temperature of PV panels, water temperature, and voltage). A continuous check for the voltage and surface temperature measurements was done by using Fluke 179 True RMS Multimeter and temperature gun to ensure correct sensor readings. The digital Pyranometer and Anemometer were used to measure the solar intensity and the wind speed, respectively.
2.2 Methodology
The validation of the cooling system and the used control system is evaluated by two factors: the smoothness of processing (reading, analysing and responding) and obtaining the desired cooling which sufficiently increase the electrical performance of the PV panel. These two factors depend on the correct positioning of the different sensors and devices, their connections to the microcontroller, and the used wires and the system coding in the Arduino. Figure 3 shows the process flowchart of the present PV-T system.
|
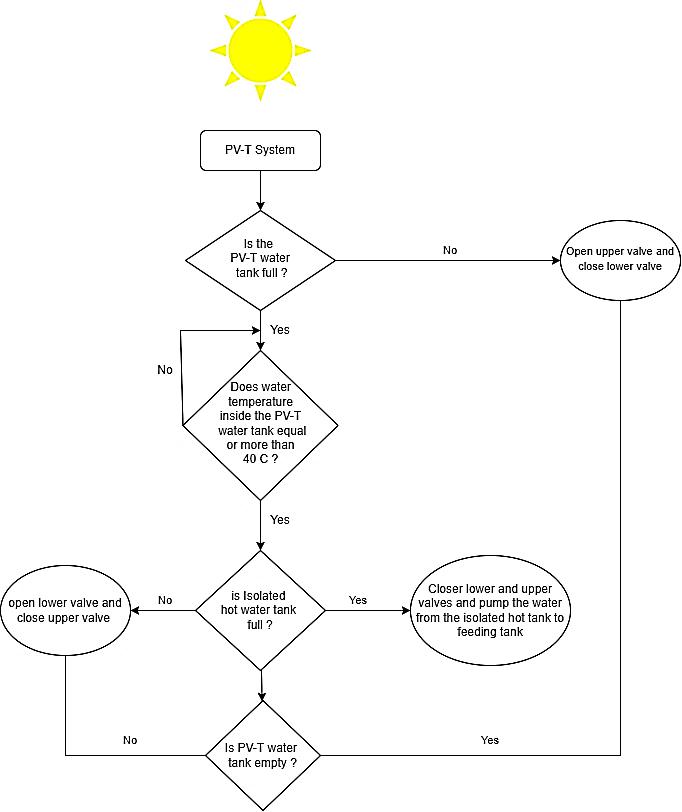
Figure 3. Flowchart of the PV-T system process.
The system has been set to operate from 9am to 3pm since it is considered as the efficient irradiation period to run the system. When the PV-T tank is empty, the level sensor sends a signal to the microcontroller which orders to close the lower solenoid valve and open the upper one, after which the water flow from the source water tank (where the average measured temperature of the water is 25oC inside) to the PV-T bottom tank. Once the water in the PV-T bottom tank is full, the wire level sensor sends signal to the microcontroller to close both solenoid, so the water remains still until its temperature reaches 40oC (this temperature is fixed as higher temperatures decrease the heat exchange efficiency between the water and the PV panel[23,24]. The microcontroller opens the lower valve to discharge the isolated hot water tank and then closes the lower valve. The same processes was repeated cyclically. In the case of full isolated hot water tank, the potentiometer sends signal to the microcontroller to close both solenoid valves and pump the water from the isolated hot water tank to the source tank. Intensive tests were made on the system and all parts to ensure that accurate measurements reflect the real performance of the present PV-T system.
The output open-circuit voltage (Voc) and short-circuit current (Isc) of the solar PV panel are recorded hourly by a programmed data logger in the microcontroller. Then, the maximum power output for the solar PV panel was calculated using the following Equation 1:
|
The efficiency ratio and percentage of the solar PV panel were then calculated by the following Equation 2:
|
Where A is the surface area of the solar panel. The temperature of the solar cell (Tcell) is calculated by the next Equation 3:
|
Where Ta is the ambient temperature and NOCT is the nominal operating cell temperature, and its value is approximately 43oC based on the data sheet of the used PV panel.
3 RESULTS AND DISCUSSION
3.1 Ambient Conditions
The performance of a PV panel is affected by interactive factors such as the weather conditions. The nature of this report is experimental while all relevant parameters under investigation are measured by different sensors and devices. Nonetheless, the temperature of the PV panel, for instance, is a function of global irradiance (affected by haze and the condition of the sky whether it is sunny or cloudy), wind speed and ambient temperature. All the parameters were measured in October in Zarqa, Jordan, because Jordan has a slow gradual change in climate in October.
3.1.1 Solar Irradiation and Ambient Temperature
The radiant flux received by some surface per unit area is the irradiance, which plays an important role in the amount of power output and the temperature of the PV panel. Figure 4 shows the measured irradiance. The irradiance value increases linearly as the sun approaches perpendicular to the PV surface until it reaches a maximum value of 632.5W/m2 at 12pm and then decreases until reached the value of 481.9W/m2 at 15pm due to the orientation angle (θ) of the PV panel. Furthermore, the overall irradiance is 538.6, which indicates that the place of study has good solar intensity. Based on the study done by Buday[25], the estimated percentage of the effect of irradiance on the operating temperature of the module is 60%-70%.
The second place in the effectiveness of the PV panel is the variation of the ambient temperature since it affects the thermal and electrical efficiencies. The average ambient temperature is 27.8oC. Figure 4 shows the measured ambient temperature. The figure shows that the highest ambient temperature of 31oC is recorded at 12pm, whereas the minimum of 24oC occurrs at 9am. The time of a day or season of the year determines the impact of the ambient temperature.
|
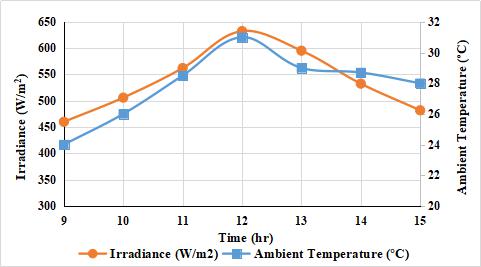
Figure 4. Hourly in-plane solar irradiation and ambient temperature.
3.1.2 Wind Speed
The effect of the wind on the temperature of the PV panel basically depends on its speed, where only high wind speed has a considerable impact on the temperature reduction of the PV panel. Figure 5 shows the wind speed during the study period. Based on the measured data, the average wind speed was 2.36m/s, which prospectively indicates that the impact of wind speed on PV panel performance could be negligible. However, the observed maximum and minimum wind speeds were 3.49m/s and 1.44m/s at 15pm and 9am, respectively.
|
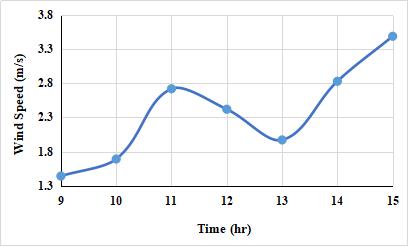
Figure 5. Hourly wind speeds.
3.2 Module Temperature
The performance of the PV panel decreases by increasing its temperature, where the increased carrier concentrations increase the internal carrier recombination rates. The electrical performance and the power output of the PV panel go linearly with the operating temperature of the panel, whereas it plays a key role in the PV conversion process. The variations in the modules temperatures of PV and PVT are shown in Figure 6. The recorded module temperatures of the PV-T were relatively lower than PV module temperatures, ranging from 9.8% before 12am to 11.3%. Thermal peak point occurs at 12pm for both PV-T and PV modules. No peak time lag due to no prolonged heat retention times results in no marginal reduction in electrical efficiency. These results could translate into a relatively higher net energy yield per rated wattage for the PV-T module because of the lower cell temperature and higher heat recoveries. The operating temperatures of PV-T and PV modules with the source effects (irradiance and ambient temperature) clearly sign to bigger effect by irradiance than ambient temperature precisely after 12pm.
|
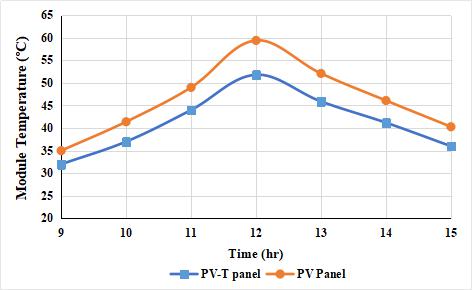
Figure 6: Hourly module temperature measured.
3.3 Electrical Performance
The increase in the temperature of the PV panel reflected negatively on the electrical power productivity. Next sub-sections show the collected data of the study and give detailed analysis of the voltage, current, power output and the improvement efficiency of each panel.
3.3.1 Voltage
The electrical voltage of a PV panel decreases linearly with the increase of PV cell temperature. On a microscopic scale, the high temperature of solar cells affects the motion of electrons and provokes an electron-hole recombination, leading to a drop in electrical conversion efficiency. From Figure 7, a difference is found between the voltage of the PV-T module and the PV panel, where the PV-T module achieves an average increase in the voltage equals to 4.95% and 2.88% before and after 12pm, respectively. The maximum voltage is 20.1V gained by the PV-T module compared with maximum voltage 19.15V gained by the PV panel at 12pm, which results in good effectiveness of the new cooling method even during the hard atmospheric conditions.
|
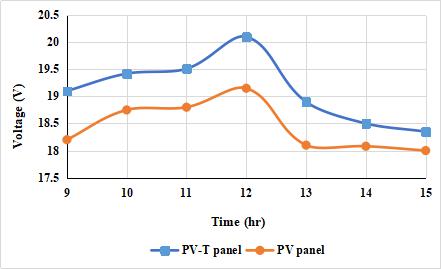
Figure 7. Hourly voltage measured.
3.3.2 Current
The increase in the module temperature simultaneously increases the short-circuit current. In Figure 8, there is a clear current gap in the modules from 9am to almost 10:15am. This is attributed to the drop in quantities before 10:15am for the curve of the PV module in Figure 8 and that the system orientation deviates by 10o from the correct southern direction, while they seem to be more stable and closer to each other at the remaining hours. The minimum current value for the PV-T panel is found at 15:00pm because this time has the worst angle between the panel face and the sun, as seen previously in Figure 7. The mentioned gap indicates that the PV panel has less current stability compared to the PV-T module which is seemingly less discrepant in the current values, where the current improvement of the PV-T module reaches 18.49% and -0.32% before and after 12pm, respectively. The overall improvement efficiency in the current is 7.3%.
|
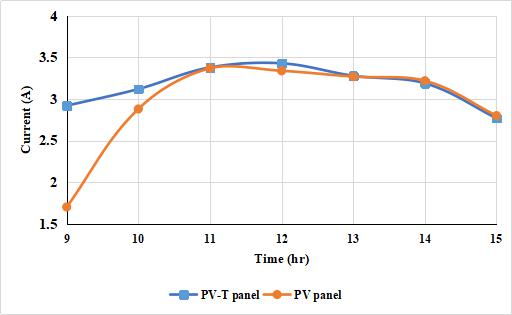
Figure 8. Hourly current measured.
3.3.3 Power
The target of the present study is to increase and achieve stability in the power output of the PV panel. The data analysis of the power output of each panel in Figure 9 shows a similar performance to the current, where the period from 9am to 10:15am still has a clear gap between the power output of the PV-T module and the PV pane. There is more stability and closer values during the remaining hours. This gives an extra advantage for the present PV-T module being a stable system with slight fluctuation during the different ambient temperatures and solar intensities. Data of Experiments concluded that the best electrical performance of the PV-T module at operating temperatures remains within 40oC, while it still achieves considerable performance at higher operating temperatures, where the overall power output improvement efficiency of the PV-T module compared to the PV panel is 15.9% with maximum power reaching 68.9W at 12pm. The instability of the PV panel in the beginning gives preferences for the PV-T module over the PV panel, which contributes to the overall electrical performance of the PV-T module with 12.5% efficiency, while PV panel has an overall efficiency of 11.1%.
|
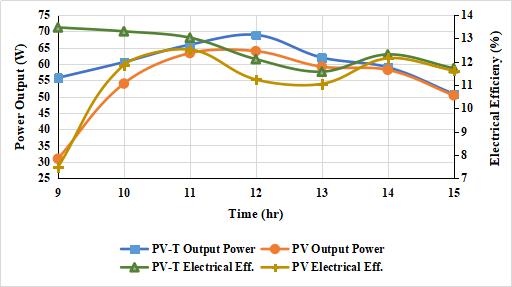
Figure 9. Hourly power measured with the electrical efficiency.
To evaluate the performance of the present PV-T system, a comparison is conducted between the electrical efficiency of the present system and two systems made by Ying et al[26]. These two systems are suitable for comparison because they both use the direct cooling between water and the panel, and Monocrystalline PV panels were used. These two systems are different by their internal design, where one is a Harp-channel PV-T collector and the other is a Grid-channel PV-T collector. As shown in Figure 10, there is clear difference between the electrical efficiency of the present system and Ying’s systems. The overall average difference in the electrical efficiency between present system and Harp-channel system is 2% and 1.3% between the present system and the Grid-channel system. The max drop in the hourly electrical efficiencies is 2.4% for the Grid-channel system, followed by the present system with 2.2% and finally the Harp-channel with 1.6%.
|
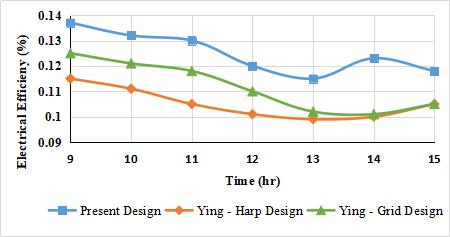
Figure 10. Comparison between the electrical efficiency of the present system and Ying et al.[26] systems.
4 CONCLUSION
This experiment achieved the following results:
1) The overall module temperature of the PV-T module was lower than PV module temperatures by 10.55%.
2) The overall voltage difference between PV-T and PV modules is 3.7%.
3) The overall improved efficiency in the current of the PV-T module is 7.3%.
4) The overall power output efficiency of the PV-T module compared to the PV panel is 15.9% with maximum power reaching 68.9W at 12pm.
5) The overall electrical efficiency is 12.5% and 11.1% for the PV-T and PV modules, respectively.
Acknowledgments
We would like to acknowledge the help with insightful edits and lab facilities from Hashemite University.
Conflicts of Interest
The authors declare no conflict of interest.
Author Contribution
Shdaifat MYA wrote the original draft of this manuscript and visualized the results; Salih AA wrote part of the manuscript; Zulkifli R acquired funding for this project and reviewed the manuscript. All authors have read and agreed to the published version of the manuscript.
Abbreviation List
A, Surface area of the solar panel
Isc, Short-circuit current
NOCT, Nominal operating cell temperature
Pmax, Maximum power output for the solar PV panel
PV, Photovoltaic
PV-T, Photovoltaic thermal
Ta, Ambient temperature
Tcell, Temperature of the solar cell
Voc, Output open-circuit voltage
η, Electrical efficiency
θ, Orientation angle
References
[1] U.S. Energy Information Administration. International Energy Outlook 2017. Available at http://csis-website-prod.s3.amazonaws.com/s3fs-public/event/170914_CSIS_release.pdf. Accessed September 14, 2017.
[2] Chen JF, Zhang L, Dai YJ. Performance analysis and multi-objective optimization of a hybrid photovoltaic/thermal collector for domestic hot water application. Energy, 2018; 143: 500-516. DOI: 10.1016/j.energy.2017.10.143.
[3] Sukarno K, Hamid ASA, Razali H et al. Evaluation on cooling effect on solar PV power output using laminar H2O surface method. Int J Renew Energy Res, 2017; 7: 1213-18.
[4] Skoplaki E, Palyvos JA. On the temperature dependence of photovoltaic module electrical performance: A review of efficiency/power correlations. Sol Energy, 2009; 83: 614-624. DOI: 10.1016/j.solener.2008.10.008.
[5] Rustemli S, Dincer F. Modeling of photovoltaic panel and examining effects of temperature in Matlab/Simulink. Elektron Elektrotech, 2011; 109: 35-40. DOI: 10.5755/j01.eee.109.3.166.
[6] Chow TT, Pei G, Fong KF et al. Modeling and application of direct-expansion solar-assisted heat pump for water heating in subtropical Hong Kong. Appl Energ, 2010; 87: 643-649. DOI: 10.1016/j.apenergy.2009.05.036.
[7] Kumar R, Rosen MA. A critical review of photovoltaic-thermal solar collectors for air heating. Appl Energ, 2011; 88: 3603-3614. DOI: 10.1016/j.apenergy.2011.04.044.
[8] Chow TT, Pei G, Fong KF et al. Energy and exergy analysis of photovoltaic-thermal collector with and without glass cover. Appl Energ, 2009; 86: 310-316. DOI: 10.1016/j.apenergy.2008.04.016.
[9] Al-Waeli AHA, Sopian K, Chaichan MT et al. An experimental investigation of SiC nanofluid as a base-fluid for a photovoltaic thermal PV/T system. Energ Convers Manage, 2017; 142: 547-558. DOI: 10.1016/j.enconman.2017.03.076.
[10] Al Shdaifat MY, Zulkifli R, Sopian K et al. Thermal and hydraulic performance of CuO/water nanofluids: A review. Micromachines (Basel), 2020; 11: 416. DOI: 10.3390/mi11040416.
[11] Wu SY, Zhang QL, Xiao L et al. A heat pipe photovoltaic/thermal (PV/T) hybrid system and its performance evaluation. Energ Buildings, 2011; 43: 3558-3567. DOI: 10.1016/j.enbuild.2011.09.017.
[12] Zondag HA, De Vries DW, Van Helden et al. The yield of different combined PV-thermal collector designs. Sol Energy, 2003; 74: 253-269. DOI: 10.1016/S0038-092X(03)00121-X.
[13] Chow TT, Chan ALS, Fong KF et al. Annual performance of building-integrated photovoltaic/water-heating system for warm climate application. Appl Energ, 2009; 86: 689-696. DOI: 10.1016/j.apenergy.2008.09.014.
[14] Touafek K, Khelifa A, Adouane M. Theoretical and experimental study of sheet and tubes hybrid PVT collector. Energ Convers Manag, 2014; 80: 71-77. DOI: doi.org/10.1016/j.enconman.2014.01.021.
[15] Guarracino I, Mellor A, Ekins-Daukes NJ et al. Dynamic coupled thermal-and-electrical modelling of sheet-and-tube hybrid photovoltaic/thermal (PVT) collectors. Appl Therm Eng, 2016; 101: 778-795. DOI: 10.1016/j.applthermaleng.2016.02.056.
[16] Van Helden WGJ, Van Zolingen RJC, Zondag HA et al. Thermal and electrical yield of a combi-panel. Sol Energy, 2002; 72: 113-128. DOI: 10.1016/S0038-092X(01)00094-9.
[17] Rosa-Clot M, Rosa-Clot P, Tina GM. TESPI: thermal electric solar panel integration. Sol Energy, 2011; 85: 2433-2442. DOI: 10.1016/j.solener.2011.07.003.
[18] He W, Chow TT, Ji J et al. Hybrid photovoltaic and thermal solar-collector designed for natural circulation of water. Appl Energ, 2006; 83: 199-210. DOI: 10.1016/j.apenergy.2005.02.007.
[19] Qu M, Chen J, Nie L et al. Experimental study on the operating characteristics of a novel photovoltaic/thermal integrated dual-source heat pump water heating system. Appl Therm Eng, 2016; 94: 819-826. DOI: 10.1016/j.applthermaleng.2015.10.126.
[20] Fujisawa T, Tani T. Annual exergy evaluation on photovoltaic-thermal hybrid collector. Sol Energ Mat Sol C, 1997; 47: 135-148. DOI: 10.1016/S0927-0248(97)00034-2.
[21] Ammar MB, Chaabene M, Chtourou Z. Artificial Neural Network based control for PV/T panel to track optimum thermal and electrical power. Energ Convers Manage, 2013; 65: 372-380. DOI: 10.1016/j.enconman.2012.08.003.
[22] Siecker J, Kusakana K, Numbi BP. Optimal switching control of flow in PV/T systems with forced circulation: Model development. Adv Sci Lett, 2018; 24: 8081-8084. DOI: 10.1166/asl.2018.12496.
[23] Jia Y, Alva G, Fang G. Development and applications of photovoltaic-thermal systems: A review. Renew Sust Energ Rev, 2019; 102: 249-265. DOI: 10.1016/j.rser.2018.12.030.
[24] Preet S, Bhushan B, Mahajan T. Experimental investigation of water based photovoltaic/thermal (PV/T) system with and without phase change material (PCM). Sol Energy, 2017; 155: 1104-1120. DOI: 10.1016/j.solener.2017.07.040.
[25] Buday M. Measuring irradiance, temperature, and angle incidence effects on photovoltaic modules in Auburn Hills, Michigan [master’s thesis]. Ann Arbor, State of Michigan, University of Michigan; 2011.
[26] Yu Y, Yang H, Peng J et al. Performance comparisons of two flat-plate photovoltaic thermal collectors with different channel configurations. Energy, 2019; 175: 300-308. DOI: 10.1016/j.energy.2019.03.054.
Copyright ©2022 The Author(s). This open-access article is licensed under a Creative Commons Attribution 4.0 International License (https://creativecommons.org/licenses/by/4.0), which permits unrestricted use, sharing, adaptation, distribution, and reproduction in any medium, provided the original work is properly cited.


