Best Rating Scale Design Theory: Implications for Developing Questionnaires in Nursing and Health Sciences
Odunayo Kolawole Omolade1#*, John Stephenson2#
1School of Health, Science and Wellbeing, Centre for Health Innovation, Staffordshire University, Staffordshire, UK
2Department of Allied Health Professions, Sport and Exercise, School of Human and Health Sciences, University of Huddersfield, Huddersfield, UK
#Both authors contributed equally to this manuscript.
*Correspondence to: Odunayo Kolawole Omolade, MSc, Lecturer, School of Health, Science and Wellbeing, Centre for Health Innovation, Staffordshire University, College Road, Staffordshire ST4 2DE, UK; Email: odunayokolawole.omolade@staffs.ac.uk
Abstract
Several nurse researchers do not consistently engage the best rating scale design in developing health research questionnaires thus obscuring the obligatory psychometric properties of the tools as objective rating scales. In response, this paper intends to simplify the Rasch techniques of best rating scale (or questionnaire) validation into four stages. Among researchers and psychometricians, presenting the objective psychometric properties of questionnaires used as rating scales are the cornerstones of the mathematical credibility of any reading generated by the scale. On the contrary, being too reliant on the conventional methods called the classical test theory (CTT), most already “developed” questionnaires rarely display objective indices of the measuring tools. CTT is not the best method for designing questionnaires because its techniques rely on too many unproven mathematical assumptions. Correspondingly in this paper, the Rasch techniques of rating scale design are simplified into four steps for designing questionnaires as objective rating scales. A key contribution of Rasch validation technique is that essential psychometric properties are tested and displayed rather than merely assumed. Therefore, nurse researchers ought to show methodological and mathematical rigours aimed at designing questionnaires as objective measuring tools of health variables. Embracing the four phases of questionnaire design in Rasch techniques provides an easy-to-follow and scientifically robust framework for developing a questionnaire. Finally, the CTT approach to developing questionnaires lack evidence expected of an objective rating scale. Therefore, the four steps in Rasch techniques of questionnaire design, outlined here, present the techniques that researchers may engage in to minimise measurement errors.
Keywords: rating scale, questionnaire, validation, Rasch techniques, objective measurement
1 INTRODUCTION
1.1 Contextualising Rating Scale in Nursing Practice
This critical review focuses on theories underpinning questionnaire design (frequently used as rating scale) in nursing and allied health disciplines by arguing for objective measurement (Rasch) approach as the best technique to designing and presenting the psychometric properties of the questionnaires. To begin, the attention of questionnaire developers is drawn to objective measurement in clinical settings thus providing a background for reimagining theories applied in designing questionnaires.
In all quantitative research, “numbers don’t lie” is projected as a metaphorical testament arbitrarily alluding to the accuracy of all the outcome measures. However, nuances of measurement errors are ubiquitous and rating scales lacking essential indicators of objective validation may be grossly inaccurate with variable measurement. Objective measurement proponents reiterated that avoidable measurement errors will occur provided the functions of a rating scale are merely assumed but not objectively evaluated even though sophisticated analyses and formulas are engaged for outcome calculations[1]. From the nursing profession’s point of view, the objective function of a rating scale has clinical significance in informing treatment decisions leading to improved quality of patient care. Correspondingly, to limit avoidable measurement errors during a routine patient assessment, nurses often monitor most clinical measuring tools and evaluate the results produced against recognised standard parameters. The speciality of Intensive and Critical Care Nursing is such a good example to illustrate the excellent level of attention focused on objective measurement during nursing care. In intensive nursing care settings, nurses routinely operate scheduled and emergency investigations of critical blood electrolytes (potassium, sodium, calcium), acid-base balance and glucose using the blood gas machine. The responsible nurses do not simply accept the blood gas results at “face value” until satisfactorily examined against fundamental quality assurance checks. In other words, the observed results (from the blood gas machine) must be assessed against expected laboratory values to prove the credibility of the readings. Correspondingly, a range of ensuing decisions may include accepting or rejecting the results or escalation to the medical laboratory scientist or consultant chemical pathologist in line with the unit protocol. Acceptable results will be used in treatment decisions without further investigation. But if a result is questionable, blood sampling and testing from the same patient will be repeated using a different blood gas machine. If procedural errors are successfully ruled out after repeating the investigation, the blood gas machine suspected of wrong calculations is immediately taken out of service and formally reported to the medical physicists for repair. False-negative and false-positive are frequently used terminologies describing erroneous underestimation and overestimation in clinical measurement. A major clinical incidence with severe consequences is administering a treatment that the patient does not need or omitting essential life-saving medical intervention based on false readings. Moreover, to ensure the optimal functioning of most clinical measuring tools, nurses are trained to recalibrate blood gas machines, digital sphygmomanometers and glucometers on scheduled bases or as required. Even though sophisticated engineering methods were used in designing the clinical measuring tools, clinicians commit to recalibrations as obligatory quality control checks to ensure treatment decisions are informed by the best possible quality of clinical measurement.
As the usefulness of all outcome measures is dependent on accurately measuring the variable, both clinicians conducting patients’ assessment and researchers designing questionnaires must display an exemplary commitment to objective measurement. In line, psychometricians reaffirmed that the idea of using questionnaires to assess latent health variables is imported from measurement methods inherent in designing measuring tools such as blood gas machines or clinical thermometers[2]. Health and social scientists develop questionnaires to generate measures that may influence health research, conceptualise theories and shape policies upon realising that many ground-breaking inventions and medical treatments are linked with objective measurement of human physical and biochemical components[3]. In today’s health research, the desire to measure health variables using questionnaires is internationally recognised across medical specialisations, psychology, education, management and social sciences. Sadly, coexisting with the increasing use of questionnaires as rating scales in nursing is the lack of a nationally or internationally agreed set of minimum acceptable objective psychometric properties before commissioning a questionnaire as a rating scale. Also, several systematic reviews on the psychometric properties of questionnaires in human sciences tend to focus solely on the classical test methods and offer less or nothing about objective validation techniques[1,4]. Increasing systematic reviews investigating the psychometric properties of questionnaires imply that researchers intend to ascertain the merits of mathematical and theoretical principles for developing the questionnaires. Yet due to a lack of awareness of (Rasch) objective measurement techniques[5], questionnaire designers have not been challenged enough to converge on rethinking questionnaire validation techniques. It is incontrovertible, questionnaire design as an objective rating scale is unavoidably more complex than it is widely purported which necessitates including objective measurement in designing questionnaires[6,7].
1.2 Clarifying the Problems in Rating Scale Design
This section presents some criticisms of the conventional approach [often called classical test theory (CTT)] approach and concludes with ten frequently cited mathematical and theoretical limitations researchers face during questionnaire design. The intention here is that questionnaire designers may rethink and invest in Rasch objective measurement theory after becoming aware of the shortcomings of the conventional method.
Improving variable measurement techniques using questionnaires is eventually gaining increasing attention in nursing and allied discipline. The most recent example of extending objective measurement techniques to nursing by Omolade et al.[7] outlined key criticisms of CTT including the failures to assess (or report) the category functioning and dimensionality of rating scales used by nurses. Category functioning refers to consistency in the ordinal category options while the dimensionality test evaluates all the questionnaire items for one dimensional plane loading[8]. Despite the criticisms, CTT frameworks for designing questionnaires remain widely reported such as the steps proposed by Tsang et al.[9] and Bolarinwa[10] which suggested content validity through relevant literature evidence, Cronbach’s alpha estimation and concurrent validity assessment. In the same vein, of all the psychometric properties often presented under CTT, Cronbach’s alpha is arguably the most widely reported[11]. The CTT technique presents Cronbach’s alpha as a key psychometric property but the alpha value has limited usefulness in aiding the improvement of a questionnaire in minimising measurement error. Correspondingly, Sijtsma[11] concluded that the Cronbach’s alpha assessment is frequently misinterpreted and misapplied as a proof of dimensionality whereas the assessment does not theoretically and statistically address questionnaire dimensionality. Furthermore, the alpha value alone is an insufficient parameter of internal consistency of a rating scale[3] yet many researchers would not present any other psychometric assessment before administering a questionnaire. An important shortcoming of the Cronbach’s alpha value is that the score may increase or decrease with the addition or subtraction of items from a scale indicating inconsistencies in decision-making in revising a questionnaire[1]. In response, Boone et al.[8] emphasised that the use of psychometric assessment, as a quality improvement step, is to offer practical and specific solutions that may improve the objective characteristics of the questionnaire. This expectation however is fulfilled by engaging Rasch techniques of assessing the objective functions of a questionnaire. Correspondingly, detailed explanations and worked examples of objective assessment recur in many recently published articles and textbooks proposing adopting the Rasch techniques of rating scale design in health and human sciences[7,12,13]. Bond and Fox[1] provided extensive coverage of applications of Rasch theory in health disciplines, while Boone et al.[8] worked out some examples of health questionnaires to exemplify the benefits primarily derived from applying Rasch techniques. There are also published articles, including Boone and Noltemeyer[4], Hagquist et al.[14] and Van Zile-Tamsen[15] focused on simplifying the Rasch theory and its application in rating scale design. To exemplify researchers’ desire for objective techniques of questionnaire design in nursing, Blackman and Giles[5] and Sakib et al.[13] applied Rasch techniques in validating self-reported evidence-based practice and Bangla fear of COVID-19 scales respectively.
Nevertheless, Bond and Fox[1] noted the paucity of objective assessment in health studies and attributed the problem to the knowledge gap between psychometricians and questionnaire developers; in that, questionnaire developers are not psychometricians themselves thus, lack the required competence and advances applied in objective measurement theories. The knowledge deficit, on the part of questionnaire developers, presents as persisting “quick-fix” approach to questionnaire design, which fails to adhere to fundamental mathematics informing the process. In response, ten of the problems encountered and glossed over in CTT of questionnaire design are outlined below:
(1) The fact that questionnaire data are neither interval (similar to thermometer reading) nor ratio scale (like a tape measure) yet, some researchers calculate mean measure and conduct parametric statistics. To estimate the average of any measure, there must be a proven linear relationship between the indicators[1,8].
(2) Without proven mathematical equations explaining a function, it is unacceptable to juxtapose the theoretical relevance of items from literature as sufficient proof of loading into a single variable to assume the unidimensionality of items on a questionnaire.
(3) Until linked together using applicable probability theory, different items on a scale lack additivity and cannot be simply added together to make a measure of a variable.
(4) In a Likert-type questionnaire, a good category function (meaning preservation of lesser and higher order arrangement) proposed by the developer cannot be simply assumed. CTT cannot identify redundant items in a scale. Item redundancy occurs at any point on a linear scale where two or more items are even on the level of difficulties to respondents.
(5) CTT cannot show that the average level of difficulty of a scale is not at variance with the average level of ability of respondents.
(6) CTT cannot prove that the average measure of a scale is independent of the population assessed, referring to the scale consistency across various target respondents.
(7) In the classical technique, it is impossible to detect items that may be biased towards unique groups or demographic characteristics such as age range, gender, workplace or language.
(8) CTT cannot prove the local independence of each item, which is a requirement proving the capacity of an item to stimulate a uniquely framed response from each respondent without interference from adjacent items.
(9) CTT relies on raw scores from respondents for calculations without critically screening the data for dysfunctional items that fail to meet the objective measurement criteria.
2 FOUR PHASES OF RATING SCALE DESIGN UNDER RASCH THEORY
In response to the problems listed above, the four phases of objective measurement proposed here will ensure objective psychometric features are integrated into the processes of questionnaire design. When applied, the techniques ensure questionnaire development framework fulfils the obligation of preserving a strong connection between literature evidence and mathematical concepts upon which rating scales are built. Adopting this method helps improve variable measure accuracy by reducing measurement errors resulting from untested assumptions or biases from the indicators[2,4]. Reducing measurement error originating from the deficient properties of the rating scale implies an objective assessment of all the components of the scale including the root (item), stem (category options) and inter-item relationship. Correspondingly, the four stages of designing a questionnaire (see Figure 1) under Rasch techniques present the best approach to developing an objective rating scale because the methods explicitly display various assumptions of objective measurement.
|
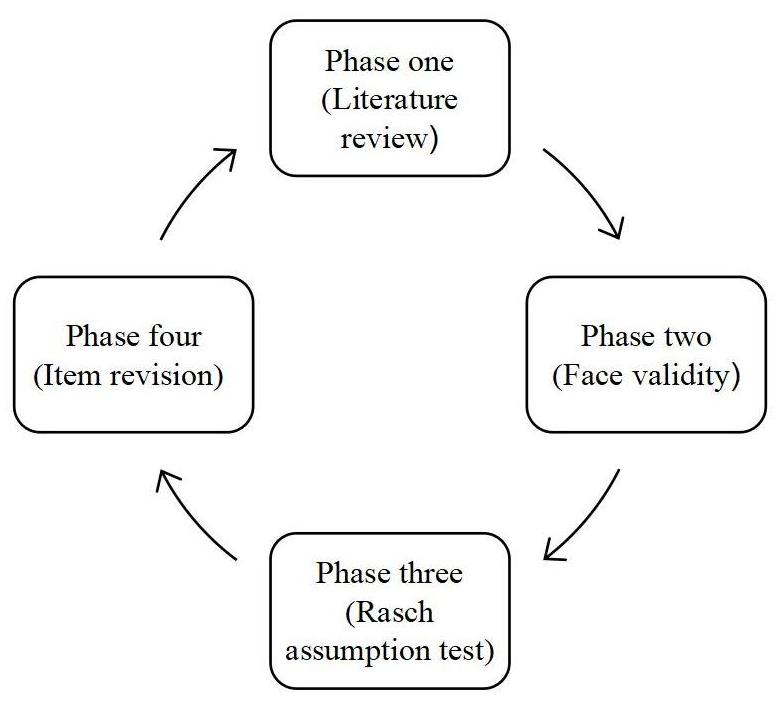
Figure 1. Four phases of best rating scale design.
2.1 Phase One (Theoretical Review)
In CTT and Rasch techniques, reviews of current theories and concepts are conducted to identify and select items, called indicators, fitting into the description of the variable under examination[8,10]. Determining the variable to measure precedes a literature search and a clear conceptualisation of the characteristics that describe the variable may be needed catalyst for an effective literature review[1].
The approach to the literature review and sampling of items describing a variable may differ for important reasons. In cases of a new phenomenon (such as long COVID and COVID-19 related studies), the literature search may be less voluminous as the body of knowledge on such a novel phenomenon is just evolving. Meanwhile, it is common for questionnaire designers to adopt, modify and validate existing questionnaires as part of the literature background[10]. The theoretical premise of a variable underscores the content validity of the rating scale, and all relevant items ought to be included at this stage of developing a rating scale[9]. Tsang et al.[9] outlined some of the important issues arising at this stage to including exploring the literature till saturation level, clarity and simplicity, the number of category options and the coding system. Best practices in literature search involve keeping pace with scientific advances by reviewing current practices and knowledge so that the items define the current knowledge of the variable[10].
2.2 Phase Two (Face Validity)
In a broad sense, face validity is a form of an “expert” witness, attesting to the content validity of a questionnaire. Only expert(s); persons with personal or experiential knowledge, on a subject can provide useful information about the relevance of items included as indicators of a variable. Expert opinion is a type of knowledge built from lived experience or professional practice. Yet, reporting the criteria and procedure for face validity assessment is not always clearly presented even though the step is frequently mentioned among questionnaire designers[1]. A research team investigating a variable should assess the items included on the scale as a form of internal validity to verify the connections between the proposed questionnaire, the variable of interest and the purpose of the study. In a situation where the items are translated from one language to another, it is worth consulting language experts to give face validity to the translated version[13]. Altering a few words or options provided in a questionnaire may influence responses to the same item even though the same idea may be conveyed[13].
Another approach to face validity involves bringing together a panel of individuals with experience to assess the questionnaire items[9]. This may class as external face validity since the constituted panel is not necessarily part of the research (investigators) team but familiar with the potential target population and the research variable. For instance, to suggest face validity for a questionnaire to assess nurses’ evidence-based competency or skills, the panellist may involve newly qualified nurses, various cadres of registered nurses, ward managers, clinical education team and university faculty. Rasch proponents comprehensively articulated the expectations surrounding the responsibilities of experts providing face validity to a survey or rating scale[1,2].
In line with objective measurement theory, indicators on a rating scale must be ranked from the less difficult to the most challenging task by the expert panel[4,8]. This hypothetical order creates an empirical perception of item difficulty which may be viewed as a precursor to item linearisation[12]; a requirement for constructing a non-sample dependent rating scale. For example, experts assessing the face validity of a self-reported evidence-based competency questionnaire will agree that the task involving articulating a clinically relevant question is a lot more difficult than monitoring the therapeutic effect of a treatment. Similarly, conducting a systematic review to produce the evidence informing a treatment decision is more difficult than forming clinically answerable questions. By conceptualising indicators of a variable measure based on difficulty level, the credibility of responses can be screened and outcome data compared with the predetermined criteria. Further attention will be drawn to items and responses inconsistent with the predetermined arrangement. Finally, a reporting framework must be designed by the investigator for providing feedback following face validation and recommended revisions.
2.3 Phase Three (Rasch Assumption Test)
Questionnaire development may begin with literature evidence and expert review, but the process must lend itself to fundamental mathematical principles embodied in objective measurement. Consistent with the goal of creating an interval measure from the ordinal item category, proponents of Rasch theory argue that the psychometric properties of the rating scale that must be assessed include item difficulties, category function, dimensionality, item fit and item reliability / validity[1,4,6,8,14]. To better understand the merits of testing Rasch assumptions, this section will give a brief introduction to the Rasch theory, highlight the significance of Wright Map in improving a rating scale and conclude with an example.
2.3.1 Definition of Objective Measurement Under Rasch Theory
Understanding the basic theoretical proposition of Rasch model of objective measurement is central to evaluating the psychometric properties of the questionnaire. The Rasch model is named after George Rasch’s (1960) work on extending true measurement in physical sciences to dichotomous (True or False, Yes or No) tests[4]. The probabilistic theory proposes that provided test takers possess varying degrees of knowledge (or any trait of interest) and items on a measuring scale indicate varying degrees of difficulties (the more difficult an item the higher the score), the likely outcomes are as follows:
(1) Test takers with average knowledge are likely to give correct answers to all the easy questions;
(2) Test takers with higher knowledge are likely to answer all the difficult questions correctly;
(3) Test takers with lesser knowledge are likely to give wrong answers to tough questions;
(4) Test takers who got all the answers right possess ability beyond the questions;
(5) Test takers who got all the answers wrong do not measure up to the difficulty level of the questions.
In line, Boone et al.[8] argued that the most useful contribution of the Rasch technique to questionnaire development is the conversion of raw measures or ordinal scores into a linear scale using the probabilistic theory. This achievement is pivotal as no meaningful calculation (including simple addition or mean estimation) is possible until a scale demonstrates psychometric properties that portray interval or ratio relationship; a function that cannot merely be assumed without a mathematical model. The key notion of Rasch technique suggests that questionnaire items must be subjected to basic mathematical or computational examination otherwise the data generated cannot be meaningfully explained.
Further development of Rasch theory of objective measurement led Wright and Masters[16] to apply the model to analysing Likert-type questionnaire on the background that the ability to determine a right answer in a dichotomous (True / False) scale underlines the endorsement of a category option in a Likert type questionnaire. In other words, even though agreeability (Strongly agree, Agree, Strongly disagree and Disagree) is the widely used category definition in the Likert scale, respondents’ endorsement of any category is a function of latent ability and level of agreeability (difficulty) of the item. However, a major criticism of Rasch objective measurement is that psychosocial traits such as knowledge, anxiety or desire cannot be objectively measured in the same manner as using a measuring tape for length measurement[4]. Correspondingly, the counterargument is that some clinical measurements such as body temperature and blood pressure are not true measures but valid and useful enough for making evidence-based treatment decisions. Clinicians are aware that temperature measures using a clinical thermometer is a mathematical model of body temperature which may vary (within allowable limits) depending on the anatomical site the temperature is taken hence not a reading of the core body temperature[4]. In the same vein, Rasch theory of objective measurement may not completely eliminate measurement errors but ensures the outcome measure of a trait aligns with the definition of objective measurement; Whatever trait is being measured, and whatever measuring tool is used, the result must be displayed on a common linearised metric[17]. Correspondingly, the next section of this paper will focus on using the Wright Map to evaluate questionnaires as rating scales. Other key psychometric properties proposed under Rasch techniques include category function test, dimensionality, local independence, fit statistics and differential item functioning.
2.3.2 Improving Questionnaire Development Using A Wright Map
The contribution of the Wright Map to improving the objective function of a rating scale is explained in this section to include the definition of a Wright Map, its advantages and the techniques for improving a questionnaire.
Mathematicians (and scientists) especially appreciate the use of graphs, diagrams, plots or charts in simplifying complex terms or numbers for scientists to understand the clear implications of such figures. In Rasch techniques of questionnaire validation, a map of respondents and items (Wright Map) is an insightful diagram for a concise display of the frequently presumed linearity among indicators and applying the same premise for calculations[1,4,16]. A significant misunderstanding of fundamental mathematical principles among questionnaire developers is the failure to acknowledge the non-linear nature of items on a questionnaire[6]. This problem is entrenched by the erroneous practice of treating questionnaire items as tools producing interval measures whereas a questionnaire is neither an interval nor ratio rating scale (refer to problem 1). In response, modelling the questionnaire items on a Wright Map corrects the rating scale for error of nonlinearity[8,12]. Further, a Wright Map may be applied for outcome measure construction however the focus here is understanding the implications of the map for validating a rating scale.
Boone et al.[8] devoted two chapters to the techniques of constructing and interpreting Wright Maps in their textbook Rasch Analysis in the Human Sciences. Furthermore, having realised some less innovative presentations of Wright Maps in research publications, Boone and Staver[12] followed up with criticisms and recommendations on presenting Wright Maps (with attractive features) in scientific journals. Correspondingly, the Wright Map below (Figure 2 derived from Winsteps 5.0.0.0) displays the item difficulty of a (hypothetical) self-reported evidence-based competency scale.
|
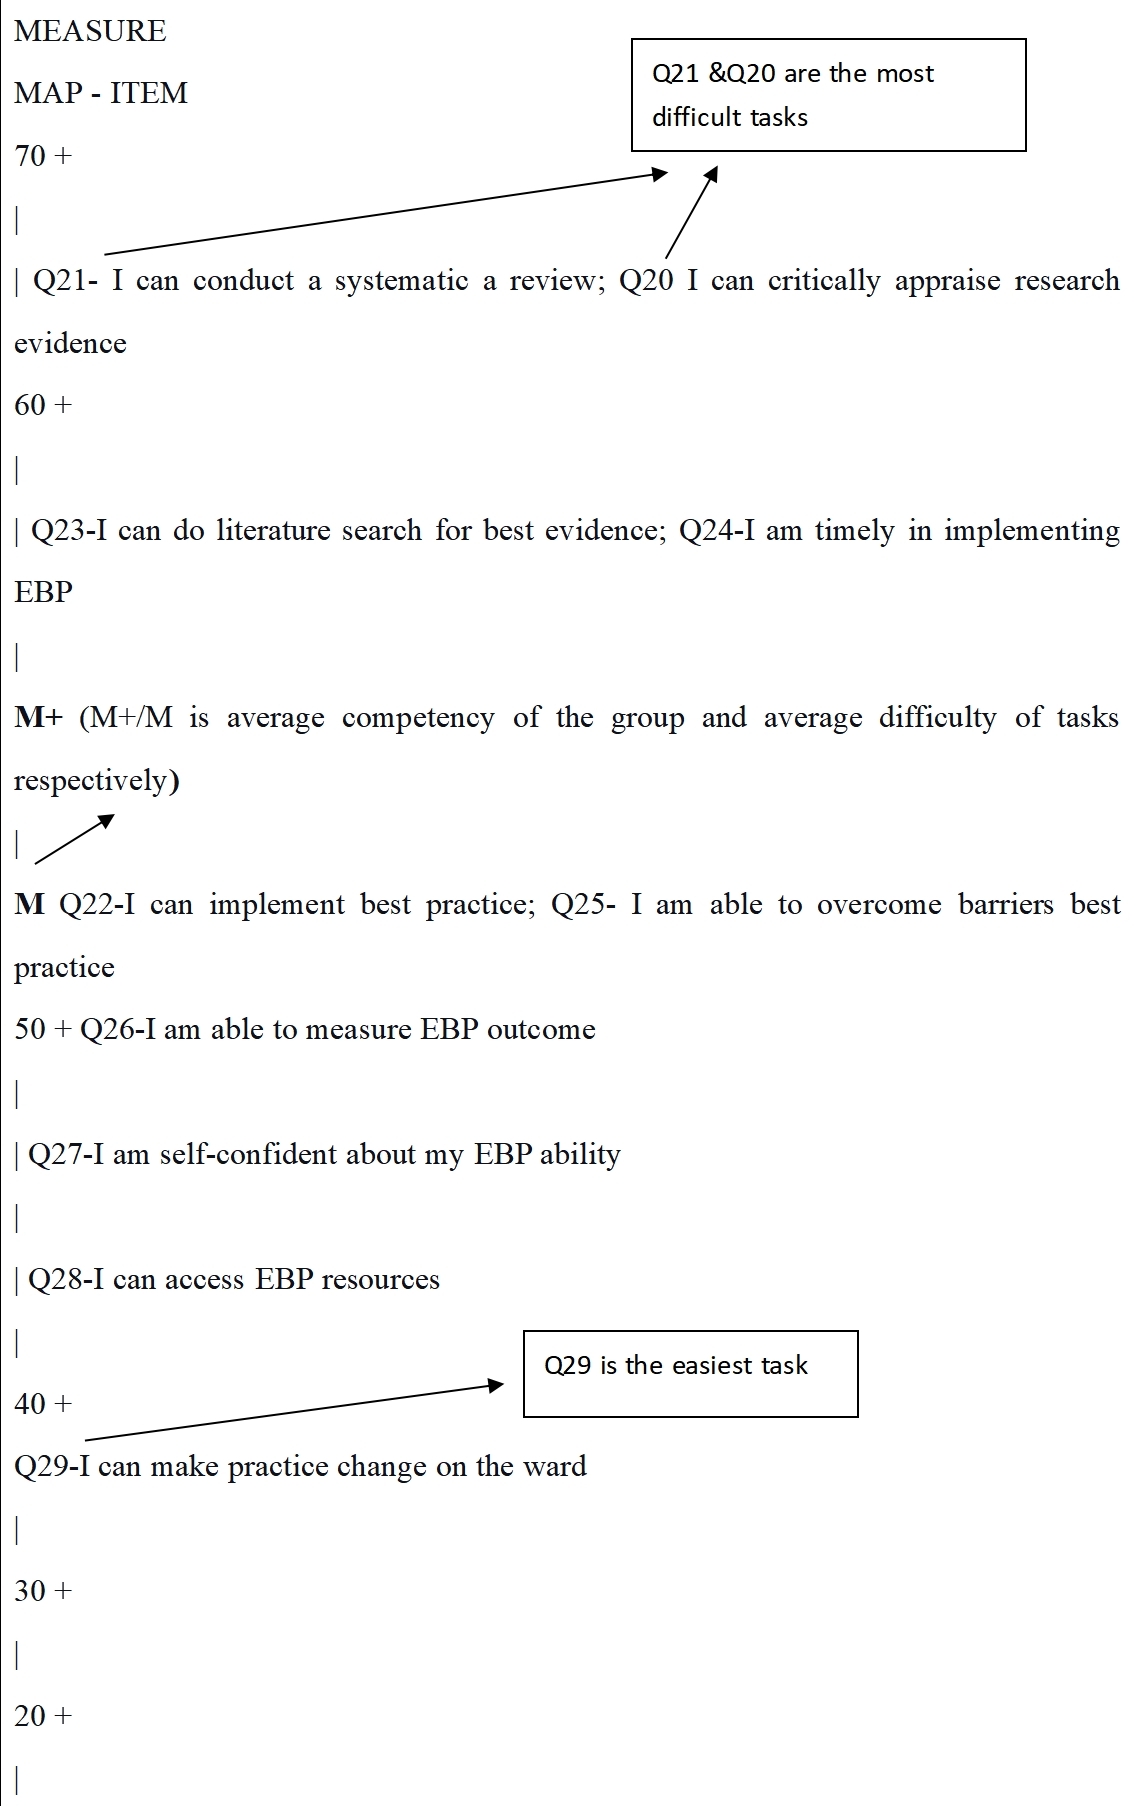
Figure 2. Wright Map of a self-reported evidence-based competency scale.
Figure 2 above is a Wright Map corrected for logit measure (converted to 0 to 100) and omission of the respondents’ population. Unlike the traditional Wright Map with both negative and positive measures on the person-item scale, the above map is modified to eliminate the confusion of negative measures while focusing only on the items. The first part of the map to consider is the location of the two “M+” and “M” on either side of the linear (logit) scale. M here is the short form for presenting mean measure for item difficulties and M+ is the respondents’ ability estimated from endorsements on the items. Where both items’ mean and respondents’ mean are at the same level on the logit scale, the level of item difficulty matches with the average measure of respondents’ ability (or knowledge). In other words, the scale is neither too difficult nor too easy for the respondents. From Figure 2 above, the item mean is at 51 logits and the respondents’ mean is at 52 logits suggesting the items may be a good match for the respondents since the difference of the mean is just by one logit. If there is a significant difference between the item and respondent mean, the implication is to examine the items and the overall relevance of the scale to the target population.
Considering the relationship between the locations of the items and the item mean, items Q21, 23, 24 and 25 are above the average difficulty, items Q22 and 25 at the average level, Q26 is slightly lesser while items Q28, 29 and 30 are below average the difficulty level. Overall, items Q20 and 21 are the most difficult while Q29 is the easiest. At this point, an important exercise is to compare the recommendations from the face validity phase (phase 2) with the Wright Map result presented. It must be recalled that Rasch theory suggested arranging items on a questionnaire as tasks possessing varying degrees of difficulty. Correspondingly, findings from Figure 2 suggest that Q29 (I can make practice change on the ward) is far easier for nurses than items Q21 and Q20 which both involves the ability to conduct a systematic review of literature and critical appraisal of evidence. This result confirms the theoretical and experiential conclusion that systematic review and critical analysis of research evidence are more arduous tasks when implementing evidence-based practice. This analysis can be applied to every other item on the scale.
Notwithstanding, an important observation from the distribution of indicators (on the scale) is the locations of items Q21 and Q20, Q23 and Q24, Q22 and Q25 on the same level of difficulty. A linear relationship is the core scientific and mathematical principle for accurate addition and subtraction. Hence, items must locate a particular location on the logit scale to make useful contributions to measurement. Against this background, items Q20, 24 and 25 are redundant being located on the same level of item difficulty as items Q21, 23 and 22 respectively. This evidence presents an important opportunity for questionnaire developers to revise or delete items not making useful contributions to measurement.
Further examination of Figure 2 may highlight other key areas on the scale that need improvement to inform the decision to amend Q20, 24 and 25. While all the items on the Wright Map are distributed only within 40 to 61 logits on a scale with the potential of 0 to 100 logits, the scale has “dead” spaces (or dormant, having no indicator) from 0 to 39 logits and 62 to 100 logits. Moreso, there is an overpopulation of indicators between 40 and 50 logits on the scale with four items Q26, 27, 28 and 29. Consequently, revising the redundant items (Q20, 24 and 25) or overpopulated areas may target locations on the scale that are not meaningfully utilised. Perhaps, illustrating this result using an imaginary urinalysis test strip graduated from 0 to 100mmol/L may aid a clearer understanding. Usually, a test strip will have numerical markings or colour codes and indicators placed side by side with readings such as 0 to 29, 30 to 40, 40 to 59, 60 to 80 to indicate a particular component of urine. From Figure 2, the indicators for readings 40 to 61 are defined with items Q20 to Q29, while readings 0 to 39 and 62 to 100 are confusing because the locations lack meaningful indicators and interpretations.
2.3.3 Item Fit Assessment
According to Linacre[18], fit statistics help to determine the variation of a questionnaire data set from Rasch measurement by estimating the infit and outfit mean square (MnSq) values. Item infit and outfit estimations are chi-squared statistics comparing the association between the Rasch model and questionnaire data. However, infit statistics align more with the respondents’ (inlier) ability while the outfit is sensitive to outliers such as guessing or unexpected mistakes[8]. The acceptable infit and outfit MnSq values range from 0.8 to 1.2 for Yes / No multiple-choice questions and 0.6 to 1.4 for the rating scale above the two category options[19]. An outfit mean value of more than two indicates the introduction of “noise” to the data collection process and a need for additional evaluation of the item[18].
2.4 Phase Four (Item Revision)
Revising the items on a questionnaire involves applying the results of the psychometric test in making changes to the items on the rating scale. Decisions at this stage may include rejecting, rewording or retaining an item. In the third phase of developing a questionnaire as a rating scale, emphasis was laid on understanding the contributions of a Wright Map to revisions that may improve the measuring tool. In line, practical decisions that may be applied to revising the evidence-based competency scale presented in Figure 2 above are outlined here.
Foremost, both Q22-I can implement best practice Q25-I am able to overcome barriers best practice presents the same level of difficulties so also do Q20 / Q21 and Q23 / Q24. Here, Q22 and Q25 provide a good example of how Wright Map analysis may help researchers to become better aware of some insightful interpretations of items worded differently. Figure 2 shows that both Q22 and Q25 essentially present the same level of difficulty by asking if a respondent can implement EBP or overcome barriers. Repeating the same question by merely changing the wording is counterintuitive and such items create redundant measurement. The implication is that one of the items should be deleted from the scale while further revisions may be needed for other items possessing the same psychometric property.
Another important revision that may be considered includes developing less difficult items as indicators for measures 0 to 40 logits and more difficult items for measures 62 to 100 logits on the linear scale. Correspondingly, measures 40 to 61 logits on the Wright Map are overpopulated with all the ten items initially evaluated. Therefore, some of the redundant items and overpopulated areas may be revised to lower or higher measures on the scale in line with the principles of objective measurement. Finally, it is a futile effort to think or invest in efforts towards generating a “perfect” rating scale as such does not exist. Nevertheless, sources of biases (measurement errors) in designing a questionnaire must be addressed by applying appropriate mathematical theories and scientific rigours so that exemplary psychometric properties are presented and assessment results are applied in making evidence-based revisions to the rating scale.
3 IMPLICATIONS
Generating credible measures of research or clinical variables using questionnaires must begin by reporting the scientific procedures applied to ensure the objective functions of the measuring tool. Therefore, engaging the four phases of designing a questionnaire illustrated in this paper proposes to nurse researchers to adopt the Rasch techniques of questionnaire validation. Central to the recommended validation technique is the methodological significance of accurate interpretation of a Wright Map to inform the evolving questionnaire. Researchers undertaking rating scale design will benefit from applying the objective measurement theory pioneered by Wright and Stone and advanced by Bond and Fox[1]; Boone and Noltemeyer[4]; Boone et al.[8]
4 LIMITATION AND CONCLUSION
There are other essential psychometric properties not covered here, such as unidimensionality, category function, differential item function, local independence, item reliability and separation. Also, Wright Map analysis is only presented here as a technique for validating a questionnaire even though the method has dual functions for evaluating the function of questionnaire items and constructing variable measures respectively. Another limitation of this paper is that a table showing the results for the fit statistics of the questionnaire is not presented. Additionally, it is important to note that the evidence of good psychometric function of a scale is not an assurance of accurate variable measurement in the same version having a good weighing scale or sphygmomanometer does not guarantee accurate estimation of patients’ weight or blood pressure respectively. Integral to the availability of a good measuring tool, essential conditions or guidance ensuring good use of the measuring scale must be observed. Hence, researchers must keep a vigil on questionnaire data and respond appropriately by reporting the treatment administered to limit measurement errors. Finally, we encourage researchers to imbibe the culture of rigour embodied in objective assessment theory when designing a questionnaire as a rating scale of health variables. Table 1 below summarises the techniques to developing the best rating scale explained in this article.
Table 1. Techniques for Developing the Best Rating Scale
Questionnaire Design Under Objective Measurement |
Activities |
Considerations |
Phase one: Literature review |
● Identify an important variable from the literature or practice ● Describe all of its significant indicators ● Formulate items as statement of fact or questions ● Propose number of category of responses and codes |
● Ensure current and relevant literature are included ● Justify literature search methods considering novelty of the variable or evolutions of new characteristics ● Search may be simple (modifying existing questionnaire) or complex (formulating a new tool) |
Phase two: Face validity test |
● Only “experts” can provide useful face validity of questionnaires ● Develop assessment tool that allows feedback on the theoretical and mathematical assumptions ● Task the panel to propose item difficulty by ranking each indicator from least difficult task to most complicated |
● Consider professionals or researchers with experience on the subject matter ● Consider psychometricians (statisticians) input ● Analyse face validity feedback, comments and suggestions by the panel |
Phase three: Rasch assumption test |
● Administer the questionnaire to appropriate population size ● Analyse the psychometric properties under Rasch theories ● (Wright Map analysis, category function, dimensionality, item separation, differential functioning, local independence, validity and reliability) |
● Consult a statistician with skills in objective measurement theory ● Based on skills and subscription, consider Software such as ConQuest 5, Facets, Winsteps, M plus R and OpenStat (free) |
Phase four: Questionnaire revision |
● Revise each indicator and the categories in line with the outcome of the assumption test |
● Communicate the outcome of the psychometric tests and the planned revisions to the expert ● Justify your decision on each item and categories |
Acknowledgements
Not applicable.
Conflicts of Interest
The authors of this article received no grant nor sponsorship from persons or institutions. The manuscript is coined from the methodology chapter of an ongoing doctoral research.
Author Contribution
Omolade OK conceived and drafted this manuscript. Omolade OK is supervised by Stephenson J who proofread and made corrections to the draft. Both authors contributed to the manuscript and approved the final version.
Abbreviation List
CTT, Classical test theory
MnSq, Mean square
References
[1] Bond T, Fox C. Applying the Rasch Model: Fundamental meausrement in the human sciences, 3rd ed. Routledge: New York, USA, 2015. [DOI]
[2] Wright BD, Stone MH. Best Test Design. MESA Press: Chicago, USA, 1979.
[3] Lehane E, Savage E. Questionnaires and instruments for health care research. In: Quantitative Health Research: Issues And Methods. McCraw-Hill International: Columbus, USA, 2013; 294-312.
[4] Boone W, Noltemeyer A. Rasch analysis: A primer for school psychology researchers and practitioners. Cogent Educ, 2017; 4: 1. [DOI]
[5] Blackman IR, Giles T. Psychometric evaluation of a self-report evidence based practice tool using Rasch analysis. Worldviews Evid Based Nurs, 2015; 12: 253-264. [DOI]
[6] Boone WJ. Rasch analysis for instrument development: Why, When, and How? CBE Life Sci Educ, 2016; 15: rm4. [DOI]
[7] Omolade OK, Stephenson J, Simkhada P et al. Is this a good questionnaire? Dimensionality and category functioning of questionnaires used in nursing research. Nurse Res, 2022; 30: 6-14. [DOI]
[8] Boone WJ, Staver J, Yale MS. Rasch Analysis in the Human Sciences. Springer: Dordrecht, Netherlands, 2014. [DOI]
[9] Tsang S, Royse CF, Terkawi AS. Guidelines for developing, translating and validating a questionnaire in perioperative and pain medicine. Saudi J Anaesth, 2017; 11: S80-S89. [DOI]
[10] Bolarinwa OA. Principles and methods of validity and reliability of questionnaires used in social and health science reserches. Niger Postgrad Med J, 2015; 22: 195-201. [DOI]
[11] Sijtsma K. On the Use, the Misuse, and the Very Limited Usefulness of Cronbach's Alpha. Psychometrika, 2009; 74: 107-120. [DOI]
[12] Boone WJ, Staver JR. Advances in Rasch Analyses in the Human Sciences. Springer Nature: Cham, Switzerland, 2020. [DOI]
[13] Sakib N, Bhuiyan AKMI, Hossain S et al. Psychometric validation of the Bangla fear of COVID-19 Scale: Confirmatory factor analysis and Rasch analysis. Int J Ment Health Addict, 2022; 20: 2623-2634. [DOI]
[14] Hagquist C, Bruce M, Gustavsson JP. Using the Rasch model in nursing research: A introduction and illustrative example. Int J Nurs Stud, 2009; 46: 380-393. [DOI]
[15] Van Zile-Tamsen C. Using Rasch analysis to inform rating scale develpoment. Res High Educ, 2017; 58: 922-933. [DOI]
[16] Wright BD, Masters GN. Rating scale analysis. MESA Press: Chicago, USA 1982.
[17] The Program Committe of Institute for Objective Measurement. Definition of Objective Measurement. Accessed December 2000. Available at: [Web]
[18] Linacre JM. Test validity and Rasch Measurement: Construct and content, etc. Rasch Meas Trans, 2004; 18: 970-971. Available at: [Web]
[19] Linacre JM. A User’s Guide to WINSTEPS MINISTEP Rasch-Model Computer Programs Program Manual 4.80.0. Chicago: IL: Winsteps, 2021.
Copyright © 2023 The Author(s). This open-access article is licensed under a Creative Commons Attribution 4.0 International License (https://creativecommons.org/licenses/by/4.0), which permits unrestricted use, sharing, adaptation, distribution, and reproduction in any medium, provided the original work is properly cited.


