
Analyzing the Impact of Dopants on the Physical and Optical Characteristics of Nanomaterials
Madhavi Sharad Darekar1*, Praveen Beekanahalli Mokshanatha1
1Department of Chemistry, Institute of Engineering and Technology, Srinivas University, Mangalore, Karnataka, India
*Correspondence to: Madhavi Sharad Darekar, Ph.D. in Physics, Post Doctorate in Nanotechnology, Post Doctorate in Physics, Department of Chemistry, Institute of Engineering and Technology, Srinivas University, Mukka, Surathkal, Mangalore 574146, India; Email: darekar.madhavi@rediff.com
DOI: 10.53964/jmn.2025003
Abstract
Objective: This study highlights the contrasting experimental outcomes of undoped and doped nanoparticles and thin films, emphasizing the advantages of doped materials in various applications over their undoped counterparts. Specifically, it aims to demonstrate the enhanced performance and suitability of doped materials in diverse settings.
Method: The study involved the synthesis of Thioglycerol-capped undoped cadmium sulphide (CdS) and copper sulphide (Cu2S) nanoparticles, and Mn-doped diluted magnetic semiconductor (DMS) CdS and Cu2S nanoparticles using a room-temperature, non-aqueous chemical method. Undoped CdS and Cu2S thin films, Mn-doped CdS, and Cu2S thin films were fabricated on fluorine-doped tin oxide (FTO) glass substrates via dip coating, followed by annealing at 420°C in air for 20 minutes. The optical properties of CdS, Cu2S, CdS:Mn, and Cu2S:Mn nanoparticles were investigated using Ultraviolet-Visible (UV-Vis) absorption and photoluminescence (PL) spectroscopy. Energy Dispersive X-ray Analysis (EDAX) was employed to determine the chemical composition of undoped CdS and Cu2S and Mn-doped CdS and Cu2S thin films and the FTO glass substrates, with chemical composition percentages determined using mapping techniques.
Results: A blue shift was observed in the optical absorption spectra of CdS and Mn-doped CdS nanoparticles. This phenomenon was attributed to quantum confinement effects. Doping the CdS nanoparticles led to a significant enhancement in their average size. Mn doping in CdS nanoparticles significantly boosts their photocatalytic activity and other performance aspects compared to undoped CdS by altering their optical and structural properties, which results in larger particle sizes, improved light absorption, and increased electron-hole separation, making them more effective for applications in solar cells and environmental remediation. In the same way, the UV-Vis absorption spectra of Mn-doped Cu2S nanoparticles also exhibited a blue shift, mirroring the observation in the undoped Cu2S nanoparticles. In UV-Vis absorption spectra, Mn doping in CdS and Cu2S results in a red shift and broadening of absorption bands, which indicates larger particle sizes for the doped nanoparticles compared to their undoped counterparts. This effect stems from doping's influence on the electronic structure, creating new energy levels and absorption bands within the material's band gap, leading to enhanced light absorption and thus suitability for applications like optoelectronics and photocatalysis. The photoluminescence spectra of pure CdS nanoparticles showed a blue-shifted peak, while the Mn-doped CdS nanoparticles displayed a red-shifted peak. The PL emission peak for both pristine and Mn-doped Cu2S nanoparticles was observed at shorter wavelengths, indicating a blue shift. EDAX analysis confirmed a 1:1 atomic ratio of Cd to S, indicating stoichiometric CdS thin film formation. A 2:1 atomic ratio of copper to sulfur was observed via EDAX, confirming the stoichiometric Cu₂S composition of the film. The structural information obtained from X-ray diffraction (XRD) was further enriched by Scanning Electron Microscopy (SEM) analysis, which elucidated the surface morphology and roughness.
Conclusion: The experimental findings presented here reveal that doping CdS and Cu2S nanomaterials and thin films leads to significant improvements, demonstrating their enhanced suitability for a variety of technological applications over undoped versions.
Keywords: synthesis, characterization, non-aqueous chemical method, nanoparticles, thin films, dip coating method
1 INTRODUCTION
Cadmium sulphide (CdS) is a yellow, direct band gap semiconductor with a band gap of approximately 2.42eV. CdS semiconductor has optoelectronic applications like solar cells (often used as a window layer or in heterojunctions with other materials), photodetectors, light-emitting diodes (LEDs), thermoelectric devices, display devices etc. and it is used as a pigment due to its good thermal stability, light and weather fastness, chemical resistance, and high opacity. CdS is an II-VI group n-type semiconductor, meaning it has an excess of electrons. CdS exists in two polymorphs: a more stable hexagonal wurtzite structure (greenockite) and a cubic zinc blende structure (hawleyite). CdS is highly photosensitive in the visible region, meaning its conductivity increases when exposed to light. It has a high mobility, a high absorption coefficient, a high refractive index, and high electrochemical stability. CdS is used in thin-film solar cells, often as a window layer. Its photosensitivity makes it suitable for use in photodetectors. CdS is used in photoconductive sensors. CdS finds applications in photonic devices. CdS was one of the first semiconductor materials used in thin-film transistors. CdS luminesces under electron beam excitation and is used as a phosphor. CdS is used in photocatalysis, where it can be used to degrade organic dyes. CdS nanocomposites can be used for hydrogen production via water splitting. CdS can be used in core/shell CdSe/CdS quantum dots[1-7].
Copper sulphide (Cu2S) is a I-VI group p-type semiconductor with an indirect band gap of 1.21eV, making it a promising material for solar energy conversion, nanoscale sensors, and cathodes in lithium-ion batteries. Cu2S is a good material for solar energy absorbers due to its non-toxic, low-cost nature, and suitable band gap. It is used as the absorber of visible light. It is suitable for potential applications in solar cells (often used as an absorber layer or in heterojunctions with other materials), photodetectors, thermoelectric devices, display devices, photocatalyst, biosensors, gas sensors, field emission devices, and nano switches. Cu2S can form in cubic or tetragonal structures depending on the preparation method. Various methods can be used to synthesize Cu2S nanostructures, including nanolithography, template-directed synthesis, vapour-phase methods, and solvothermal methods. The advantages of Cu2S semiconductor material are: (1) High elemental earth abundance:- Cu and S are readily available, (2) Nontoxicity:- Cu2S is a non-toxic material, (3) Suitable optical properties:- Cu2S has a high absorption coefficient of over 104cm-1 (4) Low cost, and (5) Ideal band gap for solar energy absorption[1,3,8-15].
Undoped CdS and Cu2S nanoparticles can be synthesized via various chemical and physical methods, including sol-gel, chemical bath deposition, microwave-assisted synthesis, and hydrothermal, among others[14]. The chemical methods like sol-gel method, chemical bath deposition, aqueous precipitation, microwave-assisted synthesis, and solvothermal method were used for the synthesis of undoped CdS nanoparticles. The sol-gel method involves using precursors like cadmium acetate and thioacetamide to form a sol and then a gel, which can then be processed to obtain CdS nanoparticles. The chemical bath deposition technique involves reacting cadmium and sulfur precursors in a solution, resulting in the precipitation of CdS nanoparticles. The aqueous precipitation method utilizes cadmium nitrate and sodium sulfide precursors to produce a yellow CdS precipitate. The microwave-assisted synthesis method uses microwave irradiation to facilitate the reaction of precursors in aqueous solutions, leading to the formation of CdS nanoparticles. The solvothermal method involves reacting precursors in a closed vessel under high temperature and pressure to control the morphology and size of the CdS nanoparticles. The physical methods like laser ablation, and hydrothermal method were used to synthesize the undoped CdS nanoparticles. The hydrothermal method involves reacting precursors in a sealed vessel under high temperature and pressure, which can control the morphology and size of the CdS nanoparticles. The laser ablation method uses laser energy to ablate a target material (e.g., CdS) and deposit the resulting nanoparticles onto a substrate. The other methods like template-based method, micelles, sonochemical and arrested precipitation in homogeneous solution were also used for the synthesis of undoped CdS nanoparticles[1-3,15-22].
The undoped Cu2S nanoparticles were synthesized using the chemical methods like wet chemical method, and microwave-assisted synthesis. The wet chemical method involves reacting copper and sulfur precursors in solution, leading to the formation of Cu2S nanoparticles. Similar to CdS, the microwave-assisted synthesis method can be used for Cu2S synthesis, with precursors like copper acetate and sodium sulfide. The undoped Cu2S nanoparticles were also synthesized using the physical methods like thermal treatment, electrochemical synthesis and deposition and sputtering techniques. Decomposition of Cu precursors at high temperatures (calcination or pyrolysis) can also be used to generate Cu2S nanoparticles. The electrochemical synthesis method involves controlling the rate of reduction of Cu species to produce Cu and Cu2S nanoparticles. The deposition and sputtering techniques provide more size-selective synthesis of Cu and Cu-based nanoparticles[1,2,8,23].
Undoped CdS and Cu2S thin films can be prepared using the dip coating method, a simple and cost-effective technique that involves immersing a substrate into a solution and withdrawing it at a controlled rate. The dip coating method involves immersing a substrate into a solution containing the precursor materials (e.g., cadmium chloride and thiourea for CdS, copper acetate and thiourea for Cu2S) and then withdrawing it at a controlled rate. The solution is typically dissolved in a solvent like methanol. The deposited thin films are then typically heat-treated (annealed) in air to improve their structural and optical properties. Dip coating is a relatively simple and inexpensive method compared to other thin-film deposition techniques. It is suitable for depositing thin films on large area substrates. The process is relatively easy to control and reproduce. CdS is a semiconductor material with a wide range of applications, including solar cells and optoelectronic devices. Cu2S is another semiconductor material that can be used in solar cells and other applications. The properties of the prepared thin films are typically characterized using techniques like X-ray diffraction (XRD), Scanning Electron Microscopy(SEM), and Ultraviolet-Visible (UV-Vis) absorption spectroscopy. CdS and Cu2S thin films are used as absorber layers in thin-film solar cells. They can also be used in other optoelectronic devices, such as photodetectors and LEDs[1-3,8,24,25].
Mn-doped CdS and Cu2S nanoparticles are semiconductor nanoparticles with potential applications in various fields, including photocatalysis and luminescence, with Mn doping enhancing their properties. Mn-doped CdS nanoparticles can be synthesized via methods like co-precipitation, chemical precipitation, and green capping with starch. XRD studies reveal a cubic phase structure for CdS nanoparticles, with Mn doping potentially influencing the morphology and size. Mn doping modifies the luminescent, optical, and electronic properties of CdS, potentially leading to a decrease in band gap energy. Mn-doped CdS exhibits interesting luminescent properties, with the luminescence intensity being influenced by Mn concentration and synthesis conditions. Mn doping can enhance the photoconductivity of CdS, making it suitable for applications in optoelectronic devices. Mn doping can change the morphology of CdS nanoparticles from spherical to scale-like structures. The dielectric properties and AC conductivity of CdS are affected by Mn doping, which can be investigated over a wide frequency range and temperature range. Mn doping can also modify the ferromagnetic properties of CdS. Mn-doped CdS nanoparticles are used in photocatalytic applications, such as hydrogen production and dye degradation. They are used in luminescent materials for applications in displays, sensors, and bioimaging[26-34].
Mn-doped Cu2S nanoparticles can be synthesized using wet chemical routes. XRD studies reveal a hexagonal crystal structure for Cu2S nanoparticles. Cu2S nanoparticles exhibit optical properties that can be tuned by controlling their size and morphology. Cu2S nanoparticles can be used in photocatalytic applications, such as hydrogen production and dye degradation. Cu2S nanoparticles have potential applications in energy storage devices[35-37].
Mn-doped CdS and Cu2S thin films prepared by the dip coating method exhibit potential for optoelectronic applications, with studies exploring their structural, optical, and electrical properties, and the effects of Mn doping on CdS. Mn-doped CdS thin films can be prepared using the dip coating method, where the substrate is immersed in a solution containing cadmium and sulphur precursors, along with Mn dopant. Mn doping can modify the structural, optical, and electrical properties of CdS films. These films are explored for applications in optoelectronic devices, solar cells, and other areas. Techniques like XRD, SEM, and UV-Vis absorption spectroscopy are used to characterize the films. Mn-doped Cu2S thin films can also be prepared using the dip coating method, involving immersion of the substrate in a solution containing copper and sulphur precursors. Cu2S films are explored for applications in solar cells and other optoelectronic devices. Similar to CdS, characterization techniques like XRD, SEM, and UV-Vis absorption spectroscopy are used to study the films[1-3,8,35,38-40].
Several methods can be used to prepare CdS and Cu2S thin films and also Mn-doped CdS and Cu2S thin films, including dip coating, spray pyrolysis, spin coating, chemical bath deposition, and successive ionic layer adsorption and reaction (SILAR). While dip coating offers advantages like simplicity, low cost, and ease of film thickness control, other methods like spray pyrolysis, spin coating, SILAR, and chemical bath deposition may be preferred for specific applications. Dip coating is a relatively simple and cost-effective method, requiring less specialized equipment than other techniques. Film thickness can be easily controlled by adjusting parameters like dip time, concentration, and draw speed. Dip coating can be adapted to produce films with specific nanostructures, such as nanoparticles or nanorod arrays, by using appropriate precursor solutions. The best method for preparing CdS and Cu2S thin films and also Mn-doped CdS and Cu2S thin films depends on the specific application requirements, such as film thickness, uniformity, composition, and desired nanostructures. Dip coating offers simplicity and cost-effectiveness, while other methods like spray pyrolysis, spin coating, CBD, and SILAR may be more suitable for specific applications[1-3,8,35,41-45].
In the present paper, the undoped and Mn-doped CdS and Cu2S nanoparticles were synthesized using the wet chemical method at room temperature. These nanoparticles were characterized by UV-Vis absorption spectroscopy and PL spectroscopy. Then the undoped and Mn-doped CdS and Cu2S thin films were deposited on fluorine-doped tin oxide (FTO) glass slides by the dip coating method. The thin films, after being heat-treated in air at 420°C for 20 minutes, were analyzed using Energy Dispersive X-ray Analysis (EDAX) to determine their elemental composition. This study contrasts the experimental and characterization outcomes of undoped and Mn-doped CdS and Cu2S nanoparticles and thin films, highlighting the advantages of Mn doping in these materials. Specifically, it demonstrates how Mn doping alters the properties of both the nanoparticles and thin films, showcasing potential improvements in performance.
2 EXPERIMENTAL
Thioglycerol capped undoped and Mn-doped CdS and Cu2S nanoparticles were prepared by the wet chemical synthesis at room temperature in our previous study[1,2,8,26,35]. These nanoparticles were analyzed by UV-Vis absorption spectroscopy and PL spectroscopy. The Analytical Reagent grade chemicals like cadmium acetate, thioglycerol and sodium sulphide were used for the synthesis of undoped CdS nanoparticles and the chemicals like cadmium acetate, manganese chloride, thioglycerol and sodium sulphide were used for the synthesis of Mn-doped CdS nanoparticles. Ethanol was used as the solvent in the synthesis of undoped and Mn-doped CdS nanoparticles. The undoped CdS nanoparticles were synthesized by varying the thioglycerol concentration and by keeping the molarities of cadmium acetate and sodium sulphide constant. The Mn-doped CdS nanoparticles were synthesized by changing the concentration of manganese chloride and by keeping the molarities of cadmium acetate, thioglycerol and sodium sulphide constant. Similar to CdS, the undoped Cu2S nanoparticles were prepared by varying the thioglycerol concentration and by keeping the molarities of cuprous chloride and sodium sulphide constant. The Mn-doped Cu2S nanoparticles were synthesized by changing the concentration of manganese chloride and by keeping the molarities of cuprous chloride, thioglycerol and sodium sulphide constant[1,2,8,26,35].
A CdS thin film approximately 280nm in thickness was prepared on the FTO glass slide by the dip coating method with 2300 dip times. Similarly, a Cu2S thin film approximately 26μm in thickness was created on the FTO glass slide by the dip coating method with 4600 dip times. The dip coating deposited Mn-doped CdS thin film approximately 325nm thick was prepared on the FTO glass slide with 2600 dip times. Similarly, the dip coating deposited Mn-doped Cu2S thin film approximately 30μm thick was prepared on the FTO glass slide with 5300 dip times.
An extreme number of dip cycles for making CdS and Cu₂S thin films via the dip-coating method raises concerns about practicality and scalability due to extended processing times, increased material costs, and the difficulty of achieving uniformity over large areas. While dip-coating is simple and economical for small-scale research, high cycle counts make it time-consuming and inefficient, potentially leading to variations in film properties and a lack of consistent results, making it unsuitable for industrial-scale production. A large number of dip cycles inherently increases the total deposition time required to achieve the desired film thickness, making the process tedious for both researchers and manufacturers. Each dip cycle consumes precursor solution, so an excessive number of cycles leads to significantly higher material waste and costs, which is a significant drawback for any production. While dip-coating aims to produce uniform films, a high number of cycles can introduce inconsistencies in thickness and properties across the substrate, potentially leading to defects like voids or pinholes in the final film. Dip-coating is generally a lab-scale technique that struggles with uniform deposition over large areas (e.g., >1cm²). A high number of dips will not overcome this fundamental limitation. For industrial applications, large-scale production requires high reproducibility. High-cycle dip-coating can increase batch-to-batch variation in film properties, which is unacceptable for consistent manufacturing. Compared to other methods like spray-coating, pulsed laser deposition (PLD), or chemical vapor deposition (CVD), which are designed for large-area, high-throughput production, dip-coating with many cycles is not a viable option for large-scale manufacturing of thin films.
Spray coating is a is a more scalable technique that uses spray devices to deposit films, offering better control over uniformity and faster deposition times for larger areas. While requiring more sophisticated equipment, PLD offers higher reproducibility, shorter deposition times, and better homogeneity, making it suitable for high-throughput applications. CVD methods are favored in many industries for their ability to deposit uniform, high-quality films on various substrates, notes ResearchGate, making them a practical solution for scalability[46-50].
Mn doping in CdS and Cu2S nanoparticles and thin films offers several advantages, primarily related to manipulating their optical and electronic properties, and potentially improving their performance in solar cells and other applications. Specifically, Mn doping can modify the optical band gap, enhance light absorption in the visible spectrum, and potentially improve charge transport. Mn doping can lead to a reduction in the optical band gap, which means the material can absorb light with longer wavelengths (towards the red end of the spectrum), according to one study. This is beneficial for solar cells as it allows them to capture more of the solar spectrum. By controlling the Mn doping concentration, the optical band gap can be tuned, potentially allowing for light response across a wider range of the visible spectrum. Mn doping can introduce new optical transitions that allow the materials to absorb visible light more efficiently, as noted in one study. This increased light absorption is particularly important for applications like quantum dot-sensitized solar cells, where Mn doping can improve the efficiency of light energy conversion. Mn doping can potentially alter the electrical conductivity of the material, potentially leading to faster electron or hole transfer, according to one study. In devices like solar cells, this can mean faster charge separation and transport, leading to improved efficiency. Mn doping can also introduce spintronic properties, where the spin of electrons becomes relevant, which could lead to new applications in spintronics. Mn doping can introduce magnetic moments, which can be used to manipulate the material’s magnetic properties. Mn doping offers a versatile way to tailor the optical and electronic properties of CdS and Cu2S, making them potentially more suitable for applications in solar cells, optoelectronics, and potentially spintronics[26,35,51].
3 RESULTS AND DISCUSSION
The absorbance spectrum, depicting the absorbance as a function of wavelength, is provided in Figure 1. The UV-Vis absorption spectrum of CdS nanoparticles exhibits a significant absorption peak in the ultraviolet wavelengths, while exhibiting minimal to no absorption in the
|
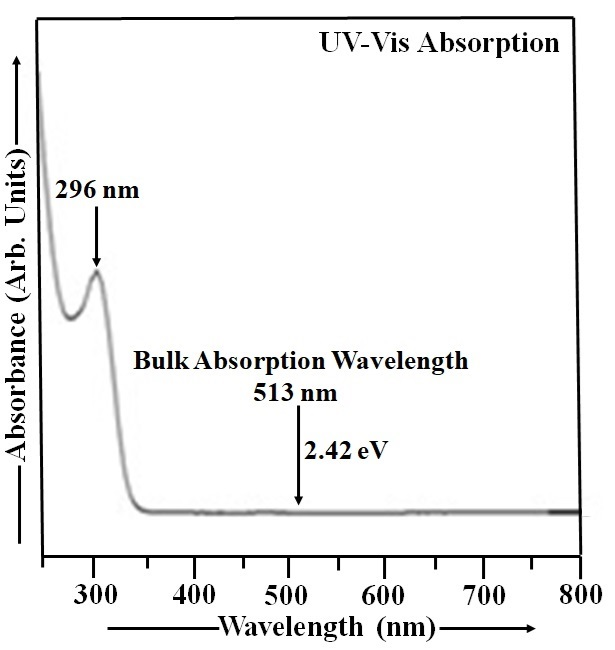
Figure 1. UV-Vis Absorption Spectrum of CdS Nanoparticles.
near-infrared wavelengths. The CdS film's high transparency in the visible spectrum makes it a suitable window layer, allowing light to efficiently reach the absorber layer in optoelectronic devices[52]. The UV-Vis spectrum was collected over the 250-800nm wavelength range. The CdS sample used in this study was prepared as a suspension of CdS nanoparticles in double distilled water, serving as the reference solution[1,2]. The thioglycerol concentration in CdS sample was 1.904M. This CdS sample exhibits a UV-Vis absorption peak at 296nm, corresponding to an energy gap of approximately 4.19eV. The particle size in this sample was found to be 4.60nm. The optical absorption spectrum of CdS nanoparticles exhibits a blue shift compared to bulk CdS, which has a band gap of 2.42eV and an absorption peak at 513nm, due to quantum confinement effects[1-3].
The absorbance curve for Mn-doped CdS nanoparticles, displaying its variation with wavelength, is shown in Figure 2. The analysis was performed across the UV-Vis spectral range, specifically from 250 to 800nm. A suspension of CdS:Mn nanoparticles in double distilled water was used as the reference solution in this case[26]. The thioglycerol concentration in CdS:Mn sample was 1.904M. The molarity of manganese chloride in this sample is 0.065M. A prominent UV-Vis absorption peak, centered at 316nm (energy gap ~ 3.93eV), was detected in the Mn doped CdS sample. This peak signifies a significant absorption of ultraviolet and visible light by the material. The blue shift in the Mn-doped CdS nanoparticle absorption spectrum is a consequence of size quantization, causing a shift in energy levels due to the nanoscale dimensions of the material[26]. Based on the analysis, the particle size in CdS:Mn sample is estimated to be 4.79nm. Analysis of Figures 1 and 2 reveals a clear trend of increasing CdS:Mn nanoparticle size when thioglycerol concentration is held constant.
The larger size of CdS:Mn nanoparticles, as indicated by their UV-Vis absorption spectrum, is due to the quantum size effect and the influence of Mn doping on nanoparticle growth. Mn doping can alter the growth mechanism, leading to larger particle sizes compared to undoped CdS nanoparticles (Figure 1). Mn doping can alter the growth kinetics of CdS nanoparticles. For instance, manganese ions can act as nucleation sites or influence the rate of CdS growth, potentially leading to larger particles compared to undoped CdS. The band gap of CdS nanoparticles also increases with decreasing size. Mn doping further enhances this quantum size effect, leading to a larger band gap in CdS:Mn nanoparticles compared to undoped ones. The blue shift in the absorption edge of CdS:Mn nanoparticles, compared to undoped ones, is a clear indication that the size of the doped nanoparticles is larger. This blue shift suggests that the doped nanoparticles have a larger energy gap, indicating a larger average particle size, as shown in Figure 2. CdS:Mn nanoparticles offer several advantages over undoped CdS nanoparticles, particularly due to their larger particle size and enhanced photocatalytic activity. These advantages stem from the ability of Mn doping to alter the optical and structural properties of CdS, leading to improved performance in various applications like photocatalysis and solar cells. Mn doping can create new energy levels within the CdS bandgap, facilitating electron-hole separation and enhancing photocatalytic activity. Mn doping can improve the stability of CdS nanoparticles, making them more resistant to degradation under light exposure. The larger particle size and altered optical properties of Mn-doped CdS can lead to increased absorption of visible light, expanding the range of light that can be utilized for photocatalytic processes. Mn doping allows for the tuning of optical properties, such as the band gap and absorption spectra, which can be beneficial for specific applications, as shown in a study on CdS:Mn quantum dots in solar cells. Mn doping can improve the performance of CdS-based solar cells by increasing the efficiency of charge separation and transfer. The synthesis of Mn-doped CdS can lead to different morphologies (e.g., scale-like, needle-like) and particle sizes, which can be beneficial for specific applications, as discussed in a study on CdS:Mn thin films[1,2,26,53-59]. Mn-doped CdS nanoparticles offer several advantages over undoped CdS nanoparticles, including enhanced stability, improved photoluminescence (PL), and the potential for tunable optical properties. These improvements are particularly valuable in applications like solar cells, photocatalysis, and optoelectronic devices. Mn doping can increase the stability and resistance of CdS nanoparticles to photodegradation, leading to longer-lasting and more durable devices. Mn doping can alter the PL properties of CdS nanoparticles, potentially leading to changes in emission color and intensity. In some cases, Mn doping can even result in a dual-color emission, where the host CdS material emits blue light and the Mn dopant emits red light. Mn doping can modify the band gap of CdS nanoparticles, affecting their optical absorption and emission wavelengths. This tunability can be useful for designing devices that operate at specific wavelengths or have enhanced sensitivity to certain light sources. Mn doping can enhance the photocatalytic activity of CdS nanoparticles, making them more effective at breaking down pollutants and other substances under light irradiation. The combination of enhanced stability, improved PL, and tunable optical properties makes CdS:Mn nanoparticles attractive for a wide range of applications, including: Solar cells: Mn doping can improve the efficiency of CdS-based solar cells by enhancing light absorption and electron transfer. Photocatalysis: Mn doping can improve the photocatalytic activity of CdS nanoparticles, making them more effective at breaking down pollutants. Optoelectronic devices: Mn doping can lead to changes in the optical properties of CdS nanoparticles, which can be used to create new types of sensors, LEDs, and other optoelectronic devices. Bioimaging and drug delivery: The PL of CdS:Mn nanoparticles can be used for bioimaging and targeted drug delivery[1,2,19,26,34,53,54,60-62].
|
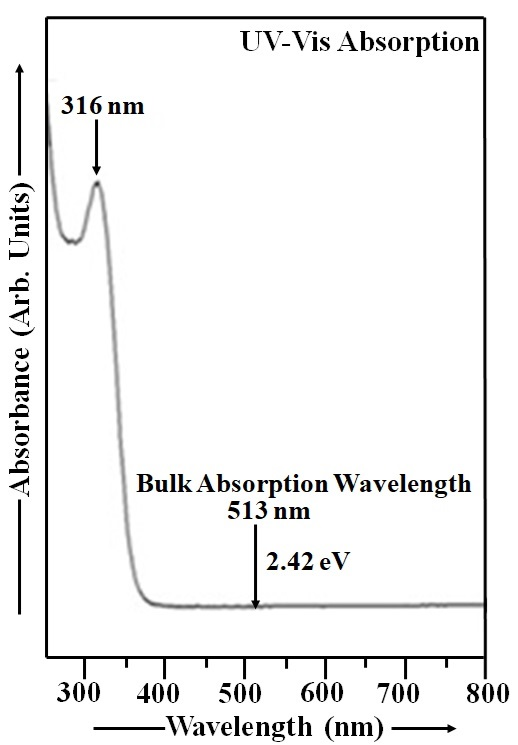
Figure 2. UV-Vis Absorption Spectrum of CdS:Mn Nanoparticles.
The observed room temperature ferromagnetic properties make CdS:Mn nanoparticle a promising candidate for future spintronic devices[26]. The observed band gap reduction and enhanced visible light absorption suggest potential for use as a sensitizer in solar cells[1].
Figure 3 displays the absorbance spectrum of room-temperature Cu2S nanoparticles. The optical behavior of Cu2S nanoparticles was characterized through absorbance data spanning 370-1200nm. The thioglycerol concentration in Cu2S sample is 0.952M. UV-Vis absorption of Cu2S nanoparticles was measured with double distilled water as the reference[1,8]. Figure 3 reveals an absorption peak at 460nm, corresponding to an energy gap of approximately 2.70eV, and thus occurring within the shorter wavelength region of the spectrum. Cu2S, with a narrow band gap of ~1.21eV at room temperature, exhibits a shift in its absorption peak towards shorter wavelengths as the energy gap increases, as shown in Figure 3. The particle size measurement for Cu2S sample yielded a value of 8.59nm.
|
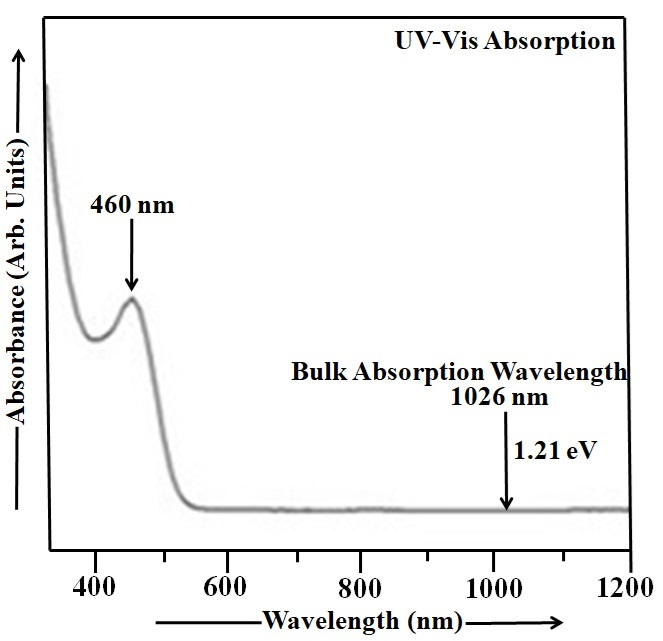
Figure 3. UV-Vis Absorption Spectrum of Cu2S Nanoparticles.
Employing UV-Vis absorption spectroscopy, the optical absorption characteristics of Mn-doped Cu2S nanoparticles were analyzed. The UV-Vis absorption data for the Mn-doped Cu2S nanoparticles, recorded across the 350-1200nm range, are visualized in Figure 4. The thioglycerol concentration in Mn doped Cu2S sample is 0.952M. The molarity of manganese chloride in this sample is 0.035M. UV-Vis absorption spectroscopy was employed to study the Mn-doped Cu2S nanoparticles, using double distilled water as a reference[35]. The absorption peak at 500nm in Mn-doped CdS indicates that the material strongly absorbs light at this wavelength, corresponding to an energy gap of approximately 2.48eV. The bulk Cu2S material absorbs light at 1026nm and has a band gap of 1.21eV. When Mn is doped into Cu2S nanoparticles, the UV-Vis absorption spectrum shifts towards shorter wavelengths (blue shift) as the band gap increases from 1.21eV to 2.48eV. This blue shift is also accompanied by a decrease in the size of the Cu2S nanoparticles as the energy gap increases[35]. The particle size in Cu2S:Mn sample was found to be 10.07nm.
|
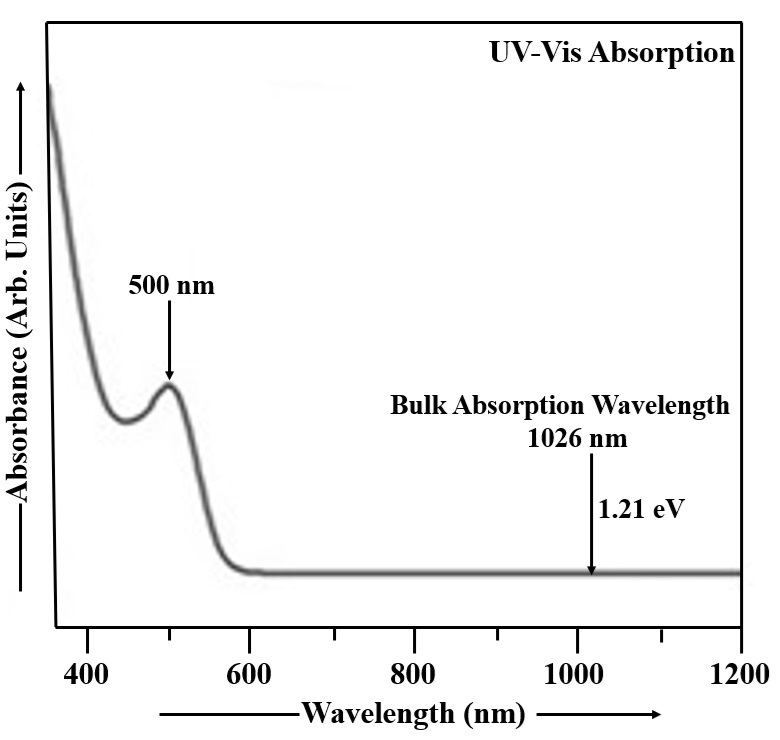
Figure 4. UV-Vis Absorption Spectrum of Cu2S:Mn Nanoparticles.
In UV-Vis absorption spectra, Mn doping leads to a red shift and broadening of the absorption band compared to undoped Cu2S, indicating larger particle sizes in Mn-doped nanoparticles. This is because doping alters the electronic structure and optical properties, leading to the formation of new energy levels and absorption bands within the band gap. Mn-doped Cu2S offers advantages in various applications like optoelectronic devices, photocatalysis, and spintronics, due to enhanced light absorption, improved charge transport, and potential for new functionalities. UV-Vis spectroscopy measures the absorption of light by a material at different wavelengths. The position and shape of absorption bands can provide information about the electronic structure and particle size of the material. Larger nanoparticles generally exhibit red-shifted and broader absorption bands compared to smaller ones. When Mn is doped into Cu2S, it introduces new electronic states within the band gap, which leads to new absorption bands at lower wavelengths (red shift) and broader absorption bands. This indicates an increase in the effective particle size. The red shift and broadening of the absorption bands mean that Mn-doped Cu2S nanoparticles can absorb light in a wider range of the visible spectrum. Mn doping can alter the electrical conductivity and charge transport properties of Cu2S, making it useful for applications like thermoelectric devices and solar cells. The introduction of Mn can lead to new functionalities, such as magnetism and luminescence, making Mn-doped Cu2S suitable for spintronics and optoelectronic applications. Mn-doped Cu2S can be used as a light absorber or active layer in solar cells, LEDs, and other optoelectronic devices. The enhanced light absorption and improved charge transport properties can make Mn-doped Cu2S a more efficient photocatalyst for reactions like water splitting or air purification. Mn's magnetic properties can be used to create new spin-dependent devices and functionalities in spintronic applications[1,8,35,63-67].
Mn doping can decrease CdS nanoparticle sizes by disrupting the crystal lattice due to the different ionic radius of Mn2+ compared to Cd2+, leading to lattice strain and unstable crystal growth, but it can increase Cu₂S nanoparticle sizes because the larger ionic radius of Mn2+ can substitute for Cu+ ions in a way that promotes lattice expansion and more stable, larger crystallites. The ionic radius of Mn²⁺ (0.83Å) is smaller than that of Cd²⁺ (0.95Å). When Mn²⁺ ions substitute for Cd²⁺ in the crystal lattice, they can cause strain and instability in the growing nanoparticle structure. This strain can disrupt the regular growth of the CdS lattice, leading to smaller, less stable crystalline domains and thus a decrease in the overall nanoparticle size. The ionic radius of Mn²⁺ (0.83Å) is larger than that of Cu⁺ (0.77\Å). When larger Mn²⁺ ions substitute for Cu⁺ ions, they cause an expansion of the crystal lattice. This increased lattice spacing can lead to more stable nucleation and growth of larger nanoparticles. The specific crystal structure and bonding of the host semiconductor (CdS or Cu₂S) are crucial. The way the dopant atoms (Mn²⁺) interact with the host lattice and the resulting changes in bonding and strain are key factors. Factors like reaction temperature, precursor concentration, capping agents, and reaction time all play a significant role in determining the final size and stability of the nanoparticle[26,31,55,58,61,68].
Thin-film solar cells use layers of materials that absorb light well and can be flexible, including CdS, Cu2S, CdTe, CIGS, and a-Si. CdS can serve as a buffer layer with its suitable bandgap for light transmission, while Cu2S functions as an absorber layer to convert sunlight into electricity. Thin layers of these materials can be deposited on substrates like glass, plastic, or metal, allowing for flexibility and diverse applications. Thin-film solar cells offer flexibility, allowing for integration into various applications beyond traditional solar panels. Thin-film cells use significantly less material compared to traditional silicon cells, reducing material costs. Thin-film panels can have a shorter energy payback time, meaning they generate the energy used in their manufacturing more quickly. Annealing enhances CdS and Cu₂S film crystallinity, leading to lower band gaps and reduced resistance, which improves photocurrent and power conversion efficiency (PCE). Heat treatment in air is particularly beneficial, as is increasing film thickness, for better photocurrent generation. Impurities, however, can decrease the band gap by forming traps within the forbidden band. Conductivity rises with temperature, and CdS/Cu₂S samples show increased PCE after annealing in air. Prior studies on easily prepared p-n heterojunction cells have demonstrated high efficiencies nearing 15%[1,2,8,26,35,69-77].
The PL spectrum obtained from CdS nanoparticles at room temperature is visualized in Figure 5. Nanoparticles exhibited a significantly higher quantum luminescence efficiency than their bulk counterparts, as evidenced by the room temperature emission and excitation spectra[1,69]. In the CdS sample, the light used to excite the material had wavelengths between 318 and 343nm, and the emitted light had wavelengths ranging from 343 to 700nm. The CdS particles were excited at 328nm and the emission is located at 469nm (energy gap 2.65eV). From Figure 5, it is clearly observed that the PL spectrum of CdS nanoparticles exhibits a blue shift[1,69], meaning the emission peak is observed at shorter wavelength compared to the bulk CdS material.
|
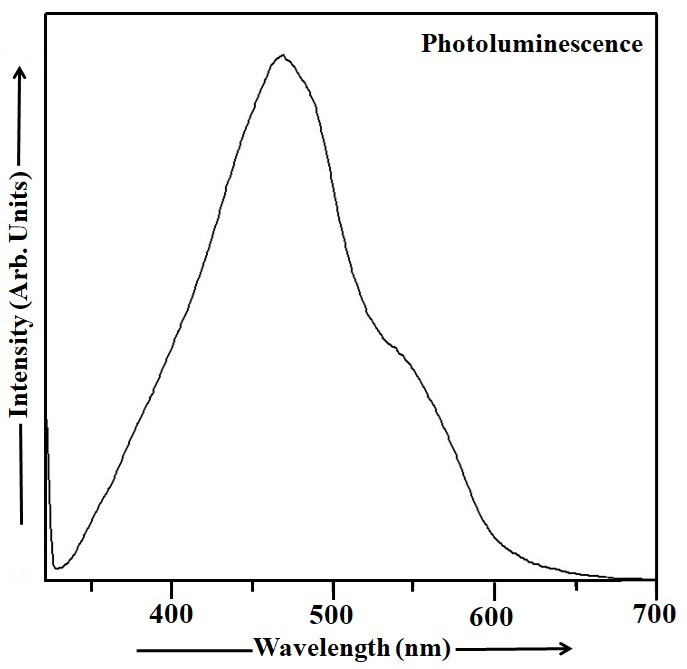
Figure 5. PL Spectrum of CdS Nanoparticles.
The PL spectrum of Mn-doped CdS nanoparticles measured at room temperature is depicted in Figure 6. The appropriate filters were used to record the PL spectrum of CdS:Mn sample from 560 to 626nm in excitation mode and 626 to 840nm in emission mode. The PL spectrum in Figure 6 reveals a peak at 631nm (energy gap ~ 1.97eV), characteristic of the Mn-doped CdS sample. The observed red shift[26] in the PL spectrum of the CdS:Mn sample is apparent in Figure 6.
CdS:Mn nanoparticles exhibit a red shift in their PL spectrum, while undoped CdS nanoparticles show a blue shift. This difference stems from the introduction of manganese ions into the CdS lattice, which alter the energy levels and transitions involved in PL emission. CdS:Mn nanoparticles offer enhanced performance in applications like photocatalysis and optoelectronics compared to their undoped counterparts. Mn²⁺ ions introduce new energy levels within the band gap of CdS, which can interact with the existing CdS energy levels. This interaction, particularly the splitting of Mn²⁺ energy levels, influences the energy of emitted photons and leads to a shift towards lower energy (red shift).
|
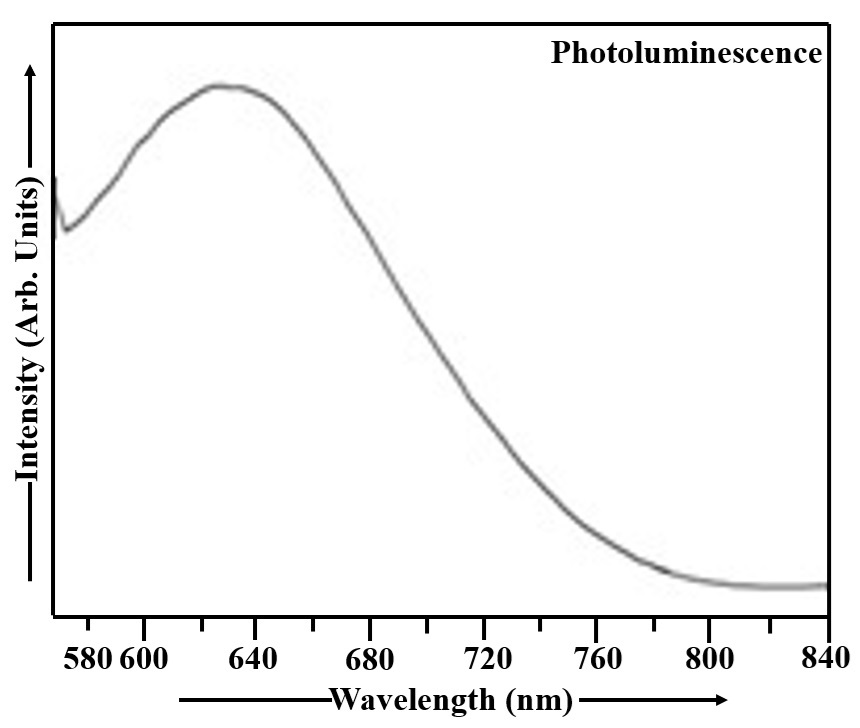
Figure 6. PL Spectrum of CdS:Mn Nanoparticles.
When CdS nanoparticles are excited, the energy can be transferred to the Mn²⁺ ions. The subsequent emission from Mn²⁺ ions results in a characteristic red emission. Doping with Mn can enhance the PL intensity and efficiency of CdS nanoparticles, making them suitable for various applications. In the case of undoped CdS nanoparticles, the quantum confinement effect, where the size of the nanoparticle plays a role in its electronic properties, can lead to a blue shift. Smaller nanoparticles have higher energy levels and emit photons at shorter wavelengths (blue region). Defect states within the CdS lattice can also contribute to emission, and these defects may have different energy levels compared to the ideal band gap, leading to shifts in the PL spectrum. CdS:Mn nanoparticles can exhibit improved photocatalytic activity, including better visible light absorption and charge separation compared to undoped CdS. Mn doping can lead to changes in the optical and electronic properties of CdS, making them suitable for applications like solar cells, LEDs, and photodetectors. The emission characteristics of Mn-doped CdS can be tailored by adjusting the Mn concentration, providing flexibility in their application. Mn doping can enhance the stability of CdS nanoparticles in various environments, making them more durable for long-term use[1,2,26,35,53,57,60,78,79].
Figure 7 shows the PL characteristics of Cu2S nanoparticles measured under room temperature conditions. PL spectra were collected across a range of 348 to 360nm in the excitation domain and 360 to 750nm in the emission domain. Spectral filtering was applied to isolate the desired emission wavelengths. In Cu2S sample, the excitation wavelength of 348nm was used exciting the Cu2S particles and the maximum intensity of the emission peak was observed at 469nm (energy gap 2.65eV). The PL emission spectrum of Cu2S nanoparticles, displayed in Figure 7, exhibits a blue shift.
|
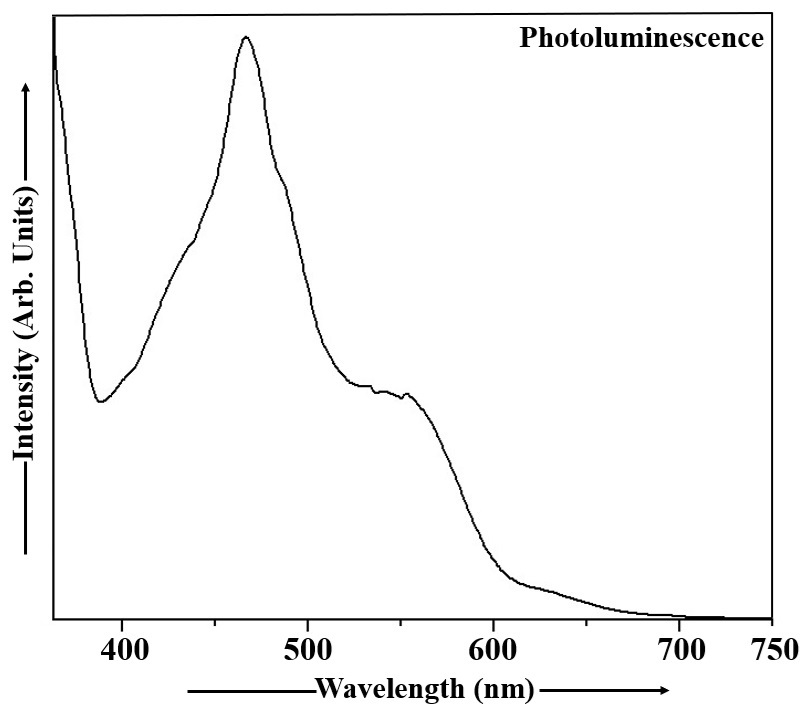
Figure 7. PL Spectrum of Cu2S Nanoparticles.
The PL emission spectrum of Mn doped Cu2S nanoparticles, obtained at room temperature, is depicted in Figure 8. This PL spectrum was acquired with excitation ranging from 342 to 367nm and emission spanning 367 to 750nm, employing suitable optical filters. The Cu2S:Mn nanoparticles were excited at 352nm and the PL peak was observed at 471nm (energy gap ~ 2.63eV). Analysis of the PL emission spectrum of Cu2S:Mn nanocrystals in Figure 8 reveals the presence of a blue shift.
|
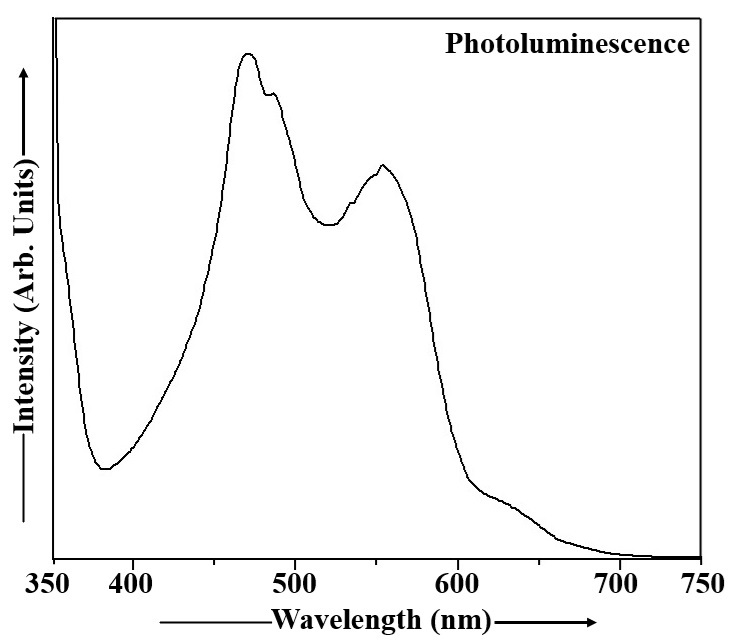
Figure 8. PL Spectrum of Cu2S:Mn Nanoparticles.
Both undoped and Cu2S:Mn nanoparticles exhibit a blue shift in their PL spectra, but Mn doping offers advantages in applications. The blue shift in both cases is primarily due to quantum confinement effects caused by the small size of the nanoparticles. Mn doping introduces localized energy levels within the band gap of Cu2S, leading to a distinct emission peak from the Mn2+ ion. This allows for a tunable emission spectrum and enhanced PL intensity in Mn-doped samples, making them more versatile for applications like optoelectronics and photocatalysis. The blue shift in undoped Cu2S nanoparticles is a consequence of quantum confinement. As the size of the nanoparticles decreases, the energy levels of the electrons and holes become quantized, leading to an increase in the bandgap energy and a shift towards shorter wavelengths (blue) in the PL spectrum. While quantum confinement still plays a role, the presence of Mn2+ ions introduces localized energy levels within the Cu2S band gap. These Mn2+ levels can absorb light energy and emit light at specific wavelengths, contributing to the observed PL spectrum. The blue shift in this case can be attributed to a combination of the quantum confinement effect and the energy levels associated with the Mn dopant. Mn doping allows for control over the emission wavelength, as the PL spectrum is influenced by both the quantum confinement of Cu2S and the emission from the Mn2+ ions. The Mn2+ ions can act as efficient light emitters, leading to increased PL intensity in Mn-doped samples compared to undoped Cu2S The unique PL properties of Mn-doped Cu2S make them suitable for various applications, such as: Photocatalysis: The enhanced PL and tunable emission can improve the photocatalytic efficiency of Cu2S. Optoelectronics: The controllable emission spectrum allows for use in light-emitting devices and other optoelectronic applications. Biomedical Applications: The PL properties can be used for bioimaging and other biomedical applications. In summary, while both undoped and Cu2S:Mn nanoparticles exhibit a blue shift due to quantum confinement, Mn doping introduces localized energy levels that enhance PL intensity and enable a wider range of applications[1,8,35,63,64,66,67,80].
Doping CdS with Mn can enhance optoelectronic properties and improve performance in thin-film applications like solar cells. Mn-doped CdS and Cu2S are promising for thin-film solar cells, which rely on light-induced electricity generation through the photovoltaic effect. These lightweight and flexible cells are ideal for applications like building-integrated photovoltaics and portable electronics[1,3,56,81,82].
Mn doped CdS devices have shown significant improvements in PCE compared to undoped CdS. Doping can create better interfaces between the CdS and other layers, such as P3HT:PCBM, leading to more efficient charge separation. Doping can alter the optical band gap, which affects the absorption of light in the visible region. Mn-doped CdS thin films can exhibit superior visible light photodetection with high photoresponse parameters. Mn-doped CdS functions effectively as a buffer layer, playing a crucial role in the device's overall performance. Doping enhances the efficiency of hybrid solar cells by optimizing the junction between the CdS:Mn and the organic active layer. Mn-doped CdS quantum dots have demonstrated significantly higher efficiencies as sensitizing layers in solar cells. Electricity generation is dependent on the photovoltaic process, where light initiates the flow of current. Thin-film solar cells are inherently lightweight and flexible, making them suitable for specialized applications. Diverse applications are well-suited for: (1) Building-Integrated Photovoltaics (BIPV): Integration into building exteriors for energy generation. (2) Flexible Solar Panels: Applications requiring adaptability to curved surfaces. (3) Portable Electronics: Providing power for devices where lightweight design is critical[83].
To evaluate the potential of Mn-doped CdS and Cu₂S thin films for improving solar cells, it's necessary to analyze their electrical and optical properties under dark and illuminated conditions, as doping with Mn affects the CdS crystal structure, band gap, light transmission, and morphology, while also improving the P3HT:PCBM interface and overall PCE. Mn doping can alter the growth orientation and crystal structure of CdS films, with the amount of Mn²⁺ cations influencing these changes. As Mn concentration increases, the band gap of CdS can increase, likely due to structural disorder or defect formation. Mn doping tends to increase light transmission in CdS thin films. PL studies show that Mn can affect recombination processes, with high concentrations potentially leading to non-radiative recombination. Mn doping can change the electrical conductivity of CdS films. Mn can influence the surface morphology of CdS films, potentially changing their shape from spherical to scale-like structures. Studies show that Mn doping improves the photovoltaic characteristics of CdS-based devices, leading to increased PCE. Mn doping enhances the interface between CdS:Mn and other materials like P3HT:PCBM, promoting better exciton dissociation and charge transfer. The improved connection created by Mn doping allows for more efficient separation of electron-hole pairs (excitons) and their subsequent transfer for power generation. In summary, a comprehensive examination of these properties is crucial to determine the extent to which Mn-doped CdS and Cu₂S films can enhance the performance and efficiency of thin-film solar cells[84,85].
Tauc plots provide a standardized method to qualitatively and numerically determine the optical bandgap of semiconductors from UV-Vis absorption spectra, offering a clearer value than directly observing the absorption edge. While widely used, the accuracy of Tauc plots depends on baseline correction and the proper choice of exponent (1/r) based on the material's transition type, which requires quantitative analysis and reproducible error estimations for reliable, qualitative interpretation of spectra and materials. The Tauc plot transforms raw absorption data into a format that allows for the estimation of the bandgap energy (Eg) by extrapolating a linear region to the photon energy (hν) axis. It provides a well-defined numerical value for the bandgap, which serves as a crucial qualitative indicator of a material's electronic band structure and its potential for optical applications. It bridges the gap between a qualitative visual inspection of an absorption spectrum and a quantitative determination of a specific material property. It is essential for characterizing semiconductor materials, including amorphous and crystalline forms, by providing a consistent method to assess their optical properties. While UV-Vis absorption is the primary application, the underlying concept of optical transitions is also relevant to understanding PL spectra. A common issue is a significant background absorption below the expected bandgap, which can lead to significant errors in the calculated bandgap. Therefore, idealizing the absorption spectrum by removing this baseline is a necessary quantitative step for accurate determination. The Tauc plot uses an exponent 'r' that depends on the nature of the electronic transition (direct or indirect, allowed or forbidden).
r=1/2 for direct allowed transitions
r=3/2 for direct forbidden transitions
r=2 for indirect allowed transitions
r=3 for indirect forbidden transition
There are different approaches to extrapolating the linear region of the Tauc plot, and consistency in this method is crucial for reproducibility. To ensure reproducibility and reliable reporting, a careful quantitative analysis that includes:
Identification and removal of baseline absorption.
Selection of the correct transition type.
A well-defined method for linear region selection and extrapolation.
Appropriate documentation of the experimental conditions and analysis parameters is necessary[86-89].
The sample's elemental composition was investigated using a combination of EDAX and elemental mapping techniques[1,2]. The EDAX data for the dip-coated CdS thin film is presented in Figure 9. The atomic percentages of S, O, Pb, Cd, C, Pt, Sn, Na, and other elements in CdS sample, as determined by stoichiometric analysis, are summarized in Table 1. The presence of other elements like carbon, oxygen, and tin is a characteristic of the FTO glass substrate. Platinum is present in the EDAX spectrum because it is a component of the FTO substrate, acting as the underlying layer on which the Mn-doped CdS thin film is deposited. EDAX detects all elements present in the film and its substrate, so peaks for platinum from the FTO layer are expected and are normal to observe. Sodium sulfide was employed as the sodium precursor in the synthesis of CdS and Cu₂S nanoparticles, resulting in sodium detection via EDAX analysis. Table 1 provides the data needed to calculate the Cd:S ratio in the dip-coated CdS thin film. For the CdS sample, the Cd:S ratio is 1.02, indicating a minor deviation from the stoichiometric value of 1. The Cd:S ratio exhibits a substantial increase as the dip time lengthens, resulting in a Cd-rich CdS phase and a thin film that is nearly ideally stoichiometric. The ratio of cadmium (Cd) to sulfur (S) in the CdS sample increases with a longer dip time. This means that for longer dip times, the CdS sample has more cadmium relative to sulfur.
|
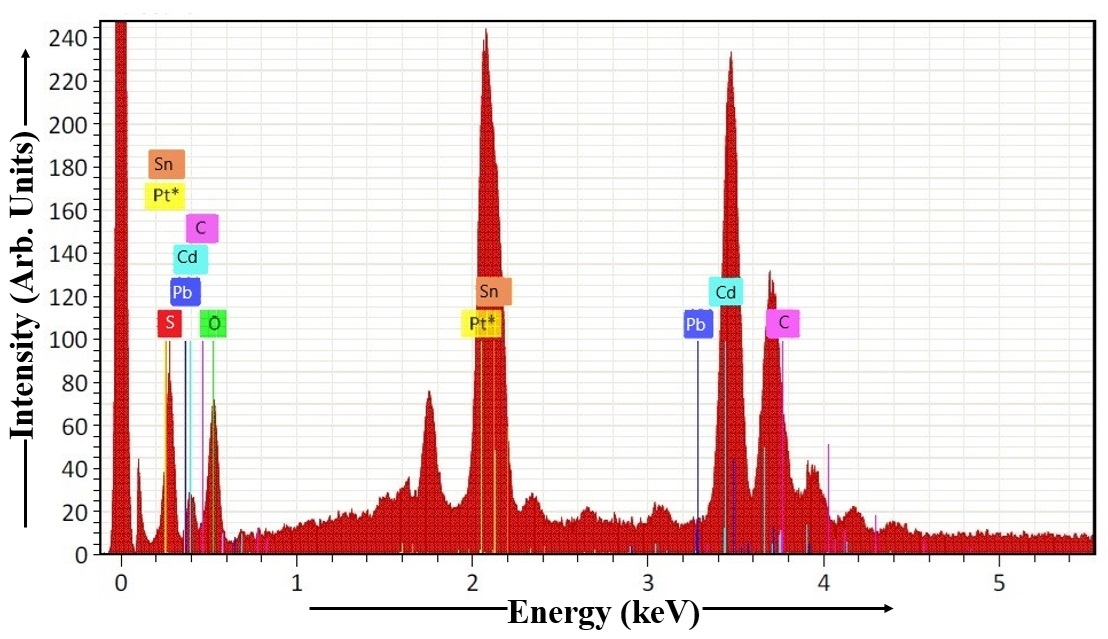
Figure 9. EDAX Spectrum of CdS Thin Film.
Table 1. EDAX of CdS Thin Film
Element |
At. No. |
Netto. |
Mass [%] |
Mass Norm [%] |
Atom [%] |
abs. error [%] (1 sigma) |
rel. error [%] (1 sigma) |
Sulphur |
16 |
3737 |
6.11 |
4.46 |
31.61 |
1.03 |
16.95 |
Oxygen |
8 |
3622 |
6.06 |
4.43 |
13.09 |
1.03 |
17.06 |
Lead |
82 |
4169 |
7.65 |
5.60 |
3.36 |
0.32 |
4.15 |
Cadmium |
48 |
37576 |
76.19 |
55.72 |
32.34 |
2.59 |
3.40 |
Carbon |
6 |
8358 |
20.91 |
15.29 |
8.26 |
0.78 |
3.72 |
Platinum |
78 |
24058 |
0.00 |
0.00 |
0.00 |
0.00 |
1.78 |
Tin |
50 |
10979 |
15.75 |
11.52 |
4.03 |
0.64 |
4.10 |
Sodium |
11 |
4496 |
4.07 |
2.98 |
7.30 |
0.21 |
5.17 |
Sum |
|
|
136.74 |
100.00 |
100.00 |
|
|
The EDAX spectrum, obtained from the Mn-doped CdS thin film deposited via dip coating, is visualized in Figure 10. Table 2 shows the stoichiometric atomic percentages of O, Cd, Cl, Mn, S, Na, C, and other elements in CdS:Mn sample. FTO glass substrate is composed of tin oxide, fluorine, and other elements like carbon and oxygen. For calculating the Cd:S ratio in the dip-coated CdS:Mn thin film, the data from Table 2 is essential. Analysis of the CdS:Mn sample reveals a cadmium to sulfur ratio of 1.00. The result demonstrates that the Cd and S atoms are present in a 1:1 ratio, resulting in a perfect stoichiometry within the CdS thin film.
|
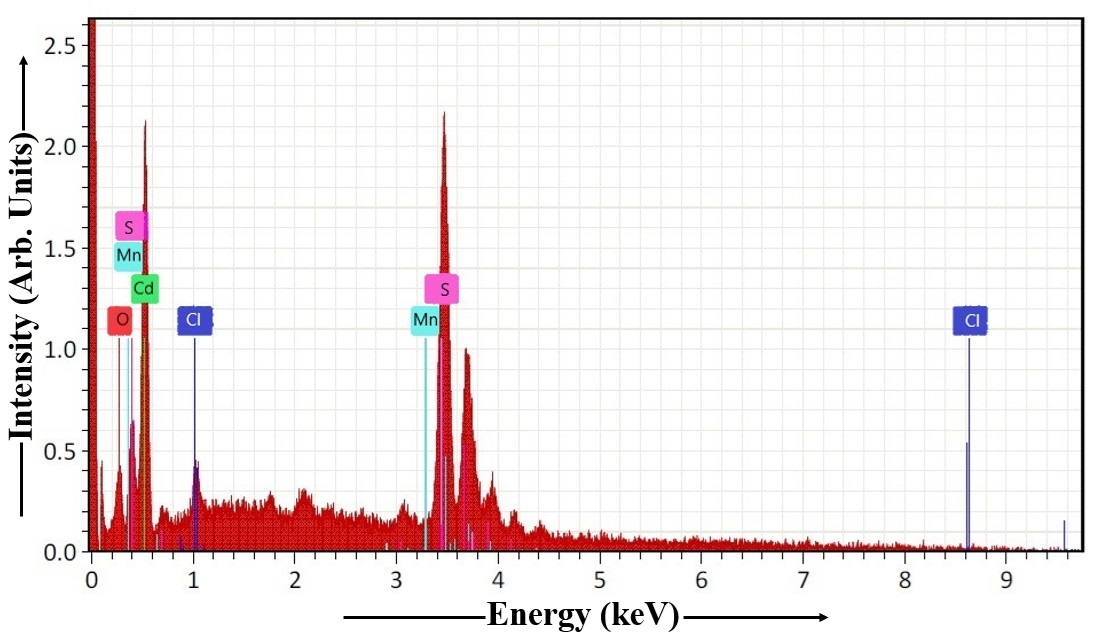
Figure 10. EDAX Spectrum of CdS:Mn Thin Film.
Mn-doped CdS thin films offer several advantages over undoped CdS thin films in various applications, primarily due to the ability to tailor their properties by controlling the doping concentration and achieving perfect stoichiometry. This allows for precise modulation of electrical, optical, and structural characteristics, leading to improved performance in devices like solar cells and other optoelectronic applications. Mn doping can modify the electrical conductivity, band gap energy, and optical absorption of CdS, enabling optimization for specific applications. In solar cells, for example, Mn doping can improve charge transport and reduce recombination, leading to higher efficiency and power output. Mn-doped CdS can be used in various optoelectronic devices, including photodetectors, sensors, and LEDs, due to its tunable optical and electronic properties. Achieving a perfect or near-perfect stoichiometry (the correct ratio of Cd and S atoms) is crucial for the material's performance. Mn doping can help maintain or restore stoichiometry, especially when dealing with non-stoichiometric conditions in the original CdS film. This ensures consistent and reliable performance of the material. By incorporating Mn, it can help to reduce the number of defects in the CdS lattice, improving its overall quality and stability. Mn doping can enhance the photocatalytic activity of CdS, making it more efficient at degrading pollutants in wastewater or other applications. Mn doping offers a precise way to manipulate the electrical, optical, and structural properties of CdS, allowing for optimization for specific applications. In solar cells, for example, Mn doping can significantly improve charge separation and transport, leading to higher efficiency compared to undoped CdS. By reducing defects and controlling stoichiometry, Mn doping can improve the overall performance and stability of CdS thin films in various applications. The tunable properties of Mn-doped CdS make it suitable for a wide range of optoelectronic devices and other applications[1,2,26,54,90-92].
Table 2. EDAX of CdS:Mn Thin Film
Element |
At. No. |
Netto. |
Mass [%] |
Mass Norm [%] |
Atom [%] |
abs. error [%] (1 sigma) |
rel. error [%] (1 sigma) |
Oxygen |
8 |
484 |
1.18 |
1.25 |
8.31 |
0.36 |
30.31 |
Cadmium |
48 |
5873 |
17.29 |
18.40 |
35.74 |
2.66 |
15.36 |
Chlorine |
17 |
365 |
0.98 |
1.04 |
2.81 |
0.12 |
12.25 |
Manganese |
25 |
2161 |
6.48 |
6.89 |
5.86 |
0.30 |
4.62 |
Sulphur |
16 |
16743 |
56.37 |
59.98 |
35.59 |
1.97 |
3.49 |
Sodium |
11 |
497 |
0.79 |
0.84 |
4.06 |
0.09 |
11.95 |
Carbon |
6 |
2567 |
10.90 |
11.60 |
7.63 |
0.48 |
4.36 |
Sum |
|
|
93.99 |
100.00 |
100.00 |
|
|
Figure 11 illustrates the EDAX analysis of the Cu2S thin film fabricated via the dip coating technique. Stoichiometric atomic percentages for the elements Cu, C, O, Na, Pt, S, and others present in Cu2S sample are presented in Table 3. FTO glass substrate contains carbon, and oxygen, as key components. Table 3 contains the information necessary to determine the Cu:S stoichiometry of the dip-coated Cu2S thin film. For the Mn-doped Cu2S sample, the molar ratio of cadmium to sulfur is 2.02. With longer dip times, the Cu:S ratio increases, indicating a Cu-rich Cu2S composition, suggesting the Cu2S thin film stoichiometry is close to the theoretical Cu2S composition.
|
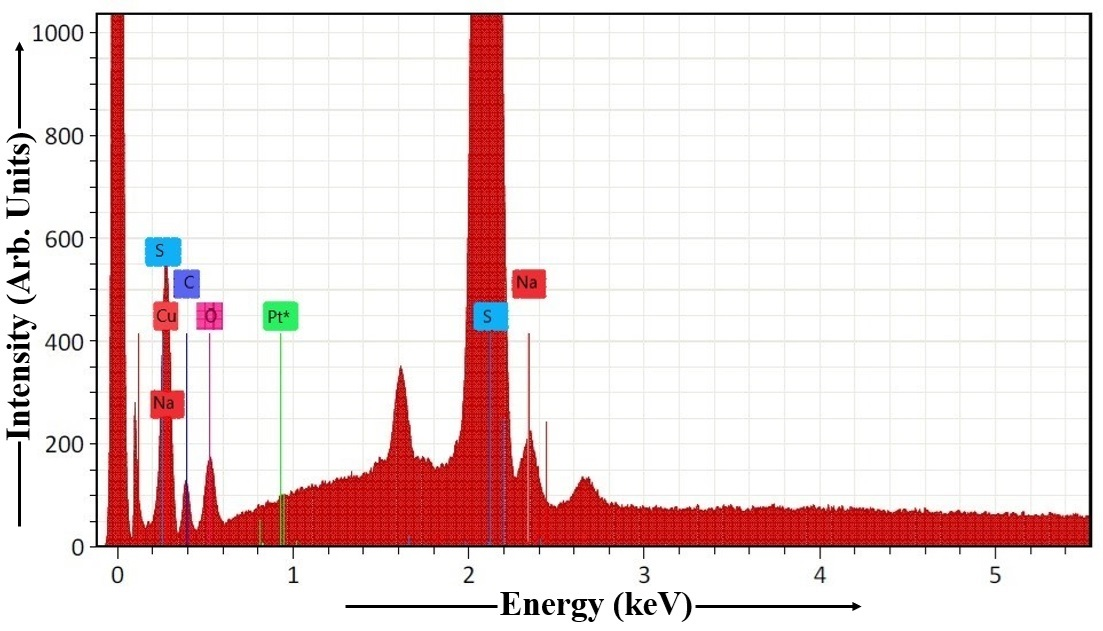
Figure 11. EDAX Spectrum of Cu2S Thin Film.
Table 3. EDAX of Cu2S Thin Film
Element |
At. No. |
Netto. |
Mass [%] |
Mass Norm [%] |
Atom [%] |
abs. error [%] (1 sigma) |
rel. error [%] (1 sigma) |
Copper |
29 |
24786 |
5.76 |
10.70 |
51.64 |
0.75 |
12.97 |
Carbon |
6 |
4849 |
1.75 |
3.25 |
11.47 |
0.30 |
17.17 |
Oxygen |
8 |
7768 |
1.56 |
2.91 |
8.51 |
0.25 |
16.14 |
Sodium |
11 |
8628 |
3.01 |
5.59 |
2.82 |
0.14 |
4.66 |
Platinum |
78 |
372461 |
0.00 |
0.00 |
0.00 |
0.00 |
1.78 |
Sulphur |
16 |
166173 |
41.74 |
77.55 |
25.56 |
1.58 |
3.80 |
Sum |
|
|
53.82 |
100.00 |
100.00 |
|
|
EDAX characterization of the dip-coated Mn-doped Cu2S thin film is shown in Figure 12. Table 4 contains the atomic percentage composition of Cu2S:Mn sample, including C, Cu, Mn, S, Cl, Pt, O, and other elements. FTO glass substrate is a transparent conductive oxide (TCO) made of tin oxide (SnO2), fluorine (F), and possibly other elements like carbon and oxygen. FTO glass is as a TCO substrate composed of fluorine-doped tin oxide (SnO2:F). This clarifies the material's composition and purpose as a conductive material that allows light to pass through. This TCO serves as a substrate, often used in optoelectronic devices like solar cells and displays. Using the data presented in Table 4, the Cu:S ratio of the dip-coated Cu2S:Mn thin film can be derived. The Mn-doped Cu2S sample's stoichiometry indicates a 2.00 Cu:S ratio. The analysis indicates that the Cu:S ratio is perfectly balanced, confirming a stoichiometric composition of the Cu2S:Mn thin film.
|
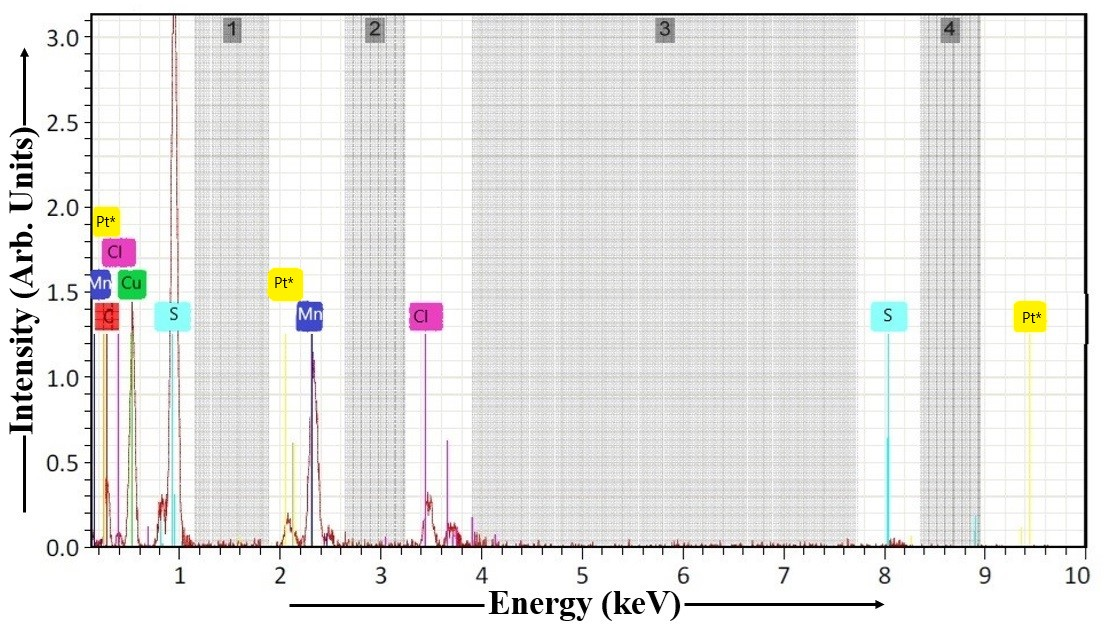
Figure 12. EDAX Spectrum of Cu2S:Mn Thin Film.
Table 4. EDAX of Cu2S:Mn Thin Film
Element |
At. No. |
Netto. |
Mass [%] |
Mass Norm [%] |
Atom [%] |
abs. error [%] (1 sigma) |
rel. error [%] (1 sigma) |
Carbon |
6 |
325 |
4.31 |
4.25 |
14.32 |
1.41 |
32.78 |
Copper |
29 |
2173 |
15.05 |
14.83 |
37.56 |
2.82 |
18.75 |
Manganese |
25 |
2160 |
7.58 |
7.47 |
11.44 |
0.37 |
4.83 |
Sulphur |
16 |
7090 |
51.75 |
51.00 |
18.78 |
7.66 |
14.80 |
Chlorine |
17 |
1352 |
12.43 |
12.25 |
9.18 |
0.61 |
4.88 |
Platinum |
78 |
562 |
0.00 |
0.00 |
0.00 |
0.00 |
1.78 |
Oxygen |
8 |
1423 |
10.34 |
10.20 |
8.72 |
0.53 |
5.12 |
Sum |
|
|
101.46 |
100.00 |
100.00 |
|
|
The XRD pattern in Figure 13 characterized CdS nanoparticles for the 0° to 80° 2θ range, confirming their cubic sphalerite-type structure and assessing their crystallinity and particle size using the Debye-Scherrer formula. The estimated average particle size was 4.20nm, with the broad nature of the diffraction peaks at 2θ=27.820° ({111} plane) and 2θ=47.580° ({220} plane) further supporting the presence of these nanoparticles. The calculated lattice strain (8.604×10⁻³m) and dislocation density (6.027×10¹⁶lines/m²) provided insights into the internal structural properties of the synthesized CdS material. Analysis using the Debye function[93] confirmed that the synthesized CdS material exhibited a cubic sphalerite-type crystal structure. The observed broad diffraction peaks, particularly at 2θ=27.820° and 2θ=47.580°, are characteristic of nanoparticles and indicate their crystalline nature. The average particle size of the CdS nanoparticles was determined using the Debye-Scherrer formula:
d'=(0.9 λ) / (β cos θ) (1)
This analysis yielded an average particle size of 4.20nm for the CdS nanoparticles. Lattice strain was calculated using the formula:
ε=β cos θ / 4 (2)
For the CdS nanoparticles, the strain was found to be 8.604 x 10⁻³m. The dislocation density was estimated using the formula:
δ=1 / d'². (3)
|
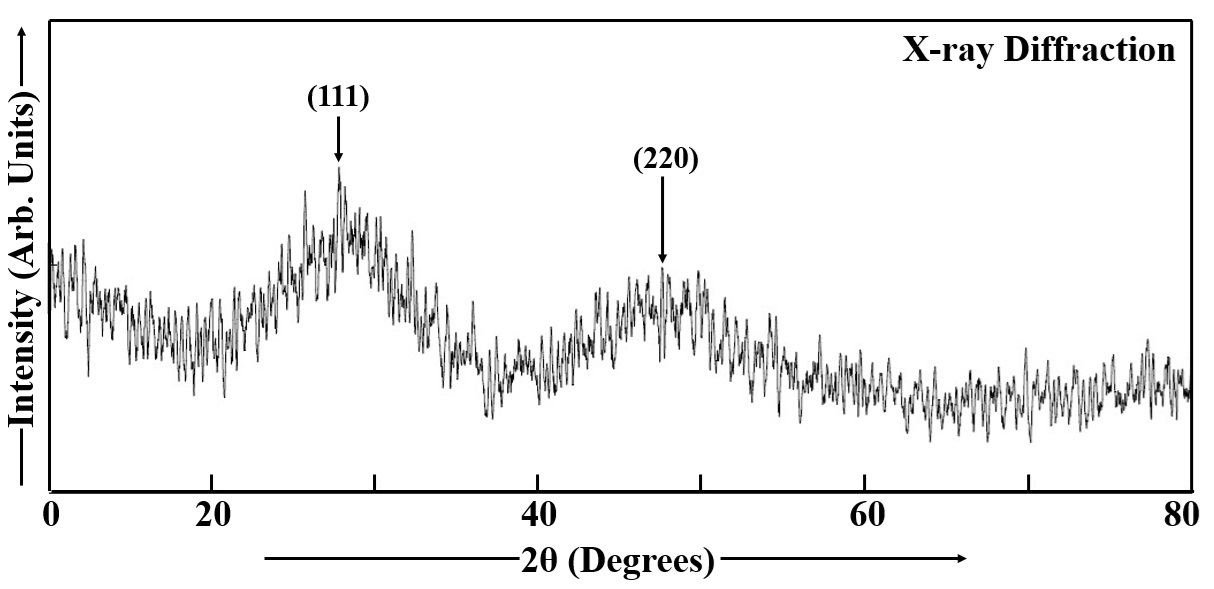
Figure 13. XRD Spectrum of CdS Thin Film.
The calculated dislocation density was 6.027×10¹⁶lines/m². The first broad peak observed at 2θ=27.820° was identified as the {111} lattice plane, which corresponds to a d-spacing of 3.2042 Å. The second broad peak at 2θ=47.580° was associated with the {220} lattice plane, with a d-spacing of 1.9095 Å[1,2,8,26,35,69,84,94]. The wide diffraction features observed in the XRD spectrum suggest the formation of small crystalline domains, characteristic of a nanostructured material like CdS nanoparticles[3].
XRD patterns of Mn-doped CdS thin films are presented in Figure 14, covering a 2θ range from 0° to 80°. Two broad XRD peaks are observed at 2θ=28.260° and 2θ=48.260°. These peaks correspond to the {111} and {220} reflections of CdS, which possesses a zinc blende structure, with d-spacings of 3.1553 and 1.8842 Å, respectively. The broad nature of these diffraction peaks indicates the nanocrystalline character of the CdS:Mn thin film. The peak positions observed in the XRD patterns of the Mn-doped CdS thin films are consistent with standard JCPDS data for CdS, confirming the successful synthesis and expected crystalline structures. The crystallite sizes (d′) in the Mn-doped CdS thin films were determined using the
|
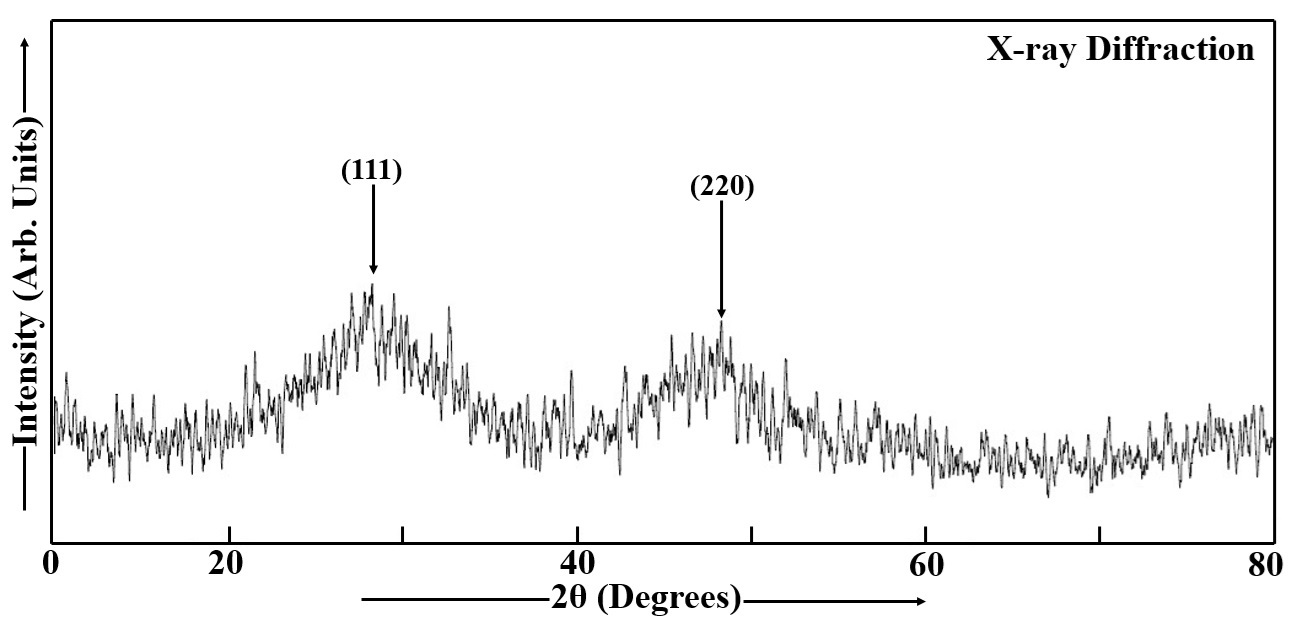
Figure 14. XRD Spectrum of Mn doped CdS Thin Film.
Debye-Scherrer formula, given in Equation (1)[74,95,96]. The average particle size of Mn-doped CdS nanoparticles was found to be 4.82nm, and the microstrain (𝜀) and dislocation density (𝛿) of Mn-doped CdS thin films were estimated using two specific formulas (Equations 2 and 3). The values of ɛ and δ of Mn doped CdS thin film are 8.62×10⁻³m and 6.065×10¹⁶ lines/m2. Mn-doped CdS films exhibit a trend of reduced strain, defect concentration, and bandgap energy with increasing dip time, film thickness, and grain size, with no change in their crystal structure or phase irrespective of thickness[85,95,97,98].
The XRD pattern of a Cu2S film is presented in Figure 15. Cu2S nanoparticles are characterized by an average particle size of 89.66nm in diameter. The values of strain (𝜀) and dislocation density (𝛿) for these nanoparticles are determined to be 4.188×10⁻⁴m and 1.456×10¹⁴lines/m2, respectively. High-intensity diffraction peaks are observed at 2θ=31.820°, 2θ=31.900°, 2θ=40.120°, and 2θ=45.580° in larger Cu2S particles, which are associated with a lower concentration of thioglycerol. These peaks correspond to specific lattice planes: the first peak to {103} with a d-spacing of 2.8099Å, the second peak to {006} with a d-spacing of 2.8031 Å, the third peak to {105} with a d-spacing of 2.2457Å, and the fourth peak to {112} with a d-spacing of 1.9886Å.
|
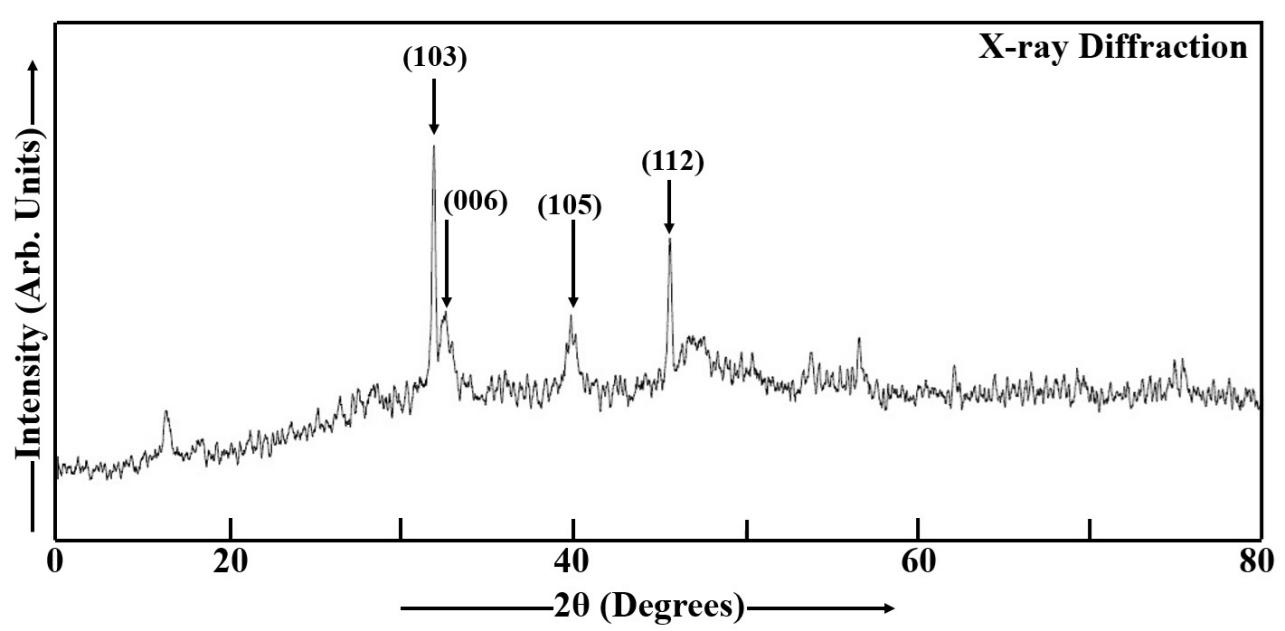
Figure 15. XRD Spectrum of Cu2S Thin Film.
An increase in dip time or film thickness is observed to enhance the intensity of the diffraction peaks. The analysis of the powder XRD using the Debye function indicates that the synthesized Cu2S material consists of hexagonal-wurtzite type nanoparticles. Diffraction patterns were recorded over a range of 0° to 80° for the Cu2S nanoparticles. The internal crystal structure is determined from these XRD experiments[98]. The XRD peaks of Cu2S nanoparticles are consistent with the data reported in the JCPDS (Joint Committee on Powder Diffraction Standards) for Cu2S. The XRD analysis of Cu2S films reveals their polycrystalline nature. In Cu2S films, the strain and dislocation density are observed to decrease with increasing dip time or film thickness, which is attributed to an increase in grain size. The phase and crystalline structure of the films are found to be independent of the film thickness. A decrease in the band gap is also observed with increasing film thickness.
The XRD spectrum (Figure 16) served to validate the crystal structure and assess the phase purity of the Mn-doped Cu₂S nanoparticles using the spectral range 0° to 80°. The mean crystallite size (d’) of these nanoparticles, calculated using the Debye-Scherrer formula (Equation 1), was found to be 96.88nm[96,99]. Narrow XRD (XRD) peaks were observed at 2θ=31.680°, 2𝜃=32.100°, 2θ=39.720°, and 2𝜃=45.420° in large Mn-doped Cu2S nanoparticles. These peaks were indexed to the (103), (006), (105), and (112) lattice planes, respectively. The observed lattice planes were found to be consistent with the reported data for standard JCPDS Cu2S. The polycrystalline nature of the Mn-doped Cu2S sample was confirmed by the XRD analysis. Peak intensity was observed to increase with film thickness or dip time, and microstrain (ε) and dislocation density (δ) were calculated using relevant formulas (Equations 2 and 3). The Mn-doped Cu2S sample exhibited an 𝜀 value of 22.27×10⁻³ m and a 𝛿 value of 12.03×10¹³ lines/m2. Microstrain quantifies average internal lattice strain, or the bending and distortion of lattice planes, while dislocation density counts crystal defects (dislocations) per unit volume[1,2,8,35,84,100-107]. Higher microstrain and dislocation density indicate a more imperfect, distorted crystal structure with reduced structural integrity[26]. These imperfections arise from factors like dopant atom size differences that cause local strain, making the material less stable. Lower values of both suggest a well-ordered structure, while higher values imply increased instability, often a result of the doping process itself. Despite the imperfections, the nanoparticles maintained a recognizable hexagonal-wurtzite structure as confirmed by the Debye function analysis[1,2,8,35,84].
|
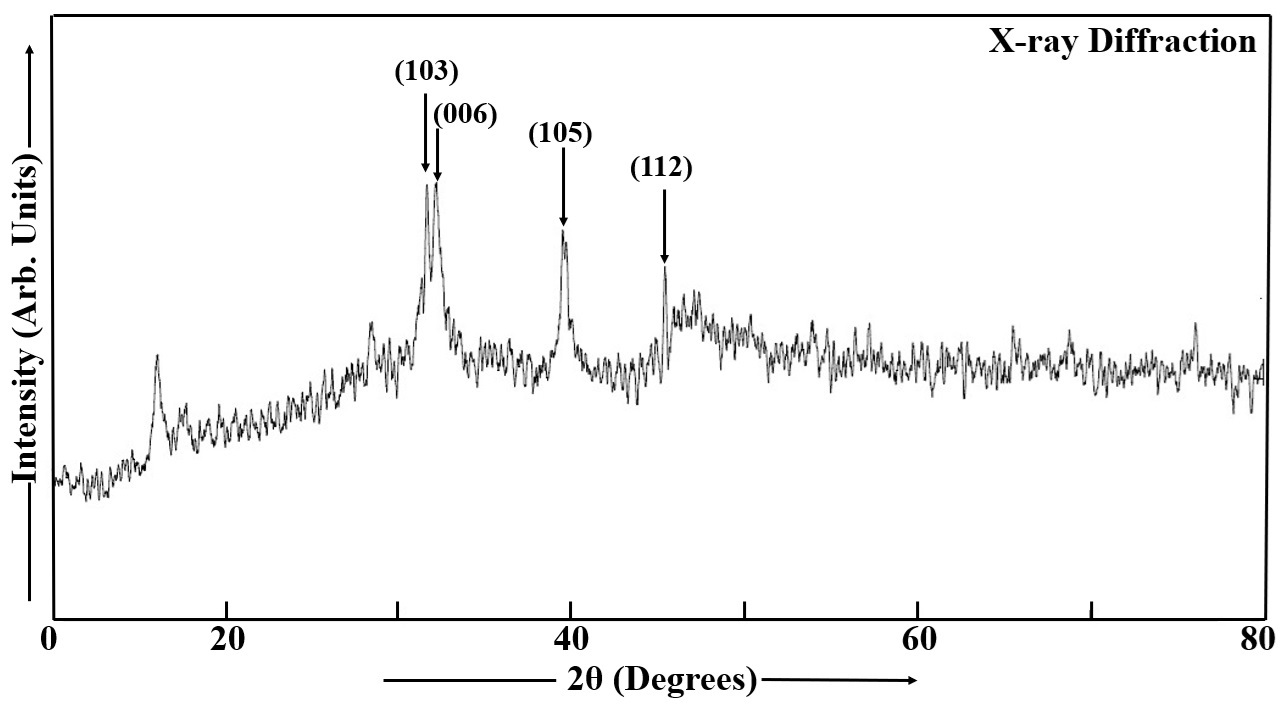
Figure 16. XRD Spectrum of Mn Doped Cu2S Thin Film.
Figure 17 displays the microstructural features of the CdS thin film, with the SEM image illustrating the shape and dimensions of the CdS particles. SEM analysis verified the film's consistent structure and surface texture, with the electron beam's scanning revealing the CdS particles' size and shape. Increased dip time causes complete FTO coverage by CdS nanoparticles, evidenced by the denser, more granular structure in SEM images. The surface of the CdS film showed a pattern of micron-sized, coalesced features, each containing numerous smaller grains on the order of tens of nanometers. This indicates that the surface morphology is dependent on the dip time[98]. Annealing in air promotes grain growth, resulting in CdS films with crystallite sizes between 33 and 172nm. The cylindrical grains are present in the CdS film[108].
‘’ |
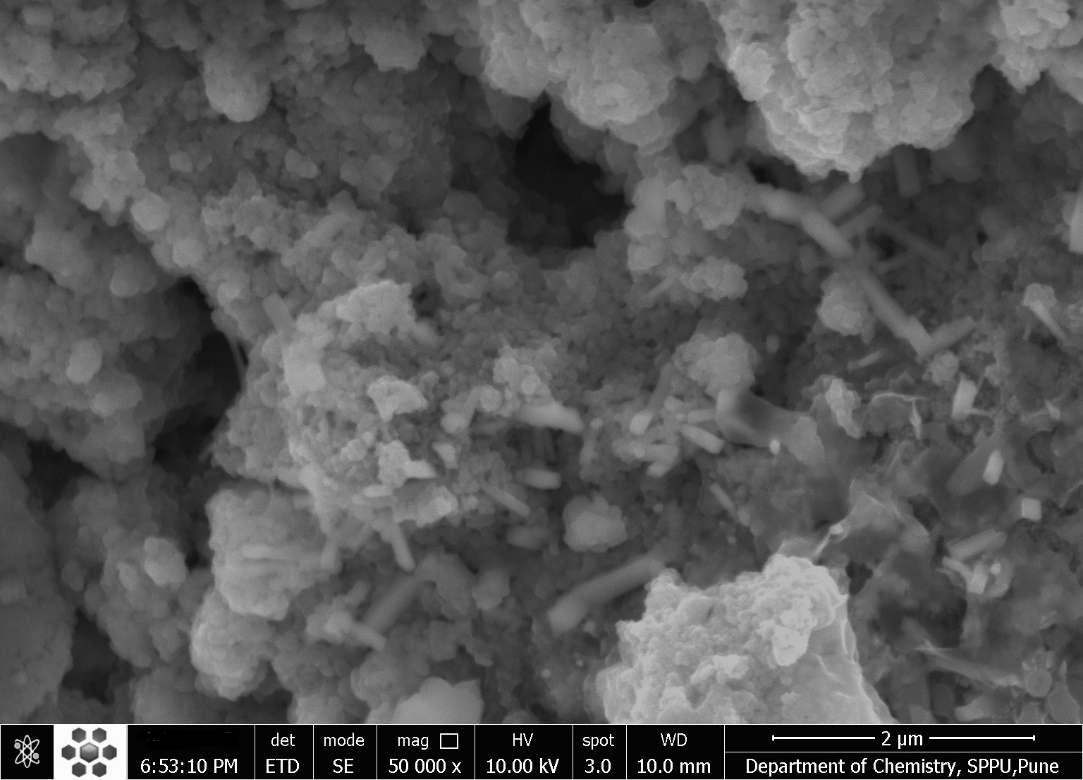
Figure 17. SEM Image of CdS Thin Film with Magnification of 50,000. (Scale bar: 2μm)
From the SEM micrograph in Figure 18, the Mn doped CdS film's particle morphology and size distribution can be analyzed. After heat treatment at 420°C for 20 minutes in air, the Mn-doped CdS thin film developed a polycrystalline structure, with large cylindrical grains (46-226nm). Heat treatment and increased dip time led to larger grains and reduced film uniformity, while also improving crystal perfection by minimizing defects. Conversely, higher manganese content resulted in smaller, refined grain[1,2,8,35,84].
|
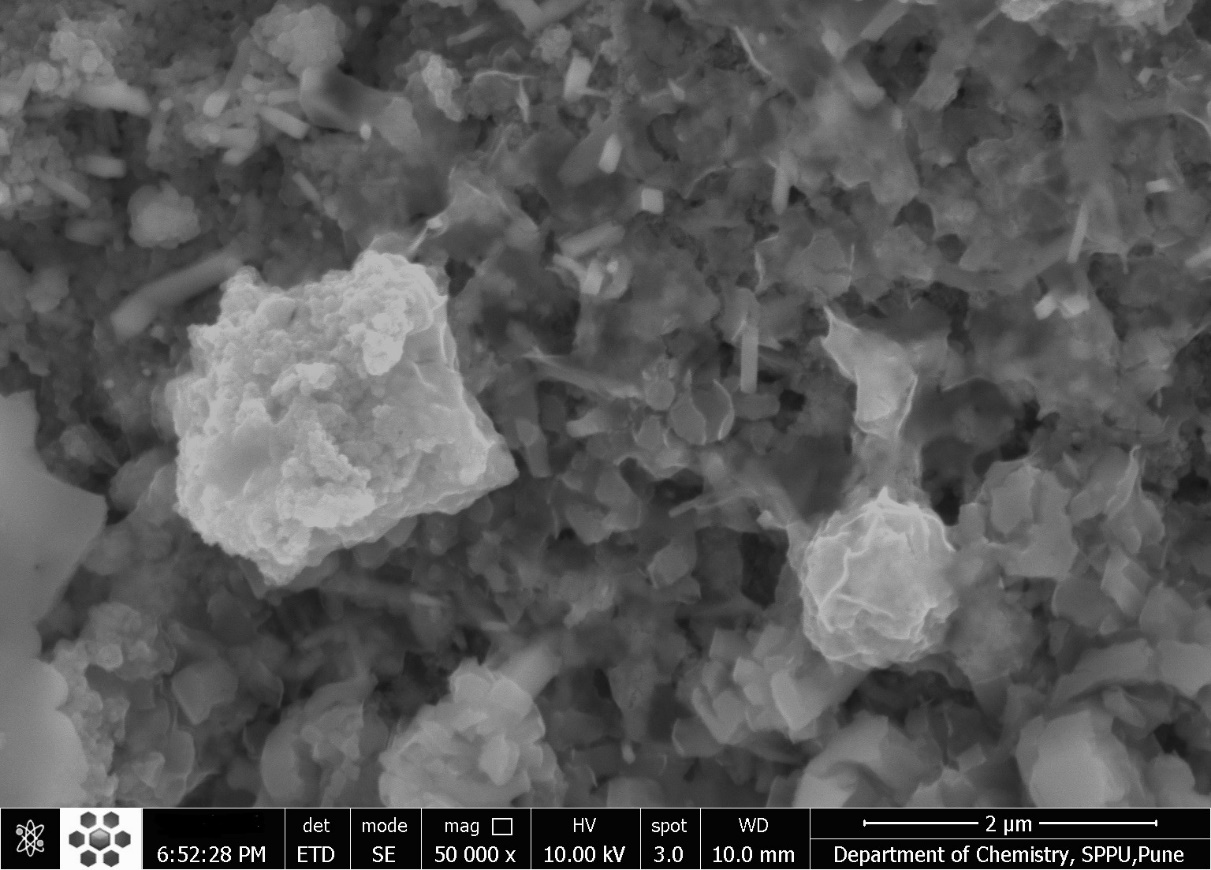
Figure 18. SEM Image of Mn Doped CdS Thin Film with Magnification of 50,000. (Scale bar: 2μm)
Figure 19 presents the SEM image of the Cu2S thin film, revealing the morphology and size distribution of the constituent particles. The initial Cu₂S film analysis reveals a nanostructured material with micron-sized agglomerations of smaller, tens-of-nanometer grains. After heat treatment in an air atmosphere, the film's surface morphology changes, showing larger grains (46-307nm) and reduced defects, leading to enhanced crystallinity. These findings suggest that while the material is nanostructured, the heat treatment process promotes grain growth and coalescence through the coagulation of polycrystalline nanoparticles, resulting in larger average particle sizes observed via SEM compared to XRD, and ultimately improving the film's crystallinity and optical properties[1,2,8,35,77,84]. High-magnification SEM analysis allows for detailed examination of cross-sections. SEM provides the ability to measure grain sizes, estimate layer thicknesses, and assess the uniformity of material coverage over large areas. SEM can detect various surface defects and irregularities, including the presence of clusters of large particles[109]. Dip-coated Cu2S films exhibited the presence of agglomerated nanosized particles forming irregular, large-sized cauliflower-like clusters on the glass substrate surface as observed under SEM[110-112].
|
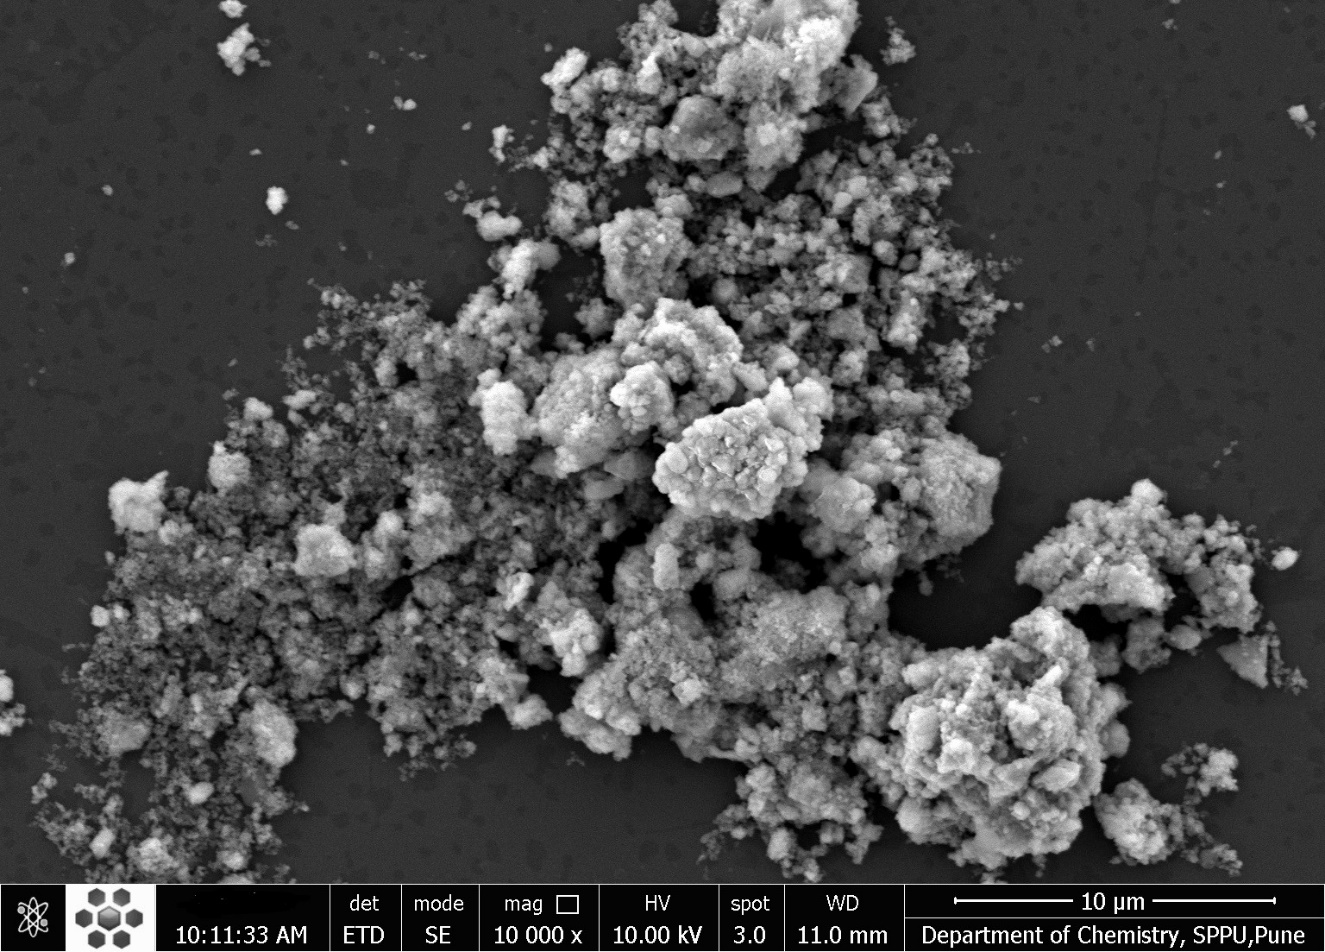
Figure 19. SEM Image of Cu2S Thin Film with Magnification of 10,000. (Scale bar: 10μm)
The SEM image in Figure 20 characterizes the surface morphology of the Mn doped Cu2S film, providing insights into the shape and size range of the particles. SEM analysis reveals that Mn doping and post-treatment (heat treatment in air) of Cu₂S thin films results in the formation of cauliflower-like nanoclusters in the 64-361nm range with increased crystallite size and reduced defects, improving crystallinity and homogeneity up to a certain annealing temperature. This process involves quantum dot vibrations and collisions, leading to the melting of grain boundaries, fusion of nanocrystallites into larger clusters (coagulation), and a decrease in defect density due to the annealing effect. The resulting clusters are polycrystalline and have a hexagonal morphology. The cauliflower-like clusters observed after heat treatment were composed of polycrystalline, hexagonally-shaped nanoparticles. However, increasing the dip time and annealing temperature eventually led to a decrease in film uniformity[1,2,8,35,84,109,113,114].
|
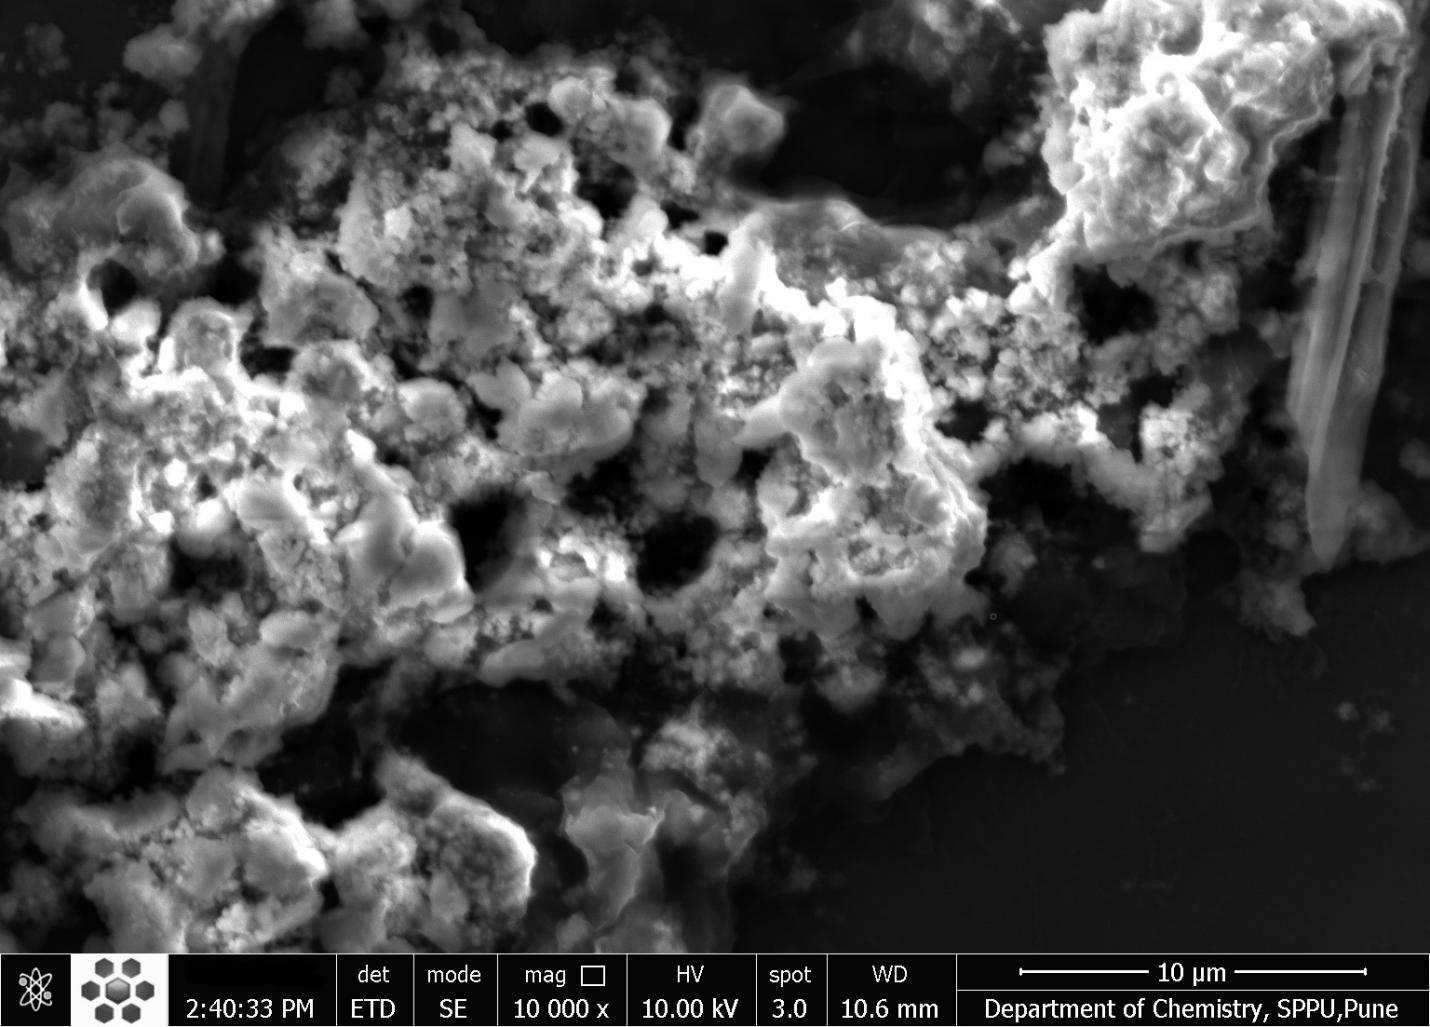
Figure 20. SEM Image of Mn Doped Cu2S Thin Film with Magnification of 10,000. (Scale bar: 10μm)
Mn-doped Cu2S thin films offer advantages over undoped Cu2S films, especially when perfect stoichiometry is crucial. Mn doping can enhance the thermoelectric properties of Cu2S by increasing the Se doping concentration limit. This improved Se doping helps to optimize the carrier concentration and adjust the electronic structure, leading to enhanced electrical conductivity and a lower lattice thermal conductivity. In essence, Mn doping fine-tunes the material's properties for improved performance in various applications. Mn doping can significantly increase the figure of merit (ZT) of Cu2S, a key indicator of thermoelectric performance. By increasing the Se doping concentration limit, Mn doping helps to optimize the material's electronic and thermal properties, leading to higher power generation efficiency. The increased Se doping due to Mn doping enhances the weighted mobility and electrical conductivity of Cu2S, making it a more efficient material for applications requiring electrical conductivity. Mn doping introduces lattice distortions and scatterers, which help to reduce the lattice thermal conductivity of Cu2S. This is beneficial in applications where high thermal conductivity can be detrimental, such as thermoelectric devices. Mn doping allows for a more precise control of the stoichiometry of Cu2S thin films, ensuring the material has the desired composition for specific applications. The improved thermoelectric and electrical properties of Mn-doped Cu2S make it a promising material for various applications, including thermoelectric generators, solar cells, and sensors. In summary, Mn doping provides a way to tailor the properties of Cu2S thin films for specific applications, particularly those where thermoelectric performance and precise stoichiometry are important. By increasing the Se doping concentration and improving the electronic and thermal properties, Mn doping makes Cu2S a more versatile and efficient material for various technologies[1,8,35,115-119].
Mn-doped CdS and Cu₂S nanoparticles and thin films are preferred over their undoped counterparts in many applications because doping with Mn enhances their optical and magnetic properties, leading to improved performance in areas like solar cells, luminescence, and magnetism. Specifically, Mn doping introduces magnetic moments, creating diluted magnetic semiconductors (DMS) with potential for enhanced magnetic and luminescent properties. Mn doping alters the electronic structure of CdS and Cu₂S, leading to changes in their optical absorption and emission behavior. For example, in CdS, Mn doping introduces new luminescence peaks, potentially enhancing light emission. CdS:Mn nanoparticles exhibit ferromagnetism at room temperature, a feature not present in undoped CdS. This opens up possibilities for applications in spintronics and magnetic devices. Mn doping can increase the quantum efficiency of luminescence, meaning the nanoparticles emit more light for a given amount of excitation. The concentration of Mn dopant can be controlled, allowing for fine-tuning of the optical and magnetic properties of the resulting material. CdS:Mn nanoparticles have been explored as sensitizers in solar cells, leading to improved PCE due to the increased absorption of light and enhanced electron transfer. In summary, Mn doping introduces desirable properties, including enhanced optical properties, ferromagnetism, and increased luminescence efficiency, making Mn-doped CdS and Cu₂S nanoparticles and thin films more attractive for various applications compared to their undoped counterparts[1,2,8,26,35,56,34,120].
5 CONCLUSION
A room-temperature, non-aqueous chemical method was employed to synthesize Thioglycerol-capped CdS and Cu2S nanoparticles and Mn-doped DMS CdS and Cu2S nanoparticles. Thin films of CdS, Cu2S, Mn-doped CdS, and Cu2S thin films were prepared on FTO glass substrates by dip coating and then subjected to a 20-minute heat treatment at 420°C in air. Undoped and doped nanoparticles and thin films underwent comprehensive analysis using different techniques to assess their properties. This research explores the differences in experimental results between undoped and doped nanoparticles and thin films, showcasing the benefits of doped materials for various applications compared to their undoped versions.
Acknowledgements
We express our sincere gratitude to the Department of Physics and Department of Chemistry of Savitribai Phule Pune University for providing access to UV-Vis Absorption, PL, XRD, SEM, EDX, and mapping instruments for our research.
Conflicts of Interest
The authors declared no conflict of interest.
Data Availability
All data generated or analyzed during this study are included in this published article and its supplementary information files.
Copyright Permissions
Copyright © 2025 The Author(s). Published by Innovation Forever Publishing Group Limited. This open-access article is licensed under a Creative Commons Attribution 4.0 International License (https://creativecommons.org/licenses/by/4.0), which permits unrestricted use, sharing, adaptation, distribution, and reproduction in any medium, provided the original work is properly cited.
Author Contribution
Darekar MS took the lead in conducting this research, designing the experiments, performing the practical work, interpreting the results, creating visuals like diagrams and tables, and writing the initial manuscript. Praveen BM provided expert supervision throughout the manuscript preparation process.
Abbreviation List
CdS, Cadmium sulphide
Cu2S, Copper sulphide
CVD, Chemical vapor deposition
DMS, Diluted magnetic semiconductor
EDAX, Energy dispersive X-ray analysis
FTO, Fluorine-doped tin oxide
LEDs, Light-emitting diodes
PCE, Power conversion efficiency
PL, Photoluminescence
PLD, Pulsed laser deposition
SEM, Scanning electron microscopy
SILAR, Successive ionic layer adsorption and reaction
TCO, Transparent conductive oxide
UV-Vis, Ultraviolet-Visible
XRD, X-ray diffraction
References
[1] Darekar MS, Praveen BM. Synthesis and characterization of nanoparticles of semiconducting metal suplhide and their application. Phys Scripta, 2022; 97: 065805.[DOI]
[2] Darekar MS, Praveen BM. Effects of heat treatment in air atmosphere on dip coating deposited CdS thin films for photo sensor applications. J Mod Nanotechnol, 2023; 3: 2.[DOI]
[3] Saraf R. High Efficiency and cost effective Cu2S/CdS thin-film solar cell. IOSR J Electr Electron Eng, 2012; 2: 47-51.[DOI]
[4] Li WZ, Liu Y, Wang ZY et al. Fabrication of C and N co-doped CdS semiconductor photocatalysts derived from a novel Cd-MOF for enhancing photocatalytic performance. J Environ Chem Eng, 2024; 12: 114204.[DOI]
[5] Ismail W, Ibrahim G, Habib M A et al. Advancement of physical and photoelectrochemical properties of nanostructured CdS thin films toward optoelectronic applications. Nanomaterials, 2023; 13: 1764.[DOI]
[6] Billah A, Tojo F, Kubota S et al. Organic molecule embedded CdS nanocomposite for hydrogen generation from water: Effect of precursors’ concentrations. Int J Hydrogen Energ, 2021; 46: 35302-35310.[DOI]
[7] Zavodinsky V, Gorkusha O, Kuz’menko A, Electronic structure of CdS nanoparticles and CdSe/CdS nanosystems. Semicond Sci Inform Dev, 2024; 4: 29-34.[DOI]
[8] Darekar MS, Praveen BM. High photosensitivity nanocrystalline p-Cu2S/n-FTO heterojunction photodetectors prepared by dip coating method. J Mod Nanotechnol, 2023; 3: 1.[DOI]
[9] Li X, Shen H, Li S et al. Investigation on type-II Cu2S–CdS core/shell nanocrystals: synthesis and characterization. J Mater Chem, 2010; 20: 923-928.[DOI]
[10] Patil M, Sharma D, Dive A et al. Synthesis and characterization of Cu2S thin film deposited by chemical bath deposition method. Procedia Manuf, 2018; 20: 505-508.[DOI]
[11] Kumarakuru H, Coombes MJ, Neethling JH et al. Fabrication of Cu2S nanoneedles by self-assembly of nanoparticles via simple wet chemical route. J Alloy Compd, 2014; 589: 67-75.[DOI]
[12] Lv S, Suo H, Zhao X et al. One-step synthesis of Cu2S nanostructures with two different morphologies on either side of a copper substrate. J Alloy Compd, 2009; 479: L43-L46.[DOI]
[13] Zhang X, Pollitt S, Jung G et al. Solution-Processed Cu2S nanostructures for solar hydrogen production. Chem Mater, 2023; 35: 2371-2380.[DOI]
[14] Chen CY, Jiang JR, Chuang WS et al. Development of crystalline Cu2S nanowires via a direct synthesis process and its potential applications. Nanomaterials, 2020; 10: 399.[DOI]
[15] Farhadi S, Siadatnasab F. Copper (I) sulfide (Cu2S) nanoparticles from Cu (II) diethyldithiocarbamate: synthesis, characterization and its application in ultrasound-assisted catalytic degradation of organic dye pollutants. Mater Res Bull, 2016; 83: 345-353.[DOI]
[16] Gurnani A, Inani H, Katharria YS et al. Synthesis of cadmium sulfide and copper (I) sulfide nano-particles for photovoltaic devices. Bionano Frontier, 2015; 8: 144-5.
[17] Gowdhaman P, Praveen VN, Saravanan RSS et al. Facile synthesis of undoped and Sn doped CdS nanoparticles for dye-sensitized solar cell applications. Opt Mater, 2021; 120: 111465.[DOI]
[18] Tiwary KP, Sharma K, Bala N et al. Microwave assisted synthesis of undoped and Cu doped CdS nanoparticles and their structural, morphological and optical characterization. Mater Today Proc, 2019; 18: 1380-1387.[DOI]
[19] Rashid MH, Koel A, Rang T et al. Optical dynamics of copper-doped cadmium sulfide (CdS) and zinc sulfide (ZnS) quantum-dots core/shell nanocrystals. Nanomaterials, 2022; 12: 2277.[DOI]
[20] Tiwary KP, Ali F, Mishra RK et al. Study of structural, morphological and optical properties of Cu and Ni doped CdS nanoparticles prepared by microwave assisted solvo thermal method. Dig J Nanomater Bios, 2019; 14: 305-313.
[21] Ghasempour A, Dehghan H, Ataee M et al. Cadmium sulfide nanoparticles: Preparation, characterization, and biomedical applications. Molecules, 2023; 28: 3857.[DOI]
[22] Hadi IH, Khashan KS, Sulaiman D. Cadmium sulphide (CdS) nanoparticles: Preparation and characterization. Mater Today Proc, 2021; 42: 3054-3056.[DOI]
[23] Gawande MB, Goswami A, Felpin FX et al. Cu and Cu-based nanoparticles: Synthesis and applications in catalysis. Chem Rev, 2016; 116: 3722-3811.[DOI]
[24] Kumar M, Kumar C, Shukla S et al. The size effect on the optical-electrical properties of Cu2S/CdS thin film towards the performance on Ag/p-Cu2S/n-CdS/ATO heterojunction diode. Mater Chem Phys, 2023; 297: 127305.[DOI]
[25] Ghediya PR, Chaudhuri TK, Ray J et al. Synthesis and characterizations of copper cadmium sulphide (CuCdS2) as potential absorber for thin film photovoltaics. Mater Chem Phys, 2020; 252: 123382.[DOI]
[26] Darekar MS, Praveen BM. Hyperfine Splitting and Ferromagnetism in CdS:Mn Nanoparticles for Optoelectronic Device Applications. J Semicond, 2023; 44: 122502.[DOI]
[27] Rodriguez FJW, Urbiola IRC, Landaverde MAH et al. Effects of incorporating manganese in CdS thin films elaborated by CBD and the performance of Schottky diodes TCO/CdS:Mn/C. Mater Chem Phys, 2024; 312: 128636.[DOI]
[28] Azab AA, Ibrahim RS, Seoudi R. Investigating the effects of Mn content on the morphology and dielectric properties of CdS nanoparticles. Appl Phys A, 2024; 130: 294.[DOI]
[29] Mishra SK, Srivastava RK, Prakash SG et al. Structural, optical and photoconductivity characteristics of manganese doped cadmium sulphide nanoparticles synthesized by co-precipitation method. J Alloys Compd, 2012; 513: 118-124.[DOI]
[30] Orak C, Oguz T, Horoz S. Facile synthesis of Mn-doped CdS nanoparticles on carbon quantum dots: towards efficient photocatalysis. J Aust Ceram Soc, 2024; 60: 1657-1667.[DOI]
[31] Salimian S, Farjami Shayesteh S. Luminescence properties of manganese doped CdS nanoparticles under various synthesis conditions. Acta Phys Pol A, 2010; 118: 633-636.[DOI]
[32] Thangamuniyandi P, Nagaraj K, Velmurugan G et al. Green Synthesis of Starch‐Capped CdS Nanoparticles Doped with Copper (II) and Manganese (II): Structural, Optical, and Photocatalytic Properties. Eur J Inorg Chem, 2024; 27: e202400291.[DOI]
[33] Fan L, Han J, Wei K et al. Mn-doped CdS/Cu2O: An S-scheme heterojunction for photocatalytic hydrogen production. J Alloy Compd, 2023; 960: 170382.[DOI]
[34] Verma MR, Shinde MD, Jagtap SS et al. Synthesis and characterization of Mn doped CdS nanoparticles using chemical co-precipitation method. JETIR, 2019; 6: 222-224.
[35] Darekar MS, Mokshanatha P B. Preparation of Manganese Doped Copper Sulphide Nanoparticles by Cost-Favourable Chemical Method at Room Temperature. J Metastable and Nanocrystalline Mater, 2025; 41: 43-57.[DOI]
[36] Haque MM, Rahman A, Shahin MSI et al. Manganese doped copper ferrite nanoparticles: A promising approach for organic dye elimination under light irradiation. Results Chem, 2024; 7: 101509.[DOI]
[37] Tailor JP, Chaki SH, Deshpande MP. Comparative study between pure and manganese doped copper sulphide (CuS) nanoparticles. Nano Express, 2021; 2: 010011.[DOI]
[38] Saikia D, Saikia PK, Gogoi PK et al. Synthesis, characterization and photovoltaic application of silver doped CdS/PVA nanocomposite thin films. Dig J Nanomater Bios, 2011; 6: 589-597.
[39] Vasuki P, Radhika V, Mehala P. Characterization of manganese doped CdO thin films prepared by dip coating method. Int J Recent Sci Res, 2018; 9: 29063-29065.[DOI]
[40] Giri RK, Chaki SH, Khimani AJ et al. Exploring the optoelectronic potential of dip coated CuInS2 thin films via morphological, structural, and photoresponse insights. Surf Interfaces, 2025, 61: 106098.[DOI]
[41] Mukherjee A, Satpati B, Bhattacharyya SR et al. Synthesis of nanocrystalline CdS thin film by SILAR and their characterization. Physica E, 2015; 65: 51-55.[DOI]
[42] Kim WY, Palve BM, Pathan HM et al. Spray pyrolytic deposition of polycrystalline Cu2S thin films. Mater Chem Phys, 2011; 131: 525-528.[DOI]
[43] Mahajan S,Kamble S, Lokhande R et al. Opto-electrical properties studies of Cu2S thin film prepared by chemical bath deposition. IJCRT, 2023; 11: 788-791.
[44] Devi IR, Singh LR. Study of optical properties of CdS and Cu doped CdS thin films fabricated by chemical bath deposition technique. Int J Innov Res Multidiscip Field, 2020; 6: 210-215.
[45] Phasook N, Kamoldirok S, Yindeesuk W. Optical properties of Mn-doped CdS thin films grown by the SILAR method. J Physics Conf Ser, 2018; 1144: 012009.[DOI]
[46] Butt MA. Thin-film coating methods: a successful marriage of high-quality and cost-effectiveness—a brief exploration. Coatings, 2022; 12: 1115.[DOI]
[47] Ziti A, Hartiti B, Belafhaili A et al. Effect of dip-coating cycle on some physical properties of Cu2NiSnS4 thin films for photovoltaic applications. J Mater Sci-Mater El, 2021; 32: 16726-16737.[DOI]
[48] Sharme RK, Quijada M, Terrones Met al. Thin conducting films: preparation methods, optical and electrical properties, and emerging trends, challenges, and opportunities. Materials, 2024; 17: 4559.[DOI]
[49] Tao H, Jin Z, Wang W et al. Preparation and characteristics of CdS thin films by dip-coating method using its nanocrystal ink. Mater Lett, 2011; 65: 1340-1343.[DOI]
[50] Knowles KE, Hartstein KH, Kilburn TB et al. Luminescent colloidal semiconductor nanocrystals containing copper: synthesis, photophysics, and applications. Chem Rev, 2016; 116: 10820-10851.[DOI]
[51] Gopi CVVM, Venkata-Haritha M, Kim SK et al. A strategy to improve the energy conversion efficiency and stability of quantum dot-sensitized solar cells using manganese-doped cadmium sulfide quantum dots. Dalton T, 2015; 44: 630-638.[DOI]
[52] Okorie O, Buba ADA, Ramalan AM. Optical and dielectric properties of cadmium sulphide thin film grown using chemical bath deposition technique. IOSR J Appl Phys, 2017; 9: 82.[DOI]
[53] Ramya E, Kushavah D, Mohapatra J et al. Ultrafast optical characteristics of Mn-doped CdS quantum dots. Results Opt, 2023; 13: 100560.[DOI]
[54] Chauhan R, Kumar A, Chaudhary RP. Synthesis, structural and photocatalytic studies of Mn-doped CdS nanoparticles. Res Chem Intermediat, 2013; 39: 645-657.[DOI]
[55] Ranjan R, Negi CMS, Choubey SK. Tiwary. Study of structural, morphological and optical properties of Mn2+ doped CdS nanoparticles synthesized at various doping concentration. Chalcogenide Lett, 2023; 20: 709-724.[DOI]
[56] Ganguly A, Nath SS. Mn-doped CdS quantum dots as sensitizers in solar cells. Mater Sci Eng B, 2020; 255: 114532.[DOI]
[57] Gupta AK, Kripal R. EPR and photoluminescence properties of Mn2+ doped CdS nanoparticles synthesized via co-precipitation method. Spectrochim Acta A, 2012; 96: 626-631.[DOI]
[58] Gadalla A, Almokhtar M, Abouelkhir AN. EFFECT OF Mn DOPING ON STRUCTURAL, OPTICAL AND MAGNETIC PROPERTIES OF CdS DILUTED MAGNETIC SEMICONDUCTOR NANOPARTICLES. Chalcogenide Lett, 2018; 15: 207-218.
[59] Patle US. Synthesis and characterization of Mn doped CdS nanoparticles prepared by chemical bath deposition method. Int J Sci Res, 2015; 4: 1945.[DOI]
[60] Barglik-Chory C, Remenyi C, Dem C et al. Synthesis and characterization of manganese-doped CdS nanoparticles. Phys Chem Chem Phys, 2003; 5: 1639-1643.[DOI]
[61] H Patel N, Deshpande MP, V Bhatt S et al. Structural and magnetic properties of undoped and Mn doped CdS nanoparticles prepared by chemical co-precipitation method. Adv Mater Lett, 2014; 5: 671-677.[DOI]
[62] Bodo B, Talukdar N, Kalita PK. Synthesis of CdS: Cu nanorods for application in photonic devices. Int J Eng Res App, 2012; 2: 1656-1659.
[63] Chen L, Hu H, Chen Y et al. Plasmonic Cu2-xS nanoparticles: a brief introduction of optical properties and applications. Mater Adv, 2021; 2: 907-926.[DOI]
[64] Daskalakis I, Vamvasakis I, Papadas IT et al. Surface defect engineering of mesoporous Cu/ZnS nanocrystal-linked networks for improved visible-light photocatalytic hydrogen production. Inorg Chem Front, 2020; 7: 4687-4700.[DOI]
[65] Daniel J E, Jesby C M, Plass K E et al. Multinary Tetrahedrite (Cu12–x–yMxNySb4S13) Nanoparticles: Tailoring Thermal and Optical Properties with Copper-Site Dopants. Chem Mater, 2024; 36: 3246-3258.[DOI]
[66] Cao S, Li C, Wang L et al. Long-lived and well-resolved Mn2+ ion emissions in CuInS-ZnS quantum dots. Sci Rep, 2014; 4: 7510.[DOI]
[67] Ming SK, Taylor RA, O'brien P et al. Tunable structural, morphological and optical properties of undoped, Mn, Ni and Ag-doped CuInS2 thin films prepared by AACVD. Mat Sci Semicon Proc, 2022; 137: 106224.[DOI]
[68] Verma MR, Shinde MD, Jagtap SS et al. Diwate. Synthesis and characterization of Mn doped CdS nanoparticles using chemical co-precipitation method. J Emerg Tech Innov Res, 2019; 6: 222-224
[69] Bangal M, Ashtaputre S, Marathe S et al. Semiconducting Nanoparticles. Hyperfine Interactions, 2005; 160: 81-94.[DOI]
[70] Kapil K, Vijay K, Sham S. Cu2S-CdS Heterojunctions for Solar Cell Applications. Res J Chem Environ, 2020; 24: 167-179.
[71] Dutta RP, Neog N. An investigation of CdSe thin film for photovoltaic properties under different annealing temperature. Mater Today Proc, 2021; 42: 893-896.[DOI]
[72] Chalapathi U, Jayasree Y, Uthanna S et al. Effect of annealing temperature on the properties of spray deposited Cu2SnS3 thin films. Phys Status Solidi A, 2013; 210: 2384-2390.[DOI]
[73] Kauk-Kuusik M, Timmo K, Muska K et al. Detailed insight into the CZTS/CdS interface modification by air annealing in monograin layer solar cells. ACS Appl Energ Mater, 2021; 4: 12374-12382.[DOI]
[74] Nwambaekwe KC, John-Denk VS, Douman SF et al. Crystal engineering and thin-film deposition strategies towards improving the performance of kesterite photovoltaic cell. J Mater Res Technol, 2021; 12: 1252-1287.[DOI]
[75] Amin N, Karim MR, ALOthman ZA. Impact of CdCl2 treatment in CdTe thin film grown on ultra-thin glass substrate via close spaced sublimation. Crystals, 2021; 11: 390.[DOI]
[76] Babucci M, Törndahl T, Mukherjee S et al. Studies of Atomic-Layer-Deposited Zn1–XSnXOY as an Alternative Buffer Layer for Cu2Zn (Sn1–X, GeX)S4 Thin-Film Solar Cells. ACS Appl Electron Mater, 2024; 6: 7989-7999.[DOI]
[77] Ramya M, Ganesan S. Influence of thickness and temperature on the properties of Cu2S thin films. Iran J Sci Technol, 2013; 37: 293-300.[DOI]
[78] Sun D, Zhong H, Yao X et al. A bright blue-shifted emission from Mn2+-doped CdS quantum dots. Mater Lett, 2014; 125: 132-135.[DOI]
[79] Kanwal Z, Usmani MN. Shift in optical properties of Mn doped CdS (A DFT+ U study). Mater Res Express, 2018; 5: 015915.[DOI]
[80] Chaki SH, Tailor JP, Deshpande MP. Synthesis and characterizations of undoped and Mn doped CuS nanoparticles. Adv Sci Lett, 2014; 20: 959-965.[DOI]
[81] Maleki Z, Jamali-Sheini F. Mn-doped Cu3Se2 nanosheets: Impact of physical characteristics on the photovoltaic performance. Mater Res Bull, 2020; 132: 111001.[DOI]
[82] Doğan V, Yılmaz S, Tomakin M et al. Improving photovoltaic characteristics of CdS-based hybrid solar cells through Mn incorporation. J Photoch Photobio A, 2024; 453: 115678.[DOI]
[83] Talbi A, Khaaissa Y, Mansouri F et al. Advancing Solar Cell Efficiency: Experimental and Numerical Analysis of Mn-Doped ZnS as a Buffer Layer. ACS Omega, 2023; 10: 28220-28232.[DOI]
[84] Darekar MS, Praveen BM. Mn-doped CdS thin film deposition on FTO and Si: A comparative investigation. J Mod Nnanotechnol, 2025; 5: 1.[DOI]
[85] Mohammed DT, Mohammed GH. Investigation of Structural, Optical and Electrical Properties of MnO Doped with Cu Thin Films Prepared by PLD Technique for Solar Cell Applications. E Eur J Phys, 2023: 391-399.[DOI]
[86] Sheikh UR. Calculation of band gap materials using UV-Visible spectroscopy. 2020.[DOI]
[87] Zhong H, Pan F, Yue S et al. Idealizing Tauc plot for accurate bandgap determination of semiconductor with UV-Vis: a case study for cubic boron arsenide. J Phys Chem Lett, 2023; 14: 6702-6708.[DOI]
[88] Oghenekome OJ, Kesse AG, Godwin O. Investigating the Optical Band Gap of Various TiO2 Thin Films and MAPBI Perovskite Using UV-Vis Spectroscopy and Tauc Plot Analysis. Asian J Phys Chem Sci, 2025; 13: 34-43.[DOI]
[89] Al-Mahamad LLG. Analytical study to determine the optical properties of gold nanoparticles in the visible solar spectrum. Heliyon, 2022; 8: e09966.[DOI]
[90] Cruz-Goméz J, García-Caballero AD, Rodríguez-Rosales K et al. Influence of deposition temperature and fluorine doping on CdS properties: Exploring applications in CdTe solar cells. Mater Sci Eng B, 2024; 309: 117646.[DOI]
[91] Yılmaz S, Atasoy Y, Tomakin M et al. Comparative studies of CdS, CdS: Al, CdS: Na and CdS:(Al–Na) thin films prepared by spray pyrolysis. Superlattice Microst, 2015; 88: 299-307.[DOI]
[92] Nalini SPM. Deborrah. Mn doped CdS thin films by using chemical bath deposition technique. Bodhi Int J Res Hum Arts Sci, 2017; 2: 174-181.
[93] Vogel W, Urban J, Kundu M et al. Sphalerite - Wurtzite intermediates in nanocrystalline CdS. Langmuir, 1997; 13: 827-832. [DOI]
[94] Dorofeev GA, Streletskii AN, Povstugar IV et al. Determination of nanoparticle sizes by X-ray diffraction. Colloid J, 2012; 74: 675-685.[DOI]
[95] More PB, Jagtap CV, Kadam VS et al. Synthesis and performance evaluation of ZnO/CdS photoanodes with copper sulfide (Cu2S) and carbon counter electrodes. Sci Rep, 2024; 14: 31551.[DOI]
[96] Chowdhury RI, Hossen MA, Mustafa G et al. Characterization of chemically deposited cadmium sulfide thin films. Int J Mod Phys B, 2010; 24: 5901-5911.[DOI]
[97] Rondiya SR, Jadhav Y, Dzade NY et al. Experimental and Theoretical Study into Interface Structure and Band Alignment of the Cu2Zn1–xCdxSnS4 Heterointerface for Photovoltaic Applications. ACS Appl Energ Mater, 2020; 3: 5153-5162.[DOI]
[98] Manjulavalli TE, Kannan AG. Effects of deposition time on structural, optical and electrical properties of chemically deposited Cu2S thin films. J Chem Tech Res, 2015; 8: 607-616.
[99] Al-Taay HF. Preparation and Characterization of Chemical Bath Deposition synthesis CdS Nanocrystalline Thin Films. Iraqi J Sci, 2017; 58: 454-461.[DOI]
[100] Uddin B, Farque MO, Moniruzzaman M et al. Enhancing the photocatalytic properties of nickel oxide nanoparticles via iron doping: Efficient degradation of eosin yellow dye. Chem Phys Impact, 2025; 10: 100798.[DOI]
[101] Asaldoust F, Mabhouti K, Jafari A et al. Structural, magnetic, and optical characteristics of undoped and chromium, iron, cobalt, copper, and zinc doped nickel oxide nanopowders. Sci Rep, 2025; 15: 1088.[DOI]
[102] Roushdy N, Elnouby MS, Farag AAM et al. Structural and electrical characterization of nickel sulfide nanoparticles. Opt Quant Electron, 2024; 56: 1794.[DOI]
[103] Lims SC, Jose M, Aswathappa S et al. Co-precipitation synthesis of highly pure and Mg-doped CdO nanoparticles: from rod to sphere shapes. RSC Adv, 2024; 14: 22690-22700.[DOI]
[104] Deep R, Yoshida T, Fujita Y. Defects in nitrogen-doped ZnO nanoparticles and their effect on light-emitting diodes. Nanomaterials, 2024; 14: 977.[DOI]
[105] Gezgin SY, Belaid W, Kabatas MABM et al. Microstrain effects of laser-ablated Au nanoparticles in enhancing CZTS-based 1 Sun photodetector devices. Phys Chem Chem Phys, 2024; 26: 9534-9545.[DOI]
[106] Uddin MJ, Yeasmin MS, Muzahid AA et al. Morphostructural studies of pure and mixed metal oxide nanoparticles of Cu with Ni and Zn. Heliyon, 2024; 10: e30544.[DOI]
[107] Volnistem EA, Oliveira RC, Perin GH et al. Controlled dislocation density as enhancer of the magnetic response in multiferroic oxide nanoparticles. Appl Mater Today, 2022; 29: 101680.[DOI]
[108] Manir M, Genç G, Nevruzoglu V et al. Optimizing CdS thin films as optical windows in solar cells: A comparative study of cryogenic and classical techniques. Appl Phys A, 2025; 131: 448.[DOI]
[109] Dharmadasa IM, Bingham PA, Echendu OK et al. Fabrication of CdS/CdTe-based thin film solar cells using an electrochemical technique. Coatings, 2014; 4: 380-415.[DOI]
[110] Ren H, Zhang X, Li Y et al. Preparation of cross-sectional membrane samples for scanning electron microscopy characterizations using a new frozen section technique. Membranes, 2023; 13: 634.[DOI]
[111] Ali A, Zhang N, Santos RM. Mineral characterization using scanning electron microscopy (SEM): a review of the fundamentals, advancements, and research directions. Appl Sci, 2023; 13: 12600.[DOI]
[112] Kogure T. Chapter 2.9-Electron Microscopy. Dev Clay Sci, 2013; 5: 275-317.[DOI]
[113] Shaikh SU, Desale DJ, Siddiqui FY et al. Effects of air annealing on CdS quantum dots thin film grown at room temperature by CBD technique intended for photosensor applications. Mater Res Bull, 2012; 47: 3440-3444.[DOI]
[114] Gawande MB, Goswami A, Felpin FX et al. Cu and Cu-based nanoparticles: synthesis and applications in catalysis. Chem Rev, 2016; 116: 3722-3811.[DOI]
[115] Gong C, Zeng Z, Sun X et al. Mn-doping method boosts Se doping concentration in Cu2S towards high thermoelectric performance. J Mater Chem C, 2025; 13: 326-333.[DOI]
[116] Zhuge F, Li X, Gao X et al. Synthesis of stable amorphous Cu2S thin film by successive ion layer adsorption and reaction method. Mater Lett, 2009; 63: 652-654.[DOI]
[117] Liu G, Schulmeyer T, Brötz J et al. Interface properties and band alignment of Cu2S/CdS thin film solar cells. Thin Solid Films, 2003; 431: 477-482.[DOI]
[118] Pathan HM, Lokhande CD. Deposition of metal chalcogenide thin films by successive ionic layer adsorption and reaction (SILAR) method. B Mater Sci, 2004; 27: 85-111.[DOI]
[119] Cabrera-German D, Martínez-Gil M, Fuentes-Ríos L et al. Insights into the SILAR Processing of CuxZn1–xS Thin Films via a Chemical, Structural, and Optoelectronic Assessment. ACS omega, 2023; 8: 48056-48070.[DOI]
[120] Dariani RS, Emami Z. Structural and optical studies of CdS and CdS: Ag nano needles prepared by a SILAR method. Ceram Int, 2015; 41: 8820-8827.[DOI]



 Copyright ©