Survival Analysis on Identified Genes in Acute Myeloid Leukemia Based on TCGA Database
Wenyan Zhao1*, Peiyan Wang2
1Fielding School of Public Health, University of California, Los Angeles, California, USA
2School of Information, University of Michigan, Ann Arbor, Michigan, USA
Abstract
Objective: This study aims to develop a comprehensive prognostic model for acute myeloid leukemia (AML) by integrating genomic and clinical factors. AML is a prevalent malignant bone marrow disorder with a significant impact on adult populations. Despite existing knowledge about certain prognostic genes, a holistic model considering both genomic and clinical variables for assessing overall survival is lacking. This research endeavors to fill this gap by analyzing gene expression profiles and clinical attributes from The Cancer Genome Atlas (TCGA) database, with a focus on determining the influence of these factors on AML patient survival by incorporating disease-associated genes sourced from the Kyoto Encyclopedia of Genes and Genomes (KEGG) pathway database.
Methods: We conducted an analysis of complete gene expression profiles and clinical data from 173 AML patients within the TCGA database. Utilizing advanced statistical techniques, we explored the relationships between gene expression levels, clinical features, and patient survival. Disease-related genes identified from the KEGG pathway database were integrated into the analysis to enhance the model’s predictive power. Cox proportional hazards regression and machine learning algorithms were employed to develop and optimize the prognostic model.
Results: Our analysis revealed substantial insights into the impact of gene expression patterns and clinical attributes on the survival of AML patients. By incorporating disease-associated genes from the KEGG pathway database, we observed a notable enhancement in the model’s ability to predict survival outcomes. The optimized prognostic model successfully integrated both genomic and clinical factors, providing a more accurate assessment of AML patient survival.
Conclusion: This study underscores the significance of combining genomic and clinical factors in predicting survival outcomes for AML patients. Our comprehensive prognostic model, enriched by disease-related genes from the KEGG pathway database, offers an innovative approach to enhancing the accuracy of survival predictions. By shedding light on the intricate interplay between gene expression profiles and clinical attributes, this research contributes to a deeper understanding of AML prognosis and paves the way for more effective personalized treatment strategies.
Keywords: acute myeloid leukemia, prognostic factor, Cox proportional hazards model
1 INTRODUCTION
Acute myeloid leukemia (AML) is a malignant affliction of the bone marrow (BM), which is caused by the clonal proliferation of undifferentiated myeloid progenitor cells. The genetic aberrations disrupts the harmonious balance between cell proliferation and differentiation, thereby fostering the accumulation of leukemic blasts and immature cells within the BM milieu. Remarkably, the age-adjusted incidence of AML registers at 4.3 per 100,000 on an annual basis in the United States, solidifying its stature as one of the most prevalent hematological malignancies. Notably, AML is identified as one of the hematological cancers evidenced by a 5-year survival rate of merely 24%[1].
Previous research efforts have identified various clinical attributes as pivotal in forecasting both the overall survival and disease-free survival of AML patients. These attributes encompass age, cytogenetic anomalies, secondary leukemia, white blood cell count, and achievement of complete remission post the initial induction[2]. From a clinical standpoint, AML is meticulously classified into eight distinct subtypes (M0-M7) by the French-American-British (FAB) classification systems. This classification hinges on the assessment of dysmyelopoiesis presence, along with the quantification of myeloblasts and erythroblasts. Furthermore, it’s well-established that both cytogenetic and molecular aberrations exert profound influence over treatment response and long-term outcomes in AML. In addition, the dynamic ecosystem within the BM environment, comprising immune cells, endothelial progenitor cells, and stromal cells, which plays an important role in tumor cell homing and sustenance, effectively shaping the overall patient prognosis.
In this project, we have collected comprehensive gene expression profiles from The Cancer Genome Atlas (TCGA) database, encompassing a cohort of 173 AML patients. Alongside these profiles, we have collected a range of pertinent clinical features, including the percentage of abnormal lymphocytes, age, basophil count, blast count, FAB classification, fraction of genome altered, history of neoadjuvant treatment (yes / no), history of other malignancies (yes / no), mutation count, platelet count pre resection, and sex.
The aim of this study is to discern the impact of both gene expression levels and clinical attributes on the survival outcomes of individuals afflicted by AML. This involves a comprehensive analysis of how these combined factors influence patient survival. Additionally, our investigation delves into identifying the most effective survival model by integrating disease-associated genes sourced from the Kyoto Encyclopedia of Genes and Genomes (KEGG) pathway database[3]. Through this approach, we aspire to enhance our understanding of the intricate interplay between genetic and clinical determinants in the prognosis of AML.
2 MATERIALS AND METHODS
2.1 Data
The preprocessed and standardized gene expression profiles of AML patients and corresponding clinical profiles were obtained from cBioPortal (https://www.cbioportal.org/) with study name AML (TCGA, provisional), including 173 patients.
2.2 Survival Analysis
Kaplan-Meier estimator curves will be constructed to illustrate the correlations between selected clinical features and the overall survival of AML patients. The log-rank test will be applied to identify the most significantly correlated genes in overall survival of AML patients. The Cox proportional hazards model and accelerated failure time (AFT) model will be built based on clinical features and identified genes. The R-squared statistic and L-squared statistic will be used as the prediction accuracy measures to evaluate the model[4]. The Cox-Snell residual plot will finally be plotted to check the goodness of fit of our best model.
2.3 KEGG Database
KEGG is a database for understanding high-level functions and utilities of the biological system, such as the cell and the organism from the molecular-level information, especially large-scale molecular datasets generated by genome sequencing and other high-throughput experimental technologies. KEGG pathway database is a collection of drawn pathway maps representing knowledge on the molecular interactions, including networks for metabolism, cellular processes, human diseases, etc. 61 genes participated in KEGG pathway: map05221, AML, will be utilized here. (Supplementary Figure 1)
3 RESULTS
3.1 Data Preprocessing
After removing the patients whose overall survival time is missing or equals to 0, we have 148 subjects. Given the 33 variables in the original clinical profiles, those representing sample ID are removed, those containing more than 50% missing value are removed, and those only have 1 single value are removed, resulting in the dataset with 11 predictors. Also, in order to use the stepwise method in model selection, we imputed the missing value using the median of the column. The summary statistics of all variables will be shown in Table 1, including the overall survival time in months and censored rate. We found a relatively high censored rate (37.84%) in this dataset.
Table 1. Summary Statistics of Clinical Variables
Variables |
Values |
Abnormal lymphocyte percent (Mean±SD) |
2.58±6.78 |
Age (Mean±SD) |
54.9±16.19 |
Basophils count (Mean±SD) |
0.66±1.63 |
Blast count (Mean±SD) |
36.81±31.8 |
Fraction of genome altered (Mean±SD) |
0.02±0.05 |
Mutation count (Mean±SD) |
9.99±5.74 |
Platelet count pre-resection (Mean±SD) |
65.76±55.34 |
Overall survival time in months (Mean±SD) |
20.28±19.51 |
FAB stage, n (%) |
|
M0 undifferentiated |
13 (8.78%) |
M1 |
35 (23.65%) |
M2 |
33 (22.29%) |
M3 |
15 (10.14%) |
M4 |
33 (22.30%) |
M5 |
14 (9.46%) |
M6 |
2 (1.35%) |
M7 |
3 (2.03%) |
History of neoadjuvant treatment, n (%) |
|
Yes |
36 (24.32%) |
No |
112 (75.68%) |
History of other malignancy, n (%) |
|
Yes |
10 (6.76%) |
No |
138 (93.24%) |
Sex, n (%) |
|
Male |
79 (53.38%) |
Female |
69 (46.62%) |
Censored rate, n (%) |
|
Uncensored |
92 (62.16%) |
Censored |
56 (37.84%) |
3.2 Log-rank Test
In order to identify the potential genes, the log-rank test will be applied to test the survival functions between two independent right-censored samples[5]. For each one in the 61 genes, we grouped the patients into “low-expressed” group and “high-expressed” group by its median. Then the log-rank test will be applied, and no specific weight will be given. We then filtered the potential gene predictors using P<0.05 as a threshold. Finally, the survival function is found to be significantly different between two groups when classifying by each of the following 10 genes: PIK3CA, PIK3CB, BCL2A1, MAP2K1, PPARD, PIM1, KIT, ITGAM, MPO, STAT5B. Also, the log-rank test for each categorical variable in clinical predictors (FAB stage, sex, history of neoadjuvant treatment) will be conducted. Since only 6 subjects with the history of other malignancy have uncensored data, the log-rank test will not be applied for this predictor. The results for log-rank test will be summarized in Table 2.
Table 2. Results of Log-rank Test
Predictor |
P-value |
PIK3CA |
0.0380* |
PIK3CB |
0.0286* |
BCL2A1 |
0.0002*** |
MAP2K1 |
0.0386* |
PPARD |
0.0249* |
PIM1 |
0.0328* |
KIT |
0.0226* |
ITGAM |
0.0390* |
MPO |
0.0044** |
STAT5B |
0.0115* |
FAB |
0.04* |
Sex |
0.8 |
History of neoadjuvant treatment |
0.04* |
Notes: *P<0.05, **P<0.01, ***P<0.001.
3.3 Kaplan-Meier Estimator
We identified 10 potential gene predictors in a log-rank test. Then the Kaplan-Meier estimator is used to estimate the survival function, and the Kaplan-Meier curve will be applied in visualizing the survival probability in each group. Only the predictors statistically significant in 4.2 are used as stratification factors here. The Kaplan-Meier curve for AML Patients without stratification is shown in Figure 1. Then the Kaplan-Meier curve stratified by FAB and history of neoadjuvant treatment will be plotted in Figures 2 and 3, respectively. We found that the 5-year overall survival rate for the whole cohort is around 25%. It is found that the probability of survival in FAB-M2 is the largest with time increasing. However, the least probabilities of survival observed in FAB-M6 and FAB-M7 may be due to the deficiency of subjects in these two classifications. In addition, when keeping time as constant, the survival probability of AML patients with neoadjuvant treatment history is expected to be less than those without.
|
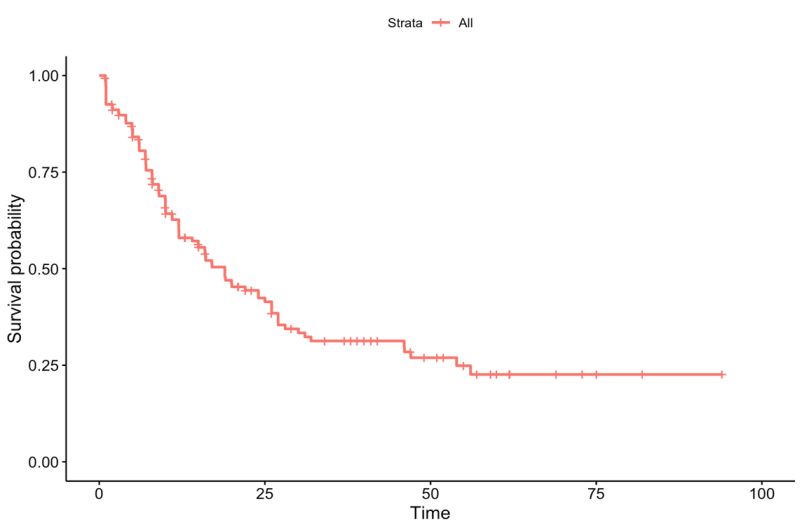
Figure 1. Kaplan-Meier curve for AML patients (n=173). The survival time evaluated in months.
|
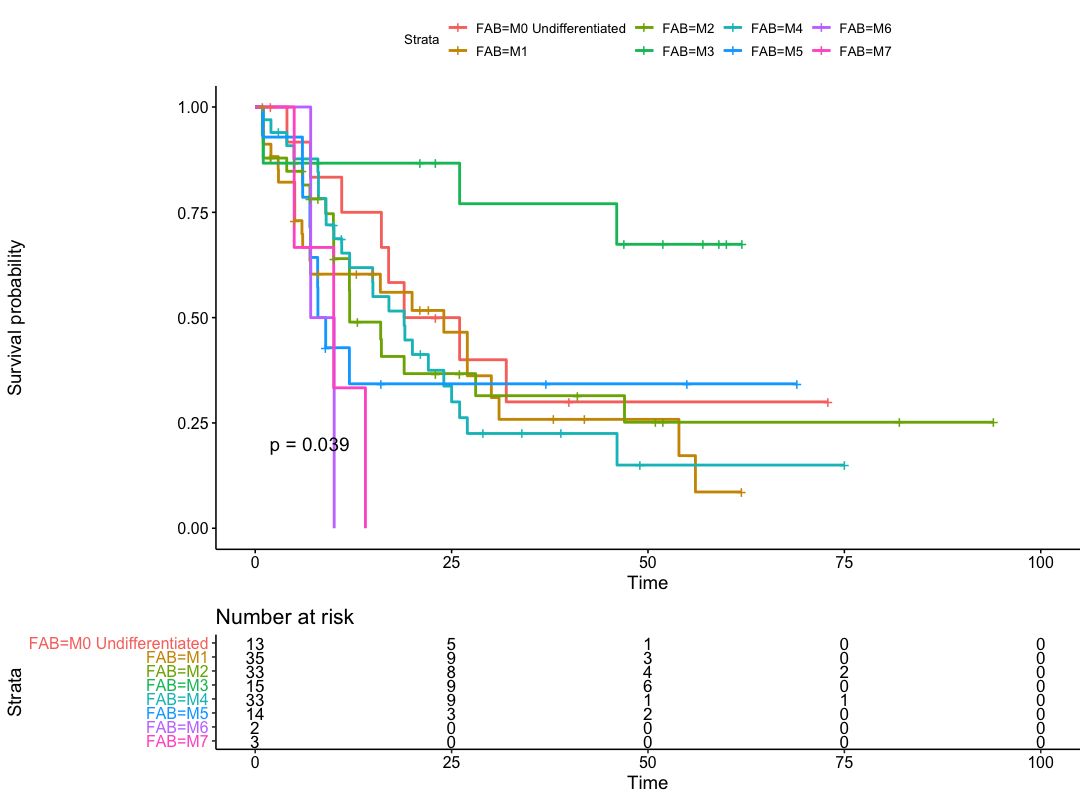
Figure 2. Kaplan-Meier curve for AML patients by FAB stage.
|
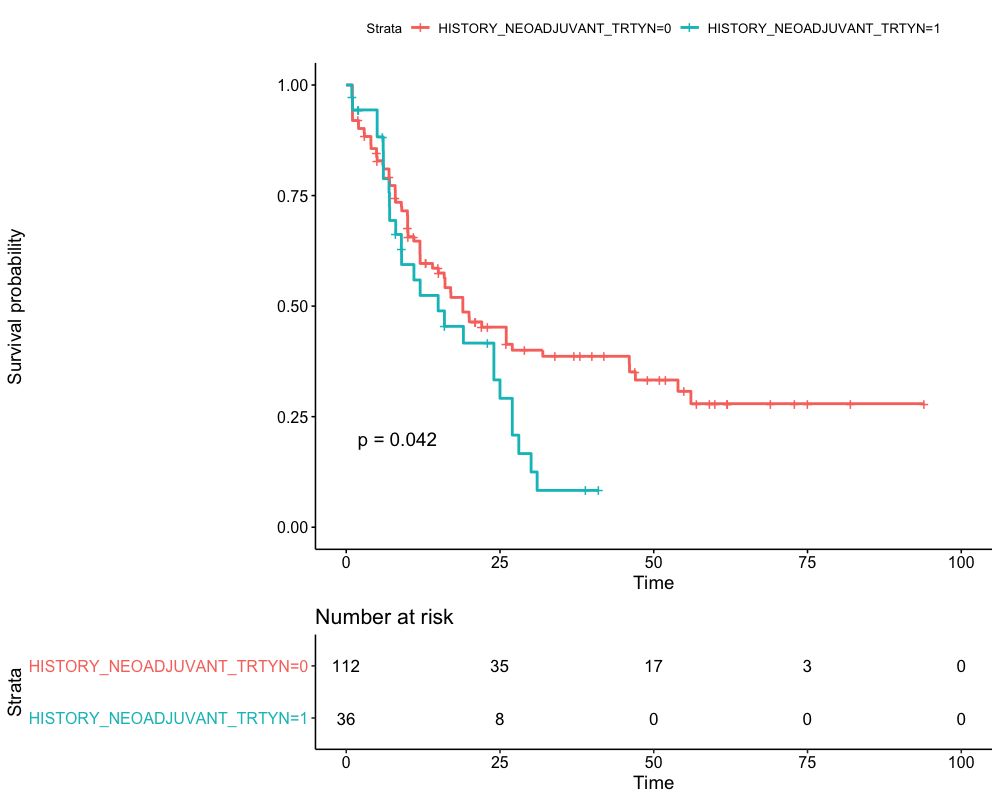
Figure 3. Kaplan-Meier curve for AML patients by history of neoadjuvant treatment.
3.4 Modeling Survival Data
While the Kaplan-Meier estimator is a powerful tool for providing an overall visualization of survival probabilities, it does not inherently adjust for the influence of covariates. To address this limitation and capture the potential effects of covariates, we have employed the Cox proportional hazards model. In this section, the Cox proportional hazards model and AFT model will be used to better explore the association between predictors (including clinical predictors and identified genes) and survival time for AML patients.
3.4.1 Models with Clinical Predictors
We will use 11 clinical predictors to fit Cox proportional hazard model and AFT model firstly. The Weibull-based AFT model and lognormal-based AFT model will be considered. The categorical variable FAB will be converted to dummy variables. Then the stepwise method will be used to select the best model with the least Akaike information criterion (AIC), respectively. The results will be shown in Tables 3-5.
Table 3. Best Cox Model for Clinical Features
|
Coefficient |
Exp (Coefficient) |
P-value |
Abnormal lymphocyte percent |
-0.033 |
0.968 |
0.129 |
Age |
0.042 |
1.043 |
<0.001*** |
History of neoadjuvant trt |
0.648 |
1.912 |
0.013* |
Blast count |
0.004 |
1.004 |
0.327 |
Fraction of genome altered |
6.882 |
974.982 |
<0.001*** |
Notes: *P<0.05, ***P<0.001.
Table 4. Best Lognormal-based AFT Model for Clinical Features
|
Coefficient |
P-value |
Intercept |
5.622 |
<0.001*** |
Abnormal lymphocyte percent |
0.045 |
0.0235* |
Age |
-0.038 |
<0.001*** |
History of neoadjuvant trt |
-0.438 |
0.107 |
Fraction of genome altered |
-7.346 |
0.0023** |
FAB-1 |
0.252 |
0.772 |
FAB-2 |
0.259 |
0.747 |
FAB-3 |
-0.741 |
0.345 |
FAB-4 |
-0.569 |
0.467 |
FAB-5 |
-0.347 |
0.658 |
FAB-6 |
-0.902 |
0.287 |
FAB-7 |
-0.756 |
0.499 |
Log (scale) |
0.190 |
0.013 |
Notes: *P<0.05, **P<0.01, ***P<0.001.
Table 5. Best Weibull-based AFT Model for Clinical Features
|
Coefficient |
P-value |
Intercept |
6.248 |
<0.001*** |
Abnormal lymphocyte percent |
0.033 |
0.072 |
Age |
-0.042 |
<0.001*** |
History of neoadjuvant trt |
-0.493 |
0.042* |
Blast count |
-0.006 |
0.134 |
Fraction of genome altered |
-8.984 |
<0.001*** |
FAB-1 |
0.525 |
0.492 |
FAB-2 |
0.703 |
0.274 |
FAB-3 |
-0.331 |
0.606 |
FAB-4 |
0.008 |
0.989 |
FAB-5 |
-0.055 |
0.929 |
FAB-6 |
-0.675 |
0.326 |
FAB-7 |
-0.919 |
0.274 |
Log (scale) |
-0.106 |
0.213 |
Notes: *P<0.05, ***P<0.001.
3.4.2 Models with Identified Genes
We will use 10 identified genes to fit Cox proportional hazard model and AFT model. The Weibull-based AFT model and lognormal-based AFT model will be considered. Then the stepwise method will be used to select the best model with the least AIC, respectively. The results will be shown in Tables 6-8.
Table 6. Best Cox Model for Identified Genes
|
Coefficient |
Exp (Coefficient) |
P-value |
PIK3CB |
-2.017e-04 |
0.999 |
0.102 |
PIM1 |
1.748e-04 |
1.000 |
0.002** |
MPO |
-1.997e-06 |
1.000 |
0.009** |
STAT5B |
-1.837e-04 |
0.998 |
0.042* |
Notes: *P<0.05, **P<0.01.
Table 7. Best Lognormal-based AFT Model for Identified Genes
|
Coefficient |
P-value |
Intercept |
1.84 |
<0.001*** |
PIK3CA |
1.49e-03 |
0.003** |
PIM1 |
-1.29e-04 |
0.046* |
MPO |
2.56e-06 |
<0.001*** |
Log (scale) |
2.90e-01 |
<0.001*** |
Notes: *P<0.05, **P<0.01, ***P<0.001.
Table 8. Best Weibull-based AFT Model for Identified Genes
|
Coefficient |
P-value |
Intercept |
2.50 |
<0.001*** |
PIK3CB |
2.24e-04 |
0.086 |
PIM1 |
-1.94e-04 |
<0.001*** |
MPO |
2.33e-06 |
0.004** |
STAT5B |
1.86e-04 |
0.039* |
Log (scale) |
4.09e-02 |
<0.623 |
Notes: *P<0.05, **P<0.01, ***P<0.001.
3.4.3 Models Combining Clinical Predictors and Identified Genes
Lastly, we will use 11 clinical predictors combining 10 identified genes to fit Cox proportional hazard model and AFT model. The Weibull-based AFT model and lognormal-based AFT model will be considered. Then the stepwise method will be used to select the best model with the least AIC, respectively. The results will be shown in Tables 9-11.
Table 9. Best Cox Model Combining Clinical Predictors and Genes
|
Coefficient |
Exp (Coefficient) |
P-value |
Abnormal lymphocyte percent |
-0.043 |
0.966 |
0.101 |
Age |
0.035 |
1.036 |
<0.001*** |
History of neoadjuvant trt |
0.558 |
1.747 |
0.030* |
Fraction of genome altered |
5.870 |
3.544 |
0.004** |
PIK3CA |
-1.209e-03 |
0.998 |
0.009** |
PIM1 |
1.115e-04 |
1.000 |
0.053 |
MPO |
-1.480e-06 |
1.000 |
0.04* |
Notes: *P<0.05, **P<0.01, ***P<0.001.
Table 10. Best Lognormal-based AFT Model Combining Clinical Predictors and Genes
|
Coefficient |
P-value |
Intercept |
3.98 |
<0.001*** |
Abnormal lymphocyte percent |
4.99e-02 |
0.011* |
Age |
-3.82e-02 |
<0.001*** |
Fraction of genome altered |
-4.61 |
0.036* |
PIK3CA |
1.54e-03 |
<0.001*** |
MAP2K1 |
-3.74e-04 |
0.088 |
PPARD |
1.47e-03 |
0.018* |
PIM1 |
-1.53e-04 |
0.012* |
MPO |
1.90e-06 |
0.003* |
Log (scale) |
0.190 |
0.106 |
Notes: *P<0.05, **P<0.01, ***P<0.001.
Table 11. Best Lognormal-based AFT Model Combining Clinical Predictors and Genes
|
Coefficient |
P-value |
Intercept |
4.46 |
<0.001*** |
Abnormal lymphocyte percent |
3.549e-02 |
0.062 |
Age |
-3.24e-02 |
<0.001*** |
Fraction of genome altered |
-6.54 |
<0.001*** |
History of neoadjuvant trt |
-6.37e-01 |
0.005** |
PIK3CB |
1.67e-04 |
0.155 |
PIM1 |
-1.46e-03 |
0.005* |
MPO |
9.24e-04 |
0.179 |
STAT5B |
2.22e-04 |
0.012* |
Log (scale) |
-0.11 |
0.209 |
Notes: *P<0.05, **P<0.01, ***P<0.001.
3.4.4 Prediction Accuracy Measures
The R-squared statistic and L-squared statistic will be used to evaluate the goodness of fit for our models. R-squared statistic is the proportion of explained variance, which shows the potential predictive power of the nonlinear prediction function. The L-squared statistic is defined as the proportion of explained prediction error, which shows the closeness of the prediction function to its corrected version. The R-squared statistic and L-squared statistic will be shown in Tables 12 and 13. The Cox model with combination was selected as the best model for its highest R-squared statistic. We found that combining identified genes and clinical features together gives more predictive power to the model. Also, notably only 7 predictors are included in our best model.
Table 12. R-squared Statistic for Models
|
Clinical |
Gene |
Combination |
Cox Model |
0.1200 |
0.1495 |
0.2585 |
Lognormal-based AFT model |
0.0071 |
0.0018 |
0.0354 |
Weibull-based AFT model |
0.0043 |
0.0022 |
0.0845 |
Table 13. L-squared Statistic for Models
|
Clinical |
Gene |
Combination |
Cox model |
0.3507 |
0.4244 |
0.3929 |
Lognormal-based AFT model |
0.9794 |
0.9847 |
0.9516 |
Weibull-based AFT model |
0.9822 |
0.9843 |
0.9031 |
3.4.5 Model Diagnostics
Cox-Snell residual plot is used to check for overall goodness of fit and Nelson-Aalen cumulative hazard rate is used as an estimator, which is mostly used in model diagnostics of multivariate Cox regression analysis[6]. The blue line is expected to be straight and from the Figure 4, we can conclude that our Cox model fits the data well.
|
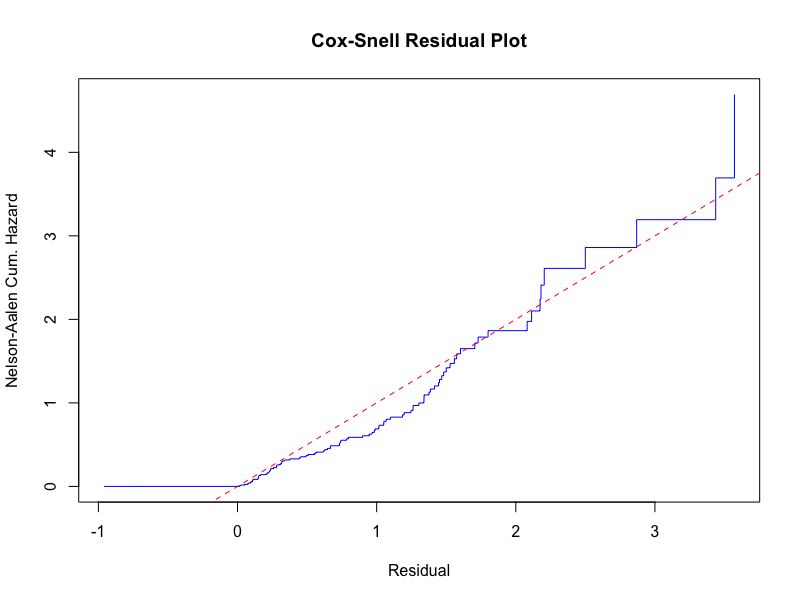
Figure 4. The model diagnostics for our best model is given by the Cox-Snell residual plot.
4 DISCUSSION
Over the past decade, substantial strides have been made in the genomic profiling of AML, leading to the identification of numerous genes with potential prognostic value[7-9]. Concurrently, various prognostic factors, including age, cytogenetic abnormalities, and white blood cell count, have been established as significant contributors to AML prognosis[10]. Nonetheless, the holistic assessment of the interplay between biomarkers and clinical characteristics, and their association with overall survival within public databases, necessitates the development of multivariate survival models.
In this study, we formulated and assessed a multivariate model incorporating four clinical features and three specific genes as the most effective prognostic model for AML. Several survival models were constructed, with their accuracy juxtaposed against that of the univariate survival model to ascertain enhanced prognostic capabilities. Notably, the Cox model integrating clinical attributes and identified genes emerged as the optimal choice in terms of the R-squared statistic. However, it’s noteworthy that the R-squared value of 0.2585 indicates room for improvement.
We acknowledge that our study is challenged by a relatively small sample size (analyzing 148 records) and a notably high censor rate of 37.84%, both of which impose limitations on our findings. Additionally, the modest availability of clinical predictors contributes to the observed lower prediction accuracy of our model. Importantly, the L-squared statistic stands at 0.3929, suggesting that model refinement may be warranted. Given the validation of numerous prognostic genes in specific cancer types through prior research, the integration of genetic insights with clinical information remains pivotal in advancing the precision of survival predictions for cancer patients.
5 CONCLUSION
In this project, our primary objective revolves around investigating the potential of enhancing survival time prediction for AML patients by integrating gene expression levels with clinical predictors. To achieve this, we gathered comprehensive gene expression profiles and clinical data pertaining to 173 AML patients sourced from TCGA database.
Our analytical approach encompassed the utilization of 11 distinct clinical attributes along with 61 genes meticulously curated from the KEGG disease-related pathway, which were considered as potential predictor variables. Through a log-rank test, we identified and filtered out 10 genes that demonstrated notable significance.
Furthermore, we observed significant variations in the survival function between two groups, categorized based on each of these 10 genes. To establish the most optimal predictive model, we harnessed the capabilities of the Cox proportional hazard model and the AFT model, employing lognormal and Weibull distributions. To enhance the predictive prowess of our models, we conducted variable selection using the stepwise method, focusing on achieving the least AIC.
Ultimately, to gauge the effectiveness of our approach, we employed the R-squared statistic to assess the prediction accuracy, providing a quantitative measure of the model’s performance in forecasting survival times for AML patients.
Acknowledgements
The results shown here are in whole or part based upon data generated by the TCGA Research Network: https://www.cancer.gov/ccg/research/genome-sequencing/tcga
Conflicts of Interest
The authors declare that they have no conflict of interest.
Author Contribution
Zhao W and Wang P wrote the manuscript. Zhao W and Wang P contributed to the original draft preparation, review and editing. All authors read and approved the manuscript for submission.
Abbreviation List
AML, Acute myeloid leukemia
AFT, Accelerated failure time
AIC, Akaike information criterion
BM, Bone marrow
FAB, French-American-British
KEGG, Kyoto Encyclopedia of Genes and Genomes
TCGA, The Cancer Genome Atlas
References
[1] Shallis RM, Wang R, Davidoff A et al. Epidemiology of acute myeloid leukemia: Recent progress and enduring challenges. Blood Rev, 2019; 36: 70-87. [DOI]
[2] De Kouchkovsky I, Abdul-Hay M. ‘Acute myeloid leukemia: a comprehensive review and 2016 update’. Blood Cancer J, 2016; 6: e441. [DOI]
[3] Kanehisa M, Goto S. KEGG: Kyoto Encyclopedia of Genes and Genomes. Nucleic Acids Res, 2000; 28: 27-30. [DOI]
[4] Li G, Wang X. Prediction Accuracy Measures for a Nonlinear Model and for Right-Censored Time-to-Event Data. J Am Stat Assoc, 2019; 114: 1815-1825. [DOI]
[5] Bland JM, Altman DG. The logrank test. BMJ, 2004; 328: 1073. [DOI]
[6] White IR, Royston P. Imputing missing covariate values for the Cox model. Stat Med, 2009; 28: 1982-1998. [DOI]
[7] Prada-Arismendy J, Arroyave JC, Röthlisberger S. Molecular biomarkers in acute myeloid leukemia. Blood Rev, 2017; 31: 63-76. [DOI]
[8] Pelcovits A, Niroula R. Acute Myeloid Leukemia: A Review. Rhode Isl Med J, 2020; 103: 38-40.
[9] Padmakumar D, Chandraprabha VR, Gopinath P et al. A concise review on the molecular genetics of acute myeloid leukemia. Leukemia Res, 2021; 111: 106727. [DOI]
[10] Costa AFO, Menezes DL, Pinheiro LHS et al. Role of new Immunophenotypic Markers on Prognostic and Overall Survival of Acute Myeloid Leukemia: a Systematic Review and Meta-Analysis. Sci Rep, 2017; 7: 4138. [DOI]
Copyright © 2023 The Author(s). This open-access article is licensed under a Creative Commons Attribution 4.0 International License (https://creativecommons.org/licenses/by/4.0), which permits unrestricted use, sharing, adaptation, distribution, and reproduction in any medium, provided the original work is properly cited.


