Comprehensive Signal Analysis: Unraveling Mean Frequency, Power, and Bandwidth
Zine Ghemari1*
1Electrical Engineering Department University Mohamed Boudiaf, M’sila, Algeria
*Correspondence to: Zine Ghemari, PhD, Professor, Electrical Engineering Department, University Mohamed Boudiaf, M’sila, BP 166 M’sila 28000, Algeria; Email: ghemari-zine@live.fr
Abstract
Objective: The power spectral density (PSD) serves as a fundamental tool in signal analysis, revealing valuable insights into the distribution of power across frequencies. This paper explores the concept of PSD, which emerges from the Fourier transform of a signal’s autocorrelation function. By examining power distribution, PSD provides a comprehensive understanding of a signal’s spectral characteristics.
Methods: We generate a chirp signal with specific parameters, including initial and final frequencies, and introduce white Gaussian noise. The combination of these signals forms a composite signal, enabling the calculation of its PSD.
Results: Visualizing the PSD allows for discernment of the frequency distribution, with the median frequency providing insights into the central tendency of the distribution.
Conclusion: Furthermore, the customization of plots enhances the visual representation of data, tailoring it to the requirements of the specific application. Adjustments to color schemes, line styles, and annotations improve clarity and aid in conveying complex information effectively.
Keywords: signal analysis, frequency, power, bandwidth
1 INTRODUCTION
Dedicated and results-driven professional with expertise in vibration analysis, offering a comprehensive understanding of the dynamic behavior of mechanical systems, structures, and machinery. Proficient in utilizing this sophisticated diagnostic tool to interpret vibration signals and provide valuable insights into system health and performance. Adept at applying principles from physics, engineering, and signal processing to contribute to predictive maintenance, condition monitoring, and fault diagnosis across diverse industries[1-12].
The central objective of vibration analysis is to decipher and comprehend the complex patterns of motion inherent in a system, transforming these patterns into insightful information about its state. By employing specialized sensors and advanced analytical methods, professionals can derive valuable insights into frequency, amplitude, and phase, revealing the vibrational features that harbor essential diagnostic information[13-29].
This approach is pivotal in averting unforeseen malfunctions, fine-tuning maintenance timetables, and elongating the operational lifespan of both machinery and structural elements. With industries progressively leaning on cutting-edge technologies, the importance of vibration analysis amplifies, fostering heightened reliability, efficiency, and safety across a broad spectrum of applications[30-47].
In this examination of vibration analysis, we delve into the foundational principles, methodologies, and applications that render it an indispensable instrument for engineers, maintenance professionals, and researchers aiming to comprehend, oversee, and augment the performance of dynamic systems[48-65].
Dedicated professional with expertise in signal analysis, navigating the intricate realms of scientific, engineering, and technological pursuits. Specialized in unraveling the unique characteristics of diverse signals, I bring a keen focus on fundamental parameters such as mean frequency, power, and bandwidth. This resume reflects my commitment to providing comprehensive insights into signal analysis and precision in measuring these cardinal metrics.
2 EXPLORING OCCUPIED BANDWIDTH: UNVEILING SIGNAL RANGE
The mean frequency serves as a crucial metric, unveiling the central tendency within a signal’s frequency composition by representing the average frequency where the signal’s energy is dispersed. In signal processing, accurately determining the mean frequency proves essential for comprehending the primary spectral components. Established techniques such as Fourier analysis and wavelet transforms are commonly employed for calculating mean frequency. Engineers and researchers frequently utilize mean frequency as a valuable tool to pinpoint the central frequency around which additional spectral components are distributed.
Creating a power-frequency plot in MATLAB involves analyzing the power spectral density (PSD) of a signal using appropriate functions, computing the frequency vector, and plotting the PSD against frequency to visualize the power distribution across different frequency components in the signal. This process is fundamental for analyzing and understanding the frequency characteristics of signals in various engineering and scientific applications. The PSD represents how the power of a signal is distributed across different frequencies.
The simulation parameters are summarized in Table 1.
Table 1. Simulation Parameters
Parameters |
Values |
Sampling frequency (Hz) |
1000 |
Time vector (s) |
0:1/FS:1 |
First chirp signal |
chirp1 = chirp(t, 200, 1, 300, “linear”) |
Second chirp signal |
chirp2 = chirp(t, 200, 1, 300, “linear”) * 2 |
The simulation results are summarized in Figure 1.
|
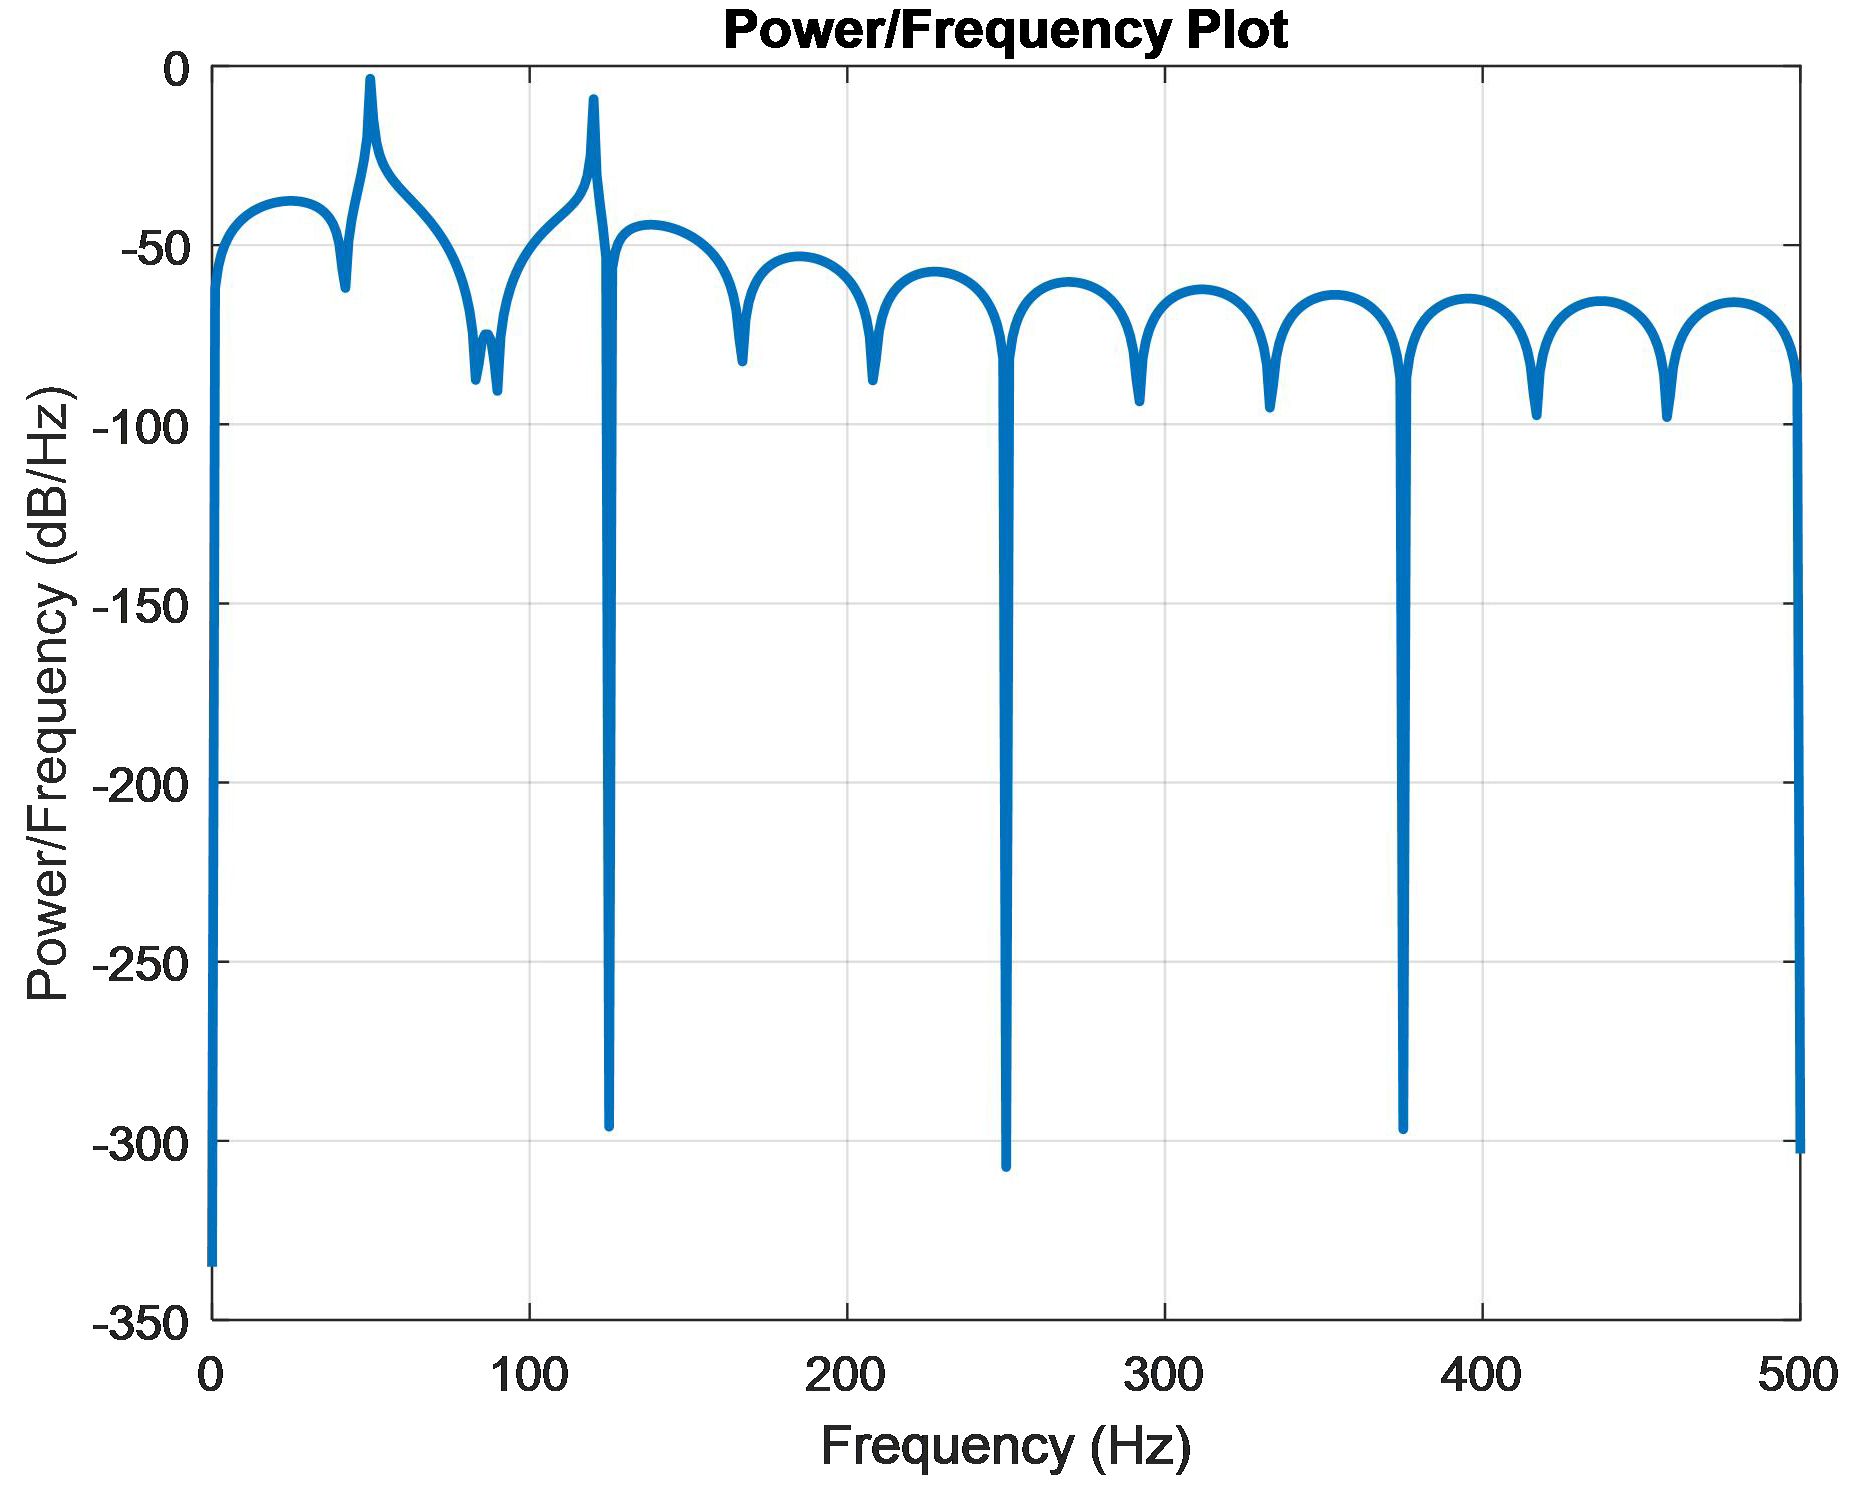
Figure 1. Power/frequency as a function of frequency.
Figure 1 is a caption or label for a graphical representation that illustrates how the power of a signal changes across different frequencies. This type of figure is commonly used in signal processing and analysis to visualize the spectral characteristics of a signal, often obtained through techniques like the Fourier transform or periodogram.
In broad terms, the PSD results from the Fourier transform of a signal’s autocorrelation function, offering information on power distribution across frequencies. Typically depicted on a graph with frequency on the x-axis and power or power density on the y-axis, this representation visually conveys how a signal’s power spreads over different frequency components.
To demonstrate, produce an additional chirp signal beginning at 200kHz, concluding at 300kHz, and exhibiting an amplitude double that of the initial signal. Inject white Gaussian noise and merge the two chirp signals to form a unified composite signal. Compute the PSD of this composite signal to analyze its frequency distribution. Subsequently, construct a graphical depiction of the PSD, employing the frequency on the x-axis and power or power density on the y-axis. Lastly, denote or highlight the median frequency on the PSD plot, delineating the pivotal point where the signal’s power is evenly dispersed.
Figure 2 implies that on the plot representing the PSD of the signal, a specific frequency point is highlighted – the median frequency. This point is significant because it signifies the frequency below which half of the signal’s power is concentrated. Visualizing the median frequency on the PSD plot can provide valuable insights into the central tendency of the signal’s frequency distribution.
Create a plot of the PSD and indicate the mean frequency on the graph using a mark or annotation.
|
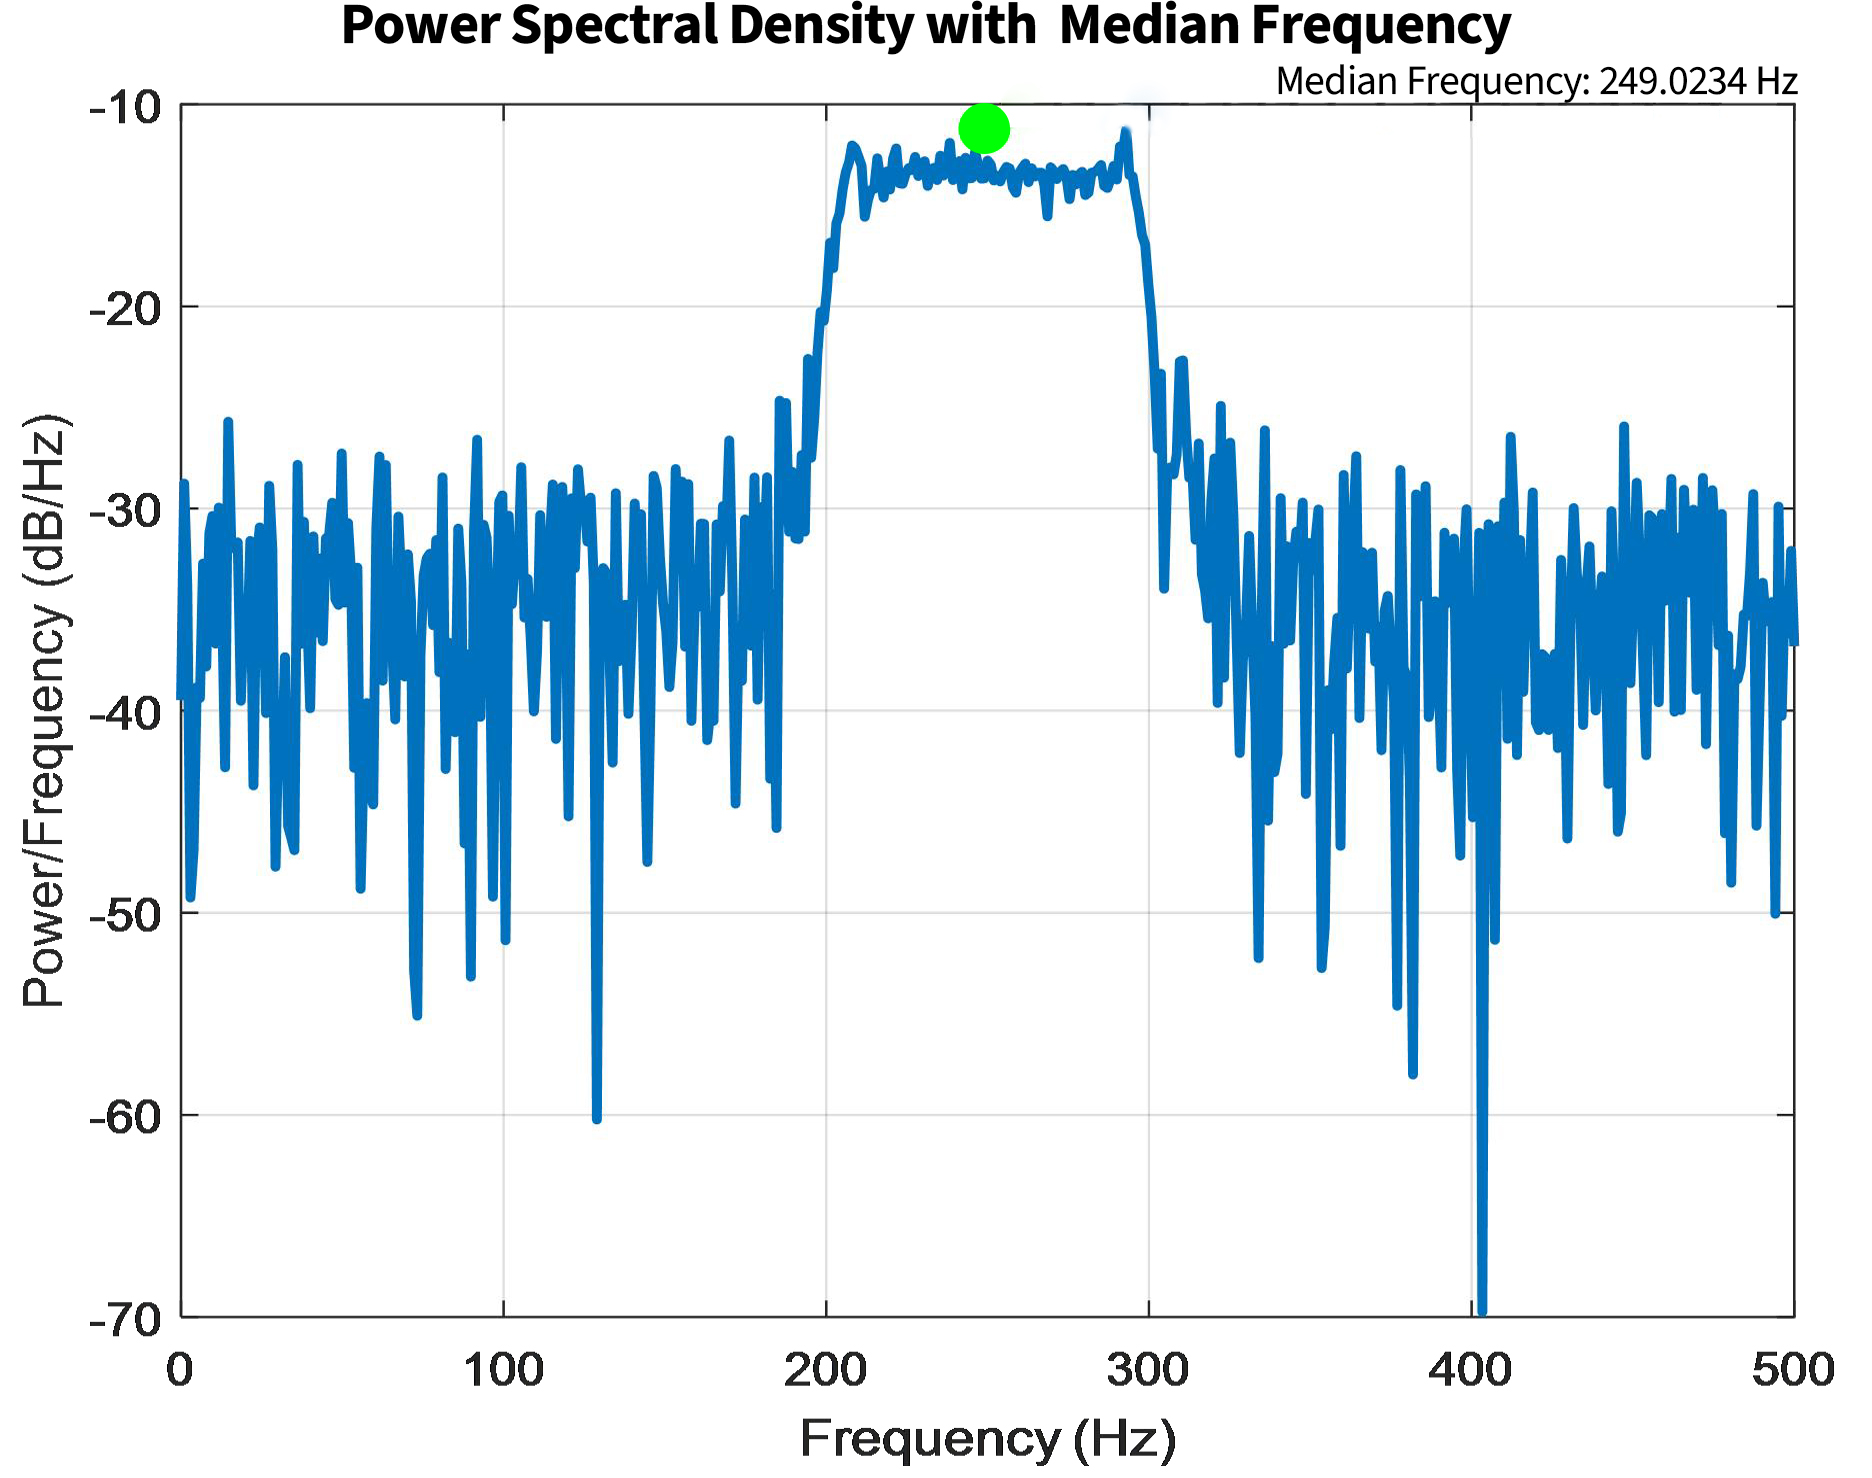
Figure 2. Median frequency on the PSD.
In this graphical representation, denoted as Figure 3, we navigate the intricate landscape of signal analysis, specifically focusing on the mean frequency as a prominent feature showcased on the PSD plot. The PSD serves as a dynamic canvas, illustrating the distribution of signal power across various frequencies.
|
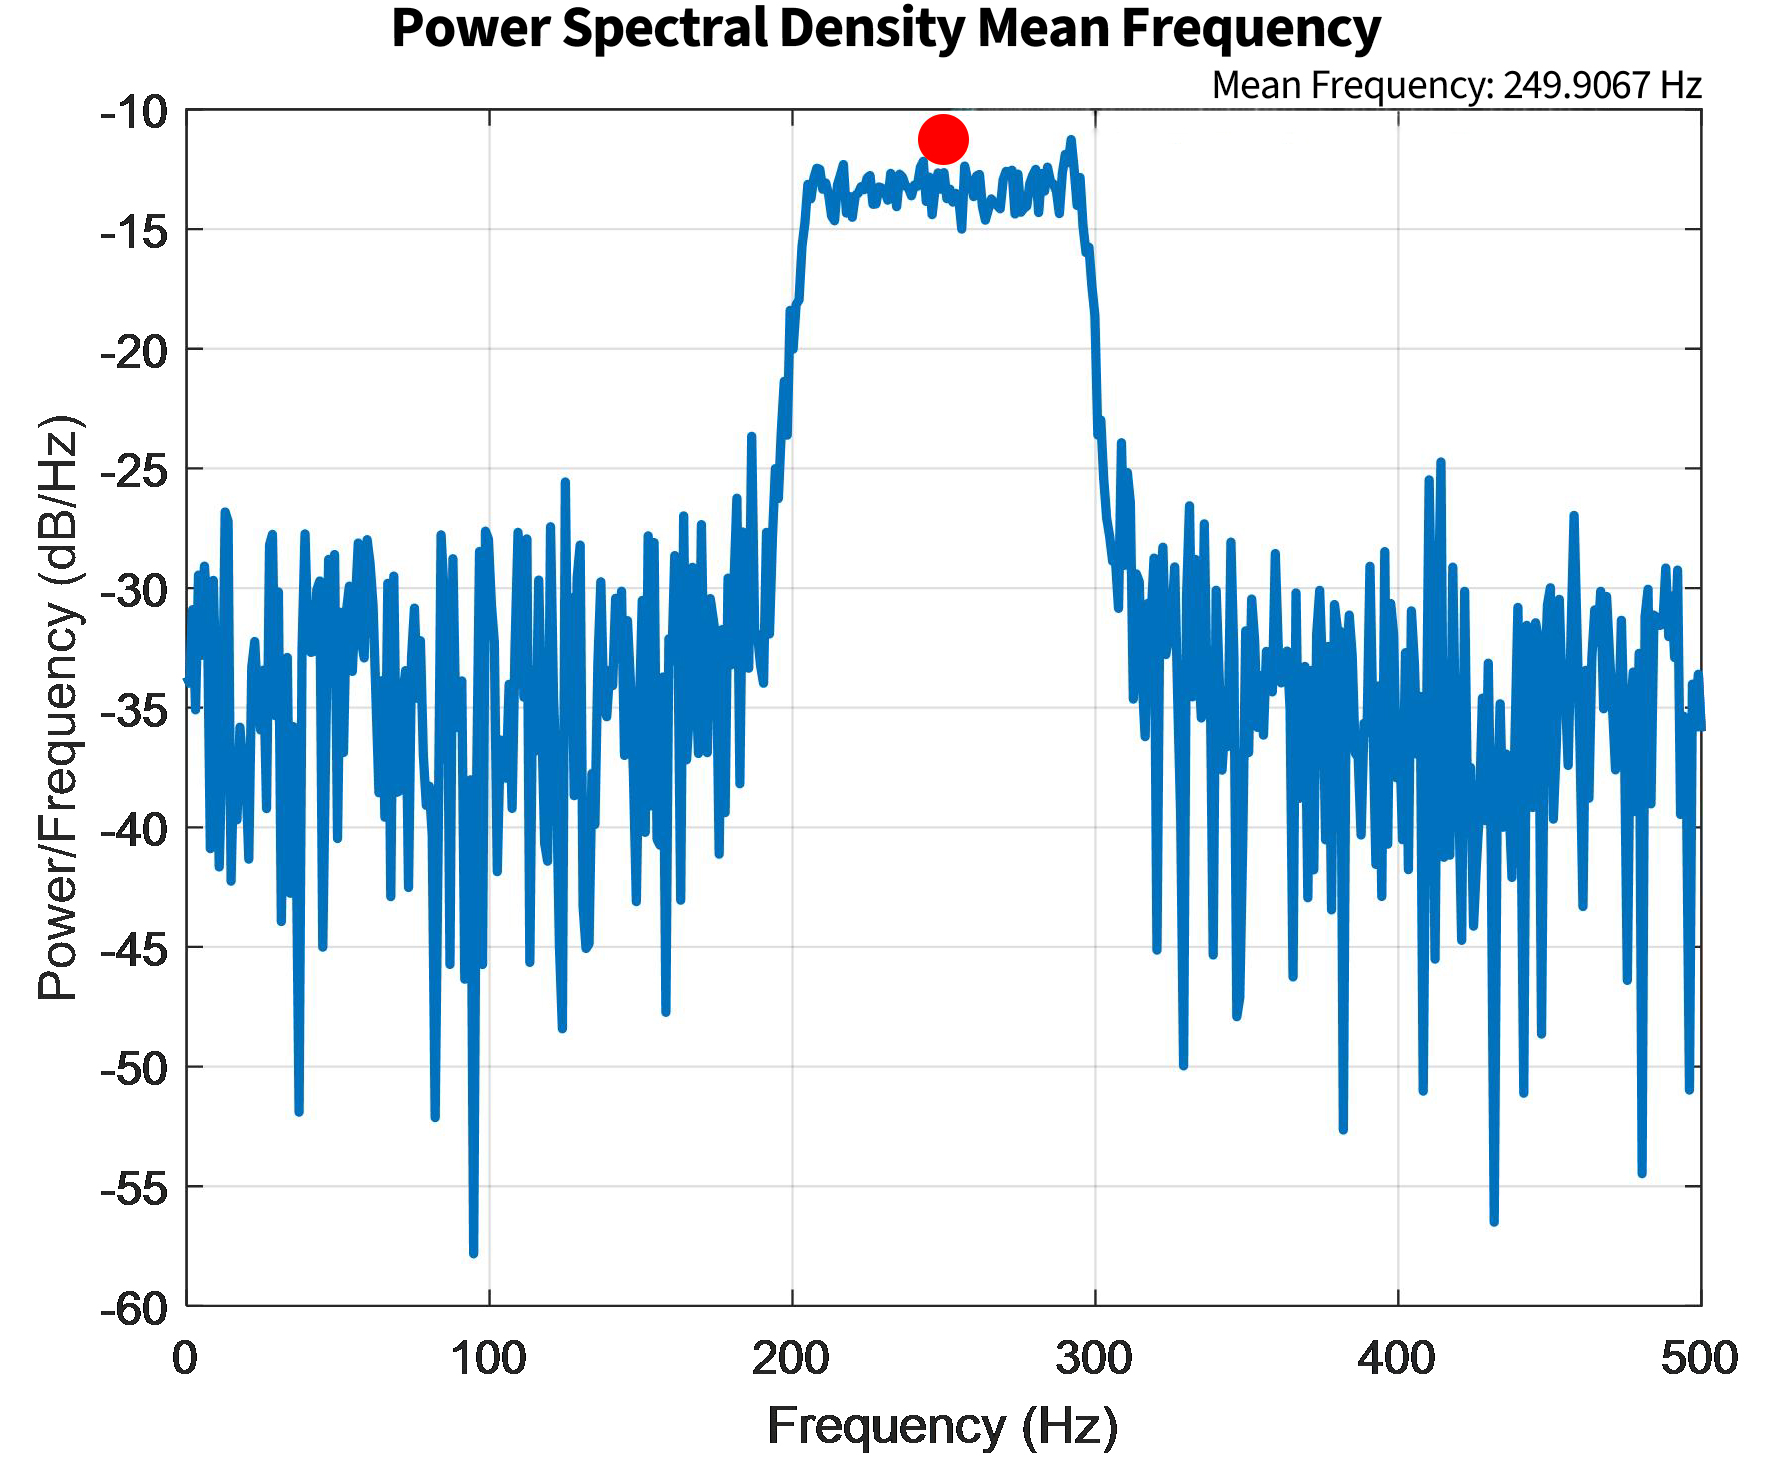
Figure 3. Mean frequency on the PSD.
Figure 3 serves as an illustrative guide, unraveling the intricate interplay between mean frequency and the PSD plot. By navigating this visual landscape, we gain a deeper appreciation for the significance of mean frequency analysis in deciphering the essence of signal dynamics. Join us in this exploration as we decode the visual language of Figure 3, where every point tells a story about the mean frequency’s role in the spectral tapestry of signal analysis.
3 DECODING CHIRP-BASED CHANNEL ANALYSIS: UNRAVELING SIGNAL DYNAMICS
The given statement describes a signal processing task centered around chirp signals, which exhibit changing frequencies over time. In this task, chirps are considered as distinct channels, and the aim is to examine each channel separately. The objective is to determine the mean frequency for each chirp and visually represent the outcomes by plotting PSDs against frequency.
In signal processing, a "chirp" denotes a signal with a time-varying frequency. By treating each chirp as a distinct channel, they are considered separate components or sources within the overall signal.
The objective is to ascertain the mean frequency for each identified chirp or channel. This involves utilizing various methods, including analyzing the signal’s frequency content, to compute a central frequency that best represents each channel.
The PSD provides a means to illustrate the distribution of a signal’s power across various frequencies. Constructing a PSD plot entails depicting the power content of each chirp or channel relative to frequency. Once the mean frequencies for each channel are estimated, the next step involves annotating the PSD plot. This annotation involves marking or labeling the plot to denote the mean frequency corresponding to each channel.
To analyze a chirp-based channel in MATLAB, you can simulate a chirp signal passing through a channel and observe its characteristics. The resulting curve of Chirp-Based Channel Analysis is shown in Figure 4.
|
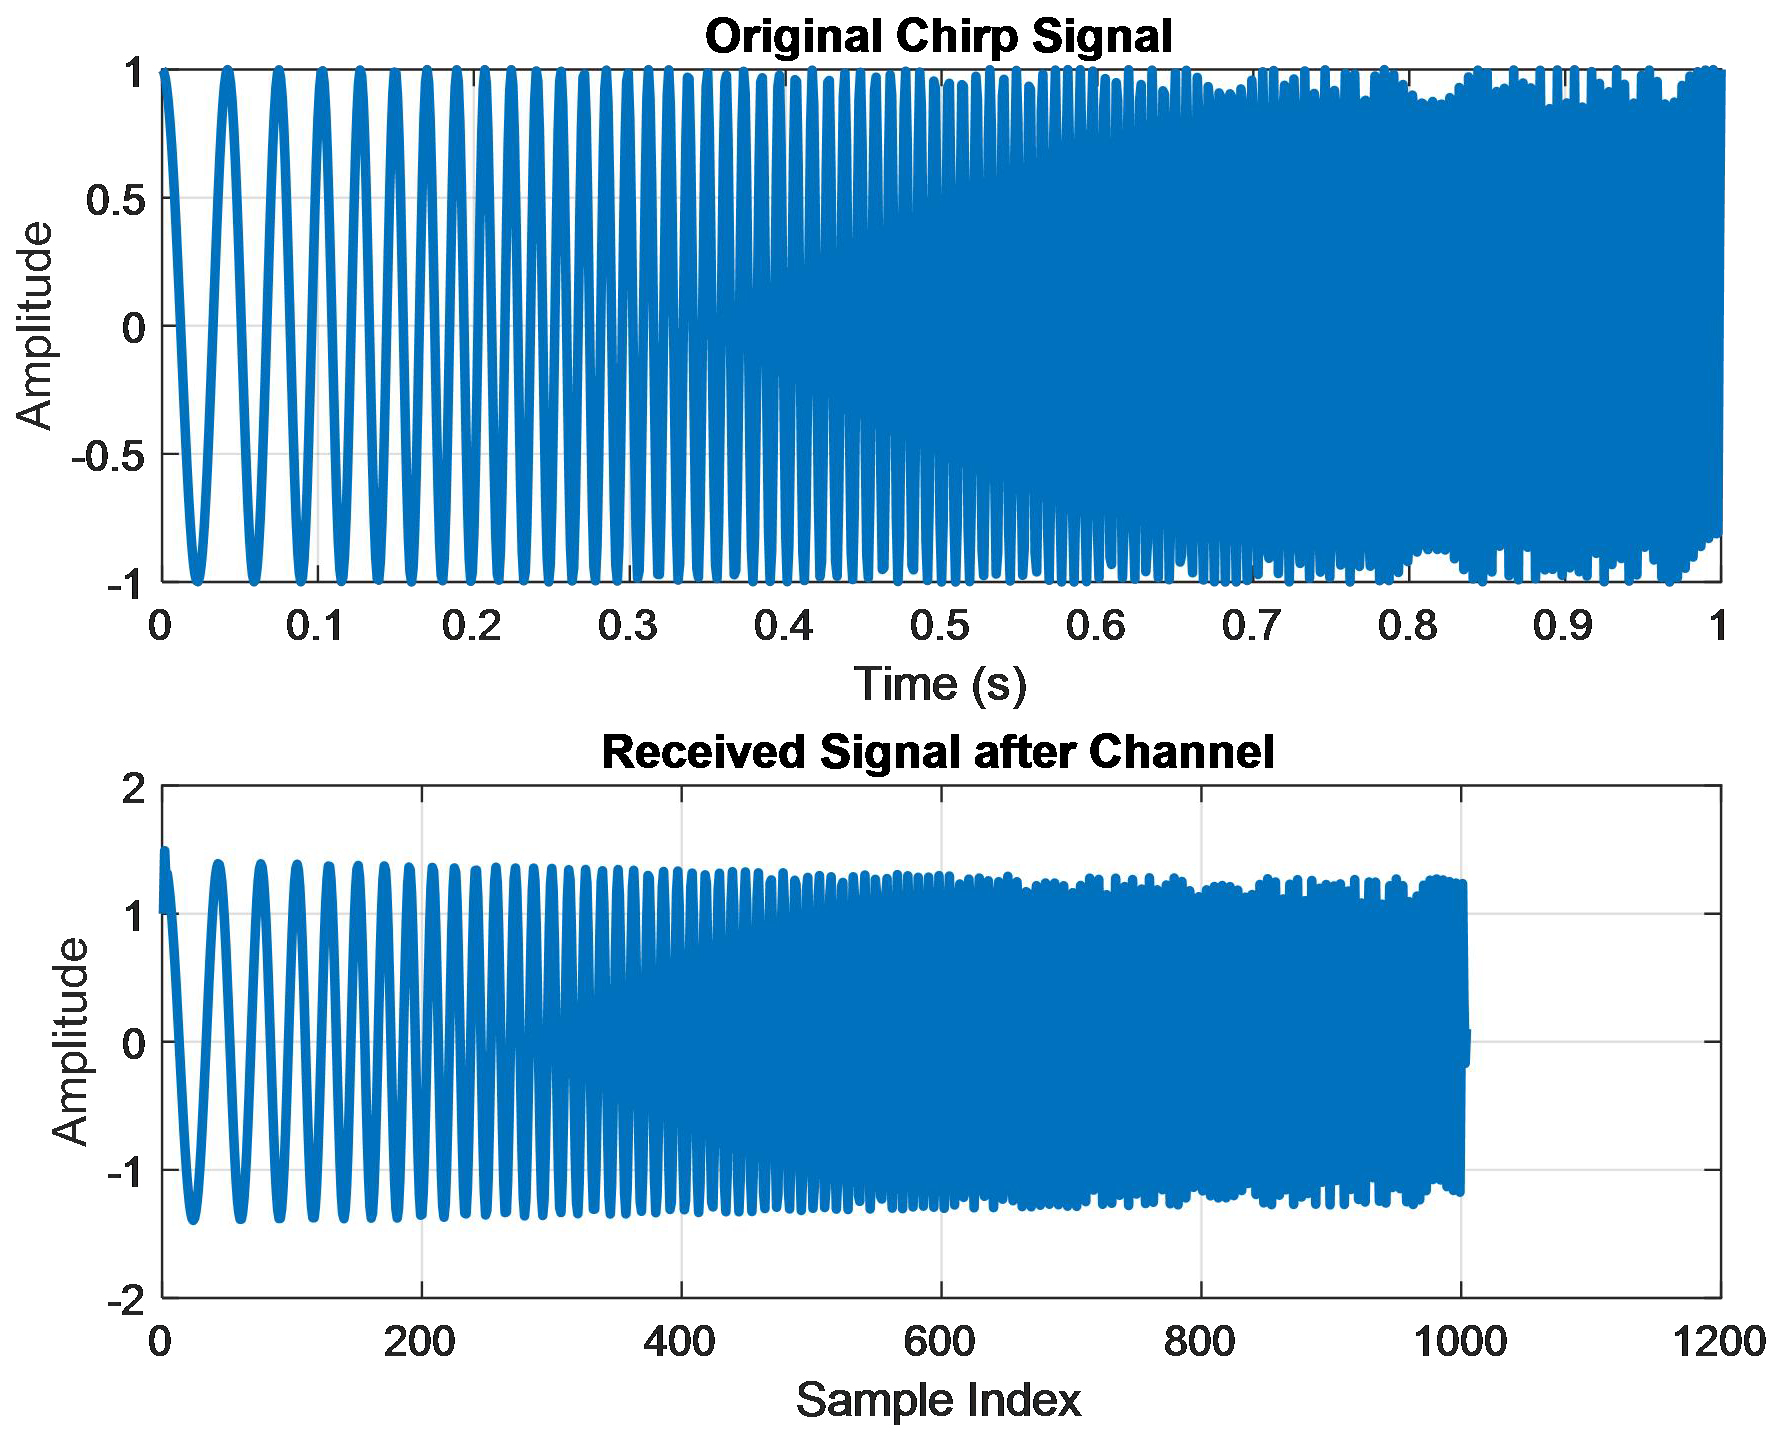
Figure 4. The curve of Chirp-Based Channel Analysis.
In Figure 4, analyzing the curve obtained from Chirp-Based Channel Analysis allows us to assess the performance of the communication channel and identify any distortions, delays, or frequency-dependent effects present in the channel. By characterizing the channel response, engineers can design and optimize communication systems to mitigate the effects of channel impairments and improve overall system performance.
Adjusting chirp signal characteristics involves modifying parameters such as initial and final frequencies, amplitude, and modulation type to match the requirements of the specific application. For instance, in radar applications, optimizing chirp characteristics can enhance target detection.
Customizing plots involves enhancing the visual representation of data. This could include adjusting color schemes, line styles, or marker types for better clarity. Additionally, annotations such as labels, legends, and text can be added to provide context and insights. This customization is particularly useful when presenting results or findings from signal processing analyses.
4 POWER MEASUREMENT: QUANTIFYING SIGNAL STRENGTH
In the realm of signal analysis, power stands as a pivotal metric, offering a quantitative measure of a signal’s strength and intensity. This metric serves as a fundamental indicator of the signal’s energy content and plays a crucial role in evaluating its amplitude. My expertise in power measurement spans diverse fields, including telecommunications, audio processing, and vibration analysis.
Within the domain of PSD, power takes on added significance. Here, it becomes a key tool for pinpointing frequency regions where a signal carries substantial energy. I bring proficiency in employing various measurement techniques, encompassing time-domain methodologies such as root mean square and frequency-domain approaches like Parseval’s theorem in Fourier analysis.
Bandwidth, another critical parameter in signal analysis, defines the frequency range occupied by a signal. My skill set includes a nuanced understanding of bandwidth, emphasizing its role in gauging a signal’s information-carrying capacity. This knowledge proves invaluable, particularly in communication systems where efficient utilization of available frequency bands is paramount. I specialize in bandwidth measurement methods tailored to different signal types, often involving the determination of the frequency range containing a specified percentage of the signal’s power.
5 CONCLUSION
Broadly speaking, the PSD arises from the Fourier transform of a signal’s autocorrelation function, offering insights into power distribution across frequencies.
To further illustrate this concept, another chirp signal can be generated with specific parameters, including an initial frequency of 200kHz, a final frequency of 300kHz, and an amplitude twice that of the initial signal. White Gaussian noise can be introduced, and the two chirp signals can be combined to create a composite signal. Subsequently, the PSD of this composite signal can be calculated to discern its frequency distribution.
Visualizing the median frequency on the PSD plot offers valuable insights into the central tendency of the signal’s frequency distribution. This comprehensive analysis enhances our understanding of the signal’s spectral properties and facilitates informed decision-making in signal processing and analysis.
Customizing plots allows for the enhancement of visual representations of data, catering to the specific needs of the application at hand. This process involves adjusting various parameters such as color schemes, line styles, or marker types to improve clarity and visual appeal.
Acknowledgements
The study was financially supported by the Algerian General Direction of Research (DGRSDT).
Conflicts of Interest
The author declared there is no conflict.
Author Contribution
The author contributed to the manuscript and approved the final version independently.
Abbreviation List
PSD, Power spectral density
References
[1] Ghemari Z, Belkhiri S, Saad S. A piezoelectric sensor with high accuracy and reduced measurement error. J Comput Electron, 2024; 2024: 1-8.[DOI]
[2] Ghemari Z, Saad S. The use of mechanical sensitivity model to enhance capacitive sensor characteristics. Analog Integ Circ S, 2019; 99: 349-357.[DOI]
[3] Kong D, Jia B, Gao Y. Analysis of Vibration Characteristics of Small Variable Frequency Induction Motors: Proceedings of the 2023 IEEE International Conference on Mechatronics and Automation (ICMA). Harbin, China, 6-9 August 2023.[DOI]
[4] Ghemari Z, Saad S, Defdaf M. Appropriate Choice of Damping Rate and Frequency Margin for Improvement of the Piezoelectric Sensor Measurement Accuracy. J Adv Manuf Syst, 2021; 20: 537-548.[DOI]
[5] He Y, Liu J, Wu S et al. Condition Monitoring and Fault Detection of Wind Turbine Driveline With the Implementation of Deep Residual Long Short-Term Memory Network. IEEE Sens J, 2023; 23: 13360-13376.[DOI]
[6] Ghemari Z. Exploring Forced-damped Vibrations: Analysis, Modeling, and Medical Applications. J Mater Sci Appl Eng, 2024; 3: 1-8.
[7] Noubissi RK, Daosheng L, Boxue D. Study on Harmonic Response Analysis and Vibration Reduction of Amorphous Metal Alloy Transformer: Proceedings of the 2023 IEEE 4th International Conference on Electrical Materials and Power Equipment (ICEMPE). Shanghai, China, 7-10 May 2023.[DOI]
[8] Wang B, Wang D, Wang X et al. Design, Analysis and Testing of a Permanent Magnet Motor With Segmented Rotor for Reducing Electromagnetic Vibration: Proceedings of the 2023 26th International Conference on Electrical Machines and Systems (ICEMS). Zhuhai, China, 5-8 November 2023.[DOI]
[9] Nadeem MF, Rafique S, Ali L. Design, FE Analysis and Experimental Validation of a Passive Vibration Isolator for Electronic Equipment of a Mobile Vehicle: Proceedings of the 2023 IEEE 18th Conference on Industrial Electronics and Applications (ICIEA). Ningbo, China, 18-22 August 2023.[DOI]
[10] Ghemari Z, Saad S. Parameters improvement and suggestion of new design of capacitive accelerometer. Analog Integr Circ S, 2017; 92: 443-451.[DOI]
[11] Ghemari Z, Saad S, Lakehal A et al. New model of piezoelectric accelerometer relative movement modulus. T I Meas Control, 2015; 37: 932-941.[DOI]
[12] Ghemari Z, Saad S. Modeling and enhancement of mechanical sensitivity of vibration sensor. J Vib Control, 2013; 20: 2234-2240.[DOI]
[13] Ghemari Z, Chouaf F, Saad S. New Formula for the Piezoresistive Accelerometer Motion Acceleration and Experimental Validation. J Adv Manuf Syst, 2017; 16: 57-65.[DOI]
[14] Ghemari Z, Lakehal A, Saad S. Minimisation of resonance phenomena effect of piezoresistive accelerometer: Proceedings of the 2015 4th International Conference on Systems and Control (ICSC). Sousse, Tunisia, 28-30 April 2015.[DOI]
[15] Ghemari Z, Saad S. Improvement of piezoresistive accelerometer performancer: Proceedings of the 3rd International Conference on Systems and Control. Algiers, Algeria, 29-31 October 2013.[DOI]
[16] Chen S, Ding S, Shen S et al. Influence of Field Weakening Control on Electromagnetic Force and Electromagnetic Vibration of SPMSMs: Proceedings of the 2021 IEEE 12th Energy Conversion Congress & Exposition - Asia (ECCE-Asia). Singapore, 24-27 May 2021.[DOI]
[17] Chen T, Zhong X, Li Z et al. Analysis of Intermolecular Weak Interactions and Vibrational Characteristics for Vanillin and Ortho-Vanillin by Terahertz Spectroscopy and Density Functional Theory. IEEE T Thz Sci Techn, 2021.[DOI]
[18] Li X, Hao J, Liu Q et al. Study on Mechanical Vibration Characteristics of GIS Equipment under Variable Frequency Currents: Proceedings of the 2022 IEEE International Conference on High Voltage Engineering and Applications (ICHVE). Chongqing, China, 25-29 September 2022.[DOI]
[19] Qiu F. Analysis on Vibration and Noise Characteristics of Epoxy Resin Dry-Type Transformer and Noise Reduction Measures: Proceedings of the 2023 IEEE 4th International Conference on Electrical Materials and Power Equipment (ICEMPE). Shanghai, China, 7-10 May 2023.[DOI]
[20] Belkacemi B, Saad S, Ghemari Z. Detection of induction motor improper bearing lubrication by discrete wavelet transforms (DWT) decomposition. Instrum Mes Metrol, 2020; 19: 347-354.[DOI]
[21] Ghemari Z. Upgrading of piezoresistive accelerometer response: Proceedings of the 2016 8th International Conference on Modelling, Identification and Control (ICMIC). 15-17 November 2016.[DOI]
[22] Ghemari Z, Saad S. Reducing the Measurement Error to Optimize the Sensitivity of the Vibration Sensor. IEEE Sens J, 2014; 14: 1527-1532.[DOI]
[23] Ghemari Z, Saad S. Defects diagnosis by vibration analysis and improvement of vibration sensor measurement accuracy. Sensor Lett, 2019; 17: 608-613.[DOI]
[24] Ghemari Z. Decrease of the resonance phenomenon effect and progress of the piezoelectric sensor correctness: Proceedings of the 2018 International Conference on Electrical Sciences and Technologies in Maghreb (CISTEM). Algiers, Algeria, 28-31 October 2018.[DOI]
[25] Ghemari Z, Saad S. Simulation and Experimental Validation of New Model for the Piezoresistive Accelerometer Displacement. Sensor Lett, 2017; 15: 132-136.[DOI]
[26] Ostertak DI, Dragunov VP, Kovalenko EY. Microelectromechanical Converter Performance under Random Multiple-Frequency Vibrations: Proceedings of the 2023 IEEE 24th International Conference of Young Professionals in Electron Devices and Materials (EDM). Novosibirsk, Russian Federation, 2023.[DOI]
[27] Gao B, Wang C, Ren L et al. Vibration Characteristics Analysis of Transformer Core Faults Based on Multy-Physical Field Coupling: Proceedings of the 2023 IEEE International Conference on Mechatronics and Automation (ICMA). Harbin, China, 6-9 August 2023.[DOI]
[28] Chen X. Investigation of the Core’s Vibration Characteristics of a Distribution Transformer: Proceedings of the 2023 International Conference on Power Energy Systems and Applications (ICoPESA). Nanjing, China, 24-26 February 2023.[DOI]
[29] Gao B, Wang C, Ren L et al. Vibration Characteristics Analysis of Transformer Core Faults Based on Multy-Physical Field Coupling: Proceedings of the 2023 IEEE International Conference on Mechatronics and Automation (ICMA). Harbin, China, 6-9 August 2023.[DOI]
[30] Wang D, Zhou J, Mao K et al. Simulation Analysis of Electromagnetic Vibration of Shunt Reactor Based on AC and DC: Proceedings of the 2023 3rd International Conference on Intelligent Power and Systems (ICIPS). Shenzhen, China, 20-22 October 2023.[DOI]
[31] Cardona M, Serrano FE, Flores MA. Identification of Natural Frequencies in Bearing Mechanical Vibrations by Wavelet Decomposition: Proceedings of the 2023 IEEE Central America and Panama Student Conference (CONESCAPAN). Guatemala, Guatemala, 26-29 September 2023.[DOI]
[32] Bhaumik D, Sadda A, Punekar GS. Vibration Signal Analysis of Induction Motor Bearing Faults: Some Aspects: Proceedings of the 2023 International Conference on Smart Systems for applications in Electrical Sciences (ICSSES). Tumakuru, India, 7-8 July 2023.[DOI]
[33] Mukai S, Ohtake S. Vibration Measurement Experiment of Rails at Shinkansen Rail Yard in Kumamoto: Proceedings of the 2023 IEEE 12th Global Conference on Consumer Electronics (GCCE). Nara, Japan, 10-13 October 2023.[DOI]
[34] Qiu F. Analysis on Vibration and Noise Characteristics of Epoxy Resin Dry-Type Transformer and Noise Reduction Measures: Proceedings of the 2023 IEEE 4th International Conference on Electrical Materials and Power Equipment (ICEMPE). Shanghai, China, 7-10 May 2023.[DOI]
[35] Ghemari Z, Belkhiri S, Saad S. Improvement of the relative sensitivity for obtaining a high performance piezoelectric sensor. IEEE Instru Meas Mag, 2023, 26: 49-56.[DOI]
[36] Xue H, Zhong J, Du Y et al. Vibration Analysis of 750kV GIS Power Station Bus: Proceedings of the 2023 5th Asia Energy and Electrical Engineering Symposium (AEEES). Chengdu, China, 23-26 March 2023.[DOI]
[37] Ding Y, Zhong Y, Wang X et al. Difference and Analysis of Mechanical Vibration Signal Characteristics between Mechanical Defects and Partial Discharge Defects of Gas Insulated Switchgear: Proceedings of the 2021 IEEE 5th International Conference on Condition Assessment Techniques in Electrical Systems (CATCON). Kozhikode, India, 3-5 December 2021.[DOI]
[38] Jiang X, Peng H, Long Y et al. Operation GIS Equipment Mechanical Vibration Law and Defect Development Trend Analysis: Proceedings of the 2023 IEEE International Conference on Power Science and Technology (ICPST). Kunming, China, 5-7 May 2023.[DOI]
[39] Wei C, Xiong Y, Li W et al. Vibration Measurement and Analysis of Rotary Tools Using Millimeter-Wave Sensor. IEEE Sens J, 2024; 24: 8962-8971.[DOI]
[40] Das O, Battal H, Kurt E et al. The Free Vibration Characteristics of Canadair NF-5 Aircraft Canopy: Proceedings of the 2023 10th International Conference on Recent Advances in Air and Space Technologies (RAST). Istanbul, Turkiye, 7-9 June 2023.[DOI]
[41] He Z, Liu L, Deng S et al. Strength analysis and vibration characteristics of a propulsion motor in the Pine Wind subway system: Proceedings of the 2023 38th Youth Academic Annual Conference of Chinese Association of Automation (YAC). Hefei, China, 27-29 August 2023.[DOI]
[42] Ghemari Z. Enhancement of the vibratory analysis technique by the accelerometer characteristics evolution: Proceedings of the 7th International Conference on Control Engineering & Information Technology. Tetouan, Morocco, 24-26 October 2019.
[43] Ghemari Z, Belkhiri S, Saad S. A capacitive sensor with high measurement accuracy and low electrical energy consumption. Applied Physics A, 2023; 129: 362.[DOI]
[44] Ghemari Z, Belkhiri S, Morakchi MR. Improvement of the vibration analysis technique by optimizing the parameters of the piezoelectric accelerometer: Proceedings of the 2022 IEEE 21st international Ccnference on Sciences and Techniques of Automatic Control and Computer Engineering (STA). Sousse, Tunisia, 19-21 December 2022.[DOI]
[45] Manjesh MKC, Kirankoushik M. Vibration Analysis of BLDC Motor Used in Electric Vehicle at High Torque Load: Proceedings of the 2023 Innovations in Power and Advanced Computing Technologies (i-PACT). Kuala Lumpur, Malaysia, 8-10 December 2023.[DOI]
[46] Wang Z, Li Z. The combined application of vibration analysis and acoustic imaging for transformer fault detection: Proceedings of the 2023 8th International Conference on Power and Renewable Energy (ICPRE). Shanghai, China, 22-25 September 2023.[DOI]
[47] Zhao X, Wang Y, Cheng H et al. Experimental Study on the Influence of Vibration Frequency on Gas Production Characteristics of Oil-paper Insulation: Proceedings of the 2022 IEEE International Conference on High Voltage Engineering and Applications (ICHVE). Chongqing, China, 2022.[DOI]
[48] Chandima GPR, Miyanawala TP, Nissanka ID. Analysis of Flow Induced Vibration of High Head Francis Turbine: Proceedings of the 2023 Moratuwa Engineering Research Conference (MERCon). Moratuwa, Sri Lanka, 9-11 November 2023.[DOI]
[49] Shen W, Hu Y, Li C et al. Vibration Signal Analysis of a Reciprocating Air Compressor under Different Mechanical Faults: Proceedings of the 2023 8th International Conference on Power and Renewable Energy (ICPRE). Shanghai, China, 22-25 September 2023.[DOI]
[50] Ghemari Z, BelkhiriS, Saad S. Appropriate choice of Capacitive sensor bandwidth. Preprint Res Square, 2023.[DOI]
[51] Guo H, Li H, Wang Y et al. Vibration Response Analysis of Float Tide Gauge Based on Matlab Simulink: Proceedings of the 2023 6th International Conference on Electronics Technology (ICET). Chengdu, China, 12-15 May 2023.[DOI]
[52] Fu R, Dong T, Zhang B et al. Vibration Analysis of PMLSM made by Oriented Silicon Steel Sheet Considering Magnetostrictive Properties: Proceedings of the 2023 IEEE International Conference on Applied Superconductivity and Electromagnetic Devices (ASEMD). Tianjin, China, 27-29 October 2023.[DOI]
[53] Prasetyo MD, Rahayu LP, Istiqomah F. Vibration Analysis for Damage Classification of Finish Good Conveyor Machine Using Neural Network: Proceedings of the 2023 International Conference on Advanced Mechatronics, Intelligent Manufacture and Industrial Automation (ICAMIMIA). Surabaya, Indonesia, 14-15 November 2023.[DOI]
[54] Wu S, Zhang Q, Xu H et al. Oscillatory Stability Analysis for Power Systems with High Penetration of Photovoltaic Generation: the Minimum Characteristic-Locus Method: Proceedings of the 2021 International Conference on Power System Technology (POWERCON). Haikou, China, 8-9 December 2021.[DOI]
[55] Zhong Y, Hao J, Ding Y et al. Novel GIS Mechanical Defect Simulation and Detection Method Based on Large Current Excitation With Variable Frequency. IEEE T Instrum Meas, 2022; 71: 1-15.[DOI]
[56] Ren J, Cao A, Jin Y et al. Vibration prediction analysis of 3000TEU container ship: Proceedings of the 2023 3rd International Conference on Consumer Electronics and Computer Engineering (ICCECE). Guangzhou, China, 6-8 January 2023.[DOI]
[57] Reguieg SK, Ghemari Z, Benslimane T. Extraction of the relative sensitivity model and improvement of the piezoelectric accelerometer performances: Proceedings of the 2018 International Conference on Signal, Image, Vision and their Applications (SIVA). Guelma, Algeria, 26-27 November 2018.[DOI]
[58] Kimura K, Sugiura T. Vibration Modal Analysis of Superconducting Levitation With LCR Shunt Damper. IEEE T Appl Supercon, 2024; 34: 1-4.[DOI]
[59] Sangeetha N, Kavitha K, Thenmozhi G. Vibration Analysis of Washing Machine under Various Unbalanced Mass: Proceedings of the 2023 2nd International Conference on Advancements in Electrical, Electronics, Communication, Computing and Automation (ICAECA). Coimbatore, India, 16-17 June 2023.[DOI]
[60] Ghemari Z, Belkhiri S. Mechanical Resonator Sensor Characteristics Development for Precise Vibratory Analysis. Sens Imaging 22, 2021.[DOI]
[61] Ghemari Z, Saad S. The use of mechanical sensitivity model to enhance capacitive sensor characteristics. Analog Integr Circ S, 2019; 99: 349-357.[DOI]
[62] Ghemari Z. Improvement of the piezoelectric sensor by the progress of the measurement accuracy: Proceedings of the IEEE International Conference on Smart Materials and Spectroscopy (SMS’2018). Yassmine Hammamet, Tunisia, 2018.
[63] Ghemari Z, Saad S. Enhancement of capacitive accelerometer operation by parameters improvement. Int J Numer Model EI, 2019; 32.[DOI]
[64] Ghemari Z. Application of the FMECA method for optimizing the reliability of the 1600T press. J Adv Manuf Syst, 2024.
[65] Ghemari Z. Navigating Fatigue Analysis with Rain flow Counting: A Practical Overview. Nov Joun of Appl Sci Res, 2024.
Copyright © 2024 The Author(s). This open-access article is licensed under a Creative Commons Attribution 4.0 International License (https://creativecommons.org/licenses/by/4.0), which permits unrestricted use, sharing, adaptation, distribution, and reproduction in any medium, provided the original work is properly cited.


