Incorporating the Time-synchronous Averaging Method into Vibration Analysis Methodologies for the Detection and Localization of Bearing Defects
Zine Ghemari1#*, Salah Belkhiri1#, Salah Saad2
1Electrical Engineering Department, University Mohamed Boudiaf, M'sila, Algeria
2Electromechanical Department, Badji Mokhtar University, Annaba, Algeria
#Both authors contributed equally to this manuscript.
*Correspondence to: Zine Ghemari, PhD, Professor, Electrical Engineering Department, University Mohamed Boudiaf, M'sila, BP 166 M'sila 28000, Algeria; Email: ghemari-zine@live.fr
Abstract
Objective: The objectives of this paper are to highlight the significance of vibration analysis, especially in predictive maintenance for rotating machinery, and to emphasize the importance of detecting bearing defects that may result in machinery failure.
Methods: The proposed methodology combines the use of time-synchronous averaging (TSA) with existing vibration analysis techniques. TSA involves aligning vibration data with specific events or phases in the machinery's operation, such as shaft rotation. By synchronizing the data in this way, the methodology aims to reduce noise and enhance the signal related to bearing defects, making them more distinguishable.
Additionally, the methodology incorporates well-established vibration analysis techniques. These techniques may include frequency analysis, amplitude modulation analysis, waveform analysis, and others commonly used in the field of condition monitoring and predictive maintenance.
Results: The results of the analysis begin with waveform analysis, which involves examining the shape and pattern of vibration signals captured from the pinion. This analysis provides valuable insights into the dynamic behavior of the pinion gear, including any variations or abnormalities in its motion. Moreover, the use of synchronized waveforms is crucial in this analysis. By aligning the vibration data with specific events or phases in the gear mesh cycle, such as tooth engagement, the analysis can pinpoint moments when potential faults or wear in the machinery may occur. This synchronization allows for a more precise assessment of the vibration signals, enabling the detection of irregularities that may indicate underlying issues with the pinion or other components of the machinery.
Conclusion: A pivotal aspect of the methodology involves envelope spectra analysis, significantly enhancing diagnostic capabilities. This analysis identifies fault patterns that might not be readily apparent in conventional vibration analysis. The incorporation of envelope spectra proves instrumental in proactive maintenance, enabling early detection of potential issues. This, in turn, contributes to the overall reliability and optimization of machinery performance.
Keywords: time-synchronous averaging, vibration, components
1 INTRODUCTION
Vibration analysis is a prevalent technique employed to investigate and understand the vibrations present in mechanical systems[1]. This analytical approach finds extensive application across various industrial sectors, encompassing fields such as engineering, predictive maintenance, and machine reliability[2-4]. By studying the vibrational behavior of mechanical components, vibration analysis provides valuable insights into the operational health, potential faults, and overall reliability of machinery[5-7]. This method plays a crucial role in optimizing performance, identifying issues proactively, and ensuring the longevity of mechanical systems in diverse industrial settings[8].
Early detection of faults is a critical factor in empowering maintenance personnel to proactively address issues before they escalate[9]. This proactive approach may involve various measures such as conducting bearing inspections, optimizing lubrication, or replacing worn-out components[10]. Timely intervention in response to identified faults enhances the reliability and longevity of equipment[11-13]. The outcomes include reduced downtime, heightened productivity, and significant cost savings, underlining the importance of early fault detection in optimizing operational efficiency and mitigating potential disruptions[14].
Vibrations in machinery can stem from diverse factors like imbalances, misalignments, bearing wear, manufacturing defects, lubrication issues, impacts, or resonances[15]. These vibrations, if left unaddressed, can result in performance degradation, premature failures, equipment damage, and diminished overall reliability[16]. Recognizing and mitigating the root causes of vibrations are crucial preventive measures to uphold optimal machinery performance and prevent potential disruptions[17,18].
Vibration analysis is a comprehensive process that entails the collection and examination of vibration data from a system[19,20]. The primary objective is to identify underlying issues such as mechanical faults, imbalances, misalignments, or lubrication problems[21]. This analytical approach not only facilitates the diagnosis of a machine's health but also enables the planning of preventive maintenance activities[22]. By recommending appropriate corrective actions based on the identified vibration patterns, vibration analysis plays a pivotal role in ensuring the optimal performance and longevity of machinery[23].
The vibration analysis of an idealized gearbox involves a theoretical approach utilizing simplified models and calculations[23-26]. In practice, however, real gearboxes exhibit more complex characteristics influenced by factors like manufacturing defects, wear, lubrication variations, and variable power flows[27]. To achieve a more accurate assessment of real gearbox vibrations, it becomes essential to supplement theoretical analyses with experimental measurements and tests[28]. This combined approach ensures a comprehensive understanding of the dynamic behavior of real-world gearboxes, acknowledging the intricacies that theoretical models alone may overlook[29-31].
Time-synchronous averaging (TSA) stands as a potent technique that significantly enhances the discernibility of specific vibration components, aiding in the identification of fault-related frequencies within machinery[32]. This technique operates by synchronizing the vibration signal with a reference signal or pulse. Through this synchronization, TSA efficiently isolates and diminishes the influence of random noise and unwanted components, enabling a clearer and more precise focus on the targeted vibration features associated with potential faults in the machinery[33,34].
In our paper, this technique of TSA enables a more concentrated analysis of specific frequencies linked to faults, especially those arising from localized bearing faults causing high-frequency impacts. Through the process of averaging, this technique effectively mitigates random noise and unrelated components in the vibration signal. As a result, the signal-to-noise ratio is improved, emphasizing the frequencies associated with faults. This enhancement in clarity makes it notably easier to detect and analyze the fault-related frequencies, providing a more accurate and reliable assessment of machinery health. Essentially, TSA sharpens the focus on relevant vibrations, aiding in the precise identification and diagnosis of potential faults.
Implementing the TSA method as part of a comprehensive predictive maintenance strategy offers organizations a pathway to advanced fault prediction, reduced unplanned downtime, and optimized machinery reliability. The proactive application of TSA enhances overall equipment effectiveness, contributing to more efficient maintenance practices. This integrated approach enables timely identification of potential issues, allowing organizations to take preemptive actions and sustain optimal machinery performance. Ultimately, the incorporation of TSA into a broader maintenance strategy enhances operational efficiency, prolongs equipment life, and positively impacts the overall reliability of industrial systems.
The innovation presented in this paper revolves around the integration of advanced vibration analysis techniques, with a primary focus on predictive maintenance for rotating machinery, particularly in the detection of bearing defects that could lead to machinery failure. The methodology proposed involves the synergistic use of TSA and established vibration analysis techniques to offer a comprehensive strategy for the identification and characterization of bearing defects.
2 VIBRATION ANALYSIS OF ROTATING MACHINERY
The vibration analysis of rotating machinery involves a systematic examination of vibrations occurring during machinery operation. This analytical process is pivotal for the identification of potential issues, diagnosing problems, and optimizing the performance and lifespan of rotating equipment. By scrutinizing the vibrational behavior, this analysis provides valuable insights into the machinery's health, facilitating proactive measures to enhance reliability and mitigate potential disruptions. Overall, vibration analysis is an essential tool for maintaining and optimizing the operational efficiency of rotating machinery[35].
In this study, vibration data is systematically collected from a gearbox featuring rotating shafts operating at a constant speed. The collected data undergoes a thorough analysis employing TSA and envelope spectra techniques. These methods work synergistically to isolate targeted vibration components and discern specific frequencies associated with localized bearing faults, particularly those inducing high-frequency impacts. The utilization of these advanced analytical techniques enhances the precision of fault identification and contributes to a comprehensive understanding of the gearbox’s health, facilitating proactive maintenance measures to address potential issues[36].
Vibration data is systematically gathered from the gearbox through the utilization of sensors or accelerometers strategically positioned to capture vibrations at multiple locations on the equipment. The collected data spans a specific period, providing a comprehensive dataset for further analysis and insights into the machinery's vibrational behavior[37,38].
Based on the fault diagnosis results, appropriate maintenance actions can be taken. This may involve bearing replacement, lubrication optimization, or other corrective measures to address the identified faults. Furthermore, analyzing the vibration data can provide insights into optimizing the performance of the gearbox by identifying areas for improvement, such as reducing excessive vibrations or mitigating wear and tear[39-41].
The provided details describe an idealized gearbox configuration consisting of a 34-tooth pinion and a 78-tooth gear. The pinion is linked to an input shaft driven by a prime mover, with the gear connected to an output shaft. Roller bearings support the shafts, and the gearbox is equipped with two accelerometers: one positioned on the bearing (A1) and another on the gearbox housing (A2). Both accelerometers operate at a sample rate of 25kHz[42-46].
By employing the accelerometers, vibration data can be collected from both A1 and A2, enabling the monitoring of the gearbox’s vibration behavior. Through the analysis of time-domain and frequency-domain characteristics of these signals, potential faults or anomalies in the gearbox system can be detected and diagnosed, as illustrated in Figure 1. This approach facilitates a comprehensive understanding of the machinery's health, allowing for proactive maintenance and minimizing the risk of unexpected failures.
|
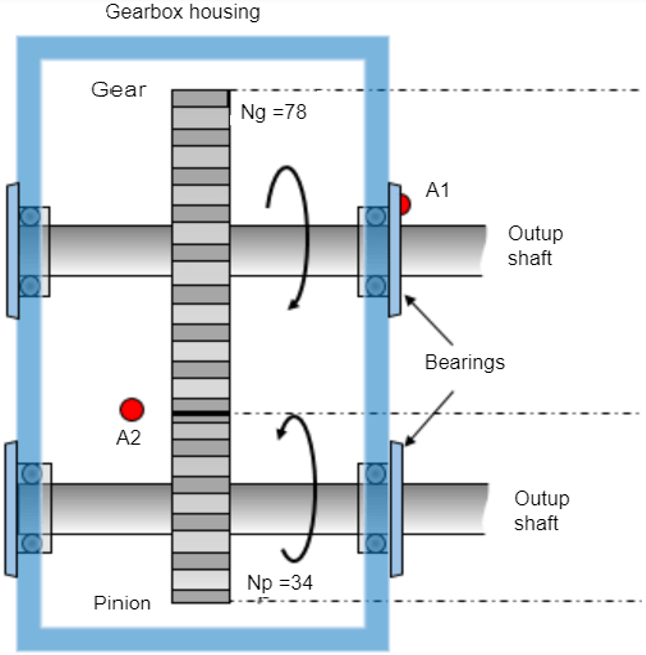
Figure 1. Simplified gear mechanism.
The pinion rotates at a rate fPinion=22.5Hz or 1350rpm. The rotating speed of the gear and output shaft is:
|
With:
fGear: Gear mesh frequency
fPinion: Pinion frequency
Np: Number of teeth on the pinion
Ng: Number of teeth on the gear
The tooth-mesh frequency, often referred to as gear-mesh frequency, is the frequency at which the teeth of gears or pinions engage with each other. It is determined by the number of teeth on the gears and the rotational speed of the gears[32-34].
|
With:
fMesh: gear mesh frequency
The gear-mesh waveform is responsible for transmitting load and thus possesses the highest vibration amplitude. A2 records vibration contributions from the two shafts and the gear-mesh. For this experiment, the contributions of the bearing rolling elements to the vibration signals recorded by A2 are considered negligible. Visualize a section of noise-free vibration signal.
The waveform pinion is the following:
|
The waveform gear is the following:
|
The waveform Gear-mesh is the following:
|
With:
vfIn: Waveform pinion
vfOut: Waveform gear
vMesh: Waveform Gear-mesh
The following figure shows the sum of three waveforms of pinion, gear, and gear mesh (see Figure 2):
|
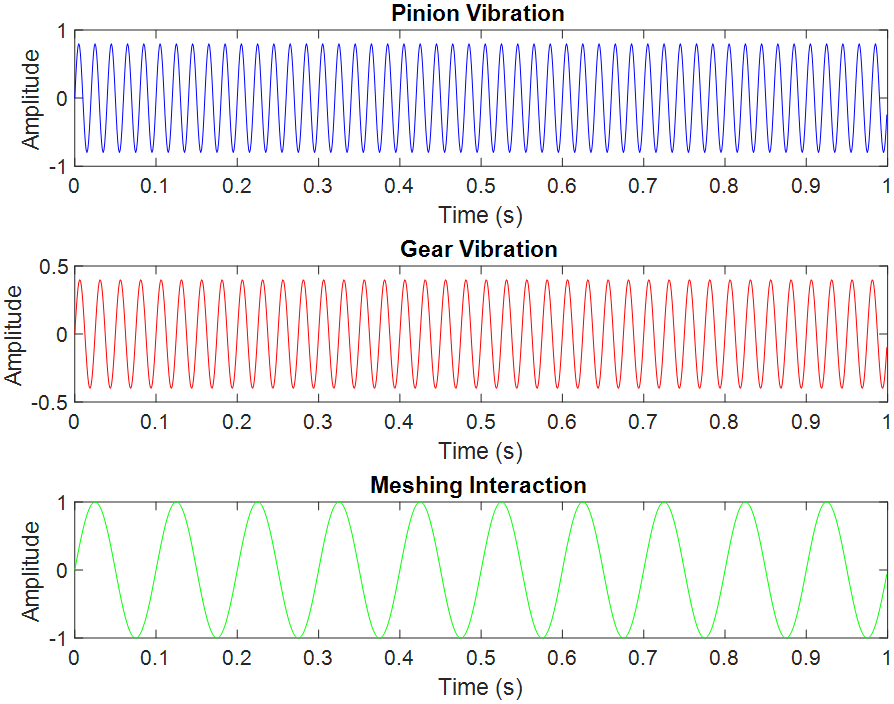
Figure 2. Three waveforms depicting the pinion, gear, and their meshing interaction.
Figure 2 illustrates three distinct waveforms representing the pinion, gear, and the interaction at the gear mesh. These waveforms provide a visual representation of the vibrations associated with these components, aiding in the analysis and characterization of the machinery's dynamic behavior. The detailed examination of these waveforms contributes to the identification of patterns, anomalies, and potential faults in the pinion and gear system.
3 HIGH-FREQUENCY IMPACTS RESULTING FROM A LOCALIZED FAULT ON A GEAR TOOTH
In instances of a localized fault on a gear tooth, high-frequency impacts can be observed in the vibration signal. Such defects may arise from issues like chips, cracks, foreign material deposits, or lubrication problems. The characteristic of these faults is the emergence of high-frequency impacts, which manifest as brief, jerky vibrations occurring at a rapid frequency. These vibrations often manifest as short-lived spikes or pulses in the recorded vibration signal. Monitoring and analyzing these signals can aid in the early detection and diagnosis of gear-related issues.
If a gear tooth is afflicted with a local fault, such as a spall, it can lead to the occurrence of a high-frequency impact once per rotation of the gear. This fault-induced impact introduces a distinct frequency component into the vibration signal.
When scrutinizing the vibration signal from the gear, whether through TSA or alternative techniques, the frequency component associated with the fault can be identified. Through examination of the frequency spectrum or envelope analysis, the fault frequency and its harmonics related to the gear's rotation become observable.
The detection of this fault-related impact serves as an indicator of a localized fault, such as a spalled tooth. Further analysis can then be conducted to evaluate the fault's severity, monitor its progression, and determine appropriate maintenance actions, as depicted in Figure 3.
For this explanation, it is arbitrarily assumed that the impact generates a 2kHz vibration signal and persists for approximately 8% of 1/fMesh, or 0.25 milliseconds. Additionally, the impact repeats once during each rotation of the gear.
|
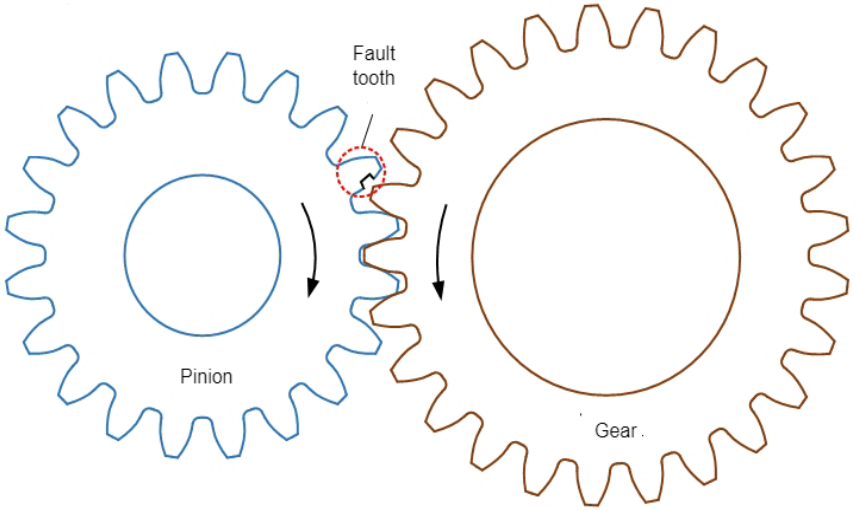
Figure 3. Local Fault on a Gear Tooth[47].
The tooth-mesh frequency is an important parameter in the vibration analysis of gear systems. It can help identify and analyze vibrations or impacts caused by gear interactions. By measuring and analyzing the vibration signals at the tooth-mesh frequency or its harmonics, engineers can detect potential gear faults such as tooth wear, misalignment, or damaged gear teeth. This information is crucial in maintaining and troubleshooting gear systems to ensure smooth and reliable operation.
A noisy vibration signal for a healthy gear typically exhibits random fluctuations or noise superimposed on the underlying gear-mesh waveform. The gear-mesh waveform represents the periodic engagement of gear teeth as they transmit load, and it usually possesses the highest vibration amplitude. The following figure illustrates a noisy vibration signal (see Figure 4):
|
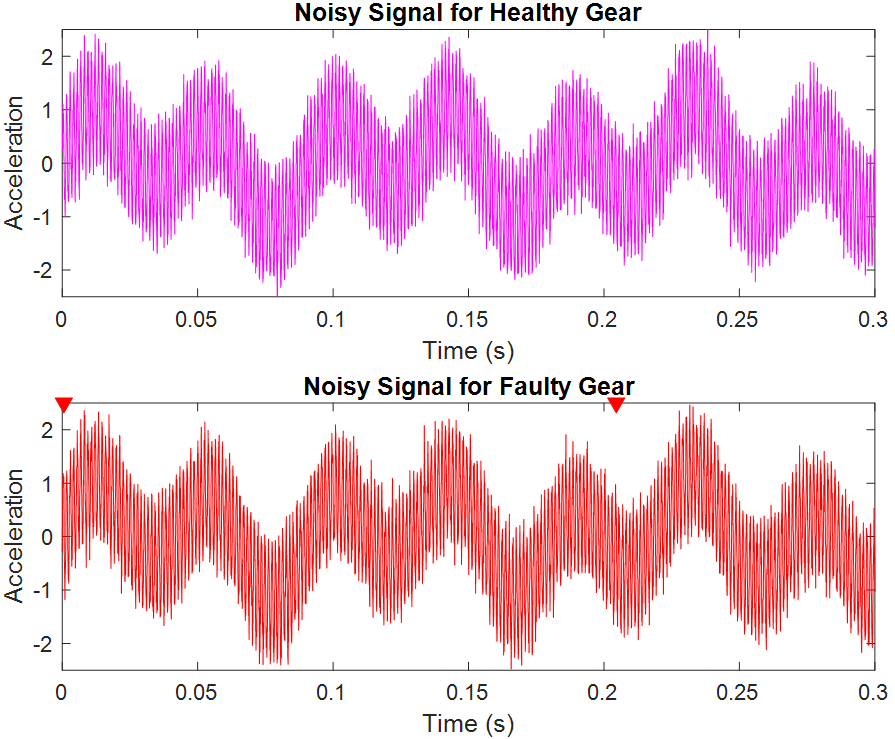
Figure 4. Vibration signals characterized by noise for both a healthy gear and a faulty gear.
Figure 4 depicts vibration signals for both a healthy gear and a faulty gear, with characteristics influenced by noise. The signals showcase the oscillations and fluctuations in the vibration patterns, providing a visual representation of the noise present in the respective gear conditions. Analyzing these signals can help identify variations and abnormalities that may indicate potential faults in the faulty gear, distinguishing it from the healthy gear's signal.
In the case of a faulty gear, the vibration signal will exhibit additional characteristics or components that indicate the presence of the fault. The specific type of fault will determine the distinct features present in the signal.
If the gear teeth are worn, the vibration signal may show irregularities or variations in the gear-mesh waveform. This can manifest as an increase in higher harmonics or sidebands around the gear-mesh frequency.
If the gear teeth have chipped or cracked, the vibration signal may exhibit impulsive or sudden changes. These changes can appear as high-frequency impacts or spikes in the time waveform or as additional frequency components in the frequency spectrum.
In the case of gear misalignment, the vibration signal may show non-periodic variations in the amplitude and profile of the gear-mesh waveform. This can be observed as irregularities or modulations in the frequency spectrum.
If the bearings supporting the gear show faults, the vibration signal may display characteristic fault frequencies or harmonics related to bearing defects. These fault frequencies can manifest as distinct peaks in the frequency spectrum.
4 COMPARISON OF POWER SPECTRA FOR BOTH SIGNALS
Comparison of Power Spectra for Both Signals involves evaluating and contrasting the frequency distribution of power spectra between two signals. This analysis aims to identify similarities, differences, or specific patterns in the frequency content of the signals. The comparison typically entails examining peaks, frequencies, and amplitudes in the power spectra, providing insights into the vibrational characteristics and potential variations between the two signals.
Local faults in individual gear teeth result in the emergence of distributed sidebands in the vicinity of the gear mesh frequency:
|
With:
fsideband,Pinion: Emerging sideband frequency of pinion (Hz)
fsideband,Gear: Emerging sideband frequency of gear (Hz)
Compute the spectra for both the healthy and faulty gears, focusing on a frequency range encompassing the shaft frequencies at 8.35Hz and 22.5Hz, along with the gear-mesh frequency at 292.5Hz. Generate plots representing these spectra. Since the fault pertains to the gear and not the pinion, anticipate the appearance of sidebands at fsideband,Gear spaced fGear apart on the spectra. Despite the anticipated peaks at fGear, fPin, and fMesh, the presence of signal noise renders the sideband peaks at fsideband,Gear indistinct.
To accurately identify fault characteristics amidst noise, signal processing techniques like filtering, envelope analysis, or advanced spectral methods can be employed. These techniques help isolate and extract fault signatures from the overall vibration signal, enabling a more precise diagnosis of the gear's health. Comparisons with established standards or reference values for healthy gears are crucial for reliable assessments.
To compare the power spectra for both signals, obtain the spectra for each signal by applying a Fourier transform to the time-domain signal. Visualize these spectra using a power spectrum plot, illustrating the power distribution (amplitude squared) as a function of frequency.
In scenarios involving localized tooth faults leading to distributed sidebands near the gear mesh frequency, the power spectrum plot typically exhibits peaks or spikes at the gear mesh frequency and its harmonics. Additionally, there are discernible sidebands distributed around these frequencies, as depicted in Figure 5.
|
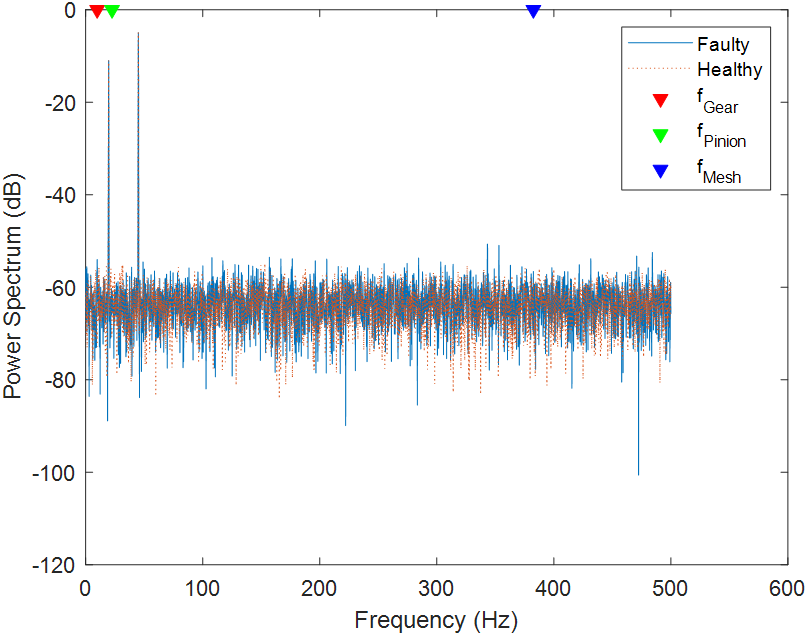
Figure 5. The power spectra for both signals.
By comparing the power spectra of two signals in Figure 5, we can determine similarities or differences in their frequency components. If both signals have localized tooth faults causing distributed sidebands, we would expect to see similar patterns in their power spectra, with peaks and sidebands around the gear mesh frequency.
However, if the fault severity or location differs between the two signals, the power spectra may have different amplitudes or distributions of sidebands.
To zoom in on the neighborhood of the gear-mesh frequency and create a grid of gear and pinion sidebands, as shown in the following figure (see Figure 6):
|

Figure 6. Zoom in on the neighborhood of the gear-mesh frequency.
From Figure 6, we can create a grid of gear and pinion sidebands centered around the gear mesh frequency and visually examine the distribution of sidebands in the neighborhood of the gear mesh frequency.
5 APPLICATION OF TSA TO THE OUTPUT VIBRATION SIGNAL
The utilization of TSA is applied to the output vibration signal. This technique involves synchronizing and averaging multiple segments of the vibration signal corresponding to specific phases of the machinery's rotational cycle. By aligning these segments, TSA enhances the visibility of specific vibration components, facilitating the identification of fault-related frequencies in the output vibration signal. The synchronized averaging process mitigates the impact of random noise and unwanted components, providing a consolidated representation of the dynamic behavior and aiding in the detection and analysis of potential faults or irregularities in the machinery.
When analyzing time-synchronous average waveforms (TSA) for the pinion and gear in mechanical systems, the specific values of processing parameters play a critical role in the accuracy and reliability of the analysis.
Typically, the sampling rate for vibration data acquisition is set high enough to capture the relevant frequency content of the signals. Common values range from 1,000 to 20,000 samples per second (1-20kHz), depending on the frequency range of interest and the capabilities of the data acquisition system.
The length of the time window determines the temporal resolution of the TSA. Values may vary based on the rotational speed of the gears and the desired frequency resolution. Common values range from 10 to 100 milliseconds, but they can be adjusted based on the specific application requirements.
To ensure continuity and reduce artifacts at the boundaries between time windows, an overlap ratio of typically 50% to 75% is used. This means that adjacent time windows overlap by half to three-quarters of their length.
Linear averaging is commonly used for TSA calculation, where multiple time-domain waveforms are averaged to reduce noise and enhance the signal-to-noise ratio. Exponential averaging or other statistical methods can also be employed based on the characteristics of the vibration signals and the desired noise reduction performance.
Prior to averaging, signal filtering may be applied to remove noise and isolate the vibration components of interest. Low-pass, high-pass, or band-pass filters with appropriate cutoff frequencies are selected based on the frequency content of the signals and the characteristics of the vibration sources.
Proper alignment and synchronization of the time-domain waveforms are essential for accurate TSA analysis. The gear meshing event serves as a reference point for synchronization, and precise alignment techniques are employed to ensure temporal coherence.
Baseline correction techniques, such as DC offset removal or baseline subtraction, may be applied to eliminate any non-stationary components or drift in the vibration signals before averaging.
Normalization of the TSA may be performed to scale the amplitudes consistently across different datasets, facilitating comparison and interpretation. Normalization factors are typically determined based on the characteristics of the vibration signals and the desired presentation format.
The resulting time-synchronous average waveforms for the pinion and the gear are presented in the following figure (see Figure 7).
|
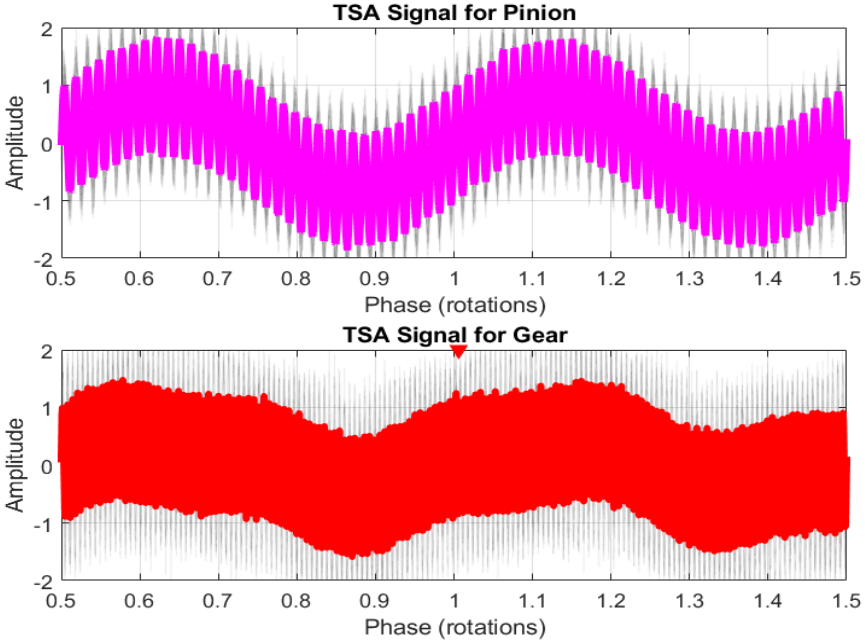
Figure 7. Time-synchronous average waveforms for the pinion and the gear.
Figure 7 presents time-synchronous average waveforms for both the pinion and the gear. In the context of vibration analysis, TSA involves aligning and averaging multiple segments of the vibration signal, each corresponding to a specific phase of the machinery's rotational cycle.
In the time-synchronous average waveforms for the pinion and gear, the abscissa represents the time instances at which the vibration data was recorded or sampled. Each point on the abscissa corresponds to a specific moment in time during the data acquisition process. This means that the horizontal axis of the waveform plot depicts the time elapsed during the recording of vibration signals. By aligning the data samples concerning a reference point or trigger event, such as a specific position in the gear mesh cycle, the TSA technique ensures that corresponding vibration signals from different revolutions or cycles are synchronized and averaged together.
For this specific figure, the time-synchronous average waveforms offer a consolidated representation of the vibrations occurring in both the pinion and the gear over multiple rotational cycles. This technique aids in highlighting recurring patterns, anomalies, and fault-related frequencies that might be present in the vibration signals. The synchronized averaging process helps to enhance the signal-to-noise ratio, making it easier to discern important features and abnormalities in the machinery's dynamic behavior. Analyzing these time-synchronous average waveforms contributes to the effective detection and diagnosis of potential faults or irregularities in the gear system.
Prior to power spectra computation, a Hanning window (a windowing function) is employed on the time-synchronously averaged signals to minimize spectral leakage. The power spectra are then computed using the Fast Fourier Transform algorithm and stored as pinion_spectrum and gear_spectrum variables. For improved visualization, the power spectra are plotted on a logarithmic scale, utilizing 10 * np.log10 to present the spectra in decibels (dB). The resulting graphical representation is showcased in Figures 8 and 9.
|

Figure 8. Original vibration signal of pinion and its TSA.
|
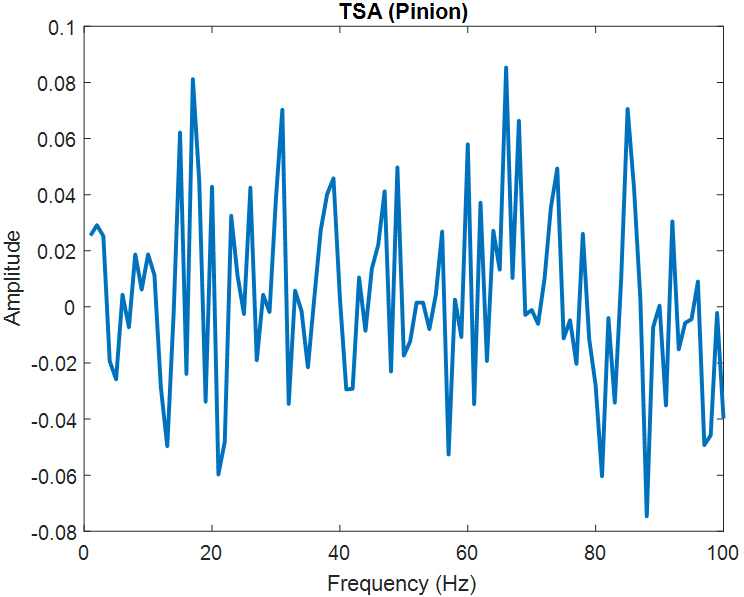
Figure 9. The power spectra.
In the original vibration signal of the pinion and its TSA plot, the abscissa represents the sample index. Each point on the abscissa corresponds to a specific sample or data point collected during the data acquisition process. Essentially, the horizontal axis of the plot indicates the sequential order of the samples recorded over time.
In the context of vibration analysis, the sample index is typically associated with the discrete-time instances at which vibration measurements are taken using sensors. These measurements capture the dynamic behavior of the pinion or machinery at regular intervals.
When comparing the original vibration signal with its TSA plot, the sample index remains consistent between both representations. However, in the TSA plot, the samples are synchronized based on specific events or triggers, such as key positions in the gear mesh cycle. This synchronization allows for the alignment of corresponding samples from different cycles, enabling the averaging of vibration data to enhance the signal-to-noise ratio and highlight common patterns associated with machinery behavior or faults. Overall, the sample index on the abscissa provides a chronological sequence of data points, facilitating the analysis of vibration signals and the detection of anomalies or irregularities.
Figures 8 and 9 display the power spectra, providing a visual representation of the frequency content of the signals. The power spectra reveal the distribution of signal power across different frequencies, offering insights into the vibrational characteristics of the pinion and gear. Analyzing these spectra aids in identifying specific frequencies associated with faults, irregularities, or distinctive features in the machinery's operation.
6 PRACTICAL APPLICATION OF TSA
TSA proves to be a potent technique in vibration analysis, especially for fault detection in rotating machinery. This practical example showcases its application, illustrating how TSA, when integrated into a comprehensive predictive maintenance strategy, significantly contributes to the overall reliability and performance optimization of rotating machinery.
Keep in mind that this is a basic illustration, and in a practical scenario, additional preprocessing and analysis steps may be necessary. Assume you have a dataset (vibration_data) and reference pulses (reference_pulses) (see Figure 10).
|
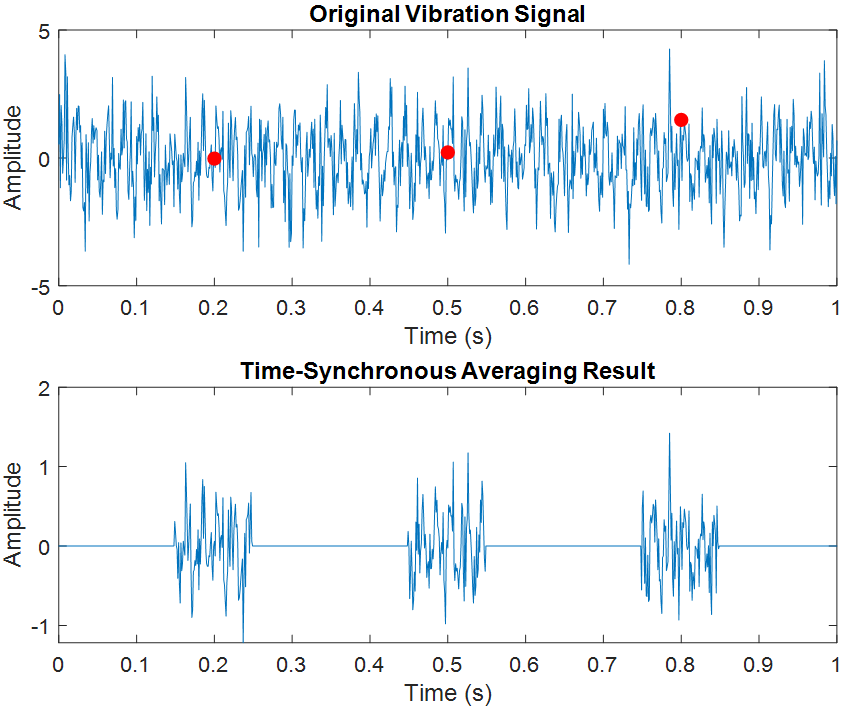
Figure 10. Practice application of TSA.
In Figure 10, the results of the TSA process are depicted. The figure illustrates the improvement in fault detection achieved through TSA in the context of rotating machinery. By synchronizing vibration signals with specific events in the rotation cycle, TSA enhances the signal-to-noise ratio, making fault-related frequencies more prominent. The plot visually compares the original vibration signal with the TSA-processed signal, emphasizing the impact of TSA in isolating and highlighting fault signatures. This visualization underscores the effectiveness of TSA in improving fault detection capabilities and contributing to the overall reliability and performance optimization of machinery.
7 CONCLUSION
Integrating TSA into a comprehensive vibration analysis approach provides a powerful tool for detecting and identifying localized bearing faults and other potential issues in rotating machinery. By analyzing specific vibration components and focusing on high-frequency impacts, this technique allows for early detection of faults that can lead to equipment damage or failure. The vibration analysis should be complemented by other condition monitoring techniques, such as temperature monitoring, lubricant analysis, and visual inspections, to establish a holistic approach for machinery health assessment and effective predictive maintenance strategies.
The proposed methodology leverages the synergies between TSA, waveform analysis, and envelope spectra analysis to provide a holistic approach for the early detection and characterization of bearing defects in rotating machinery. This comprehensive strategy not only enhances diagnostic capabilities but also contributes to the proactive maintenance of machinery, ensuring its reliability and optimal performance.
Acknowledgements
The study was financially supported by Algerian General Direction of Research (DGRSDT).
Conflicts of Interest
The authors declared there is no conflict.
Author Contribution
Belkhiri S and Saad S was responsible for data curation and original draft preparation. Ghemari Z was responsible for review, editing and supervision. All authors have read and agreed to the published version of the manuscript.
Abbreviation List
A1, Bearing accelerometer
A2, Gearbox housing accelerometer
TSA, Time-synchronous averaging
References
[1] Zhao Z, Hu C, Yin F. Failure Analysis for Vibration Stress on Ball Grid Array Solder Joints: Proceedings of the 19th International Conference on Electronic Packaging Technology (ICEPT). Shanghai, China, 8-11 August 2018.[DOI]
[2] Li C, Li J, Fang XL et al. Application of a Method of Identifiying Instantaneous Shaft Speed from Spectrum in Aeroengine Vibration Analysis: Proceedings of the Global Reliability and Prognostics and Health Management (PHM-Yantai). Yantai, China, 13-16 October 2022.[DOI]
[3] Khatri P, Chhatre U, Kadge S. Visual Vibration Analysis of Vibrating Object at Low Frequency: Proceedings of the 6th International Conference for Convergence in Technology (I2CT). Maharashtra, India, 2-4 April 2021.[DOI]
[4] Belkhiri S, Ghemari Z, Saad S et al. Improvement of the Vibratory Analysis by Enhancement of Accelerometer Characteristics. Sensor Lett, 2020; 18: 39-42.[DOI]
[5] Ghemari Z. Progression of the vibratory analysis technique by improving the piezoelectric sensor measurement accuracy. Micro Opt Techn Let, 2018; 60: 2972-2977.[DOI]
[6] Reguieg SK, Ghemari Z, Benslimane T. Extraction of the relative sensitivity model and improvement of the piezoelectric accelerometer performances: Proceedings of the International Conference on Signal, Image, Vision and their Applications (SIVA). Geulma, Algeria, 26-27 November 2018.[DOI]
[7] Ghemari Z, Saad S. Development of measurement precision of sensor vibration. J Vib Control, 2012; 19: 1480-1486.[DOI]
[8] Zhan C, Ji S, Liu Y et al. Winding Mechanical Fault Diagnosis Technique of Power Transformer Based on Time-Frequency Vibration Analysis: Proceedings of the Condition Monitoring and Diagnosis (CMD). Perth, WA, Australia, 2018.[DOI]
[9] Xu H, Wang B. Vibration Analysis of High Pressure Mud Piping Systems and Vibration Reduction Method: Proceedings of the World Conference on Mechanical Engineering and Intelligent Manufacturing (WCMEIM). Shanghai, China, 4-6 December 2020.[DOI]
[10] Ghemari Z, Belkhiri S. Mechanical Resonator Sensor Characteristics Development for Precise Vibratory Analysis. Sens Imaging, 2021; 22.[DOI]
[11] Defdaf M, Ghemari Z, Hadjaj AE et al. Improvement of Method Queues by Progress of the Piezoresistive Accelerometer Parameters. J Adv Manuf Syst, 2017; 16: 227-235.[DOI]
[12] Ghemari Z, Saad S. Development of Model and Enhancement of Measurement Precision of Sensor Vibration. IEEE Sens J, 2012; 12: 3454-3459.[DOI]
[13] Ghemari Z, Saad S, Defdaf M. Appropriate Choice of Damping Rate and Frequency Margin for Improvement of the Piezoelectric Sensor Measurement Accuracy. J Adv Manuf Syst, 2021; 20: 537-548.[DOI]
[14] Li M, Wang M, Kan X et al. Random Vibration Analysis in Mechanical Environment of Satellite Laser Communication Terminal Telescope: Proceedings of the International Conference on Artificial Intelligence and Advanced Manufacture (AIAM). Manchester, UK, 15-17 October 2020.[DOI]
[15] Yang Y, Wang Q. Analysis of Vibration Noise and Transmission Characteristics of Flow-induced Rudder: Proceedings of the IEEE/OES China Ocean Acoustics (COA). Harbin, China, 14-17 July 2021.[DOI]
[16] Zhang L, Jiang B, Zhang PQ et al. Random Vibration Fatigue Analysis of Base In Macro-micro Motion Platform: Proceedings of the Global Reliability and Prognostics and Health Management (PHM-Nanjing). Nanjing, China, 15-17 October 2021.[DOI]
[17] Zhang Y, Li Y, Liu S. Vibration analysis of IEC 61373 standard based on measured data: Proceedings of the International Symposium on Mechatronics and Industrial Informatics (ISMII). Zhuhai, China, 22-24 January 2021.[DOI]
[18] Ghemari Z, Saad S. The use of mechanical sensitivity model to enhance capacitive sensor characteristics. Analog Integr Circ S, 2019; 99: 349-357.[DOI]
[19] Ghemari Z. Improvement of the piezoelectric sensor by the progress of the measurement accuracy: Proceedings of the IEEE International Conference on Smart Materials and Spectroscopy (SMS’2018). Hammamet, Tunisia, Octomber 2018.
[20] Ghemari Z, Saad S. Enhancement of capacitive accelerometer operation by parameters improvement. Int J Numer Model EI, 2019; 32: 22.[DOI]
[21] Kashfi M, Fakhri P, Amini B et al. Vibration Analysis of A Wind Turbine Blade Integrated by A Piezoelectric layer: Proceedings of the International Power System Conference (PSC). Tehran, Iran, 9-11 December 2019.[DOI]
[22] Guo J, Fang H, Li D et al. Vibration Analysis of Internal Permanent Magnet Synchronous Machines Under Asymmetric Three-Phase Current Condition: Proceedings of the IEEE Energy Conversion Congress and Exposition (ECCE). Baltimore, MD, USA, 2019.[DOI]
[23] Wang D, Liu X, Chen S et al. Static and Vibration Analysis of Manned Lunar Rover Frame Based on Ansys: Proceedings of the International Conference on Electronics Technology (ICET). Chengdu, China, 12-15 May 2023.[DOI]
[24] Ghemari Z, Saad S. Parameters improvement and suggestion of new design of capacitive accelerometer. Analog Integr Circ S, 2017; 92: 443-451.[DOI]
[25] Ghemari Z, Saad S. Modeling and enhancement of mechanical sensitivity of vibration sensor. J Vib Control, 2014; 20: 2234-2240.[DOI]
[26] Ghemari Z, Chouaf F, Saad S. New Formula for the Piezoresistive Accelerometer Motion Acceleration and Experimental Validation. J Adv Manuf Syst, 2017; 16: 57-65.[DOI]
[27] Linessio RP, Silva JCCD, Fantin ES et al. Building Structure with Pendulum Neutralizer Vibration Analysis Using FBGs Strain Sensors: Proceedings of the SBMO/IEEE MTT-S International Microwave and Optoelectronics Conference (IMOC). Aveiro, Portugal, 10-14 November 2019.[DOI]
[28] Tang S, Liu G, Zhang L et al. The Experimental Vibration Analysis of Small-scale Unmanned Helicopter for Control Design: Proceedings of the Chinese Control Conference (CCC). Wuhan, China, 25-27 July 2018.[DOI]
[29] Ghemari Z, Saad S. Improvement of piezoresistive accelerometer performance: Proceedings of the International Conference on Systems and Control (ICSC), Algeria, 29-31 October 2013.[DOI]
[30] Ghemari Z. Analysis and optimization of vibration sensor: Proceedings of the IEEE International Conference on Smart Materials and Spectroscopy (SMS’2018). Hammamet, Tunisia, 12-15 October 2018.[DOI]
[31] Ghemari Z. Upgrading of piezoresistive accelerometer response: Proceedings of the International Conference on Modelling, Identification and Control (ICMIC). Algies, Algeria, 15-17 November 2016.
[32] Yang Y, Hu N, Li Y et al. Dynamic modeling and analysis of planetary gear system for tooth fault diagnosis. Mech Syst Signal Pr, 2024; 207: 110946.[DOI]
[33] Hu A, Liu S, Xiang L et al. Dynamic modeling and analysis of multistage planetary gear system considering tooth crack fault. Eng Fail Anal, 2022; 137: 106408.[DOI]
[34] Gunasegaran V, Amarnath M, Chelladurai H et al. Assessment of local faults in helical geared system using vibro-acoustic signals based on higher order spectrum analysis. Appl Acoust, 2023; 204: 109237.[DOI]
[35] Ghemari Z, Saad S. Reducing the Measurement Error to Optimize the Sensitivity of the Vibration Sensor. IEEE Sen J, 2014; 14: 1527-1532.[DOI]
[36] Ghemari Z, Saad S, Amrouche A et al. New model of piezoelectric accelerometer relative movement modulus. T I Meas Control, 2015; 37: 932-941.[DOI]
[37] Ghemari Z, Lakehal A, Saad S. Minimisation of resonance phenomena effect of piezoresistive accelerometer: Proceedings of the International Conference on Systems and Control (ICSC). Sousse, Tunisia, 28-30 April 2015.[DOI]
[38] Ghemari Z, Saad S. Defects Diagnosis by Vibration Analysis and Improvement of Vibration Sensor Measurement Accuracy. Sensor Lett, 2019; 17: 608-613.[DOI]
[39] Scheffer C, Girdhar P. Practical Machinery Vibration Analysis and Predictive Maintenance, Elsevier: Amsterdam, Netherlands, 2004.
[40] Randall RB. Vibration-based Condition Monitoring: Industrial, Aerospace and Automotive Applications. John Wiley and Sons: Chichester, UK, 2011.[Web]
[41] Anders B. Noise and Vibration Analysis: Signal Analysis and Experimental Procedures. John Wiley and Sons: Chichester, UK, 2011.[Web]
[42] Ghemari Z. Decrease of the resonance phenomenon effect and progress of the piezoelectric sensor correctness: Proceedings of the International Conference on Electrical Sciences and Technologies in Maghreb (CISTEM). Algiers, Algeria, 28-31 October 2018.[DOI]
[43] Saad S, Ghemari Z, Herous L et al. Transducer (Accelerometer) Modeling and Simulation. Asian J Inf Technol, 2007; 6: 4-57.
[44] Ghemari Z, Saad S. Simulation and Experimental Validation of New Model for the Piezoresistive Accelerometer Displacement. Sensor Lett, 2017; 15: 132-136.[DOI]
[45] Ghemari Z, Lakehal A. Vibration sensor mechanical sensitivity improvement: Proceedings of the International Conference on Electrical Sciences and Technologies in Maghreb (CISTEM). Tunis, Tunisia, 3-6 November 2014.[DOI]
[46] Ghemari Z, Belkhiri B, Saad S. Improvement of the Relative Sensitivity for Obtaining a High Performance Piezoelectric Sensor. IEEE Instru Meas Mag, 2023; 26: 49-56.[DOI]
[47] Du W, Zeng Q, Shao Y et al. Multi-Scale Demodulation for Fault Diagnosis Based on a Weighted-EMD De-Noising Technique and Time–Frequency Envelope Analysis. Appl S, 2020; 10.[DOI]
Copyright © 2024 The Author(s). This open-access article is licensed under a Creative Commons Attribution 4.0 International License ( https://creativecommons.org/licenses/by/4.0), which permits unrestricted use, sharing, adaptation, distribution, and reproduction in any medium, provided the original work is properly cited.


