Smart Water System and Internet of Things
Kian Hariri Asli1*, Kaveh Hariri Asli2
1Department of Electronic Engineering, University of Rome Tor Vergata, Rome, Italy
2Department of Mechanical Engineering, Islamic Azad University Rasht Branch, Rasht, Iran
*Correspondence to: Kian Hariri Asli, Department of Electronic Engineering, University of Rome Tor Vergata, Via Cracovia 50, Rome 00133, Italy; E-mail: kian.haririasli@students.uniroma2.eu
Abstract
Objective: Today, Internet of Things (IoT) technology has a significant impact on overcoming the challenges of water loss. The IoT also helps the reducing of these challenges. This study aims to show how can by reducing the water working pressure, water saving happened through IoT.
Methods: In this work, water loss in the distribution network was investigated for smart water. Smart water systems can be achieved by advanced pressure management. The water pressure changes during the day and night can lead to water losses. In this work, the network pressure variations were recorded by IoT through geospatial modeling. The difference between the present work and the previous works was the emphasis on advanced techniques including networked sensors, remote sensing, geographic information systems (GIS), and the IoT. The pressure changes analysis was carried out by WaterGEMS software and ArcGIS-ArcMap software.
Results: The results showed the average water saving in 6 days after the completion of the work. The water saving was reported as 527.66m3 per day equivalent to 1.22L/h noticeably more than half 41.83% of the water which was stored during the time of extra pressure. It happened especially from 4:00 midnight to 6:00 a.m. when Minimum Night Flow decreased to 405 cubic meters per hour.
Conclusion: The amount of water entrance to the network and the saving percentage were assumed as dependent and independent variables for regression analysis. The results showed the power function had a suitable correlation due to the scatter diagram and P-value.
Keywords: Internet of Things, pressure management, water losses, geographic information systems, networked sensors
1 INTRODUCTION
Due to population growth, expansion of industry, improvement of health and public welfare and water consumption in the world, the amount of renewable water resources per capita is decreasing. Based on these reasons, it is necessary to use water facilities based on new methods. Consumption management brings proper performance, useful production and cost reduction. The implementation of consumption management along with pressure management in the water industry reduces water consumption and water loss. Water losses are considered as non-revenue water (NRW). The benefits of implementing the pressure management project in the context of geographic information system (GIS) in district metering area (DMA) can be summarized as follows[1-3]:
● Reduction in urban water losses.
● Setting the consumption pattern of consumers.
● Providing the required pressure at different hours.
● Reduction in accidents.
● Avoiding excess pressure in the network during low consumption hours.
1.1 Why GIS?
The water and energy saving is one of the priorities of the water industry management, which is considered based on the intelligent exploitation method. During their useful life, water facilities should have proper function, useful efficiency and minimum cost. The purpose of operation is the proper use of equipment within the range of their useful life. Due to the large amount of operational information, by updating the facility map information in GIS format, different data can be extracted from it in minimum time. First, maps of urban facilities should be scanned, edited and layered. In addition, it is necessary to reflect the subsequent changes on these maps so that they do not lose their effectiveness over time. A strong and efficient database of facilities as the main server can solve many problems. If the information about the facilities is only in the memory of professional people, it will be out of reach of the system with the passage of time. GIS is not just a software, but a science that categorizes and places geographic information and urban planning by different software. This science has also found its place in urban science and is used by urban science specialists and city planners. Today, water pressure management is one of the most important topics to be considered in order to save water and energy.
The criteria for selecting a region with the potential to implement a pressure management project in the context of GIS include the following items[4,5]:
● Choosing an area with a large height difference.
● The necessity of installing a pressure relief valve to adjust the pressure.
● Control the water entrance and exit of the desired area.
● A reservoir and pressure zone cover the area.
● The amount of flow at the entry and exit points can be measured.
● Installation of data logger for remote reading of pressure in the form of Internet of Things (IoT).
● Preparation of GIS to make it ready for the implementation of the pressure management project.
1.2 What is IoT?
The IoT includes any device that can be turned on and off with a switch and connected to the Internet. The IoT includes equipment that connects information through the internet and establishes good and complete communication between them. The very important thing about this technology is that the history of the IoT goes back to the last few years and it does not have a very long history. Since the telegraph was developed in the 1830s and 1840s, machines have been able to communicate directly with each other.
The first radio transmission known as the "wireless telegraph" was produced on June 3, 1900, providing the necessary components for the development of the IoT. This continued with the development of computers in the 1950s. In reviewing the history of the IoT, it should be noted that the development of the internet itself is a very important part of the history of the IoT technology. The internet first started working in 1962 and was officially introduced to the world in 1969. It was not until the 1980s that commercial service providers began supporting public use of the technology, allowing it to evolve into the modern internet of today. Satellites and fixed lines provided the initial communication in the IoT platform in today's form.
In addition, global positioning system (GPS) satellites became a reality in early 1993, providing a stable and highly functional system and providing today's internet. In addition, by placing commercial satellites with private properties, the internet began to grow faster than usual, providing a very suitable platform for the IoT.
Kevin Ashton was the first to introduce the term IoT. He believed that Radio Frequency Identification is a prerequisite for the IoT, and this theme has been repeated many times throughout the history of the IoT. He believed that if all devices were tagged, computers could manage, track and control them. Today, to a large extent, this labeling operation can be done using technologies such as digital watermarks, barcodes, and QR codes.
In 2002, the first technology in the field of IoT was produced. This product was actually a smart doorbell that provided a great example of the IoT. This success happened in 2011 and it can be considered as the first version of modern IoT products. Throughout the history of the IoT, we find many interesting uses of it. Smart cities can be considered one of the biggest demands in the world of IoT. It was in 2012 that the Swiss Federal Energy Administration started a pilot program called Smart City, which attempted to use IoT technologies to control a city. Traffic monitoring, weather monitoring, smart transportation, and smart parking were among the important features of this city.
1.3 Industrial IoT and GIS for Smart Water System
In the IoT, especially in the type of Industrial IoT, smart actuators and sensors are used for industrial applications. The purpose of using the Internet of Industrial Things is to improve the efficiency of industries[6-8].
The use of IoT in the water industry helps to save costs due to water loss through the implementation of the pressure management project. In general, the water industry has always faced many pressure management challenges since the distant past and has been looking for effective solutions to overcome these challenges. Among the most important challenges, the following items can be mentioned[9]:
● Determining the functional index of water loss.
● Estimating the effectiveness of implementing pressure management plans.
● Providing solutions to the implementation of the consumption management.
● Action plan design for pressure control management.
● Investigating the effect of pressure control on consumption.
● Determining the pattern for reducing field leakage by water facility accident control.
● Analysis of pressure changes by WaterGEMS and ArcGIS-ArcMap software.
2 MATERIALS AND METHODS
The performance of the distribution network should be investigated by the hydraulic model. Today, the model calibration is dependent on flow and pressure measurement based on GIS. The GIS is used as a powerful tool for querying, layering, recording, and intercommunication geospatial data. The internet helps in collecting information related to water system activities. The information on the internet is recorded by humans. Humans are very slow in real-world data collection and recording on the computer. The IoT and GIS technologies help to collect and record information with the highest level of accuracy and in the least time in comparison with human activity. In the management of the water distribution network, the internet plays an important role. Based on these reasons, the purposes of implementing smart pressure management in this work were as the following items:
● Measurement of operational performance.
● Reduce system downtime.
● Reduction of operating costs.
● Save water and energy.
This work was conducted in 2016 regarding the intelligent pressure management of a water distribution network in a mountain site. The main source of water was the spring. Water was transmitted from the spring to the main reservoir of the distribution network. Based on the variation of the elevation code of the water distribution base, three independent pressure zones formed the distribution network. In this method, the water distribution can be configured by main a reservoir and many independent pressure zones. In the present work, each independent pressure zone was connected by a transmission line directly to the discharge line of the main reservoir. Each independent pressure zone had an independent reservoir exposed to atmospheric pressure. Each of the independent reservoirs simultaneously fed its water distribution network without any connection to the downstream pressure zone. The independent pressure zones were equipped with a control valve and relief valve in appropriate georeferenced coordinates. The pressure and flow data were monitored and detected by remote sensing (RS) and the IoT. These data were transmitted to the control unit of the water system. The scaled model was investigated based on the GIS.
2.1 IoT and GIS Ready
The experiences of other researchers in water pressure management indicate that any change in network pressure should not exceed the standard schedule and satisfaction of water consumers[10-12]. The IoT and GIS Ready make possible compliance with the standard schedule. The spatial data and non-spatial data queries for making GIS Ready should be provided. The data queries include all facilities of water systems such as pressure pipes, relief valves, shut-off valves, air valves, butterfly valves, pressure maintaining valves, fire hydrant valves, one-way valves, pumps and reservoirs. In this work, first of all, maps were implemented for water features in the GIS Ready process. The hydraulic analysis of the network parameters such as pressure and speed were also checked. With online access to the flow and pressure drop in the pipes, the output pressure of the pumps, and the water level in the reservoirs were recorded. The entrance water flow was investigated for saving the water level of the main water reservoirs. These procedures led to reducing the water pressure entering the water distribution network. By reducing the water working pressure, water saving happened through consumption management.
2.2 Research Tools
In this work, a pressure control project was carried out by using networked sensors, data loggers, advanced modems, GIS, RS, and IoT. The pressure variations and pipe breakage were investigated through the hydraulic model based on ArcGIS-ArcMap and WaterGEMS software.
2.3 Regression Analysis
The regression analysis was used as a quantitative research method to study, model, and analyze the relationship between variables. These relationships included a dependent variable and one or more independent variables. This quantitative method was used to test the nature of the relationship between a dependent variable and one or more independent variables.
The basic form of regression models included unknown parameters β, independent variables X, and dependent variable Y. The regression model specified the relationship between the dependent variable Y and the functional combination of independent variables X and unknown parameters β (1):
|
Regression Equation (1) was used to predict y values. For the regression equation formula, the following function was derived (2):
|
2.4 Curve Fitting
Curve fitting is the process of finding equations to approximate straight lines and curves that best fit a set of data. The most common method for fitting curves to data using linear regression involves polynomial terms, such as squared or cubic predictors. This linear regression fit shows the suitability of using a line to fit a curvilinear relationship. In regression analysis, curve fitting is the process of determining the model that provides the best fit for specific curves in a data set. Curvilinear relationships between variables are not as easy to fit and interpret as linear relationships. Often the relationship between two variables appears as a straight line. However, not all data have a linear relationship and the model must fit the curves in the data. Logarithmic function forms can be very powerful. Many combinations cannot be detailed in this work. For data that flattens as the prediction curve increases, a semi-logarithmic model of the corresponding prediction can be appropriate. Nonlinear regression can be a powerful alternative to linear regression because it provides the most flexible curve performance. Thus, the nonlinear function can be found that best fits the particular curve in the research data. In this work, the regression model for the parameters of the water flow entering the network and the water saving percentage were examined during the curve fitting process with an independent variable (3):
|
Q - Independent variable: saving percentage.
S - Dependent variable: volume of water entering the network (cubic meters).
The regression analysis of the scatterplot and the fitting of the curves for the volume of water entering the network and the percentage of savings were checked.
3 RESULTS AND DISCUSSION
In the target area, the range of DMA included 1670 water consumers. The city's distribution network was fed by a water transmission system through spring. Water entered the distribution network by the main reservoir, and intermediate reservoirs in compliance with pressure control valves installed on the main pipeline. Network pressure changes were recorded by data loggers and modems related to sensors, advanced modems, data loggers, and IoT (Figure 1).
|
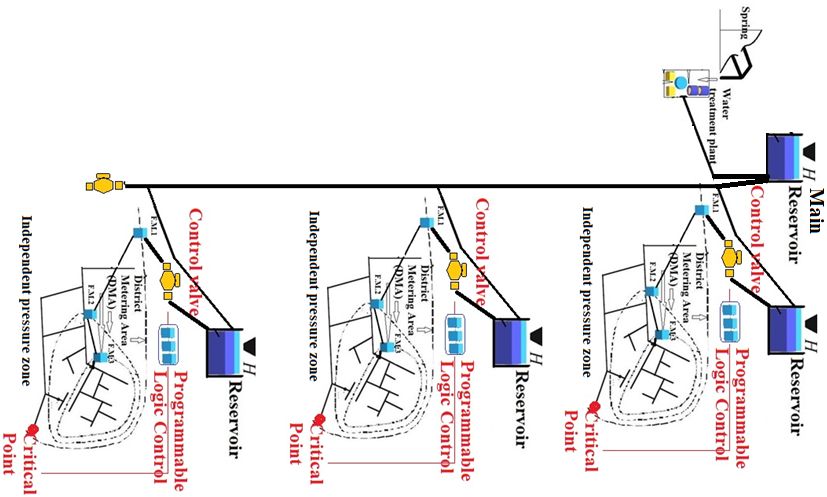
Figure 1. Smart water system-control system of DMA by advanced modems, data loggers, RS & IoT.
In three independent DMA based on the maps in CAD and SCAN format separately, the DMA implementation was determined. Then, for the CAD and scanned maps, the GPS coordinates of two points were taken from the pilot. After preparing the Shapefile, all the maps were georeferenced and the spatial and non-spatial data queries and fields were created. Based on the results of the hydraulic analysis in WaterGEMS software and ArcGIS - ArcMap software and according to the remote reading data by flowmeters and pressure gauges, the scaled network model was calibrated with the hydraulic analysis model. The city's water distribution network includes the main reservoir, and intermediate reservoirs in the division of networks. The main source of water supply in this work included spring outside the city. The spring water directly entered the distribution network. The results showed the minimum night pressure, the value of pressure reduction, and consumption saving were affected by the following items[13,14]:
● Checking and measuring the flow after installing the pressure controller in DMA and comparing it with the time before installation.
● Analysis by WaterGEMS software and ArcGIS-ArcMap software.
3.1 Operational Process and Research Results
In the operational process all valves were checked on the border of the DMA and the correctness of their performance was checked. Then by installing advanced modems, data loggers, and networked sensors, pressure curves were provided at different hours of the day and night. The installation locations of advanced modems, data loggers, and networked sensors were selected based on the network analysis. The installation position of advanced modems, data loggers, and network sensors was recorded in the field of each complication in the GIS software (Table 1). The location of the recorded information indicated the existence of an area with a pressure drop equal to 23m during peak consumption. Although the pressure in the other parts of the DMA isolated area was more than 34m. The pressure drop of the mentioned area fluctuated from 34m to 10m with a range of 24m during the night. Due to the installation of the data loggers in the DMA, this area was declared as one of the suitable areas for investigation. Pressure curves were drawn based on the data received from networked pressure sensors in compliance with the GIS platform (Figure 2).
Table 1. Network Analysis by ArcGIS-ArcMap and WaterGEMS Software; Field Data
ID |
Label |
Start Node |
End Node |
30 |
pipes-804 |
J-1 |
J-2 |
33 |
pipes-1792 |
J-3 |
J-4 |
36 |
pipes-641 |
J-5 |
J-6 |
39 |
pipes-548 |
J-7 |
J-8 |
42 |
pipes-543 |
J-9 |
J-10 |
45 |
pipes-643 |
J-11 |
J-12 |
48 |
pipes-546 |
J-13 |
J-14 |
51 |
pipes-257 |
J-15 |
J-16 |
54 |
pipes-1206 |
J-17 |
J-18 |
57 |
pipes-863 |
J-19 |
J-20 |
60 |
pipes-920 |
J-21 |
J-22 |
63 |
pipes-384 |
J-23 |
J-24 |
66 |
pipes-1802 |
J-25 |
J-26 |
69 |
pipes-402 |
J-27 |
J-28 |
72 |
pipes-926 |
J-29 |
J-30 |
75 |
pipes-837 |
J-31 |
J-32 |
78 |
pipes-1575 |
J-33 |
J-34 |
81 |
pipes-785 |
J-35 |
J-36 |
84 |
pipes-1804 |
J-37 |
J-38 |
87 |
pipes-1283 |
J-39 |
J-40 |
90 |
pipes-705 |
J-41 |
J-42 |
93 |
pipes-1217 |
J-43 |
J-44 |
96 |
pipes-1384 |
J-45 |
J-46 |
99 |
pipes-481 |
J-47 |
J-48 |
102 |
pipes-1448 |
J-49 |
J-50 |
105 |
pipes-1803 |
J-51 |
J-14 |
107 |
pipes-1315 |
J-52 |
J-53 |
110 |
pipes-1487 |
J-54 |
J-55 |
113 |
pipes-486 |
J-56 |
J-57 |
116 |
pipes-970 |
J-58 |
J-59 |
119 |
pipes-708 |
J-60 |
J-61 |
122 |
pipes-248 |
J-62 |
J-63 |
125 |
pipes-473 |
J-64 |
J-65 |
128 |
pipes-265 |
J-66 |
J-67 |
131 |
pipes-680 |
J-68 |
J-69 |
134 |
pipes-1694 |
J-70 |
J-71 |
137 |
pipes-1260 |
J-72 |
J-73 |
140 |
pipes-256 |
J-74 |
J-15 |
|
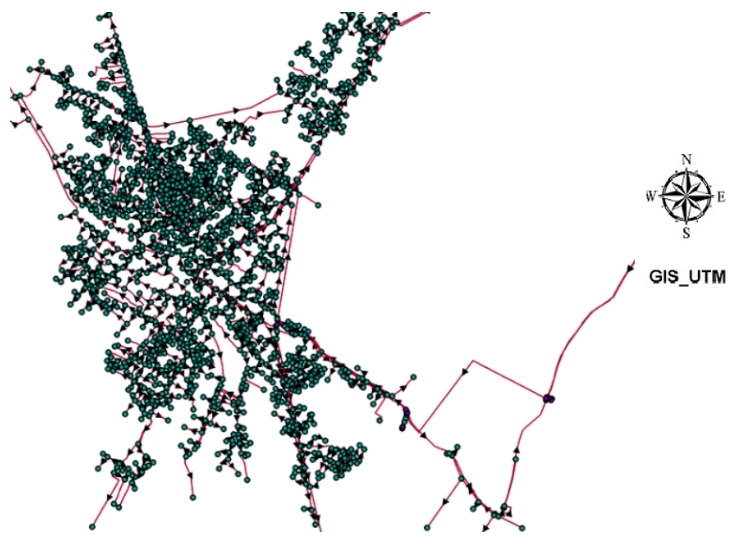
Figure 2. Nodes of network - Network analysis by ArcGIS-ArcMap and WaterGEMS software.
The average Minimum Night Flow was recorded at about 87 cubic meters per hour. Then, to check the pressure control system, a pressure relief valve was installed in the area, and consumption regulation started through pressure control. The changes in the flow rate entering the network before and after the operation of the pressure control project, based on the data received from the remote reading flowmeters, in the form of volume and percentage of water saved, are given in (Tables 2-3).
Table 2. Hourly Flow Rate Changes
Date |
Total Flow (m³) |
Date |
Total Flow (m³) |
2017/7/15 |
1500 |
2017/7/22 |
901 |
2017/7/16 |
1464 |
2017/7/23 |
890 |
2017/7/17 |
1231 |
2017/7/24 |
743 |
2017/7/18 |
981 |
2017/7/25 |
779 |
2017/7/19 |
992 |
2017/7/26 |
699 |
2017/7/20 |
998 |
2017/7/27 |
488 |
Table 3. Water Saving Due to the Pressure Control Project
Day |
Saving (m³) |
Saving (%) |
Friday |
599 |
39 |
Saturday |
574 |
39 |
Sunday |
988 |
80 |
Monday |
202 |
20 |
Tuesday |
293 |
29 |
Wednesday |
510 |
51 |
The regression analysis includes the scatter diagram and curve fitting for the volume of water entering the network and the saving percentage showed a good correlation between the data of the dependent variable (volume of water entering the network) and the independent variable (saving percentage) (Figure 3). The amount of water loss was investigated according to pressure changes during the day and night. In the midnight hours, when the consumption of consumers was reduced to a minimum level, the water working pressure increased. This increased pressure caused the network to experience additional load (shock load). The results showed that the average saving in water consumption in the 6 days after the completion of the work was 527.66 cubic meters per day. This amount was significantly more than half of the 41.83% of water during the time of additional pressure, especially at 4:00 p.m. It was from 4:00 midnight to 6:00 a.m. The result showed the reduction of NRW and saving the drinking water.
|
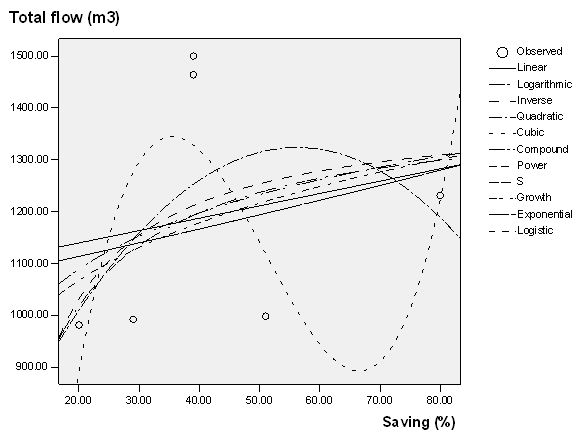
Figure 3. Curve estimation - Curve fitting for dependent variable (volume of water entering the network) and independent variable (saving percentage).
Based on the regression analysis and experimental results, if the P-value is less than the significant value, it can be shown that if there is no acceptable relationship between the manipulated variables, the probability of experimental results will be very low.
In this work, the P-value values for two variables (the amount of water entering the network and the saving percentage) were as follows (Table 4).
(1) P-value for the volume of water entering the network:
● The value of P was equal to 0.1.
(2) P-value for saving percentage:
● The value of P was equal to 0.955.
Table 4. Statistics Test Based on the Regression Analysis and Experimental Results
Parameters |
Total Flow (m3) |
Saving Water (%) |
Chi-Square |
0 |
0.667 |
df |
5 |
4 |
Asymp. Sig. |
1 |
0.955 |
According to the P-value and the scatter diagram for the volume of water entering the network and the saving percentage, and according to the functions resulting from curve fitting (Figure 3) in the modeling process, the Power function had a suitable correlation (4):
|
4 CONCLUSION
In this work, the amount of water loss was investigated according to pressure changes during the day and night. In the midnight hours, when the consumption of consumers was reduced to a minimum, the water working pressure was increased. This increased pressure caused shock waves and the network experienced additional load. The implementation of a smart pressure management project by IoT and GIS in this work showed saving in drinking water. The results showed that the average saving in water consumption in 6 days after the completion of the work was reported to be 527.66 cubic meters per day. It was significantly more than half of 41.83% of water at the time of additional pressure, especially from 4:00 midnight to 6:00 am. The result of this work showed the saving of drinking water. The comparison of the results before and after the implementation of the work led to the profitability of the project as follows:
● Night discharge decreased to 405 cubic meters per hour, which was equivalent to 1.22L/h. Therefore, excess pressure at critical points was removed.
● The average saving in water consumption in 6 days after the completion of the project was 527.66 cubic meters per day, which noticeably saved more than half of the water, 41.83%, during the time of extra pressure (especially from 4:00. at midnight to 6:00 a.m.).
● Communication between the GIS, RS, and the IoT for rapid exchange and registration of pressure data changes in the distribution network.
According to the functions of IoT, suggestions were made to compensate for the deficiencies in the present work. This work led to the following suggestions for future research to improve modeling to evaluate pressure changes in the water distribution network:
● Definition of conceptual modeling to predict pressure and flow changes in the distribution network.
● Improving the quality of RS facilities equipped with data loggers, IoT, and the communication process between the georeferenced database.
● Definition of Relationship class for water system complications to achieve an intelligent method to access leakage points in the calibration process of the distribution network.
Acknowledgements
The authors thank all the experts for their valuable observations and for their suggestions that improved the quality of this work.
Data Availability Statement
All relevant data are included in the paper or its Supplementary Information.
Conflicts of Interest
The authors declared there is no conflict of interest.
Abbreviation List
DMA, District metering area
GIS, Geographic information system
GPS, Global positioning system
IoT, Internet of Things
NRW, Non-revenue water
RS, Remote sensing
References
[1] Asli HH. Investigation of the factors affecting pedestrian accidents in urban roundabouts. CRPASE, 2022; 8: 1-4. [DOI]
[2] Duan HF, Pan B, Wang M et al. State-of-the-art review on the transient flow modeling and utilization for urban water supply system (UWSS) management. J Water Supply Res T-AQUA, 2020; 69: 858-893. [DOI]
[3] Ferras D, Manso PA, Schleiss AJ et al. One-dimensional fluid-structure interaction models in pressurized fluid-filled pipes: A review. Appl Sci, 2018; 8: 1844. [DOI]
[4] Hariri Asli H, Pourhashemi A, Abraham AR et al. New Advances in Materials Technologies; Experimental Characterizations-Theoretical Modeling, and Field Practices. Apple Academic Press: USA, 2023.
[5] Lema M, Peña FL, Buchlin JM et al. Analysis of fluid hammer occurrence with phase change and column separation due to fast valve opening by means of flow visualization. Exp Therm Fluid Sci, 2016; 79: 143-153. [DOI]
[6] Möller G, Detert M, Boes RM. Vortex-induced air entrainment rates at intakes. J Hydraul Eng, 2015; 141: 04015026. [DOI]
[7] Asli HH, Hozouri A. Non-Revenue Water (NRW) and 3d hierarchical model for landslide. Larhyss J, 2021; 48: 189-210.
[8] Vardy AE, Brown JMB, He S et al. Applicability of frozen-viscosity models of unsteady wall shear stress. J Hydraul Eng, 2015; 141: 04014064. [DOI]
[9] Hariri Asli H, Tatrishvili T, Abraham AR et al. Sustainabe Water Treatment and Ecosystem Protection Strategies. Apple Academic Press: USA, 2023.
[10] Zecchin AC, Simpson AR, Maier HR et al. Parametric study for an ant algorithm applied to water distribution system optimization. IEEE T Evolut Comput, 2005; 9: 175-191. [DOI]
[11] Asli HH, Nazari S. Water Age and Leakage In Reservoirs; Some Computational Aspects And Practical Hints. Larhyss J, 2021; 48: 151-167.
[12] Zhao L, Yang Y, Wang T et al. An experimental study on the water hammer with cavity collapse under multiple interruptions. Water, 2020; 12: 2566. [DOI]
[13] Asli KH, Nagiyev FB, Haghi AK et al. Nonlinear heterogeneous model for water hammer disaster. J Balkan Tribol Assoc, 2010; 16: 209-222.
[14] Zhou L, Liu D, Karney B. Investigation of hydraulic transients of two entrapped air pockets in a water pipeline. J Hydraul Eng, 2013; 139: 949-959. [DOI]
Copyright © 2023 The Author(s). This open-access article is licensed under a Creative Commons Attribution 4.0 International License (https://creativecommons.org/licenses/by/4.0), which permits unrestricted use, sharing, adaptation, distribution, and reproduction in any medium, provided the original work is properly cited.


