Response Energy Behavior and Blast Damage Assessment of Unconstrained Simplified Dynamic Systems Subject to Blast Loading
Yijian Shi1*
1School of Mechanics and Safety Engineering, Zhengzhou University, Zhengzhou, Henan Province, China
*Correspondence to: Yijian Shi, PhD, Professor, School of Mechanics and Safety Engineering, Zhengzhou University, 100 Kexue Road, Zhengzhou 450001, China; Email: yijian.shi@zzu.edu.cn
Abstract
Objective: Understanding the response energy behavior of components in a dynamic system subject to blast loading is critical. The objective is to find the analytical relations between the response energy of free two degree of freedom (FTDOF) systems subject to blast loading and the parameters of the loading and the system itself so that the issues with damage assessment and response energy behavior can be resolved.
Methods: Energy ratio (ER) is selected to capture the response energy behavior of system components. The energy scaling method is used, which has been effective in previous study for constrained single degree-of-freedom systems. FEA simulation and given experimental results are applied in verification.
Results: Maximum response ER for FTDOF systems subject to blast loading is derived. Theoretical derivation and simulation reveal that response kinetic energy carried by any single mass alone out of two lumped masses in an elastic FTDOF system can be larger than the response kinetic energy of a rigid body system formed with any one of the two lumped masses alone subject to the same blast load. Proper mass ratio and timing are critical for the result. Further observations of a perfectly plastic FTDOF system and a simplified Hanssen pendulum system (SHPS) without allowing any disintegration demonstrates that the disintegration of the Hanssen pendulum system is the main reason for Hanssen’s unexpected results. This is not only supported by the observations in Hanssen’s experiment, but also reproducible with FEA simulation, in which 13% higher kinetic energy is observed due to the disintegration. FEA analysis also reveals that dishing and impulse amplification have no significant effects, less than 1.3% and 2% variations in the response energy of the simulated SHPS, respectively. However, the impulse amplification, which can directly impact response energy, is significant for light-weight objects or low-density low-resistance materials directly facing blast loading. For damage assessment, any FTDOF system can dynamically be converted into an equivalent single degree-of-freedom system.
Conclusion: The energy scaling method is effective in deriving the response ER analytically and obtaining the method of damage assessment for FTDOF systems. Maximum response ER≥1 for FTDOF systems is significant different from single degree-of-freedom systems. The disintegration of the Hanssen pendulum system is the main reason of the unexpected experimental results. Careful integration and constraint of components for systems constructed with cladding layers are extremely important. Effects of dishing and impulse amplification are ignorable on SHPS. Light-weight objects or low-density low-resistance materials directly subject to blast loading can result in unexpected error in FEA simulation. The method of damage assessment for FTDOF systems is developed.
Keywords: blast loading, response energy, pendulum experiment, damage assessment, energy absorption
1 INTRODUCTION
When more discretized degrees of freedom are applied in modeling a deformable structure, more accurate dynamic responses with multiple natural modes can be captured. However, to quickly capture the essential response characteristics of the deformable structure subject to blast loading, a simplified dynamic system can be used. As seen in previous studies[1-3], an intrinsic relationship between system variables and essential characteristics of system responses can be easily modeled or even revealed with derived analytical solutions. The level of the simplification applied tends to depend on tractability.
The simplest model among single degree of freedom (SDOF) systems subject to a blast load pulse is the free rigid body (or free lumped mass) shown in Figure 1A. The response energy (kinetic energy) of the simplest system is interestingly the same as the maximum value of SDOF systems with the same mass subject to the same load pulse[1]. A mass-spring SDOF system shown in Figure 1B is one of the simplest systems among all constrained deformable systems. The energy response behaviors of the SDOF system subject to a blast load has been analyzed with the innovative energy scaling method[1]. Response spectra of the system energy ratio (ER) for the SDOF system can characterize the response energy, which was validated using maximum displacements[2,3] and (P-I) diagrams[4,5]. Maximum energy ratio ERmax=1 for damage assessment for SDOF systems was validated with given data. Because the energy method is so effective in analytically deriving the response ER formula of SDOF systems subject to a blast load, this paper will expand the application of the method to two degrees of freedom systems.
Likewise, among all unconstrained deformable systems, the free two degree of freedom (FTDOF) system, consisting of two masses and a spring, is one of the simplest, as illustrated in Figure 1C. Hence, the FTDOF system will be selected as a representative of free deformable systems to be studied with the energy scaling method in this paper. If blast loading applied to the FTDOF system is treated as force, instead of energy, the blast energy absorption for the system should be considered as the minimization of system response energy. Therefore, understanding response energy behaviors is critical for damage assessment and blast mitigation, which have been attracting attentions[2,6-7] academically. With the energy scaling method, the response ER will analytically be solved, and response energy behaviors and damage assessment of the FTDOF system will be studied analytically.
|
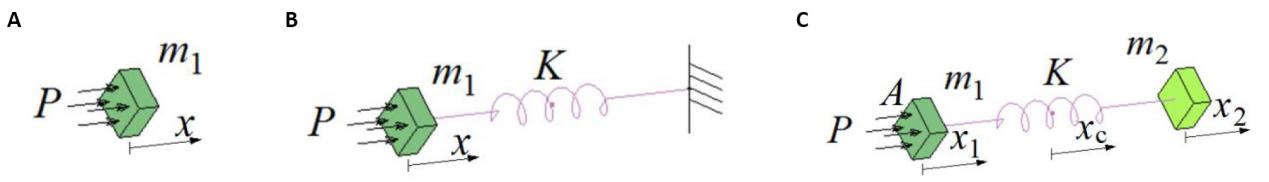
Figure 1. Simple systems subject to blast pressure P. A: A free rigid body; B: A constrained elastic mass-spring SDOF system; C: An elastic mass-spring FTDOF system.
There are a number of subsections laid out in this paper. Analytical ER formulas of FTDOF system components are derived in Section 2.1 with the energy method[1]. Based on the ER formulas, one of two major objectives-the relation between component energies and the FTDOF system parameters is analyzed in Section 2.2, which reveals that system disintegration of the FTDOF system can result in unexpectedly higher response energy on system components under certain circumstances. Hence Hanssen’s unexpected experimental results[8] can be explained, if the Hanssen pendulum system can be simplified as an FTDOF system. Sections 2.3-2.5 verify this finding with FEA simulation and experimental observation. Understanding the Hanssen’s unexpected experimental results is essential for the development of the energy systems with artificial cladding layers. The cladding layers, which have typically been made of nearly perfectly plastic materials[8] and have been studied[9-11] for years, are used in Hanssen pendulum systems. Hanssen et al.[8] observed that their pendulum system subject to blast loading has yielded unexpectedly higher response (kinetic) energy (Hanssen’s paradox), even with the cladding layers supposedly to absorb blast energy. Hanssen et al. attempted to explain the paradox with theoretical analysis and simulation, including investigation of the dishing effect shown by the double-curved front surface of the front panel deformed by the blast load. Based on the analysis of a simplified constrained plastic-elastic system, Ma and Ye[9] suggested that the test design of the pendulum system was improper for its intended purposes. However, the direct causes of the unexpectedly higher kinetic energy remained unexplained.
To further prove the disintegration is the main reason of the unexpectedly higher response energy for the system with the cladding layers, effects of the dishing and impulse amplification, which could be possible reasons resulting in Hanssen’s paradox, are studied in Sections 3.1-3.2, respectively. The other major objective - the damage assessment method for FTDOF systems is developed in Section 3.3.
2 MATERIALS AND METHODS
2.1 Response ER for an FTDOF System
The response ER for an FTDOF system is derived and analyzed with the energy method[1] in this section. The FTDOF system subject to blast loading is illustrated in Figure 1C. The system consists of two lumped masses (M1 and M2) and a massless spring with spring stiffness K. The location of the center of gravity (CG) is measured with the coordinate xc. The initial conditions are x1=x2=ẋ1=ẋ2=0, and the spring is at the natural length. Two formulas of dynamic equations of the system under the blast load F are
|
xc is defined as
|
The second derivative of Equation (2) can be expressed as (M1ẍ1+M2ẍ2)=(M1+M2)ẍc. By adding two formulas of Equation (1) for i=1 and 2, the terms of spring load can be canceled. Then, substitution of leftover terms (M1ẍ1+M2ẍ2) with the term (M1+M2)ẍc can yield
|
Equation (3) indicates that the response of the FTDOF system with respect to CG is dynamically the same as a free rigid body with lumped mass (M1 + M2) subject to the same blast loading. Therefore, the kinetic energy [Ek, M1+M2 (t)] of the system with the translation speed ẋc (or Vc) at CG equals the kinetic energy [Er, M1+M2 (t)] for a free rigid body with lumped mass (M1 + M2), or
|
in which I(t)=ʃ t0 Fdt. Simplifying {Equation (1) - Equation (3) × [Mi /(M1 + M2)]} for i=1 and 2, and rearranging the result with Equation (2) can yield
|
in which i, j=1, 2 and i ≠ j. Careful examination of each term in Equation (5) shows that (x1-xc) and (x2-xc) are the displacements of M1 and M2 with respect to CG, which are dynamically modeled by two constrained mass-spring SDOF systems subject to blast loading. The two systems described by Equation (5) have masses M1 and M2, spring stiffness K(M1+M2)/M2 and K(M1+M2)/M1 and pulse loads M2/(M1+M2)F and -M2/(M1+M2)F, respectively. The natural circular frequency of the two systems is
|
The directions of the excitation loads (or the blast load pulses) for the two systems are the opposite even though the load magnitudes are the same. Therefore, the displacements of M1 and M2 with respect to CG, (x1-xc), and (x2-xc) are synchronized in opposite directions under the initial values of (x1-xc)=(ẋ1-ẋc)=0 and (x2-xc)=(ẋ2-ẋc)=0.
Based on the energy conservation law, the work (E) done by blast loading should equal the total response energy of the FTDOF system, or the sum of the FTDOF system’s internal energy ʃ0x1-x2 Kxdx and the kinetic energy (Ek)
|
The last term of Equation (7) is always non-negative for K(x)≥0. This conclusion can be proved with the weighted mean value theorem for integrals. ʃ0x1-x2 Kxdx=K(ξ) ʃ0x1-x2 xdx=K(ξ)(x1-x2)2/2≥0, in which ξ is a value within the interval of integration. The sum of the first two terms on the right side of Equation (7) is the system kinetic energy Ek, which can be rewritten as
|
Equation (8) can be proven with Equation (2) and the formula of Er,M1+M2(t) in Equation (4). Because the last two terms in Equation (8) are positive, the total response kinetic energy is larger than or equal to the kinetic energy Er,M1+M2(t) for a free rigid body with mass (M1 + M2) subject to the same blast loading. Therefore,
|
which is true for any mass-spring FTDOF system subject to any blast loading, because Equations (2), (4), (7)-(8) used in the derivation process are true. Thus, the maximum value of ER(t) for the FTDOF system can be larger than or equal to 1, notably contrary to ER≤1 for the constrained SDOF system[1]. The analytical solution of ER(t) will be derived in the following discussion. The last term in Equation (7) can be rewritten as
|
Based on Equation (2) and integral transformation principles, Equation (10) can be further converted to
|
Similarly, according to the weighted mean value theorem for integrals, the two terms in Equation (11) are non-negative as well. Substituting Equation (8) and Equation (11) into Equation (7) can yield
|
in which
|
which is also true for any mass-spring FTDOF system subject to any blast loading. The dynamic principle, which the total mechanical energy of a dynamic system equals the sum of energy of each mode, can also verified the Equation (12), because the left side of Equation (12) is the sum of the mechanical energies of rigid-body and deformable natural modes. The two displacement variables of y1=(x1-xc) and y2=(xc-x2) in Equation (13) are defined with respect to CG. The total response energy E(t) of the FTDOF system subject to any blast loading in Equation (12) is a sum of the energy Er,M1+M2(t) carried by the free rigid body mode and the energy carried by the deformable mode with respect to CG. The second and third terms in Equation (12) are the total response energies EM1,CG and EM2,CG of the constrained SDOF systems that satisfy Equation (5). Furthermore, for a perfectly elastic FTDOF system subject to triangular blast loading, the terms EM1,CG and EM2,CG in Equation (12) can be rewritten as
|
in terms of the definition of the ER[1]. ER0 (q) in Equation (14) is given in Abbreviation List. Based on the definition Er,M = 0.5I2/M and corresponding parameters in governing Equation (15),
|
With the natural circular frequency ω defined in Equation (6), q=ωt. Therefore, based on Equation (12), the ER for a perfectly elastic FTDOF system subject to triangular blast loading can be obtained as the following continuous piecewise function. For q≤p (t≤t0),
|
and for q≥p (t≥t0), ER(q)=ER(p), or
|
The second term in Equation (17) is obtained by combining the following two terms
|
for i=1,2, where mass ratio Mr=M2/M1 and the definition Er,M =0.5I2/M are applied. The first and second terms in Equation (17) represents the ERs of the rigid and deformable modes of the system. Equations (16) and (17) are the analytical solution of ER for FTDOF systems subject to blast loading, which will be used to investigate the response energy behavior of system components.
2.2 Response Kinetic Energy of Components in Elastic FTDOF and SDOF Systems
With the energy method and results from the study of constrained SDOF systems[1], the relation between the total response energy E (or EM1+M2) of an FTDOF system and the response kinetic energy of a free rigid body with lumped mass (M1 + M2) was discussed in Section 2.1. The maximum ER for any FTDOF system subject to any blast loading is greater than or equal to one, i.e., ERmax=Emax/Er,M1+M2≥1. However, the ER for a constrained SDOF system is always less than or equal to one according to the record[1]. The delineating value between the maximum ERs of FTDOF and SDOF systems is ERmax=1, which is the maximum ER of a free rigid body subject to the same blast loading. The ceiling (Er) of total response energy (E) of the SDOF system is broken by the FTDOF system. Derived Equations (16) and (17) notably reveals that the relationship of the energy and mass ratios is linear. These relationships of response energy, covering the entire ER domain [0, ∞), will be helpful in explaining the relationship of response energy observed by Hanssen et al[8].
Assume Hanssen’s pendulum system can be considered an FTDOF system. According to Hanssen’s test results in the study[8], the response kinetic energy of the single bare pendulum (similar to mass M2 in an FTDOF system) alone in the pendulum system with sacrificial cladding layers (similar to mass M1 in the FTDOF system) was unexpectedly higher than the response kinetic energy (Er,M2) of the bare pendulum alone when subjected to the same load pulse, as described by the inequality Ek,M2>Er,M2. The following discussion will reveal the circumstances in which the inequality is true.
From Equation (18) for i=2, EM2,CG=Mr/(1+Mr) ER0 (p) Er,M1+M2 (p). If mass ratio Mr is large enough, Mr/(1+Mr) 1, EM2,CG Er,M1+M2 ER0 (p). Because the maximum value of ER0 (p) is one, EM2,CG Er,M1+M2 can be derived. Because kinetic energy Ek, M2,CG equals EM2,CG when internal energy is zero at (x2-xc)=0, the maximum kinetic energy Ek, M2,CG Er,M1+M2. Since a solution (ẋ2-ẋc)>0 exists at (x2-xc)=0 for the elastic dynamic system satisfying Equation (5) for i=1 at q ≥ p (t ≥ t0) and ẋc>0, Ek, M2=0.5M2ẋ22=0.5M2(ẋ2-ẋc+ẋc)2>0.5M2(ẋ2-ẋc)2=Ek, M2,CG. Therefore, Ek, M2>Er,M1+M2 is true under certain circumstances. Furthermore, because Er, M2=(M1 + M2)/M2Er,M1+M2 for the same triangular load impulse, increasing mass ratio Mr yields the asymptotic approximation Er, M2 Er,M1+M2. Hence, Ek, M2>Er, M2 can be derived under certain circumstances (Remark 1). Likewise, from Equation (18) for i=1, Ek, M1>Er,M1 can be derived under certain circumstances as well.
The preceding analysis is relatively comprehensive. Three simple systems with different conditions will be simulated to verify the obtained relationships of response energies and reveal more possible relationships. The three simple systems subject to a blast pressure P are a free rigid body with mass M1, a constrained elastic SDOF system with spring stiffness K, and an elastic FTDOF system with the same spring stiffness K, shown in Figure 1A-1C, respectively. The blast pressure, generated with LS-DYNA[12] to simulate a 1 (kg) TNT charge located 1.5m away from the front surface of M1 (A=0.02×0.02m2), has peak pressure P0=1.5057MPa and pressure impulse I/A=341Pa∙s, from which the calculated characteristic time to is about 4.53×10⁻⁴s for an equivalent triangular blast load. The rectangular rigid blocks of M1 and M2 have the same geometric dimensions (0.02×0.02×0.01m3). The spring stiffness K is 3×10⁶N/m.
The simulation conditions and results are summarized in Table 1. EXP denotes the blast load generated by LS-DYNA[12] (negative phase dictated by the selected Friedlander equation) and TRI denotes the triangular blast load that is equivalent to EXP in impulse, respectively. The time history of EXP exponentially decays with time after peaking. Four simulation cases (Cases 1-4) in Table 1 are designed to verify the theoretical results for SDOF systems, and six simulation cases (Cases 5-10) are designed to verify the theoretical results for FTDOF systems. For each case of SDOF in Figure 1B or FTDOF in Figure 1C systems, the corresponding free rigid body in Figure 1A with the same total mass is simulated to compute Er and ER for comparison. Actual I/A is the pressure impulse reversely computed by Er=I2/(2M), where the Er value is obtained from the simulation; Er, M2 can be calculated based on the formula Er,M2=(M1+M2)/M2 Er,M1+M2. M0 is assumed to be 0.0732kg.
Table 1. Simulation Results for the Three Different Systems
Case |
Simulated System |
Blast Load |
M1 (kg) |
M2 (kg) |
Er, M2 (J) |
Emax (J) |
Actual I/A (Pa∙s) |
p |
ER |
Maximum Ek, M1 (J) |
Maximum Ek, M2 (J) |
1 |
SDOF in Figure 1B |
EXP |
Mo |
|
|
0.0538 |
- |
2.9000 |
0.4410 |
0.0440 |
|
2 |
Free Rigid in Figure 1A |
EXP |
Mo |
|
|
0.1220 |
334 |
|
|
|
|
3 |
SDOF in Figure 1B |
TRI |
Mo |
|
|
0.0794 |
- |
2.9000 |
0.6244 |
0.0787 |
|
4 |
Free Rigid in Figure 1A |
TRI |
Mo |
|
|
0.1271 |
341 |
|
|
|
|
5 |
FTDOF in Figure 1C |
EXP |
Mo |
Mo |
0.1222 |
0.0734 |
- |
- |
1.2013 |
0.0641 |
0.0641 |
6 |
Free Rigid in Figure 1A |
EXP |
2Mo |
- |
- |
0.0611 |
334 |
|
|
|
|
7 |
FTDOF in Figure 1C |
TRI |
Mo |
Mo |
0.1272 |
0.0875 |
- |
- |
1.3758 |
0.0828 |
0.0828 |
8 |
Free Rigid in Figure 1A |
TRI |
2Mo |
- |
- |
0.0636 |
341 |
|
|
|
|
9 |
FTDOF in Figure 1C |
TRI |
0.1Mo |
1.9Mo |
0.0669 |
0.1737 |
- |
- |
2.7311 |
0.0834 |
0.0894 |
10 |
FTDOF in Figure 1C |
TRI |
1.9Mo |
0.1Mo |
1.2720 |
0.0637 |
- |
- |
1.0017 |
0.0617 |
0.0047 |
Values of the actual I/A in Table 1 are provided for reference and should be equivalent to the originally set pressure impulse value of 341Pa∙s. For obtained data in Table 1, the pressure impulse I/A for TRI in Cases 4 and 8 is the same as the originally set value 341Pa∙s, but the pressure impulse I/A for EXP is 334Pa∙s in Cases 2 and 6. The difference in the pressure impulse between TRI and EXP is about 2%, which can be explained as follows. Blast pressure loading for TRI cases (Cases 3-4, 7-10 in Table 1) is evenly applied onto the front surface, and the direction of the loading is perpendicular to the front surface, as shown in Figure 1. However, pressure loading for EXP (Cases 1-2, 5-6 in Table 1) is radially loaded from an offset point. In addition, the 2% error can also be caused in part by numerical errors such as discretization errors.
Based on the simulation results for elastic SDOF systems (Cases 1-4) shown in Table 1, the conclusion that ER≤1 is well-confirmed by observed ER values. The response energy of the SDOF systems (Cases 1 and 3) is less than Er (Emax in Cases 2 and 4). Additionally, the ER value (0.6244) with TRI (Case 3) is about 30% larger than the value (0.4410) with EXP (Case 1), which indicates that TRI loading can result in a much larger response energy than EXP loading. These observations are consistent with the properties of response energies of constrained SDOF systems[1].
On the other hand, based on observations of the elastic FTDOF systems shown in Cases 5-10 in Table 1, the conclusion of ERmax≥1 is demonstrated. Comparison between TRI (Case 7) and EXP (Case 5) reveals that the ER value for elastic FTDOF systems with TRI is about 13% larger than those with EXP, similar to the aforementioned trend for elastic SDOF systems. By keeping the total system mass of (M1+M2) the same, the mass distributions or ratios (Mr=M2/M1) are studied by purposely setting M2/M1 as 1:1, 19:1, and 1:19 for Cases 7, 9, and 10 in Table 1, respectively. Notably, system response energies for the three cases are significantly different, even under the same TRI loading.
Maximum kinetic energies of M1 and M2 are shown in the last two columns in Table 1. Interestingly, maximum response kinetic energy of either M1 or M2 in the FTDOF systems, including Cases 5, 7, and 9, can be larger than Er,M1+M2, which is impossible for constrained SDOF systems[1]. Response energies for all three components in the FTDOF systems, which are the kinetic energy of M1, the kinetic energy of M2, and the potential (internal) energy of the spring, are plotted in Figure 2. The preceding conclusion that the response kinetic energy (curves B and C) of either M1 or M2 in the FTDOF systems, excluding Case 10, can be larger than Er,M1+M2 (curve D), is clearly confirmed in certain time intervals. In addition, the response kinetic energy (curve F) of (M1 + M2) in FTDOF systems subject to TRI and EXP loading, as shown in Figure 2A and Figure 2C, can be constantly larger than Er,M1+M2 (curve D), which is consistent with Equation (9).
|

Figure 2. Simulation results for the kinetic energy (Er) of the rigid body with (M1 + M2), kinetic energies (Ek,M1, Ek,M2, Ek,M1+M2) of M1 or/and M2, potential energy of the spring, and total response energy of the FTDOF system. A: For Case 5; B: For Case 7; C: For Case 9; D: For Case 10.
The significant effects of the mass ratios (M1/M2) on the kinetic energies of M1 and M2 can also be observed in Figure 2, especially for Case 9 (M1/M2=1:19). In certain time intervals in Case 9 (Figure 2C), not only are the kinetic energies of M1 and M2 significantly larger than Er, but also the kinetic energies of M2 (Ek,M2) are much larger than Er,M2=0.0669J. The existence of these time intervals for Case 9 can be clearly observed near times t1 and t2 in Figure 3. M2 kinetic energy Ek,M2 peaks with much larger magnitude than Er,M2 (curve D in Figure 3A) at time t1 when the spring is at the neutral position with zero internal energy, which is consistent with Remark 1. Meanwhile, the velocities of M1 and M2 reach a negative valley and a positive peak (Figure 3B), respectively, and there is no relative displacement between M1 and M2 (Figure 3C). If the spring in the FTDOF system somehow breaks at moment t1, M2 could freely move forward (with positive velocity) independently with the peak of the kinetic energy Ek,M2 larger than Er,M2, which verifies Remark 1, while M1 could move at its peak velocity in the opposite direction. Likewise, M1 moving forward with the peak of the kinetic energy Ek,M1 (≥ Er,M1) can occur near time t2 as per Figure 3. If the spring break occurs, the break time could be at or after the spring failure.
|
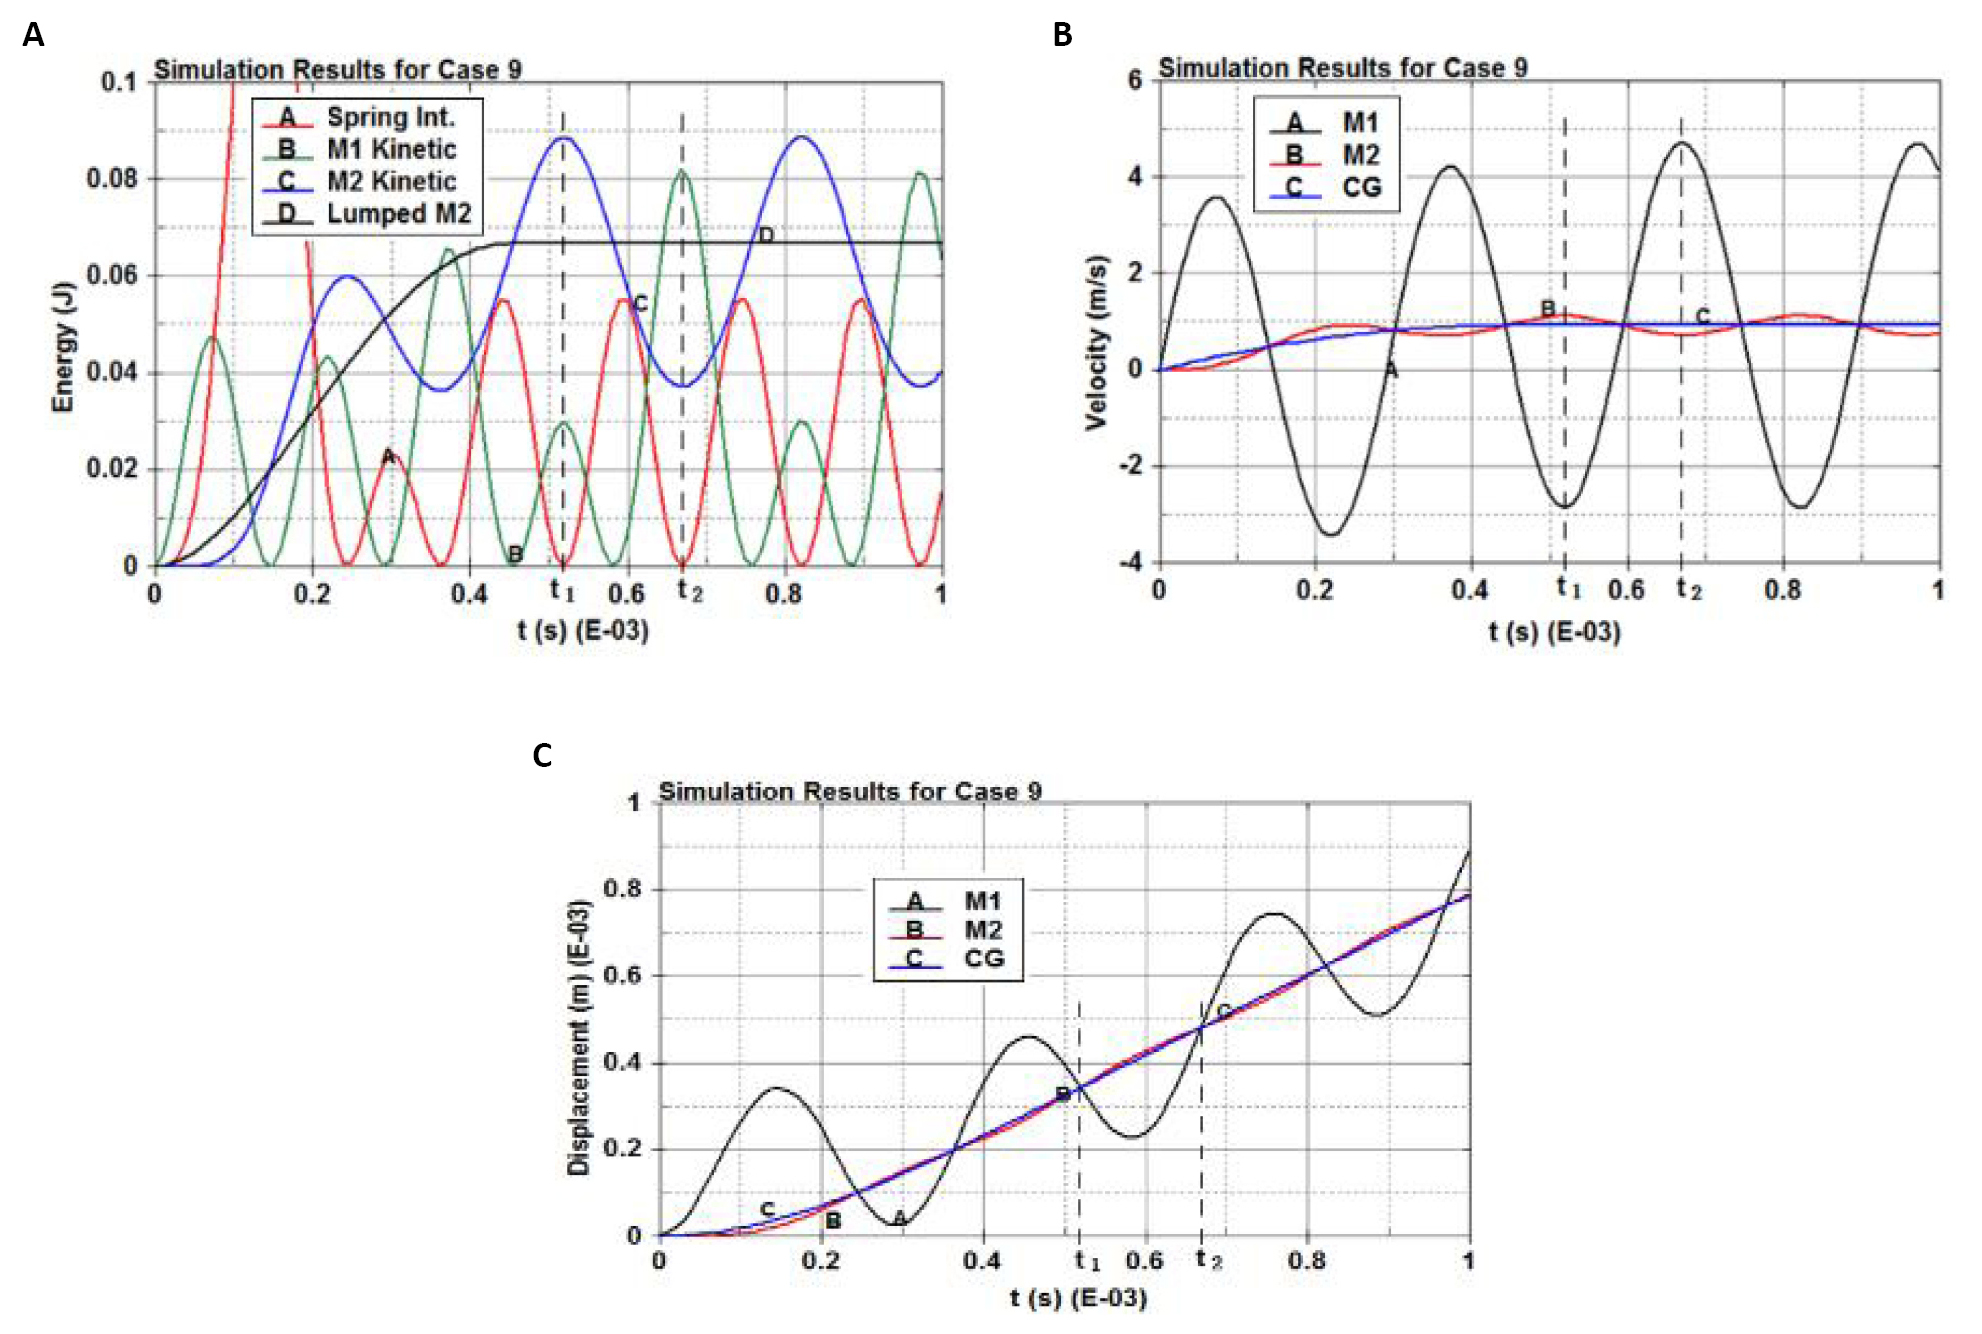
Figure 3. Close-up view of Case 9 results. A: The spring internal energy, M1 and M2 kinetic energies (Ek,M1 and Ek,M2), and free rigid body kinetic energy with lumped mass M2 (Er,M2); B: Velocity; C: Displacement at M1, M2, and CG locations.
In summary about responses of FTDOF systems, mass ratio Mr is critical to Ek,Mi, Er,Mi, and ER. Larger can most likely result in Ek,Mi≥Er,Mi at certain time intervals, and magnify ER with the same total mass and blast loading, which is in agreement well with Equations (16) and (17).
The new findings above provide an optimal explanation for Hanssen’s test results[8]. If the bare steel pendulum at the initial vertical position can be assumed a free rigid body moving in the horizontal direction, the response energy of the pendulum, which has been defined as the reference case in the study[8], would be Er with respect to the equivalent bare pendulum mass M2, or Er,M2. The cladding layer (a combination of the front aluminum panel and aluminum foam) can be analogized as a combination of M1 and spring K, which is attached to the front face of the bare pendulum. Therefore, the cladding layer and the bare steel pendulum together would form an FTDOF system. The spring can be broken during the test, as shown by the observed separation[8] of the bent front panels, failed aluminum foam, and bare pendulums in the test photos. Thus, the new findings are in full agreement with Hanssen’s test results showing that the kinetic energy of the bare pendulum (EK,M2) in the FTDOF system was unexpectedly larger than the reference energy (Er,M2), even if this only occurred in limited time intervals. Moreover, the response kinetic energy of the pendulum (EK,M2) may have poor repeatability in additional tests due to uncertainty at the time of breaking or disintegration. This can be observed from Hanssen’s test.
Having explained Hanssen’s test results above, a shortcoming is that the combination of the aluminum foam and panel is not elastic for large deformation, but is rather more likely perfectly plastic. Therefore, replacement of the elastic materials with nearly perfectly plastic materials is investigated in the following section.
2.3 The Response Energy EM2 in a Perfectly Plastic FTDOF System without Disintegration
For a perfectly plastic FTDOF system with disintegration, whether the kinetic energy carried by M2 can be larger than Er (or Er,M1+M2) and Er,M2 will be studied in this section. In terms of Equation (2), the velocity at CG can be written as
|
For the two masses M1 and M2 together without separation in the perfectly plastic FTDOF system, the condition VM1≥VM2≥0 should be satisfied. The condition VM1≥VM2 can be rewritten as VM1=VM2+∆V in which ∆V≥0. Substituting Equation (19) into Equation (4) and eliminating VM1 gives
|
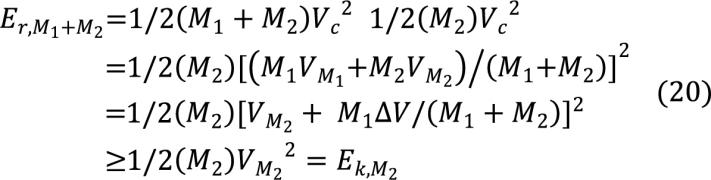
Therefore, if there is no separation for the perfectly plastic FTDOF system, the response kinetic energy (Ek, M2) of M2 in the system cannot be larger than either the rigid body response energy (Er,M1+M2) of the system, according to Equation (20), or Er,M2(≥Er,M1+M2 due to the decrease in mass in the general definition Er,M =0.5I2/M). Therefore, the inequality Er,M2≥Er,M1+M2≥Ek,M2 for the perfectly plastic FTDOF system is universally true under the condition that there is no separation of M1 and M2 (Remark 2), which differs from Remark 1 concluded for the elastic FTDOF system. Furthermore, as long as VM1≥VM2, this conclusion is also true for any FTDOF system. By using the same assumptions and analogy between the FTDOF system and Hanssen pendulum system presented in Section 2.2, Hanssen’s unexpected test results[8] seemingly cannot be explained with Remark 2. However, this situation can be resolved by removing the assumption that no separation occurred. This will be discussed in-depth in Section 2.5.
2.4 Dynamic Simulation of a Plastic FTDOF System without Disintegration
The inequality from Remark 2 in Section 2.3 will be verified using the simplified Hanssen pendulum system (SHPS) shown in Figure 4. Although materials used for cladding layers such as the aluminum foam in the actual Hanssen pendulum[8] are not exactly perfectly plastic, all contact surfaces between components are assumed to be well-bound such that the SHPS does not disintegrate when subject to blast loading in order to satisfy the condition VM1≥VM2. The SHPS can approximately be treated as a plastic FTDOF system in the horizontal direction which will be proven with dynamic principles and simulations in the following discussion.
|
Figure 4. Schematic diagram of SHPS.
Symbols M, M1, F, Cw, s, d, dc, α and αc in Figure 4 denote the mass of the bare pendulum (without the front panel and aluminum foam), the mass of the front panel and aluminum foam, the blast force, the mass moment of inertia of M with respect to the pivot point O, the distance between O and the center of the base plate of the pendulum, the distance between O and C1 (the CG of M), the distance between O and C (the CG of the SHPS), the angular displacement of the bare pendulum frame, and the angular displacement of CG of the SHPS, respectively. Based on the angular momentum theorem, the rotational dynamic equation with respect to the pivot O can be obtained as
|
in which (CW+M1s2) is the mass moment of inertia of the SHPS with respect to the pivot O. α1 denotes the angular displacement of CG of the front panel and aluminum foam, and α2 denotes the angular displacement of the center of the base plate of the pendulum in Equation (21). The initial angles α α1 α2 and αc are nearly zero. Displacements of these angles are assumed to be very small until the moment when the blast load vanishes. Thus, Equation (21) can be simplified as
|
Where M’2=CW/s2 or the equivalent mass of M, and xc=sαc is the x-coordinate of the intersection point of the extension line of OC in Figure 4 at instant time t. If M2=M’2 in Equation (3), Equation (22) demonstrates that the SHPS can approximately be considered as an FTDOF system dynamically in the horizontal direction x (Remark 3).
The preceding conclusions including Remarks 2-3 will be further verified with the following simulations using the LS-DYNA FEA explicit solver[12]. To keep the dynamic similarity between the SHPS and the original Hanssen pendulum system[8], dynamically influential parameters such as M, M1, Cw, s, etc. in the SHPS are configured within the ranges used in the original Hanssen pendulum system, although some geometric details of pendulum frame are ignored. The blast pressure pulse, which may affect the entire pendulum frame in Hanssen’s test, is only applied to the base surface (0.7m × 0.684m) of the pendulum frame and the front panel in the simulations. Values of useful parameters for the simulated SHPS (see Figure 5) are recorded in Tables 2 and 3.
Table 2. Pendulum Parameters without the Front Panel and Foam
Condition |
Pendulum Mass M (kg) |
Moment of Inertia for M, Cw (kg‧m2) |
O to CG of M, d (m) |
Loading Surface (m × m) |
Charge Offset, e (m) |
O to Load Center, s (m) |
Hanssen's Test[8] |
935-959 |
2889-2989 |
1.645-1.651 |
0.7 × 0.684 |
0.5 |
2.0 |
Simulation |
935 |
2884 |
1.641 |
0.7 × 0.684 |
0.5 |
2.0 |
Table 3. Pendulum Parameters with the Front Panel and Foam
Condition |
Total Mass (M + M1) (kg) |
Total Moment of Inertia, Cw (kg‧m2) |
CG of (M + M1) to O (m) |
Loading Surface (m × m) |
Charge Offset, e (m) |
Mass of (Front Panel + Foam) or M1 (kg) |
CG of M1 to O, s (m) |
Hanssen's Test[8] |
935-959 |
2889-2989 |
1.645-1.651 |
0.7 × 0.684 |
0.5 |
Foam: 150-350kg/m3, 1-5MPa; Front Panel: 11.8kg |
2.0 |
Simulation |
951 |
2949 |
1.647 |
0.7 × 0.684 |
0.5 |
Foam: 150kg/m3, 4.309kg, 1.08MPa; Front Panel: 11.8kg |
2.0 |
|
Figure 5. 3D FEA model of SHPS. A: w/o the front panel and foam; B: w/ the front panel and foam.
In order to compare results between the pendulum systems with and without the front panel and foam, both cases in Figure 5 are simulated. The yield stress, Young’s modulus, and Poisson ratio of the aluminum front panel (11.8kg, 0.7m × 0.684m × 0.01m) are 130MPa, 69GPa, and 0.33, and the Young’s modulus and Poisson ratio of the aluminum foam (4.309kg, 0.7m × 0.684m × 0.06m) are 70MPa and 0, respectively. The relationship of compressive stress to volumetric strain of the foam is plotted in Figure 6, in which the ultimate compressive strength is about 1.08MPa. The foam is modeled with MAT_CRUSHABLE_FOAM (#063) in LS-DYNA, which has been validated for simulating aluminum foam[13].
|
Figure 6. Compressive stress over volumetric strain of the aluminum foam.
The first case as shown in Figure 5A is used to simulate the response of a rigid bare pendulum system without the front panel and foam (M1=0 and M2 ≠ 0) subject to a blast load. The values of useful parameters for this case are shown in Table 2. The pressure peak of the blast load with a 1kg TNT charge is about 30MPa at the center of the front surface. The simulation results indicate that there is barely any angular displacement at the end (t0) of the blast load, which confirms the critical assumption in the derivation of Equation (22). According to simulation results, the total maximum response (kinetic) energy E is 161.5J, and the input impulse I projected to the x-direction (horizontal direction) is 480.9N∙s. Although these E and I values are unintentionally close to those observed under similar conditions in the study[8], the matching values of those results are less important than the relative changes of these values between different conditions. In terms of Equation (22), the equivalent mass of the bare pendulum as a free rigid body moving in the horizontal direction is M’2 =M2=CW/S2=2884/22=721kg. The maximum kinetic energy of the bare pendulum as a lumped mass M2 can theoretically be calculated as
|
which is very close to the simulated maximum E=161.5J, with about 0.7% error. Therefore, the simulation for the first case demonstrates Remark 3.
The second case shown in Figure 5B is used to simulate the response of an SHPS with the front panel and foam subject to the same blast load, which will be carried out in two parts for the purpose of comparison. The values of useful parameters for the SHPS are shown in Table 3. The first part of the simulation in the second case treats the pendulum as a rigid body with a lumped mass (M1 + M2), and the second part of the simulation treats the pendulum as a plastic SHPS. By assuming the entire SHPS with the front panel and foam is rigid, the free rigid body system with lumped mass (M1 + M2) can be simulated. Er,M1+M2 from the simulation is about 157.5J. Theoretically, the maximum kinetic energy of the rigid SHPS as a lumped mass (M1 + M2) can be calculated
|
which is very close to the simulated maximum energy E157.5J at about 0.4% error. Therefore, the rigid body simulation again demonstrates Remark 3.
For the second part of the simulation in the second case, the rigid body assumption only applies for the bare pendulum frame in the SHPS. The simulation results are shown in Figure 7, in which each energy includes the sum of the kinetic and internal energies. In order to compare energy quantities in the same chart clearly, logarithmic scale is used. Response energies of “bare pendulum alone as a system,” “bare pendulum component in a system,” and “rigid entire pendulum system” denote Er,M2, Ek,M2 and Er,M1+M2, respectively. Because the bare pendulum frame is rigid, its total energy equals the kinetic energy Ek,M2. The maximum value of Ek,M2 is about 157.8J from the simulation. Comparing Ek,M2157.8J to the preceding results of and Er,M2=161.5J, the resulting relationship Er,M2>Er,M1+M2Ek,M2 is observed, which approximately supports Remark 2 (Er,M2≥Er,M1+M2≥Ek,M2).
|
Figure 7. Response energy of the SHPS w/o separation subject to blast loading.
In addition, the contributing factor of condition VM1≥VM2 is checked. According to the simulation results, there is no separation between the front panel and foam and between the foam and pendulum base. However, velocity VM1 cannot be accurately obtained because M1 is deformable. Velocities VM1 and VM2 of M1 and M2 at their CGs, respectively, satisfy the condition VM1≥VM2, especially at the initial loading phase of the blast pressure pulse. This observation, though, cannot exclude some limited portions of M1 that do not strictly satisfy the condition VM1≥VM2 because M1 is not rigid.
2.5 Effect of Disintegration on Response Energy of an SHPS
In order to explain Hanssen’s results, Sections 2.2-2.4 investigate all possible cases. Based on theoretical analysis and simulation on an elastic FTDOF system in Section 2.2, Ek, M2 ≥ Er, M2 is sometime true, which agrees with Hanssen’s unexpected results. However, because the Hanssen pendulum system is neither elastic nor perfectly plastic, but is closer to the latter, further study is carried out in Sections 2.3-2.4. For an FTDOF system under the perfectly plastic and no separation conditions (VM1VM2), the inequality Er,M2Ek,M2 is derived in Section 2.3 and mostly supported by the simulation results in Section 2.4. Failure to demonstrate Remark 1 hints that disintegration must occur in the Hanssen pendulum system.
The assumption of no system disintegration means the front panel, foam, and pendulum are bound together very well between their contact surfaces such that they can resist the blast load without separating from each other. However, these components were clearly stacked and wrapped together with long cable ties[8]. The wrapping ties can be loosened under the blast load, as shown in the published photos[8]. Therefore, the following simulation will assume these components are simply stacked without the contact surfaces tied together. All other conditions will be kept the same as in the preceding section.
The simulated result is shown in Figures 8 and 9. The simulated displacement response of the pendulum system in the x-direction is exhibited in Figure 8 at different time steps immediately after the explosion. The disintegration (component separation) of the system can be clearly observed in the sequential images in Figure 8, where the front panel is in the process of detaching. The gap on the image at t=0.0058s indicates the front panel is fully detached.
|
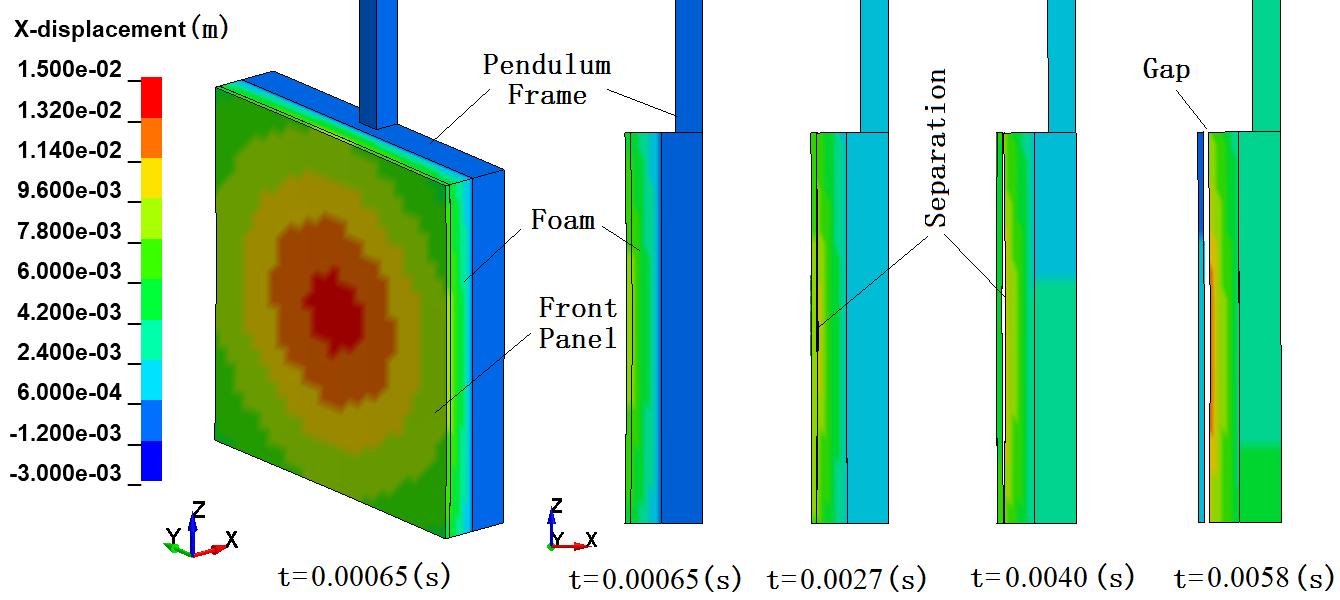
Figure 8. SHPS response in time sequence.
|
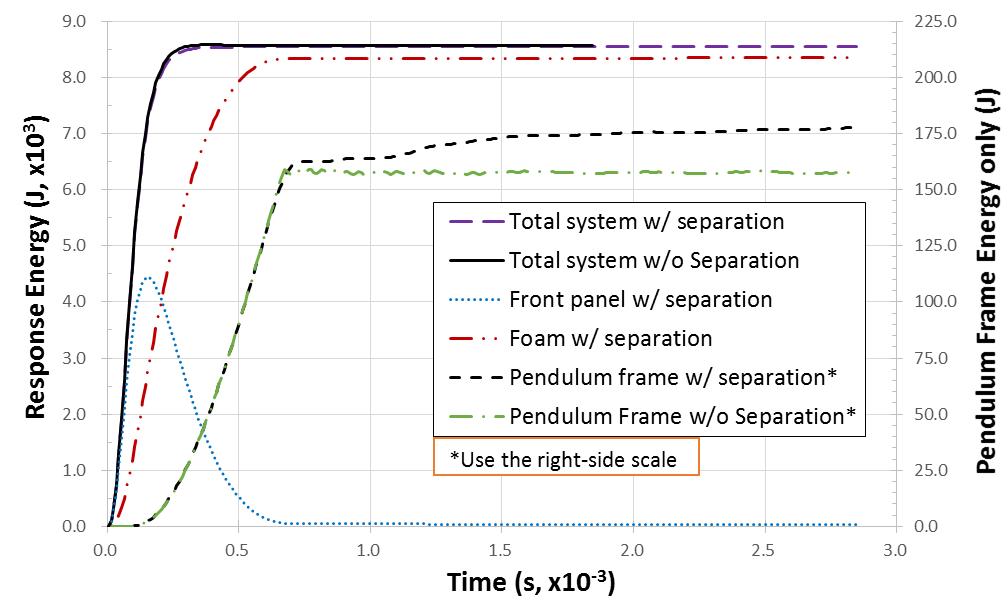
Figure 9. Response energy of SHPS.
The response energies of the SHPS system, front panel, foam, and pendulum frame are plotted in Figure 9. For comparison, the response energies of the previously simulated system without separation and its pendulum frame are also plotted in Figure 9, and the response energies of the pendulum frame with and without separation are plotted with respect to the secondary vertical axis on the right-hand side. Although there is a slight difference between the total response energies of the systems with and without separation, both energies have much higher values than the energies of the two pendulum frames (kinetic energies). The significant difference between the two response energies of the pendulum frames with and without separation can be notably observed in Figure 9, even though they are almost the same during the initial loading period until t=0.0007s. The relative difference between the values of 178J for the former and 157.8J for the latter is about 13% at about t=2.85×10⁻³s. In addition, the response kinetic energy (Ek, M2=178J) of the pendulum frame with separation allowed is significantly larger than the response kinetic energy (Er, M2=161.5J) of the pendulum frame as a free rigid body system. These observations are in full agreement with Hanssen’s test results[8]. Therefore, system disintegration is the most likely reason behind the unexpectedly higher kinetic energy of the pendulum frame in the SHPS system with cladding layers.
The transient phase of system response in Figure 9 can explain the higher kinetic energy Ek, M2 of the pendulum frame in the Hanssen pendulum system. Near the end or immediately after blast loading, the response energies of components in the pendulum system begin to redistribute. Some internal energy is released and converted to kinetic energy. Some components bounce back, such as the front panel, as observed in Figure 8, and push others forward as per the momentum conservation law. In addition, the surface contact and fitting of the components are not seamless due to actual surface conditions, which affect component interactions. Therefore, the irregularity of real-life conditions likely contributed to the poor repeatability of Hanssen’s test results.
Although the SHPS system with a cladding layer does not show the reduction of total system response energy (EM1+M2) or even the kinetic energy (Ek,M2) of the bare pendulum frame in the system with respect to Er, M2, the transmitted (response) peak load onto the pendulum surface is indeed reduced for the simulation case, as plotted in Figure 10, due to the cladding layer. The effect of the cladding layer is consistent with other results[10,14].
|
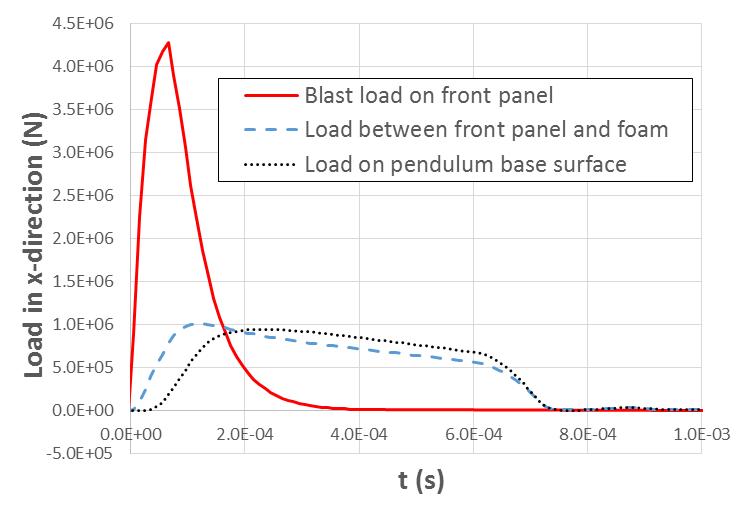
Figure 10. Response load of SHPS with separation.
3 Results AND DISSCUSION
3.1 Dishing Effect on Response Energy of an SHPS
The preceding discussion of the pendulum system in Sections 2.4-2.5 reveals that Hanssen’s unexpected test results are mainly caused by system disintegration. However, another possible argument mentioned in the research of Hanssen et al.[8] proposes that the dishing (2-D curved surface) of the front panel surface deformed by the blast might explain Hanssen’s test results. The dishing effect will be further investigated in this section.
The initial conditions of the SHPS discussed in Section 2.4 assume that the front surface of the front panel is flat and 0.5m away from the explosive charge, which is the minimum distance projected in the x-direction between a point on the front surface (dishing surface) and the charge, i.e., the offset e defined in Figure 4. The same definition of the offset will continue to be used in following discussion. The dishing depth is defined as the maximum span projected in the x-direction between any two points on the concave front surface. According to the simulation results of the SHPS (with initially flat front surface) in Section 2.4, there is about 10mm dishing depth on the front surface of the front panel after blast loading. Based on simulation results, the response energy of the bare pendulum frame in the SHPS is ≈157.8J, which is already less than Er, M2=161.5J. The suspected dishing effect which might result in a significant increase in response energy is not observed for the SHPS. Preliminary findings indicate that the suspected dishing effect may not exist. For further verification, two more cases with the same dishing surface are simulated in Table 4 and compared with the reference case of the SHPS discussed in Section 2.4.
Table 4. Maximum Response Energy of Pendulum Systems with Dishing Effect
Case |
Initial Condition |
Impulse on Front Panel |
Foam Response Energy |
Bare Pendulum Response Energy |
Total System Response Energy |
Ref. |
The same as discussed in Section 2.5 |
487 (N∙s) |
8337 (J) |
158 (J) |
8580 (J) |
1 |
Foam density increases 18.7% |
488 (N∙s) |
8271 (J) |
159 (J) |
8505 (J) |
Relative difference wrt. Ref. |
0.20% |
-0.80% |
0.60% |
-0.90% |
|
2 |
Foam volume increases 18.7% |
489 (N∙s) |
8446 (J) |
159 (J) |
8691 (J) |
Relative difference wrt. Ref. |
0.40% |
1.30% |
0.60% |
1.30% |
The profile of the dishing surface is critical for the two simulation cases. The selected dishing surface is the same as the actual deformed front surface of the front panel from the simulation results at t=0.00078s in the reference case. The depth of the dishing surface is about 10mm. The geometrical dimension and shape of the pendulum system for Case 1 in Table 4 are the same as those of the deformed SHPS at t=0.00078s in the reference case. Because the volume of the original front panel is barely changed while the volume of the original foam decreases by 18.7% due to compression, to compare to the simulation result of the reference case, construction of the pendulum system for Case 1 requires an 18.7% increase in the foam density (from original 150kg/m3 to 178kg/m3) in order to keep mass unchanged. For meaningful comparison between simulated dynamic systems, dynamic similarity is required, for which keeping mass unchanged is critical. Likewise, the pendulum system for Case 2 is formed by keeping all parameters the same as those of the deformed SHPS at t=0.00078s, except for the 18.7% increase in the volume of foam in order to keep mass unchanged. Setting the charge offset e to 0.5m gives blast load impulses in the simulations similar to the reference case impulses[8] using the same offset, as shown in Table 4. The two examples of SHPS with 10 (mm) dishing are illustrated in Figure 11.
|
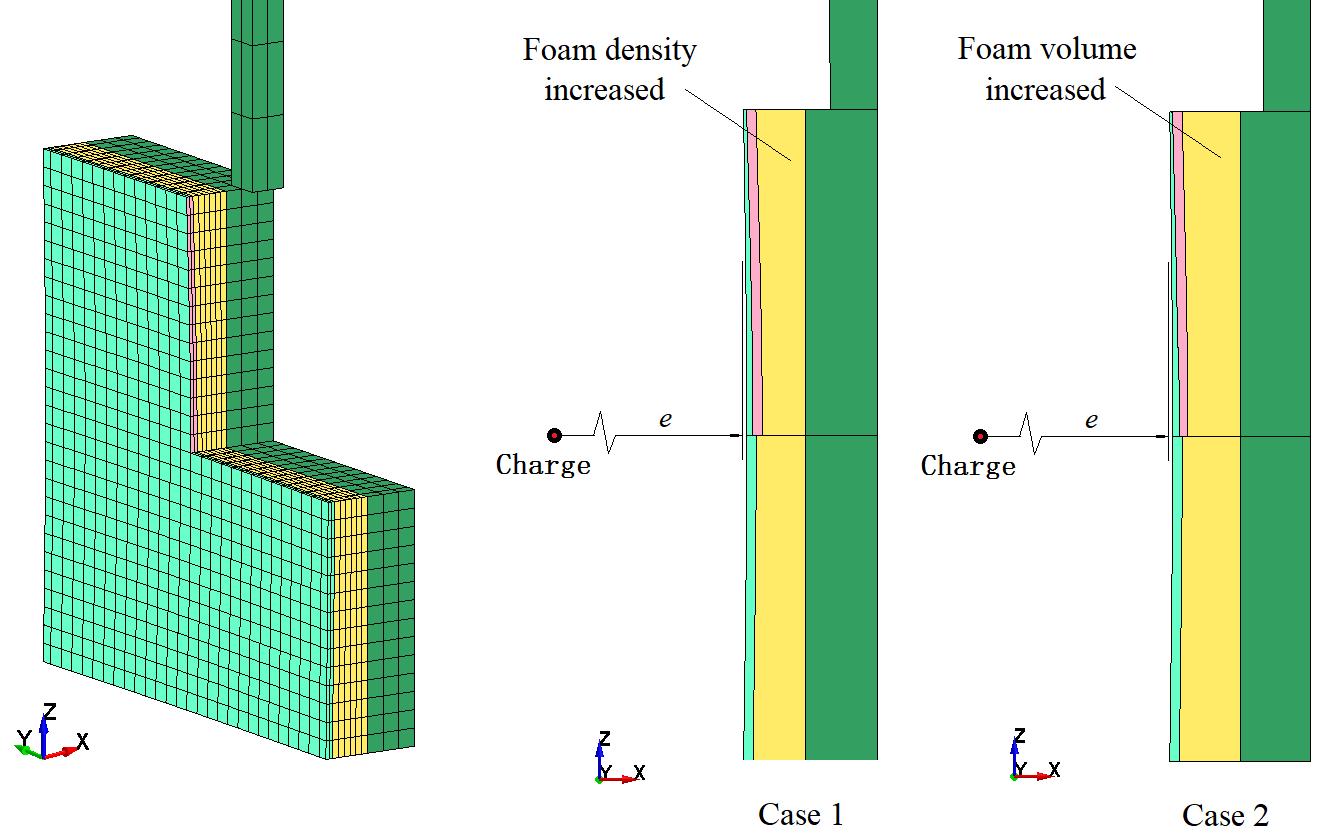
Figure 11. Cut-off section view of dished FEA models.
The simulated response energies for both cases are summarized in Table 4, besides the very small response energy of the front panel. In comparison to the reference case, the impulse projected to the x-direction on the front panel and the bare pendulum response energy are barely changed. The largest changes (1.3%) occur for the total system response energy and foam response energy. The change of the total system response energy results from the comparable change of the foam response energy. Therefore, based on the simulation results, the dishing effect is not noticeably present. The response energy of the bare pendulum frame Ek,M2 in all simulated cases is still less than Er,M2=161.5J. In addition, because the loading in these simulated pendulum systems is a given pressure pulse, fluid-solid and shock wave interactions cannot be considered. Therefore, the simulation carried out in this paper may not fully model the dishing effect.
3.2 Impulse Amplification on the Surface of Free Light Weight/Density Objects
Blast pressure impulse at a point on a surface depends on the distance (or offset e shown in Figures 6 and 11) of the point away from the charge center, the charge weight, and the angle between the normal to the surface and the line connecting the point to the charge. The pressure perpendicular to the surface for which the angle is zero is typically called reflected pressure. The reflected pressure pulse at various fixed distances away from a charge (1.0kg TNT) is illustrated in Figure 12A, except for the case of “initial surface at offset=1.1 (m)”. The integral of the pressure pulse in the time domain is impulse. Both the pressure pulse and impulse are presumed to be fixed as the input of a system subject to the pressure pulse in the previous discussions. However, the pressure pulse and impulse could change for a system under certain circumstance, which can significantly affect system responses.
|
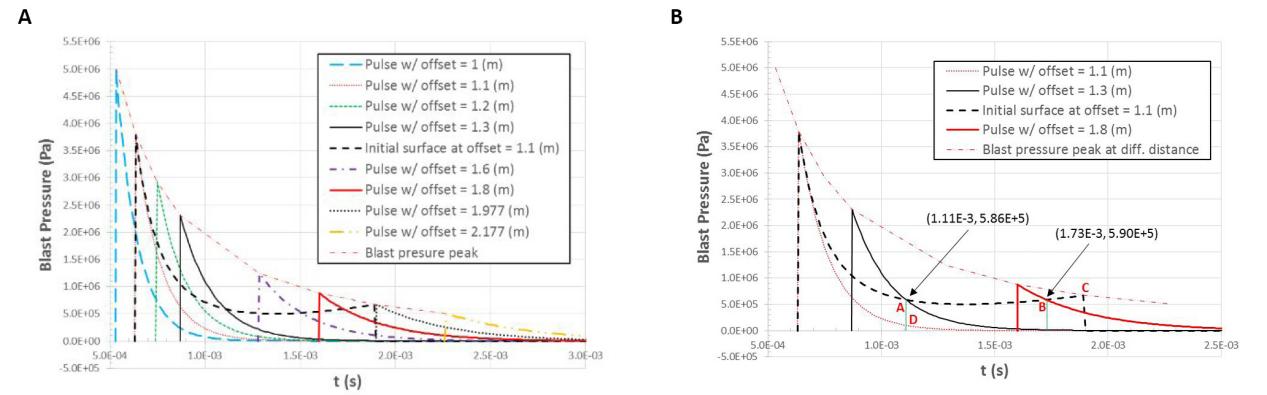
Figure 12. Reflected pressure pulses in time domain. A: On fixed surfaces with different offsets; B: On a moving surface.
The reflected pressure peak, which is associated with the front of blast waves, decreases as the offset distance increases, as described by the envelope curve denoted with “blast pressure peak” in Figure 12A. If there is an object with light enough weight subject to high enough blast loading, the object can quickly accelerate to the velocity of the front of the blast waves and remain that same velocity. Then, the object rides on the blast waves, similar to the waverider[15]. The impulse of the pressure pulse on the moving object with high velocity could be much larger than the impulse on the object at a fixed location, because the envelope curve is larger than that of any local pressure pulses. The object could be a light-weight rigid body or the front surface of an extremely low-density low-resistance material. The exception case of “Initial surface at offset=1.1 (m)” in Figure 12A indicates impulse amplification for the moving object can take place, which will be discussed in detail next.
The rigid body shown in Figure 1A with mass 0.0004kg (density 100kg/m3) is the object in the exception case, which is subject to a 1.0kg TNT charge with offset e=1.1m. The detailed simulation results are plotted in Figures 12B and 13. According to the results, the object is initially located 1.1 (m) away from the charge and the pressure pulse accelerates the object very quickly (see velocity slope at 1.1m in Figure 13); at t=0.00111s, the object moves to the location about 1.3m away from the charge (Figure 13) and obtains the pressure 5.86×10⁵Pa from the local pulse (Point A in Figure 12B), instead of the local pulse of the original location (Point D in Figure 12B); at t=0.00173s, the object moves to the location about 1.8m away from the charge (Figure 13) and obtains the pressure 5.9×10⁵Pa from the local pulse (Point B in Figure 12B), which is even larger than the preceding pressure at t=0.00111s; at the time when the object moves to the location about 1.977m away from the charge at Point C in Figure 12B, the front of the blast waves arrive, which means the object is much faster than the front and will surpass the front after this moment; beyond about 1.977m away from the charge at Point C, the object is no longer subject to the pressure pulse and keeps a constant velocity (no acceleration) as observed in the velocity curve in Figure 13, because the moving object is ahead of the front of the blast waves and is assumed to be in a vacuum without resistance by computer simulation. Hence, the impulse amplification takes place as explained in this paragraph. The impulse projected in the x-direction on the moving object is about 1090Pa∙s, instead of 506Pa∙s for a fixed object. The example indicates that denser and heavier objects subject to blast loading are typically more effective at reducing blast effects, which is supported by the numerical simulation results[14].
|

Figure 13. Blast pressure and velocity on moving surface in displacement domain.
Actually, beyond the location of Point C in Figure 13 (1.977m away from the charge in the example above), the object is not moving freely in a vacuum at a consistent speed, and should encounter resistance, which could change the blast pressure on the object. However, the vacuum assumption is applied to the simulation in order to qualitatively reveal the rational of the impulse amplification.
Although the above example might be an extreme case with respect to the object’s light weight, impulse amplification can indeed take place. Even if the effect of impulse amplification is minor in simulation and experiments, unexpected errors can occur. Referring to the previously simulated values of 487-489N∙s for impulses on the deformable surfaces shown in Table 4 compared to the 480.9N∙s impulse on the rigid surfaces obtained in Section 2.4, these two impulses which should be the same instead differ by about 2%. This difference is most likely attributed to the effect of the impulse amplification, even though it is not significant in these simulations conclusively. However, because the difference observed is usually small enough to fall within the error margin, impulse conservation could be prematurely concluded by ignoring this difference. This could be the case in the experimental results[10] of “Applied Impulse (High Amplitude) and Transmitted Impulse (High Amplitude) in Figure 7” for cellular concrete subject to one-dimensional shock-tube blast pressure. The “Transmitted Impulse (High Amplitude)” in Figure 7[10], which is the impulse on the moving object, became greater than the “Applied Impulse (High Amplitude)” which was measured at a fixed location, as the two impulse values further converged alongside their asymptotic lines.
3.3 Damage Assessment with Response Energy for an FTDOF System
Continuing from Section 2.2 on the topic of damage assessment for an FTDOF system, the energy method[1] is used in this section. For a constrained SDOF system, the total system response energy subject to triangular blast loading has an upper limit, and the system is characterized with maximum energy ratio ERmax ≤ 1, which can be used for damage assessment[1]. However, for the FTDOF system, ERmax ≥ 1 was concluded in the previous section. In addition, due to the “free” nature of the FTDOF system, the absolute displacement of CG can eventually be outside of any constraint limit or allowable displacement. Therefore, the absolute displacement of CG is not a reliable measure for damage assessment.
However, the relative displacement/deformation in a dynamic system can represent the level of structural damage internally. The following analysis will introduce a technique to evaluate relative response energy or relative response deformation for damage assessment[2]. Based on Equations (1)-(3), the following equation for an elastic FTDOF system can be derived
|
Based on dynamic similarity, the dynamic equation of Equation (23) can be reinterpreted as a dynamic response of the displacement of (x1 - x2) for a constrained SDOF system subject to blast loading F with mass M1 and spring stiffness K(M1+M2)/M2. With the energy method used for SDOF systems[1], the maximum values of (x1 - x2) and ER with respect to Equation (23) can be derived for damage assessment of the FTDOF system. According to the results obtained for a perfectly elastic SDOF system, the associated P-I diagram, response spectra of maximum displacement, and ER can be obtained. For example, the maximum energy ratio ERmax is
|
|
|
where ERmax=Emax/Er, p=![]() t0, and Er =0.5I2/M1. In addition, the allowable potential energy for damage assessment should be calculated as [0.5K (M1+M2)/M2 x2 y] when needed.
t0, and Er =0.5I2/M1. In addition, the allowable potential energy for damage assessment should be calculated as [0.5K (M1+M2)/M2 x2 y] when needed.
In short, through the proper equation conversions shown above, an elastic FTDOF system can be converted into an equivalent elastic SDOF system. Likewise, a rigid perfectly-plastic FTDOF system can be converted into an equivalent rigid perfectly-plastic SDOF system. Hence, all procedures applied in the research[1] can be fully implemented with the equivalent SDOF system. The associated P-I diagram, response spectra of maximum displacement, and ER can be derived for damage assessment, after carefully interpreting and properly selecting the impulse, mass, and spring stiffness in the equivalent SDOF system.
4 CONCLUSION
The energy scaling method is effective in deriving the response ER analytically and critical in obtaining the method of damage assessment for FTDOF systems. Maximum response energy ratio ER≥1 for FTDOF systems is significantly different from SDOF systems. Theoretical analysis and simulation further verify the conclusion and reveal that the energy carried by the free rigid body mode alone can be less than the system response kinetic energy. Within certain time intervals and with a proper mass ratio, the kinetic energy (Ek,M2) carried by one of two lumped masses in the elastic FTDOF system could be larger than the kinetic energy (Er,M2) of a rigid body with the same mass subject to the same blast load, which verifies Hanssen’s test results with disintegration allowed. Poor repeatability of Hanssen’s experiments in the response energy of the pendulum (Ek,M2) is due to the uncertainty in timing of system disintegration.
The comprehensive analysis with FEA simulation and published Hanssen’s observation also indicates that the disintegration of the Hanssen pendulum system is the main reason for Hanssen’s unexpected results. The disintegration effect is not only supported by the observations in Hanssen’s experiments, but also reproduced well in FEA simulation. 13% higher kinetic energy is observed in the simulation due to the disintegration. Understanding of the disintegration or separation between components is extremely important for functional systems with cladding layers, which are usually configured with poor mass distribution (higher mass ratio Mr). Improperly confined cladding layers can result in unexpectedly higher response energy.
Effects of dishing and impulse amplification are ignorable on SHPS. FEA analysis reveals that dishing and impulse amplification can result in less than 1.3% and 2% variations in the response energy of the simulated SHPS, respectively. However, the impulse amplification, which directly impact response energy, can be significant for light-weight objects or LDLR materials directly facing blast loading.
Based on the derived analytical solution of system response ER, the method of damage assessment for FTDOF systems is developed. An FTDOF system can be converted into an equivalent SDOF system. The associated P-I diagram, response spectra of maximum displacement, and ER for the FTDOF system can be derived from the equivalent SDOF system for damage assessment.
Highlights
● The ER for free two degree-of-freedom (FTDOF) systems subject to blast loading is analytically derived with the energy scaling method, which reveals insight of the response energy behavior of system components.
● Significantly different from a single degree-of-freedom system, the maximum energy ratio ERmax≥1 for a FTDOF system, and the damage assessment method is developed for the FTDOF system.
● System disintegration can result in unexpectedly higher response energy for the system with cladding layers, for which Hanssen’s unexpected test results can be explained well.
● Impulse amplification and dishing on deformed cladding layers of the Hanssen’s pendulum system have insignificant effects on the response energy of the system.
● Light-weight objects or low-density low-resistance materials directly subject to blast loading can lead to unexpected impulse amplification.
Acknowledgements
The author appreciates the proofreading of the manuscript by Ms. Marina Shi and the computational support provided by the Henan Supercomputing Center.
Conflicts of Interest
The author declared no conflict of interest.
Author Contribution
The author contributed to the manuscript and approved the final version.
Abbreviation List
A, Area
CG, Center of gravity
e, Offset, distance of explosive charge away from a loading surface
E, Mechanical work (system energy) done by the blast load within time interval [0, t], i.e.
![]()
Emax, Maximum mechanical work (system energy) of
Er, Response kinetic energy of a free rigid body subject to blast loading
EM, System response energy E with respect to mass M
EM,CG, System response energy E referring to CG and with respect to mass M
Ek, System response kinetic energy
Ek,M, Response kinetic energy Ek carried by mass M, Ek,M=0.5MV2M
Ek,M,CG, Response kinetic energy Ek referring to CG and carried by mass M
Er,M, Response kinetic energy Er carried by M, Er,M=0.5I2/M
Er,M (t), Response kinetic energy Er carried by mass M, Er,M=0.5I 2(t)/M
Er,M,CG, Response kinetic energy Er referring to CG and carried by mass M
ER, Energy ratio
ER, System energy ratio (total system energy E to Er ratio)
ER0, System energy ratio ER for a constrained SDOF system subject to a triangular load pulse, or ![]()
ERmax, Maximum system energy ratio ER
ERM, System energy ratio ER with respect to mass M, ERM=EM / Er,M
ERM,CG, EM,CG / (total system Er)
F, Force or blast load, F(t)=∫P(t)dA
FTDOF, Free two degree of freedom
I(t), Impulse of blast loading at time t, I(t)=![]() F(t)dt
F(t)dt
I, Impulse of blast loading, I(tm)
K, Spring stiffness
M, Lumped mass
Mr, Mass ratio, =M2/M1
p, ωt0, dimensionless duration of blast loading or dimensionless natural circular frequency
P, Pressure of blast loading
P0, Peak pressure of blast loading
q, ωt, dimensionless time
SDOF, Single degree of freedom
SHPS, Simplified Hanssen pendulum system
t, Time
t0, Duration or characteristic duration of blast loading, t0=2 I / (P0 A)
tm, Actual duration of blast loading; tm=t0 for a triangular blast loading
VM, Velocity of mass M
Vc, Velocity of CG
ω, Natural circular frequency
x, y, Displacement
xc, Displacement of CG
References
[1] Shi Y. Characterization with scaling techniques on response energy of a single degree of freedom system subject to blast loading. Int J Impact Eng, 2021; 148: 103764. DOI: 10.1016/j.ijimpeng.2020.103764
[2] ACI Committee 370. Report for the design of concrete structures for blast effects. American Concrete Institute: Farmington Hills, Michigan, 2014.
[3] Biggs JM. Introduction to structural dynamics. McGraw-Hill: New York, USA, 1964.
[4] Li QM, Meng H. Pressure-impulse diagram for blast loads based on dimensional analysis and single-degree-of-freedom model. J Eng Mech, 2002; 128: 87-92. DOI: 10.1061/(ASCE)0733-9399(2002)128:1(87)
[5] Yuan Y, Zhu L, Bai X et al. Pressure-impulse diagrams for elastoplastic beams subjected to pulse-pressure loading. Int J Solids Struct, 2019; 160: 148-157. DOI: 10.1016/j.ijsolstr.2018.10.021
[6] Liu Z, Wu J, Cao C et al. Dynamic performance and damage assessment of a shallow buried tunnel under internal explosion. Tunn Undergr Sp Tech, 2023; 133: 104918. DOI: 10.1016/j.tust.2022.104918
[7] Cao H, Jiang N, Yao Y et al. Safety assessment of concrete pipeline considering the effect of pipe diameter subjected to blasting vibration. Int J Prot Struct, 2022; 20414196221116650. DOI: 10.1177/20414196221116650
[8] Hanssen AG, Enstock L, Langseth M. Close-range blast loading of aluminium foam panels. Int J Impact Eng, 2002; 27: 593-618. DOI: 10.1016/S0734-743X(01)00155-5
[9] Ma GW, Ye ZQ. Analysis of foam claddings for blast alleviation. Int J Impact Eng, 2007; 34: 60-70. DOI: 10.1016/j.ijimpeng.2005.10.005
[10] Nian W, Subramaniam KVL, Andreopoulos Y. Experimental investigation of blast-pressure attenuation by cellular concrete. ACI Mater J, 2015; 112: 21-28. DOI: 10.14359/51687242
[11] Li QM, Meng H. Attenuation or enhancement-a one-dimensional analysis on shock transmission in the solid phase of a cellular material. Int J Impact Eng, 2002; 27: 1049-1065. DOI: 10.1016/S0734-743X(02)00016-7
[12] LSTC, LS-DYNA Theory Manual. Livermore Software Technology Corporation, 2017.
[13] Hanssen AG, Hopperstad OS, Langseth M et al. Validation of constitutive models applicable to aluminium foams. Int J Mech Sci, 2002; 44: 359-406. DOI: 10.1016/S0020-7403(01)00091-1
[14] Shi Y. Factors influencing blast attenuation on walls with foamed concrete boards: ASME 2016 International Mechanical Engineering Congress and Exposition. Phoenix, Arizona, USA: November 11-17, 2016. DOI: 10.1115/IMECE2016-65863
[15] Rasmussen ML. Waverider configurations derived from inclined circular and elliptic cones. J Spacecraft Rockets, 1980; 17: 537-545. DOI: 10.2514/3.57771
Copyright © 2023 The Author(s). This open-access article is licensed under a Creative Commons Attribution 4.0 International License (https://creativecommons.org/licenses/by/4.0), which permits unrestricted use, sharing, adaptation, distribution, and reproduction in any medium, provided the original work is properly cited.


