A Comparative Study of the Reduction of Iron Ore Pellets Using Different Reductants: A Statistical Approach
Swapan Suman1#, Dilip Kumar Rajak2#*
1Deptartment of Mechanical Engineering Meerut Institute of Engineering and Technology, Meerut, India
2Department of Chemistry, University of the Free State, Bloemfontein, South Africa
# Both authors contributed equally to this manuscript.
*Correspondence to: Dilip Kumar Rajak, PhD, Researcher, Department of Chemistry, University of the Free State, 205 Nelson Mandela Dr, Park West, Bloemfontein 9301, South Africa; Email: Rajak.DK@ufs.ac.za
Abstract
Objective: The purpose of this paper is to explore the value of wooden dust char (WDC) as a reductant of iron ore.
Methods: The reduction of iron orepellet was performed using WDC, non-coking coal and low volatile weakly coking coal as a reductant at temperatures of 900, 950, 1000 and 1000°C and degrees of reduction of pellets were calculated by using the following formula:
|
Results: In WDC, the maximum reduction of iron ore particles, i.e. 89.86%, was obtained within 60min at 1050°C, while 82.16% and 46.52% were obtained for non-coking coal and low volatile coking coal, respectively, under same conditions.
Conclusion: Instead of referring to them as wastes, we should rather consider them biomass by products, which allows for a more efficient use of various types of biomass waste. Importantly, the iron and steel industries excel at reasonable utilization that shift the waste material into things of value.
Keywords: low volatile coking coal, wooden dust, char, reduction, iron ore pellets
1 INTRODUCTION
The iron and steel industries (ISI) are playing a significant role in the present global growth and economy. Hematite (as a source of iron), coke and coal (as a reducing agent and energy source) are the major materials in iron processing industry[1]. The utilization of coke and coal contribute to 7% of anthropogenic CO2 emission on a global scale[2]. The amount of coking coal is 33.47 billion tonnes, while the amount of residual coals, which includes low-grade coals such as poor coking and non-coking coals, is 252.40 billion tonnes[3]. Low volatile poor coking coals make up a significant portion of the overall quantity of low-grade coals[4]. Due to the ongoing depletion of coking coal reserves and the need for green iron and steel production, the abundantly available low-quality coals are being used in place of coking coal. These coals pose a lower risk to the environment in terms of both climate change and the presence of environmental contaminants[2,5-7]. The use of biomass and its wastes is a feasible option in the context of alternative renewable sources of energy and reductant in ISI[8-10]. Biomass refers to any organic substance that is not derived from fossils and occurs in nature. It has a lower overall amount of nitrogen, sulphur, and nitrogen oxides, as well as a lower potential for contributing to acid rain or emissions of greenhouse gases[8,11,12]. The energy crops, urban, forestry, and agricultural waste that make up the biomass resources include things like crop wastes, forest residues, purpose-grown grasses, woody energy crops, algae, industrial wastes, sorted municipal solid trash, urban wood waste, and food waste[13]. The heating value of biomass crop leftovers is around 3×10⁶kcal Mg-1, which is approximately the same as that of biofuels and coals but only 33% of diesel fuel. It is calculated that biomass crop leftovers have a fuel value of 18.6×10⁹J Mg-1, which is comparable to 2 barrels of diesel[10, 14]. Biomass energy is expected to become a viable alternative for meeting fifty percent of the world's energy needs in the next century[15]. Bio-char is a solid by-product, rich in carbon, produced during the thermal stabilization of biomass[16]. It is equivalent to coal in terms of feedstocks for fuel[17,18], and it produces no CO2[9].
There have been a number of researches done on the pyrolysis of various types of biomass waste[19-21], but these wastes were unable to secure their entry into the process of manufacturing iron because of their non-coking qualities and lower heating value than coal. However, biomass wastes are sufficient for the conversion of energy, and they may be improved by first being carbonised to produce char[22,23]. In light of the information presented above, the goal of the current research was to investigate the feasibility of metallurgical applications for non-coking coal, low volatile coking coal, and wood dust char (WDC).
The statistical design of the experiment is a multivariate methodology that has been extensively employed across a wide range of disciplines to extract useful information for the purpose of the creation of goods, processes, and procedures. It analyses the impact of a variety of experimental conditions and concurrently finds the interactions among them, which is something that cannot be accomplished by the conventional method of focusing on one component at a time[24]. In a factorial design, a set of predefined experiments are determined to combine levels of the experimental (independent) variables and connect to the properties of interest (dependent variables) by models generated using multiple linear regressions. This is done in order to test the hypothesis that the levels of the experimental (independent) variables have some effect on the properties of interest. A single factorial design with two levels each for three variables (reduction duration, reduction temperature, and the percentage of bio char that is fixed carbon (FC)) was employed for the proposed research. Because of the model, we were able to generate response surface graphs that demonstrate the operability of the system over the whole experimental domain[25-27].
2 MATERIALS AND METHODS
2.1 Sample Collection and Preparation
Coal samples belonging to the non-coking coal and low volatile coking coal were obtained, respectively, from the Gajlitand and Rajapurareas of Dhanbad in the state of Jharkhand in India. wooden dust (WD) of Gamhar tree (Gmelinaarborea) was collected from a local timber factory in Dhanbad, Jharkhand, India. This material was then prepared to a size of 0.85/0.425mm in order to carry out conventional pyrolysis at a temperature of 700°C for 1h with a heating rate of 10-12°C per min. WDC is the name given to the finished product[28]. For reduction experiments, hematite iron ore was gathered from the Bailadila mines in Chhattisgarh, India. Prior to being analysed, the ore was heated at 900°C for 1h in order to remove both free and mixed moisture. The primary components of iron ore pellets are mullite (Al2O3), silica (SiO2), and iron oxides (FeO and Fe2O3)[29]. Pellets are formed from hematite, which contains iron oxides.
2.2 Characterization Methodology
2.2.1 Proximate, Ultimate Analysis and Gross Calorific Value (GCV)
For proximate analysis[30], the ASTM (D1762-84) standard technique for WD and WDC and the ASTM (D7582-15) standard method for non-coking coal and low volatile coking coal were used to evaluate ash content, moisture content, volatile matter content, and FC content[30,31].
The CHNS (Carbon, Hydrogen, Nitrogen, and Sulphur) analyzer was used for the final analysis in order to determine the C, H, N, and So of the non-coking coal, low volatile coking coal, WD, and WDC samples. The standard methods ASTM E777, E778 and E775 were utilised for this determination. The difference[31] was used to calculate the amount of oxygen present.
The bomb calorimeter was used in order to ascertain the calorie content of each of the samples[32]. The standard test procedure (ASTM D4809-00) called for the employment of a bomb calorimeter in the investigation.
2.2.2 Plastic and Caking Properties
Coal is malleable because heat changes the way the surface behaves, and it becomes as flexible as a liquid. When heated without air at 350-400°C, coal becomes plastic. This means that it swells, flows, expands, sticks together, and shrinks in size. The solid waste, called coke, is mostly made up of carbon and minerals. Different indices and tests, such as the free swelling index (FSI), the caking index (CI), and the low temperature Gray King assay test (LTGK), are used to measure how flexible coal is[33]. FSI calculates the change in volume of coal when it is heated under certain conditions. When the coal is still soft or semi-liquid, the gases generated during heating and decomposition are responsible for the expansion[34]. CI, also called "index of agglutination", is a measure of how well coal sticks together when heated[35]. LTGK[36] tells how much coke is made from coal at low temperatures.
2.2.3 Field Emission Scanning Electron Microscope (FE-SEM) Image and Energy Dispersive X-Ray (EDX) Analysis
For FE-SEM and EDX analysis, non-coking coal, low volatile coking coal, WDC, and iron-ore were used. samples were first coated with 2-6nm of silver/gold using a sputter coater. This was done to keep the samples from getting charged during the SEM analysis. Using a secondary electron detector, images were taken with a variable pressure FE-SEM in high vacuum mode with an accelerating voltage of 2-15kV (the accelerating voltage was changed based on how the sample charged). Images were taken at different levels of zoom, from 50X to 15000X[37]. As a semi-quantitative method, EDX is shown as a mass percentage of the sample[38]. They were found by analysing the sample at three different points, and the average value of those three points is taken into account.
2.3 Pellet Preparation
The pellet of iron ore was made in a disc pelletizer with the addition of 10% moisture and 0.6% bentonite as an external binder. The moisture content was maintained at 10% throughout the process. The size of the particle was maintained within a fairly narrow range the whole time (approximately 10-12mm). These pellets were dried in an oven at a temperature of 110°C for four to five hours. In a high temperature furnace, pellets that had been dried were heated to a temperature of 1250°C for 1h. Desiccators were used to keep the finally dried pellets before reduction tests were performed.
3 RESULTS AND DISCUSSION
3.1 Proximate and Ultimate Analyses, GCV, and Plastic Properties of the Samples
The values of proximate and ultimate analyses, calorific value, and plastic properties of thesamples non-coking coal, low volatile coking coal, WD and WDC are shown in Table 1.
Table 1. Proximate, Ultimate, Gross Calorific Value and Plastic Properties of the Samples
Characterization |
Samples |
|||
Proximate analysis |
||||
|
Non-Coking Coal |
Low Volatile Coking Coal |
WD |
WDC |
Moisture (M) |
6.39 |
1.25 |
6.10 |
2.90 |
Ash (A) |
37.24 |
23.28 |
4.02 |
10.08 |
Volatile Mater (VM) |
23.24 |
20.10 |
71.63 |
15.96 |
Fixed Carbon (FC) |
33.34 |
55.47 |
18.27 |
71.14 |
Ultimate analysis |
||||
N% |
0.60 |
3.27 |
0.50 |
0.57 |
C% |
33.83 |
66.72 |
68.92 |
78.40 |
H% |
3.95 |
2.85 |
7.38 |
1.36 |
O% |
60.27 |
26.50 |
21.79 |
19.45 |
S% |
1.35 |
0.70 |
0.05 |
0.22 |
Plastic properties |
||||
GCV (Kcal/Kg) |
4224 |
6612 |
4335 |
7456 |
Free Swelling Index |
- |
1.5 |
1 |
- |
Caking index LTGK |
7 B |
11 E |
8 C |
- A |
From proximate analysis, it can be seen that the values of components of the proximate analysis for non-coking coal (M, 6.39; A, 37.24; VM, 23.24; and FC, 33.34%) and low volatile coking coal (M, 1.25; A, 23.28; VM, 20.10; and FC, 55.47%) are within the prescribed limit range of non-coking coal (M, 4-10; A, 23-32; VM, 20-37; and FC, 24-35%) and low volatile coking coal (M, 0.37; A, 35.13; VM, 17.56; and FC, 46.94%), under Indian conditions, so they can be designated as non-coking coal[39] and low volatile coking coal[40], respectively. The VM range being (22-25%) for prime coking, (26-29%) for medium coking, and (34-44%) for semi-coking coals of India[38].The ultimate analysis indicates, the total carbon content is higher in case of WDC i.e. 78.40% followed by WD (68.92%), low volatile coking coal (67.70%), and Non-Coking Coal (34.70%)and hence the variation in the level of their GCV.
Further the FSI (1½) and CI (11), and LTGK (E) of low volatile coking coal also evince that it is low volatile poor coking coal and not suitable for extractive metallurgical[6]. Hence, an attempt can be made to find out the potential of these low-grade coals for iron ore reduction or for metallurgical purposes using appropriate technologies (like coke making after pre-treatments)[6,7,41-48]. Here the characteristics of both coals such as moisture, ash, VM, S, FSI, etc. are quite at par with the values prescribed for DRI coal[44]. The proximate and ultimate analysis WD, WDC, and GCV are comparable with the coals[11,15,17,18] and rather with relatively less content of N, S, and N[12].
3.2 FE-SEM Image and EDX Analysis
FE-SEM images were taken at several magnifications ranging from 50X to 15000X (Figure 1). Visual inspection of these images illustrates the differences in micro-structure among the char and coal samples, with observable distinct micro-pores[20]. This may be due to the different rates of evolution of the volatiles present in the samples, leading to the thermal expansion and contraction of the sample particles and the formation of voids. As can be seen in Figure 1, the evolution in every studied sample is quite similar.
|
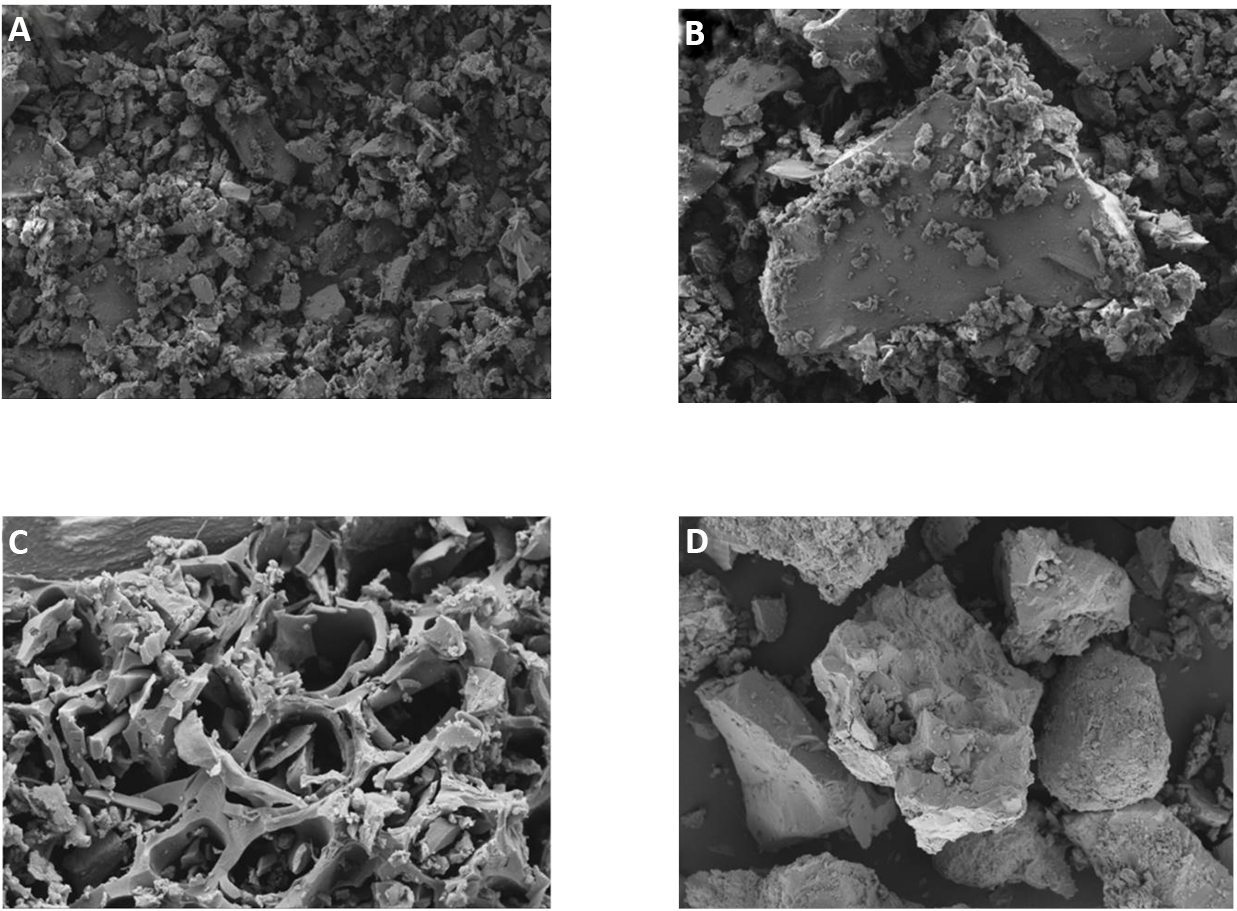
Figure 1. FE-SEM image analysis of all reductants and iron-ore (A) non-coking coal, (B) low volatile coking coal, (C) WDC and (D) iron-ore sample.
EDX analysis results are shown in Figure 2, where results are presented in mass percentage of the elements. In non-coking coal, low volatile coking coal, WDC and iron-ore, 37.38, 68.04, 80.66 and 4.06 weight percent carbon is present. The amount of oxygen in WDC and low volatile coking coal is less than non-coking coal and iron-ore. Few traces of silicon is also found in non-coking coal, low volatile coking coal and iron-ore. Some amounts of potassium, magnesiumand calcium can also be seen in WDC. These elements are basically the major secondary nutrients for the plant life[49,50].
|
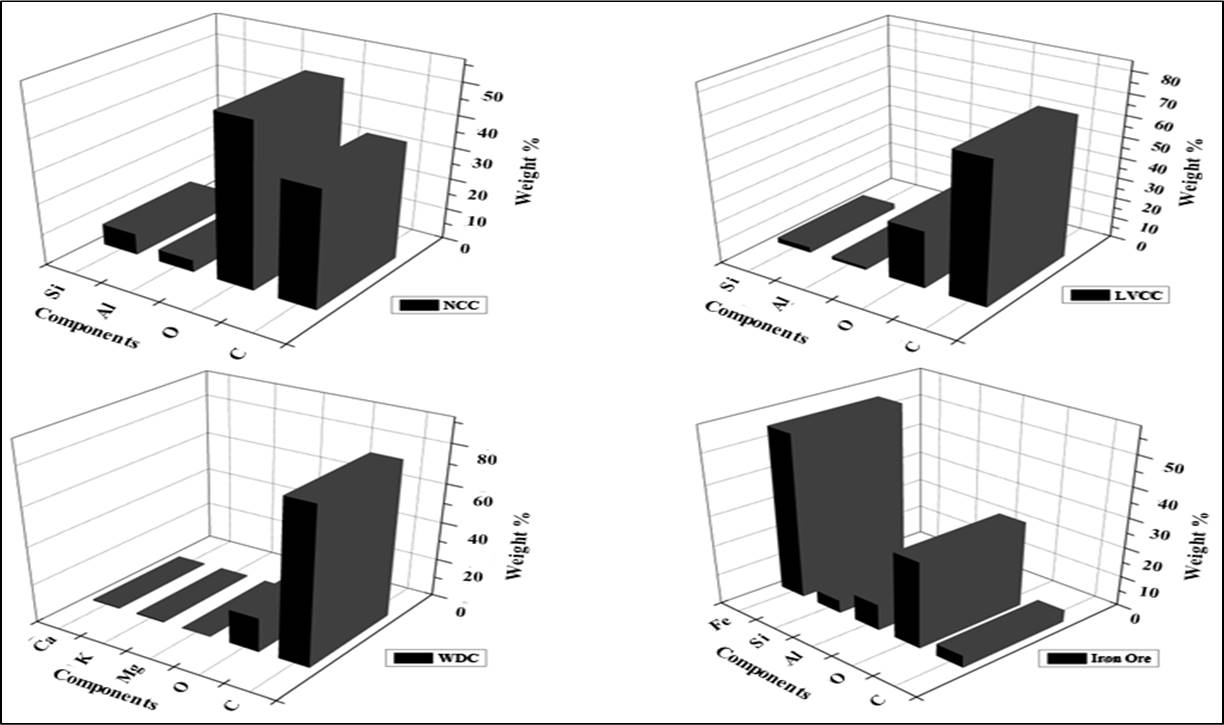
Figure 2. EDX analysis of all reductants and iron-ore, non-coking coal, low volatile coking coal, WDC and iron-ore sample.
3.3 Reduction Study
The effects of the reduction time, temperature, and ash content of the reductants on the extent of reduction of iron-ore pellets is being studies. Thereafter the reduction potential of non-coking coal, low volatile coking coal and WDC is measured and compared when used as a reductant for iron ore pellets. WDC contains very low levels of gangue, sulphur and volatile matter and can be used as an alternative reductant of iron ore (Table 1). The experiments were carried out at reduction temperatures of 900, 950, 1000 and 1050°C at a heating rate of 10-20°C/min for a varying reduction period of 15, 30, 45, 60, and 75min. Figure 3 illustrates the different curve characteristics for each of the reductants. Following is the formula that was used in the calculation of the pellets' degrees of reduction Equation (1).
|
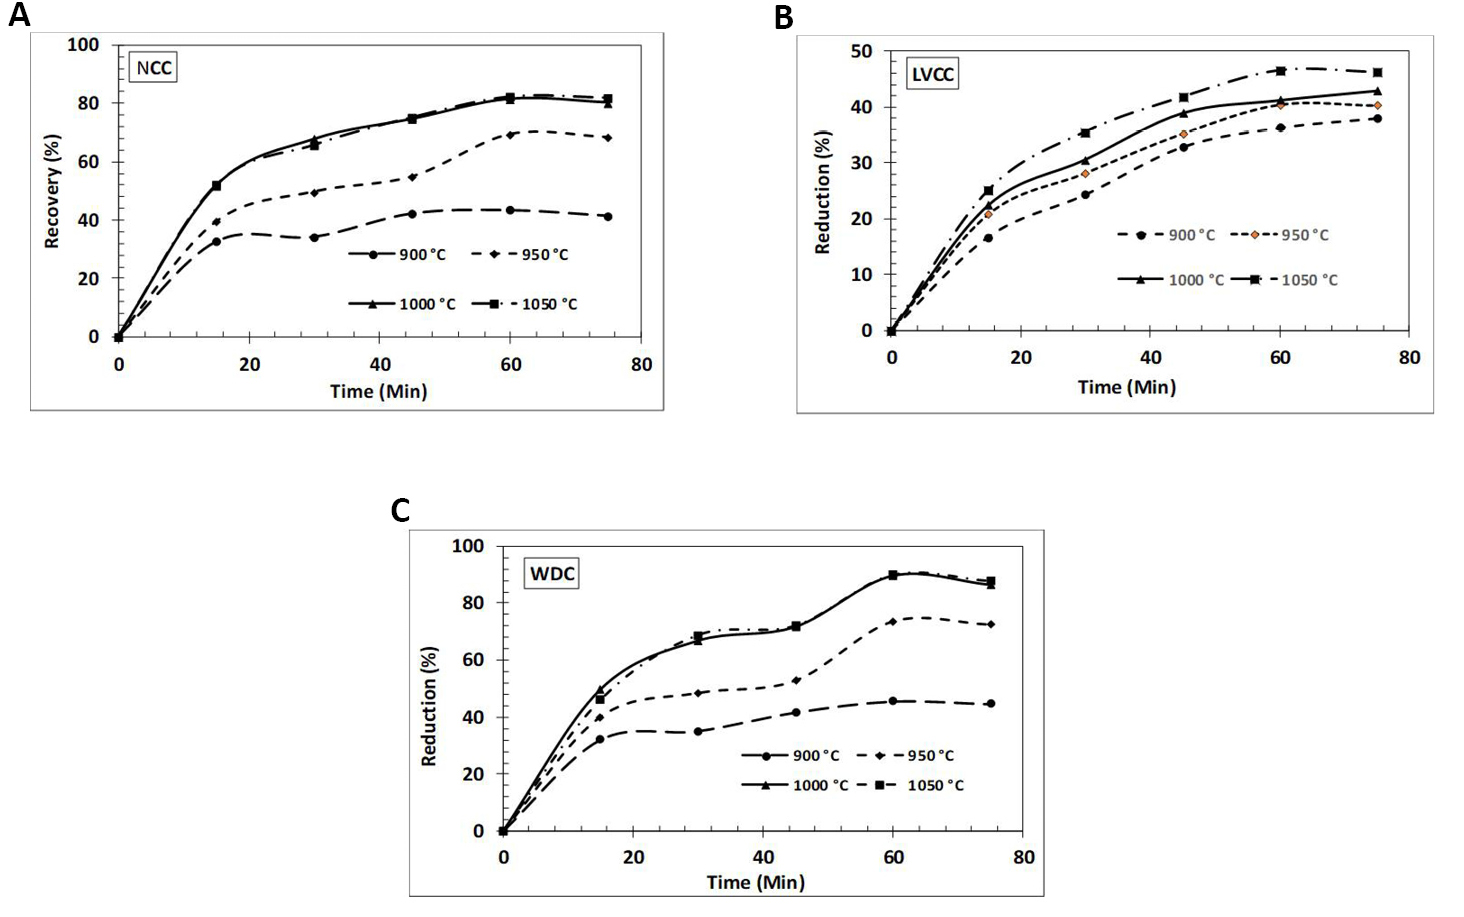
Figure 3. Effect of time and temperature on reduction percentage of iron ore pellets usingreductants non-coking coal, low volatile coking coal and WDC.
|
It can be seen from Figure 3 that the shape of the curves is essentially same across all four temperatures of reduction for each of the reductants, and that the degree of reduction rises both with time and temperature as the experiment progresses. WDC realized the maximum reduction of 89.86% at 1050°C for 60min, but the reductions for non-coking coal and low-volatile coking coal were 82.16% and 46.52%, respectively, under the same conditions.
The rate of reduction was highest at the beginning, lasting 60min, and then began to gradually slow down. This is due to a combination of factors, including the higher thickness of the metal layer of the product and the reduction of volatiles from the coal[51]. The rate of reduction is slower at lower temperatures due to the high endothermic nature of the coal gasification reaction, which requires a greater quantity of energy[51]. An increase in the thickness of the product iron layer provides a greater resistance to the diffusion of carbon and reducing gas to the surface of unreduced iron oxide, establishing a more favourable environment for the formation of product iron layers.
3.4 Statistical Approach
In this study a single factorial design (Table 2) of the experiments has been used with two levels of three variables viz. reduction time, reduction temperature, and ash percentage of non-coking coal, low volatile coking coal, and WDC[24-27].
Table 2. Using Levels- Upper, Base and lower the Coded and Actual Values of the Variables
Levels |
Temperature (x1)oC |
X1 Coded |
Time (Min) (x2) |
X2 Coded |
Ash(wt%) (x3) |
X3 Coded |
Upper |
1050oC |
+1 |
60 |
+1 |
38 |
+1 |
Base |
1000oC |
0 |
45 |
0 |
24 |
0 |
Lower |
950oC |
-1 |
30 |
-1 |
10 |
-1 |
Notes: X1=(x1-1000)/50 (2) X2=(x2-45)/15 (3) X1=(x3-24)/14 (4). Where, X= represents the coded value of the variables (time -X1, temperature -X2 and ash -X3), and x= represents the actual value of the variables (time -x1, temperature -x2 and ash -x3).
Eight experiments were performed with all possible combinations at 1050°C and 950°C reduction temperature, while three experiments were performed at 1000°C and a design matrix (Table 3) is formulated to obtain the regression equation for the degree of reduction (Y)[24-27].
|
|
|
Similarly, a2=10.28, a3=-1.71, a12=-0.89, a23=-1.23, a13=-0.99, a123=0.09.
Table 3. Design Matrix
Exp. No. |
X1 |
X2 |
X3 |
X1X2 |
X2X3 |
X1X3 |
X1X2X3 |
%R(Y) |
1 |
1 |
1 |
1 |
1 |
1 |
1 |
1 |
82.16 |
2 |
1 |
1 |
-1 |
1 |
-1 |
-1 |
-1 |
89.86 |
3 |
1 |
-1 |
1 |
-1 |
-1 |
1 |
-1 |
65.66 |
4 |
-1 |
1 |
1 |
-1 |
1 |
-1 |
-1 |
69.40 |
5 |
-1 |
-1 |
-1 |
1 |
1 |
1 |
-1 |
48.50 |
6 |
-1 |
-1 |
1 |
1 |
-1 |
-1 |
1 |
49.70 |
7 |
-1 |
1 |
-1 |
-1 |
-1 |
1 |
1 |
73.50 |
8 |
1 |
-1 |
-1 |
-1 |
1 |
-1 |
1 |
68.78 |
9 |
0 |
0 |
0 |
0 |
0 |
0 |
0 |
38.90 |
10 |
0 |
0 |
0 |
0 |
0 |
0 |
0 |
40.20 |
11 |
0 |
0 |
0 |
0 |
0 |
0 |
0 |
40.55 |
3.4.1 Regression Equation
|
In order to determine whether or not each of the coefficients is significant, Students T-test and
Fisher test are run with a confidence level of 95%.
3.4.2 Student’s T-test[26]
|
|
|
|
|
When the degree of confidence is set to 95%, the alpha level is set to 0.05, and the value of v is set to 2; where n is the number of grouped experiments, t=4.3. As a result, the only meaningful t coefficients are those that are more than 4.3; the rest are deemed inconsequential.
Therefore, the answer to the regression Equation (1) is now:
|
So, number of significant coefficients (I) = 4
3.4.3 Fisher Test[26]
|
Where, Yiexp= Experimental degree of reduction; Yicalc= Calculated degree of reduction; N=8; I=4;Sres2=3.56.
|
The tabulated value of Fisher’s F for α=0.05, ν1=4 and ν2=2
|
Thus, F<F1- α(ν1, ν2) and the estimated regression equation above fits the experimental dataadequately.
As seen from the Table 3 above, the difference between experimental and calculated value of percentage degree of reduction is negligible, so it can be said that the regression equation is adequate. From the equation, it can be seen that the coefficients a1, a2 have positive value, which shows that with increase in temperature and time, degree of reduction increases, and coefficient a3 is having negative value, which shows that with increase in ash percentage degree of reduction decreases. The interactional effect of time and ash has least effect on degree of reduction.
4 CONCLUSIONS
Following are some of the findings that may be inferred from the current work:
(1) The regression equation that was developed for calculating the degree of reduction of iron ore will help in predicting the degree of reduction of low rank coals and agricultural wastes under specified conditions of time and temperature. This equation is Y=68.44+8.17X1+10.28X2–1.71X3–1.23X2X3, and it will be helpful in calculating the degree of reduction of iron ore;
(2) Of all of these different components, time has the most significant impact, followed by temperature and then ash in the following order: time > temperature >1/Ash;
(3) The effect of temperature is four times that of ash, and the effect of time is five times that of ash;
(4) In addition to non-coking coal, biomass wastes with a greater calorific value than non-coking coal may be utilised for iron ore reduction procedures. Some examples of this biomass waste include timber dust char, and low volatile coking coal can also be used for the same purpose; and
(5) The correct utilisation of other types of biomass wastes can also be accomplished in this manner; however, rather than referring to these types of materials as wastes, we can refer to them as biomass byproducts. Last but not least, the ISI are able to make use of these wastes.
Acknowledgements
Not applicable.
Conflicts of Interest
The authors declared no conflict of interest.
Author Contribution
Rajak DK and Suman S wrote, reviewed and corrected this article.
Abbreviation List
CI, Caking index
EDX, Energy dispersive X-ray
FC, Fixed carbon
FE-SEM, Field emission scanning electron microscope
FSI, Free swelling index
GCV, Gross calorific value
ISI, The iron and steel industries
LTGK, Low temperature Gray King assay test
M, Moisture
VM, Volatile matter
WD, Wooden dust
WDC, Wood dust char
References
[1] Holmes RJ, Lu Y, Lu L. Introduction: Overview of the global iron ore industry. Iron Ore, 2022; 1-56. DOI: 10.1016/B978-0-12-820226-5.00023-9
[2] Nwachukwu CM, Wang C, Wetterlund E. Exploring the role of forest biomass in abating fossil CO2 emissions in the iron and steel industry-The case of Sweden. Appl Energ, 2021; 288: 116558. DOI: 10.1016/j.apenergy.2021.116558
[3] Sengupta S. Raw material for steel industry. Steel World, 2015; 42-52.
[4] Prasad HN, Singh BK, Dhillon AS. Potential of semi-soft coals as replacement for hard coals in stamp charging blend. Ironmak Steelmak, 2001; 28: 312-320. DOI: 10.1179/030192301678172
[5] Gautam S. Studies on low/medium volatile coking coals for their suitability in iron and steel industries [PhD thesis]. Dhanbad, India: Indian School of Mines Dhanbad; 2010.
[6] Gautam S. Assessment of low volatile poor caking indian coal for coke making. Int J Coal Prep Util, 2017; 37: 33-43. DOI: 10.1080/19392699.2015.1123697
[7] Gautam S. Effect of washing and stamping on coke making of a low grade Indian coal: correlation between various properties. Ironmak Steelmak, 2017; 44: 505-512. DOI: 10.1080/03019233.2016.1217115
[8] Brassard P, Palacios JH, Godbout S et al. Comparison of the gaseous and particulate matter emissions from the combustion of agricultural and forest biomasses. Bioresource Technol, 2014; 155: 300-306. DOI: 10.1016/j.biortech.2013.12.027
[9] Tinwala F, Mohanty P, Parmar S et al. Intermediate pyrolysis of agro-industrial biomasses in bench-scale pyrolyser: Product yields and its characterization. Bioresource Technol, 2015; 188: 258-264. DOI: 10.1016/j.biortech.2015.02.006
[10] Antar M, Lyu D, Nazari M et al. Biomass for a sustainable bioeconomy: An overview of world biomass production and utilization. Renew Sust Energ Rev, 2021; 139: 110691. DOI: 10.1016/j.rser.2020.110691
[11] McKendry P. Energy production from biomass (part1): Overview of biomass. Bioresource Technol, 2002; 83: 37-46. DOI: 10.1016/S0960-8524(01)00118-3
[12] Gonzalez JF, Gonzalez-Garcıaa CM, Ramiro A et al. Combustion optimization of biomass residue pellets for domestic heating with a mural boiler. Biomass Bioenerg, 2004; 27: 145-154. DOI: 10.1016/j.biombioe.2004.01.004
[13] Brosowski A, Krause T, Mantau U et al. How to measure the impact of biogenic residues, wastes and by-products: Development of a national resource monitoring based on the example of Germany. Biomass Bioenerg, 2019; 127: 105275. DOI: 10.1016/j.biombioe.2019.105275
[14] Mao G, Huang N, Chen L et al. Research on biomass energy and environment from the past to the future: A bibliometric analysis. Sci Total Environ, 2018; 635: 1081-1090. DOI: 10.1016/j.scitotenv.2018.04.173
[15] Energy for cooking in developing countries. Accessed May 1, 2016. Available at https://www.iea.org/publications/free publications/publication/cooking.pdf
[16] Masek O, Budarin V, Gronnow M et al. Microwave and slow pyrolysis biochar-Comparison of physical and functional properties. J Anal Appl Pyrolysis, 2013; 100: 41-48. DOI: 10.1016/j.jaap.2012.11.015
[17] Fu P, Hu S, Xiang J et al. Evaluation of the porous structure development of chars from pyrolysis of rice straw: Effects of pyrolysis temperature and heating rate. J Anal Appl Pyrolysis, 2012; 98: 177-183. DOI: 10.1016/j.jaap.2012.08.005
[18] Mohanty P, Pant KK, Naik S Net al. Synthesis of green fuels from biogenic waste through thermochemical route-the role of heterogeneous catalyst: A review. Renew Sustain Energ Rev, 2014; 38: 131-153. DOI: 10.1016/j.rser.2014.05.011
[19] Mohanty P, Nanda S, Pant KK et al. Evaluation of the physiochemical development of biochars obtained from pyrolysis of wheat straw, timothy grass and pinewood: Effects of heating rate. J Anal App Pyrolysis, 2013; 104: 485-493. DOI: 10.1016/j.jaap.2013.05.022
[20] Yargicoglu EN, Sadasivam BY, Reddy BY et al. Physical and chemical characterization of waste wood derived biochars. Waste Manage, 2014; 36: 256-268. DOI: 10.1016/j.wasman.2014.10.029
[21] Lee Y, Park J, Ryu C et al. Comparison of biochar properties from biomass residues produced by slow pyrolysis at 500°C. Bioresource Technol, 2013; 148: 196-201. DOI: 10.1016/j.biortech.2013.08.135
[22] Saidur R, Abdelaziz EA, Demirbas A et al. A review on biomass as a fuel for boilers. Renew Sust Energ Rev, 2011; 15: 2262-2289. DOI: 10.1016/j.rser.2011.02.015
[23] Vladimir S. Iron ore reduction using sawdust: Experimental analysis and kinetic modelling. Renew Energ, 2006; 31: 1892-1905. DOI: 10.1016/j.renene.2005.08.032
[24] Box GEP, Hunter JS, Hunter WG. Statistics for experimenters, 2nd ed. John Wiley & Sons, Inc.: New Jersey, USA, 2005.
[25] Sharma T. Physico-chemical processing of low grade Mn ore. Int J Miner Process, 1992; 35: 191-203. DOI: 10.1016/0301-7516(92)90033-S
[26] Sharma T, Gupta RC, Prakash B. Swelling of iron ore pellets by statistical design of experiment. ISIJ Int, 1992; 32: 1268-1275. DOI: 10.2355/isijinternational.32.1268
[27] Mookherjee S, Ray HS, Mukherjee A. Isothermal reduction of iron ore fines surrounded by coaland char fines. Ironmak Steelmak, 1986; 13: 229-239.
[28] Shaaban A, Se SM, Dimin MF et al. Influence of heating temperature and holding time on biochars derived from rubber wood sawdust via slow pyrolysis. J Anal Appl Pyrolysis, 2014; 107: 31-39. DOI:10.1016/j.jaap.2014.01.021
[29] Muwanguzi AJ, Karasev AV, Byaruhanga JK et al. Characterization of chemical composition and microstructure of natural iron ore from Muko deposits. Int Scholarly Res Not, 2012. DOI: 10.5402/2012/174803
[30] Francis W, Peters MC. Fuels and fuel technology, 2nd ed. Pergamon Press: New York, USA, 1965. DOI: 10.1016/B978-0-08-025250-6.50008-0
[31] Demirbas A. Effects of temperature and particle size on bio-char yield from pyrolysis of agricultural residues. J Anal Appl Pyrolysis, 2004; 72: 243-248. DOI: 10.1016/j.jaap.2004.07.003
[32] Gupta OP. Fuels, furnaces and refractory, 1st ed. Khanna Publication: Delhi, India, 1990.
[33] Gautam S, Yadav RS, Suresh N. Evaluation of the characteristics of as-received and washed low grade Indian coals for their industrial applications. Energ Source Part A, 2015; 37: 2138-2149. DOI: 10.1080/15567036.2010.531512
[34] Chelgani SC, Hower JC, Hart B. Estimation of free-swelling index based on coal analysis using multivariable regression and artificial neural network. Fuel Process Technol, 2011; 92: 349-355. DOI: 10.1016/j.fuproc.2010.09.027
[35] Xiang L, Qin ZH, Bu LH et al. Structural analysis of functional group and mechanism investigation of caking property of coking coal. J Fuel Chem Technol, 2016; 44: 385-393. DOI:10.1016/S1872-5813(16)30019-6
[36] Mohanty A, Chakladar S, Mallick S et al. Structural characterization of coking component of an Indian coking coal. Fuel, 2019; 249: 411-417. DOI: 10.1016/j.fuel.2019.03.108
[37] Welton JE. SEM petrology atlas: Methods in exploration series No. 4. Association of petroleum geologists: Oklahoma, USA, 1984. DOI: 10.1306/Mth4442
[38] Bell DC, Garratt-Reed AJ. Energy dispersive X-ray analysis in the electron microscope. Garland Science: London, UK, 2003. DOI: 10.4324/9780203483428
[39] Das S, Sharma S, Choudhury R. Non-coking coal to coke: Use of biomass based blending material. Energ, 2002; 27: 405-414. DOI: 10.1016/S0360-5442(01)00091-3
[40] Kumar V, Saxena VK. Studies of the variation in coal properties of low volatile coking coal after beneficiation. Int J Comput Eng Res, 2014; 4: 39-57.
[41] Prasad AN, Rao PVT, Poddar NN et al. Selection of coals for cokemaking by classical top charging and stamp charging. London, UK, 28-30 September, 1992.
[42] Chatterjee A, Prasad HN. Response of high ash Indian coals to pre-carbonization techniques. Fuel, 1994; 88: 1417-1427. DOI: 10.1016/0016-2361(88)90135-4
[43] Tata Iron and Steel Company. Evaluation of coking characteristics of coalblends used at Durgapur steel plant by stamp charging and conventional top charging. Accessed May 1, 2016. Available at https://www.ipl.org/essay/Tata-Iron-And-Steel-Company-Case-Study-PJ4ATEJ3XG
[44] Basu TK, Mitra PK, Chowdhury SG et al. CFRI (Central Fuel Research Institute) Golden Jubilee Monograph: Coal Carbonization; 1996. Accessed May 1, 2016. Available at https://cimfrintranet.org/digwadih/60yrs.pdf
[45] Krishnan HS, Dash PS, Guha M et al. Applicationof Binder in stamp charge coke making. ISIJ Int, 2004; 44: 1150-1156. DOI: 10.2355/isijinternational.44.1150
[46] Dash PS, Krishnan SH, Sharma R et al. Laboratory scale investigation to improve the productivity of stamp charge coke oven through optimization of bulk density of coal cake. ISIJ Int, 2005; 45: 1577-1586. DOI: 10.2355/isijinternational.45.1577
[47] Tiwary HP, Banerjee PK, Saxena VK et al. Effect of Indiancoking coal on coal quality in Non-recovery Stamp charged coke oven. J Iron Steel Res Int, 2014; 21: 673-678. DOI: 10.1016/S1006-706X(14)60104-7
[48] Kuyumcu HZ, Sander S. Stamped and pressed coal cakes for carbonisation in by-product and heat-recovery coke ovens. Fuel, 2014; 121: 48-56. DOI: 10.1016/j.fuel.2013.12.028
[49] Mathur RB. Coking coal scenario in India. 6th Asian Steel Conference, 29-30 September, 2006, Mumbai, India.
[50] Ram LC, Srivastava NK, Jha SK et al. Management of lignite fly ash for improving soil fertility and crop productivity. Environ Manage, 2007; 40: 438-452. DOI: 10.1007/s00267-006-0126-9
[51] Camci L, Aydin S, Arslan C. Reduction of iron oxides in solid wastes generated by steelworks. Eng Env Sci, 2002; 26: 37-44.
Copyright ©2022 The Author(s). This open-access article is licensed under a Creative Commons Attribution 4.0 International License (https://creativecommons.org/licenses/by/4.0), which permits unrestricted use, sharing, adaptation, distribution, and reproduction in any medium, provided the original work is properly cited.


