An Analytic Hierarchy Process for a General Ranking of Friction Stir Welding Parameters Optimized Through the Design of Experimental Arrays
Mohamed Mohamed Abd Elnabi1*, Abdelrahman Abdelaal1
1Department of Mechanical Design and Production, Faculty of Engineering, Cairo University, Giza, Egypt
*Correspondence to: Mohamed Mohamed Abd Elnabi, PhD student, Department of Mechanical Design and Production, Faculty of Engineering, Cairo University, 1 Gamaa Street, Giza 12613, Egypt; Email: mohamed.abd.M@eng-st.cu.edu.eg
Abstract
Objective: This study aims to rank friction stir welding parameters using the analytic hierarchy process (AHP).
Methods: The proposed approach includes two phases to achieve a general ranking of the parameters through the separate estimation of their weights on each metal type and aggregation. The criteria used in the AHP for ranking are the contribution percentages and the degrees of the parameters obtained from the analysis of variance of experimental studies. The data were obtained from literature that used the design of experimental arrays to optimize these parameters on multiple properties and many similar and dissimilar metals. Fourteen parameters were assigned in the present analysis, namely rotational speed (RS), traverse speed (TS), axial force (AF), pin profile (PP), tilt angle (TA), the ratio between shoulder diameter and pin diameter (D/d ratio), shoulder diameter (SD), pin diameter (Pd), plunge depth (PD), pin length (PL), tool offset (TO), shoulder concavity (SC), number of passes (NOP) and base metal side (BMS).
Results: The parameters were classified into highly significant, moderately significant, and insignificant based on their rankings. The RS, TS, TA, and PP were the highest-ranking parameters with a total contribution of 83.4% to outputs. The insignificant parameters included the D/d ratio, BMS, SC, AF, and Pd, with a low total contribution of 14%. The moderately significant parameters were the TO, NOP, SD, PD, and PL.
Conclusion: The above-mentioned significant parameters could be controlled to maximize the response. The failure to achieve the target specified in the standard by controlling only highly significant parameters signifies a need for further modification of the FSW process. Therefore, parameters of moderate significance are potential parameters that need to be controlled to achieve the target. To limit the selection between these parameters, reference should be made to the type of metal used and then the parameters with the greatest impact on the metal are selected, i.e. controlling PL for aluminum, NOP, and SD for magnesium, and TO for aluminum-to-steel and aluminum-to-copper.
Keywords: friction stir welding, optimization, analytic hierarchy process, ultimate tensile strength, orthogonal arrays, analysis of variance
1 INTRODUCTION
Friction stir welding (FSW) is a modern consolidating technique in which a rotating profiled tool consisting of a shoulder and a pin is used for heat generation. The tool is plunged into clamped materials at an extremely small thinning of 0.1-0.2mm. The friction and axial force (AF) play a crucial role in the heat generation, and a solid-state joint is achieved through traversing the tool in the direction of the required weld path. The shoulder yields the most frictional heat required to plasticize the materials, and the pin completes the heat generation in the base region and stirs the plasticized materials from side to side to perform consolidation. Immense challenges exist in joining soft metals that are susceptible to fusion problems, such as aluminum alloys, and in joining dissimilar metals due to their plain difference in physical properties and melting temperatures. FSW exhibits great success in various industries, such as automotive, marine, and aerospace, due to its distinct features and benefits over fusion processes. Solid-state techniques such as FSW are available to overcome various flaws related to fusion processes, such as hot cracking, distortion, and porosity. FSW performs under the melting temperature, about 10-20%, of the materials[1] and has been vastly utilized for welding similar or dissimilar metals for aluminum and its alloys[2-45], titanium alloys[46], magnesium alloys[47-52], steel and its alloys[53,54], copper and its alloys (i.e., brass)[55,56], dissimilar joints of aluminum to copper or brass[57-65], aluminum to steel[66-72], aluminum to magnesium[73], and steel to copper[74]. These metals are regarded as hard to weld by traditional fusion processes.
The FSW parameters contribute to the formation of the weld zone, which influences the microstructures and mechanical properties of the joints. The optimization of FSW parameters secures the optimum properties of the joints. Optimization of the parameters has been conducted using various methods, such as the design of experiments (DOE)[4], response surface methodology (RSM)[2], fuzzy-logic technique[75], and artificial neural network[76]. The DOE technique has been used to optimize the FSW parameters as it minimizes time and costs through a few trials. Orthogonal arrays, characterized by a small fraction of full factorial, are the main element of the DOE techniques. Analysis of variance (ANOVA) on the DOE arrays allows for the estimation of the significance and percentage of contribution of parameters on required effects[5].
In the present study, the FSW parameters were ranked and weighed using the Analytic hierarchy process (AHP). Fourteen parameters of FSW were assigned , namely rotational speed, rpm (RS); traverse speed, mm/min (TS); AF, KN; pin profile (PP), tilt angle (TA); the ratio between shoulder and pin diameters (D/d ratio); shoulder diameter, mm (SD), pin diameter, mm (Pd); plunge depth, mm (PD); pin length, mm (PL); tool offset, mm (TO); and base metal side (BMS), based on tool rotation direction, no of passes (NOP), and shoulder concavity (SC). This study firstly ranked the parameters separately of each metal joining group based on the types of metals. Eight sets were selected, namely aluminum and its alloys[2-45], magnesium alloys[47-52], steel and its alloys[53,54], copper and its alloys (i.e., brass)[55,56], dissimilar joints of aluminum to copper and their alloys[57-65], aluminum alloys to steel alloys[66-72], aluminum alloys to magnesium alloys[73], and steel alloys to copper[74]. Each metal group had different combinations of optimized parameters. For each metal group, the ranking began on each combination of optimized parameters and then aggregated the weights of parameters of all combinations to obtain the overall ranking. Second, the general rank of FSW parameters was calculated by aggregating the weights of parameters of all metal groups. The final ranking was calculated regardless of the types of metals used in these joints.
2 DATA AND METHODS
2.1 Data Collection
Literature overviews of the optimization of FSW parameters for aluminum and its alloys[2-45], magnesium alloys[47-52], steel and its alloys[53,54], copper and its alloys (i.e., brass)[55,56], dissimilar joints of aluminum to copper and their alloys[57-65], aluminum alloys to steel alloys[66-72], aluminum alloys to magnesium alloys[73], and steel alloys to copper[74] are provided in Tables 1-8. It demonstrates the selected parameters in their optimization studies, percentage of contributions % obtained, arrays used, alloys, thicknesses of materials, statistical DOE methods performed, and the efficiencies of responses (properties) acquired in these investigations. The data were gathered based on the studies that used only the design of experimental arrays to optimize these parameters on a response representing the quality of the joint. The constraints used to gather the data are summarized in Table 9. The optimum values obtained from the optimization studies for FSW parameters to maximize the responses are collected in Appendix 1.
Table 1. An Overview of the Literature on the Optimization for FSW Parameters of Aluminum and Its Alloys
References |
Base Metal (Thickness) |
Array Level Par. |
Optimized Parameters (Selected Contribution %) |
(Eff %) UTS
|
|||||||||||
RS |
TS |
AF |
PP |
TA |
D/d ratio |
SD |
Pd |
PD |
PL |
TO |
BMS |
||||
Abd Elnabi et al.[4] |
AA5454/ AA7075 (3.5mm) |
L16OA-27 |
√ 9.08 |
√ 16.93 |
|
√ 0.11 |
√ 2.09 |
√ 12.47 |
|
|
√ 6.91 |
|
|
√ 2.31 |
85
|
Silva et al.[5] |
AA6082-T6 (3mm) |
L9OA-35
|
√ 5 |
√ 5 |
|
|
√ 4 |
√ 14 |
|
|
|
√ 9 |
|
|
76 |
Meengam et al.[6] |
AA6063 (6mm) |
L64-43
|
√ 1.95 |
√ 35.2 |
|
√ 24.78 |
|
|
|
|
|
|
|
|
82.95 |
Guo et al.[7] |
AA6061-T6 (6mm) |
L9OA-33 |
√ 27.85 |
√ 3.64 |
|
|
√ 68.41 |
|
|
|
|
|
|
|
84.1 |
Venkateswara Rao and Senthil Kumar[8] |
AA6061/AA2014 (10mm) |
L27OA-35 |
√ 35.29 |
√ 1.59 |
|
√ 2.57 |
√ 9.85 |
|
|
|
|
|
√ 11.60 |
|
71 |
Balamurugan et al.[9] |
AA5052-H32/ AA6061-T6 (5mm) |
L27OA-33 |
√ 12.7 |
√ 2.3 |
|
√ 82.17 |
|
|
|
|
|
|
|
|
N.A. |
Saeidi et al.[10] |
AA5083-H116/ AA7075-T6 (5mm) |
L9OA-32 |
√ 7.85 |
√ 90.96 |
|
|
|
|
|
|
|
|
|
|
|
Simoncini et al.[11] |
AA6082-T6 (2mm) |
L27OA-33
|
√ 9.74 |
√ 30.32 |
|
|
|
|
|
|
√ 53.23 |
|
|
|
69.4 |
Saravanakumr et al.[12] |
AA7075/ AA6082 (6.35mm) |
L9OA-33 |
√ 72.2 |
√ 5.6 |
|
|
√ 20.9 |
|
|
|
|
|
|
|
65.1 |
Shanavs et al.[13] |
AA5052-H32 (6mm) |
CCD/L31-54 |
√ 6.5 |
√ 6.9 |
|
√ 29.35 |
√ 50.77 |
|
|
|
|
|
|
|
93.51 |
Ghaffarpour et al.[14] |
AA5083-H12/ AA6061-T6(1.5mm) |
BBD L29-34 |
√ 69.02 |
√ 29.1 |
|
|
|
|
√ 0.66 |
√ 0.45 |
|
|
|
|
72.4 |
Rajendran et al.[15] |
AA2014-T6 (2mm) |
CCD/L30-54
|
√ 28.49 |
√ 22.05 |
|
|
√ 33.01 |
|
√ 16.46 |
|
|
|
|
|
N.A. |
Chanakyan et al.[16] |
AA6082 (6mm) |
Face CCD/L20-33 |
√ 9.35 |
√ 4 |
√ 14.87 |
|
|
|
|
|
|
|
|
|
71.8 |
Vijayan et al.[17] |
AA5083 (5mm) |
GRA/ L9OA-33 |
√ 45.6 |
√ 6.9 |
√ 41.1 |
|
|
|
|
|
|
|
|
|
92.5 |
Chien et al.[18] |
AA5083 (3mm) |
GRA/ L16OA-44 |
√ 6.76 |
√ 9.08 |
|
|
√ 2.79 |
|
|
|
|
√ 48.95 |
|
|
N.A. |
Raj et al.[19] |
AA3103/ AA7075 (6mm) |
L9OA-33 |
√ 15.59 |
√ 69.43 |
|
√ 0 |
|
|
|
|
|
|
|
|
N.A. |
Haribalaji et al.[20] |
AA2014/ AA7075 (4mm) |
L27OA-35 |
√ 13.3 |
√ 0.11 |
√ 6.5 |
√ 37.9 |
√ 31.14 |
|
|
|
|
|
|
|
49.7 |
Shunmugasundaram et al.[21] |
AA6063/ AA5052 (8mm) |
L9OA-33 |
√ 33.47 |
√ 7.8 |
|
|
√ 28.15 |
|
|
|
|
|
|
|
N.A. |
Umanath et al.[22] |
AA6063 (6mm) |
CCD/L20-53
|
√ 30.59 |
√ 32.4 |
√ 37 |
|
|
|
|
|
|
|
|
|
N.A. |
Koilraj et al.[23] |
AA2219-T87/ AA5083-H321 (6mm) |
L16OA-44 |
√ 10.26 |
√ 3.88 |
|
√ 12.92 |
|
√ 66.56 |
|
|
|
|
|
|
90 |
Pitchipoo et al.[24] |
AA6082-T6 (5mm) |
L9OA-33 |
√ 27.79 |
√ 4.70 |
|
|
√ 61.82 |
|
|
|
|
|
|
|
75.6 |
Pitchipoo et al.[25] |
AA5083-O/ AA6063-T6 (6mm) |
GRA/ L27OA-34 |
√ 30.70 |
√ 42.80 |
|
|
|
|
√ 25.93 |
√ 0.57 |
|
|
|
|
75 |
Bruce et al.[26] |
AA6061-T6/ AA5052 (4mm) |
BBD/ L17-33 |
√ 7.47 |
√ 5.47 |
|
|
√ 6.34 |
|
|
|
|
|
|
|
N.A. |
Abolusoro et al.[27] |
7075-T651 / 6101-T6 (6mm) |
L16OA-42 |
√ 63 |
√ 37 |
|
|
|
|
|
|
|
|
|
|
85.5 |
Farzadi et al.[28] |
AA7075-T6 (5mm) |
Rotatable CCD/L36-54 |
√ 33.55 |
√ 28.18 |
|
|
|
|
√ 13.46 |
√ 6.43 |
|
|
|
|
94 |
Tamjidy et al.[29] |
AA6061-T6/ AA7075-T6 (6mm) |
CCD/L30-54
|
√ 31.55 |
√ 29.84 |
|
|
√ 15.48 |
|
|
|
|
|
√ 22.83 |
|
81.30 |
Pate et al.[30] |
AA2024/ AA6061 (4mm) |
L11-33
|
√ 35 |
√ 24 |
|
|
√ 27 |
|
|
|
|
|
|
|
75.3 |
Jia et al.[39] |
AA5052-H32 (1mm) |
L9OA-33 |
√ 5.5 |
√ 11.5 |
|
√ 51 |
|
|
|
|
|
|
|
|
80.7 |
Sagheer-Abbasi et al.[31] |
Al-Ce-Si-Mg (6mm) |
L9OA-33 |
√ 29 |
√ 22 |
|
√ 41 |
|
|
|
|
|
|
|
|
52.3 |
Vijayan et al.[33] |
AA2219-T81 (6.25mm) |
L9OA-34 |
√ 81.87 |
√ 0.25 |
√ 16.71 |
√ 0.93 |
|
|
|
|
|
|
|
|
66.4 |
Vijayan et al.[33] |
AA6061/ AA6082 (7.5mm) |
GRA/ L9OA-33 |
√ 96.24 |
|
|
√ 0.41 |
√ 0.06 |
|
|
|
|
|
|
|
92.4 |
Kumar et al.[34] |
AA 5059 (4mm) |
Face CCD/L20-53 |
√ 31.20 |
√ 47.43 |
√ 21.39 |
|
|
|
|
|
|
|
|
|
76.3 |
Palanivel1 et al.[35] |
AA6351 T6/ AA5083H111 (6mm) |
Rotatable CCD/L31-54
|
√ 29.05 |
√ 21.75 |
√ 23.1 |
√ 26.28
|
|
|
|
|
|
|
|
|
88.6 |
Ahmadnia et al.[36] |
AA6061/ AA5010 (3mm) |
CCD/L20-53
|
√ 43.39 |
√ 32.3 |
|
|
|
|
|
|
√ 24.34 |
|
|
|
67 |
Sefene et al.[37] |
AA6061 (5mm) |
GRA/ L9OA-33 |
√ 64.21 |
√ 27.49 |
|
√ 0 |
|
|
|
|
|
|
|
|
92.25 |
Hasan et al.[38] |
AA7075-T6/ AA6061-T6 (3 mm) |
CCD/L31-54
|
√ 12.57 |
√ 18.42 |
|
√ 57 |
√ 12.1 |
|
|
|
|
|
|
|
82 |
Jia et al.[39] |
AA6061-T6 (3mm) |
L9OA-33 |
√ 37.57 |
√ 42.92 |
|
|
|
|
|
|
√ 10.62 |
|
|
|
94 |
Mohammadi et al.[40] |
5052-H18 (2mm) |
L29OA-34 |
√ 51.99 |
√ 3.1 |
|
|
|
|
√ 2.05 |
√ 1.69 |
|
|
|
|
85.76 |
Sarsılmaz and Çaydaş et al.[41] |
AA 1050/AA 5083 (6mm) |
FFD 18-32*21 |
√ 71.62 |
√ 10.59 |
|
√ 7.03 |
|
|
|
|
|
|
|
|
N.A. |
Lakshminarayanan et al.[42] |
RDE-40 Al-Zn-Mg (6mm) |
L9OA-33 |
√ 41.30 |
√ 33.25 |
√ 20.76 |
|
|
|
|
|
|
|
|
|
81.2 |
Murali et al.[43] |
AA2024 -T6 / AA 6351-T6 (5mm) |
L27OA-33 |
√ 67.31 |
√ 13.70 |
√ 14.50 |
|
|
|
|
|
|
|
|
|
78.9 |
Serio et al.[44] |
5754-H111 (6mm) |
L4OA-22 |
√ 45.02 |
√ 21.04 |
|
|
|
|
|
|
|
|
|
|
78.7 |
Abd Elnabi et al.[45] |
AA5454/ AA7075 (3.5mm) |
L12OA-27 |
√ 5.34 |
√ 13.66 |
|
√ 3.8 |
√ 5.69 |
√ 2.97 |
|
|
√ 13.47 |
|
|
√ 12.57 |
84.5 |
* Discover abbreviations on the complete list of abbreviations.
Table 2. An Overview of the Literature on the Optimization for FSW Parameters of Magnesium Alloys
References |
Base Metal (Thickness) |
Array Level Par. |
Optimized Parameters (Selected Contribution %) |
(Eff %) UTS |
|||||||||
RS |
TS |
AF |
PP |
TA |
SD |
Pd |
PD |
NOP |
SC |
||||
Sahu and Pal [47] |
AM20 (4 mm) |
GRA L18OA-(33*21) |
√ 3.04 |
√ 3.47 |
|
|
|
√ 26.56 |
|
√ 8.94 |
|
|
66.8 |
Haribalaji et al.[48] |
AZ61A (6mm) |
L27OA-35 S/N ratio |
√ 6.55 |
√ 28.15 |
√ 13.8 |
|
|
√ 5.47 |
√ 34.6 |
|
|
|
- |
Prasath et al.[49] |
AZ 31/ ZM21 (5mm) |
GRA L9OA-33 |
√ 19.56 |
|
√ 21.81 |
√ 56.95 |
|
|
|
|
|
|
- |
Senthilraja et al.[50] |
AZ91D (6mm) |
L9OA-33 |
√ 44.38 |
√ 36.17 |
√ 16.89 |
|
|
|
|
|
|
|
95.7 |
Kumar et al.[51] |
AZ91D (6mm) |
L9OA-33
|
√ 15.1 |
√ 26.7 |
|
|
|
|
|
|
|
√ 41.3 |
124 |
Asadi et al.[52] |
AZ91 (5mm) |
L27OA-38 S/N ratio |
√ 14.92 |
√ 30.59 |
|
√ 19.06 |
√ 5.15 |
√ 19.88 |
√ 1.69 |
√ 6.39 |
|
√ 2.28 |
- |
Table 3. An Overview of the Literature on the Optimization for FSW Parameters of Steel and Its Alloys
Base Metal (Thickness) |
Array Level Par. |
Optimized Parameters (Selected Contribution %) |
(Eff %) UTS
|
||||
RS |
TS |
TA |
SD |
||||
Siddiquee et al.[53] |
AISI-304 Stainless steel (2.95mm) |
L4OA-23 S/N ratio |
√ 15.73 |
√ 56.83 |
|
√ 27.44 |
- |
Pradeep et al.[54] |
Low alloy steel 3039 grade II (3mm) |
L9OA-33
|
√ 2.81 |
√ 32.83 |
√ 63.46 |
|
- |
Table 4. An Overview of the Literature on the Optimization for FSW Parameters of Copper and Its Alloys (i.e., brass)
References |
Base Metal (Thickness) |
Array Level Par. |
Optimized Parameters (Selected Contribution %) |
(Eff %) Properties |
|||
RS |
TS |
SD |
NOP |
||||
Meena et al.[55] |
Brass (CuZn40) (3mm) |
L9OA-33 S/N ratio |
√ 24.48 |
√ 38.11 |
|
√ 37.135 |
HRB 135 |
Renani et al.[56] |
Pure copper- Lap joint (5mm) |
GRA L8OA-23 |
√ 31.42 |
√ 27.32 |
√ 27.99 |
|
Shear strength - |
* Discover abbreviations on the complete list of abbreviations.
Table 5. An Overview of the Literature on the Optimization for FSW Parameters of Dissimilar Joints of Aluminum to Copper and Their Alloys
References |
Base Metal (Thickness) |
Array Level Par. |
Optimized Parameters (Selected Contribution %) |
(Eff %) Properties |
|||||||
RS |
TS |
PP |
TA |
D/d ratio |
SD |
PD |
TO |
||||
Elfar et al.[57] |
Pure aluminum/ CuZn30 (5mm) |
L9OA-34
|
√ 2.30 |
√ 64.30 |
|
|
|
|
|
√ 31.96 |
UTS 50 |
Sharma et al.[58] |
AA6101/ Pure copper (2.8mm) |
L18OA (33*21) S/N ratio |
√ 41.66 |
√ 5.52 |
|
|
|
√ 1.64 |
|
√ 34.17 |
Elec-conductivity 91.2 |
Sahu et al.[59] |
AA1050/ Pure copper (4mm) |
GRA/ L16O-44 S/N ratio |
√ 20.87 |
√ 19.90 |
|
|
|
|
√ 29.44 |
√ 10.32 |
UTS - |
Shojaeefard et al.[60] |
AA5083/ CuZn34 (2.5mm) |
L9OA-33 S/N ratio |
√ 38 |
√ 24.4 |
|
√ 32.77 |
|
|
|
|
Shear strength - |
Kumar et al.[61] |
AA6101 / Pure copper (6mm) |
L16OA-25 S/N ratio |
√ 30.14 |
√ 4.61 |
√ 46.5 |
|
√ 2.23 |
|
|
√ 16.7 |
UTS 63.5 |
Sharma et al.[62] |
Al-6101 / Pure Cu (2.8mm) |
GRA L18OA- (33*21) |
√ 71.53 |
√ 14.66 |
|
|
|
√ 0.475 |
|
√ 5.12 |
UTS 81 |
Panaskar et al. [63] |
AA6063/ ETP copper (3mm) |
L9OA-33 |
√ 59.84 |
√ 34.53 |
|
|
|
|
|
|
The-conductivity 140.4 |
Sharma et al.[64] |
AA6101 / Pure Cu (2.8 mm) |
L9OA-33 |
√ 27.57 |
√ 56 |
|
|
|
√ 15.27 |
|
|
UTS - |
Khalilpourazary et al.[65] |
AA5083 /CuZn34 (2.5 mm) Lap joint |
GRA L12OA- (31*41) |
√ 44.9 |
√ 46.6 |
|
|
|
|
|
|
Failure load - |
Table 6. An Overview of the Literature on the Optimization for FSW Parameters of Aluminum Alloys to Steel Alloys
References |
Base Metal (Thickness) |
Array Level Par. |
Optimized Parameters (Selected Contribution %) |
(Eff %) Properties |
||||||
RS |
TS |
PP |
TA |
SD |
Pd |
TO |
||||
Sameer et al.[66] |
AA6082-T6/ DP600 dual steel (2mm) |
GRA L9OA-34 |
√ 17.07 |
√ 64.97 |
|
√ 6.96 |
|
|
√ 11 |
UTS 86.1 |
Chen et al.[67,68] |
AA6061/ SS400 low carbon steel (6mm) |
L18OA- (33*21) |
√ 14.43 |
√ 19.89 |
|
√ 3.47 |
|
√ 5.76 |
|
Charpy Impact --- |
Goel et al.[69] |
AA 7475/ AISI 304 (2.5mm) |
L8OA-23 S/N ratio |
√ 42.19 |
√ 38.96 |
|
|
√ 12.60 |
|
|
UTS 75 |
Naghibi et al.[70] |
AA5052/ AISI 304 (3mm) |
L27OA-33 |
√ 51.05 |
√ 33.9 |
|
|
|
|
√ 7.17 |
UTS 84.4 |
Table 7. An Overview of the Literature on the Optimization for FSW Parameters of Aluminum Alloys to Magnesium Alloys
Reference |
Base Metal (Thickness) |
Array Level Par. |
Optimized Parameters (Selected Contribution %) |
(Eff %) UTS |
||
RS |
TS |
TA |
||||
Kumar et al.[73] |
AA6061/ AZ31B (4mm) |
L9OA-33 S/N ratio |
√ 17.88 |
√ 49.91 |
√ 30.61 |
- |
Table 8. An Overview of the Literature on the Optimization for FSW Parameters of Steel Alloys to Copper
Reference |
Base Metal (Thickness) |
Array Level Par. |
Optimized Parameters (Selected Contribution %) |
(Eff %) UTS |
||
RS |
TS |
TA |
||||
Jafari et al.[74] |
304L stainless steel /copper (3mm) |
CCD/ L20-53 |
√ 45.19 |
√ 17.85 |
√ 16.96 |
79.5 |
Table 9. A Summary of Collected Data Limitations for Metal Joining Groups
Metal group |
Constraints |
||||
Material Joint |
Material Thickness (mm) |
Type of Joint |
Response (M): Mean (S/N ratio): Signal/Noise |
Number of Optimized Parameters |
|
Aluminum and its alloys |
Similar Dissimilar |
1-10 |
Butt |
(M) UTS |
12 |
Magnesium alloys |
Similar Dissimilar |
4-6 |
Butt |
(M) UTS (S/N ratio) UTS |
10 |
Steel and its alloys |
Similar |
2.95-3 |
Butt |
(M) UTS |
4 |
Copper and its alloys (i.e., brass) |
Similar |
3-5 |
Butt Lap |
(S/N ratio) HRB (M) shear strength |
4 |
Dissimilar joints of aluminum to copper and their alloys |
Dissimilar |
2.5-6 |
Butt Lap |
(M) UTS (S/N ratio) UTS (M) shear strength (M) failure load (M) thermal conductivity (M) electric conductivity |
8 |
Aluminum alloys to steel alloys |
Dissimilar |
2-6 |
Butt |
(M) UTS (S/N ratio) UTS (M) Charpy impact |
6 |
Aluminum alloys to magnesium alloys |
Dissimilar |
4 |
Butt |
(S/N ratio) UTS |
3 |
Steel alloys to copper |
Dissimilar |
3 |
Butt |
(M) UTS |
3 |
UTS : Ultimate tensile strength; HRB: Hardness B.
The optimization studies were collected and then arranged in combinations according to the similarity of selected parameters to be optimized. This is accomplished for each metal joining group. The combinations of the considered parameters are listed in Table 10.
Table 10. A Detailed List of the Combinations of the Optimized Parameters for Each Metal Joining Group
Metal Group |
No. of Studies |
Total No. of Parameters |
No. of Combinations |
Combinations of Parameters |
No. of Parameters in a Combination |
Aluminum and its alloys |
43 |
12 |
16 |
RS/TS RS/TS/PP, RS/TS/TA, RS/TS/PD, RS/TS/AF RS/TS/PP/TA, RS/TS/SD/Pd, RS/TS/TA/SD, RS/TS/TS/PL, RS/TS/PP//D/d ratio, RS/TS/TA/TO, RS/TS/AF/PP RS/TS/PP/TA/TO, RS/TS/TA/PL//D/d ratio, RS/TS/AF/PP/TA RS/TS/PP/TA/PD/BMS//D/d ratio |
2 3
4
5
7 |
Magnesium alloys |
6 |
10 |
6 |
RS/TS/AF, RS/TS/NOP RS/TS/SD/PD RS/TS/AF/SD/Pd RS/TS/PP/TA/SD/Pd/SC/ PD |
3 3 4 5 8 |
Steel and its alloys |
2 |
4 |
2 |
RS/TS/TA |
3 |
Copper and its alloys (i.e., brass) |
2 |
4 |
2 |
RS/TS/NOP, RS/TS/SD
|
3 |
Dissimilar joints of aluminum to copper and their alloys |
9 |
8 |
7 |
RS/TS/TA, RS/TS/SD, RS/TS/TO RS/TS/SD/TO, RS/TS/PD/TO RS/TS/PP//D/d ratio/TO |
2 3
4 5 |
Aluminum alloys to steel alloys |
5 |
6 |
4 |
RS/TS/SD, RS/TS/TO RS/TS/TA/Pd, RS/TS/TA/TO |
3 4 |
Aluminum alloys to magnesium alloys |
1 |
3 |
1 |
RS/TS/TA
|
3 |
Steel alloys to copper |
1 |
3 |
1 |
RS/TS/TA
|
3 |
* Discover abbreviations on the complete list of abbreviations.
2.2 AHP for FSW Parameters
The more common uses of AHP are in industry and academia. It has earned considerable attention in numerous fields, such as machine or supplier selection and other resource prioritization. At every level of the hierarchy, by comparing each parameter or alternative with the other, AHP attempts to determine the weight of each component of a finding to select, evaluate, rank, or/and make a decision[77].
In summary, the AHP involves seven procedures as follows:
1. Generate pairwise comparisons based on the degree of importance of parameters relative to each other (A).
2. Calculate the normalizing matrix. Each component is divided by the sum of its column. The sum of each column is 1.
3. Estimate the weight by averaging across the rows in the normalizing matrix (W).
4. Multiply each column of the pairwise comparison matrix by the corresponding weight Equation (1).
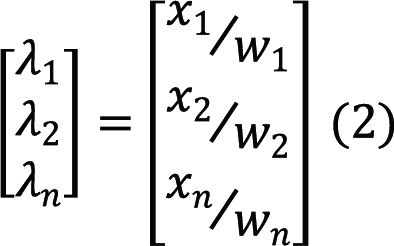
5. Calculate the eigenvector λ by Equation (2) and divide it by N (number of parameters) to obtain λAV as given in Equation (3).
6. Calculate the consistency index (CI) as given in Equation (4).
7. Check the Saaty ratio for consistency as given in Equation (5). If the ratio exceeds 0.1, the determination is considered to be significantly close to simple random and may require repeated estimation[77].
|
The percentages of contributions % and the degrees obtained from the ANOVA of the parameters are the two criteria used in the ranking process. Reliance on only the contribution percentages of the parameters extracted from the ANOVA tables may be inaccurate due to statistical errors obtained in these studies. Some of these studies exhibit relatively high statistical errors due to reasons such as inappropriate orthogonal arrays, neglect of the interaction between parameters, or/ and setting improper levels. Therefore, the second criterion is developed based on the degrees of the parameters in their ANOVA tables. As given in Table 11, each parameter is given a normalized contribution according to its degree.
Table 11. Normalizing Rate Based on the Number of Parameters
No. of Parameters |
Normalizing |
|||||||
Degree |
||||||||
|
1 |
2 |
3 |
4 |
5 |
6 |
7 |
8 |
2 |
0.5 |
0.5 |
|
|
|
|
|
|
3 |
0.501 |
0.334 |
0.167 |
|
|
|
|
|
4 |
0.4 |
0.3 |
0.2 |
0.1 |
|
|
|
|
5 |
0.333 |
0.2667 |
0.2 |
0.1333 |
0.0666 |
|
|
|
7 |
0.25 |
0.2143 |
0.1786 |
0.1429 |
0.1071 |
0.071 |
0.0357 |
|
8 |
0.222 |
0.194 |
0.1667 |
0.139 |
0.111 |
0.083 |
0.0556 |
0.028 |
The second normalized contribution is combined with the actual contribution percentage % to give the general rating or the average overall contribution. The pairwise comparisons are generated according to the differences between the overall contribution of the parameters. Table 12 illustrates an example of these measurements for one combination of the parameters, e.g., RS, TS, and AF. This combination relates to aluminum and its alloys joining group. For all other combinations of the optimized parameters, the measurements were similarly calculated.
Table 12. The Differences in Overall Contributions between RS, TS, and AF Based on the Criteria Used
# |
Ref. |
RS |
TS |
AF |
Error |
∑ |
Normalizing |
||
RS |
TS |
AF |
|||||||
1 |
16 |
9.35 |
4 |
14.87 |
71.78 |
100 |
0.334 |
0.167 |
0.501 |
2 |
17 |
45.6 |
6.9 |
41.1 |
6.4 |
0.501 |
0.167 |
0.334 |
|
3 |
22 |
30.59 |
32.4 |
37 |
0.01 |
0.167 |
0.334 |
0.501 |
|
4 |
34 |
31.2 |
47.43 |
21.39 |
0 |
0.334 |
0.501 |
0.167 |
|
5 |
42 |
41.3 |
33.25 |
20.76 |
4.69 |
0.501 |
0.334 |
0.167 |
|
6 |
43 |
67.31 |
13.7 |
14.5 |
4.49 |
0.501 |
0.167 |
0.334 |
|
∑ |
225.35 |
137.68 |
149.62 |
|
∑ |
2.338 |
1.67 |
2.004 |
|
Avg. |
37.5583 |
22.9467 |
24.9367 |
|
Avg. |
0.38967 |
0.27833 |
0.334 |
|
1# % |
2# % |
38.9667 |
27.8333 |
33.4 |
|||||
∑ (1# % + 2# %) |
76.525 |
50.78 |
58.3367 |
|
|||||
Avg. |
38.2625 |
25.39 |
29.1683 |
||||||
Differences |
RS-TS |
12.8725 |
|||||||
AF-TS |
3.77833 |
||||||||
RS-AF |
9.09417 |
||||||||
After all measurements, the differences in the overall contribution percentages % between parameters range from 0 to 46 %. The degrees based on AHP between equal importance (1) and absolutely more important (9) are built according to these differences in the overall contributions. According to the measurements, the contribution of 5.75 % is the transition value from a degree to a higher one of importance. If the value of the difference lies between two grades, the selection of the appropriate degree is determined based on the convergence of the contribution value from this degree. Figure 1 shows the AHP degrees of importance and their corresponding contributions. As depicted in Figure 1, between degrees 1 and 2 as an example, if the difference in the overall contribution is more than 2.875%, the proper degree of the relation between two parameters is 2, and vice versa.
|
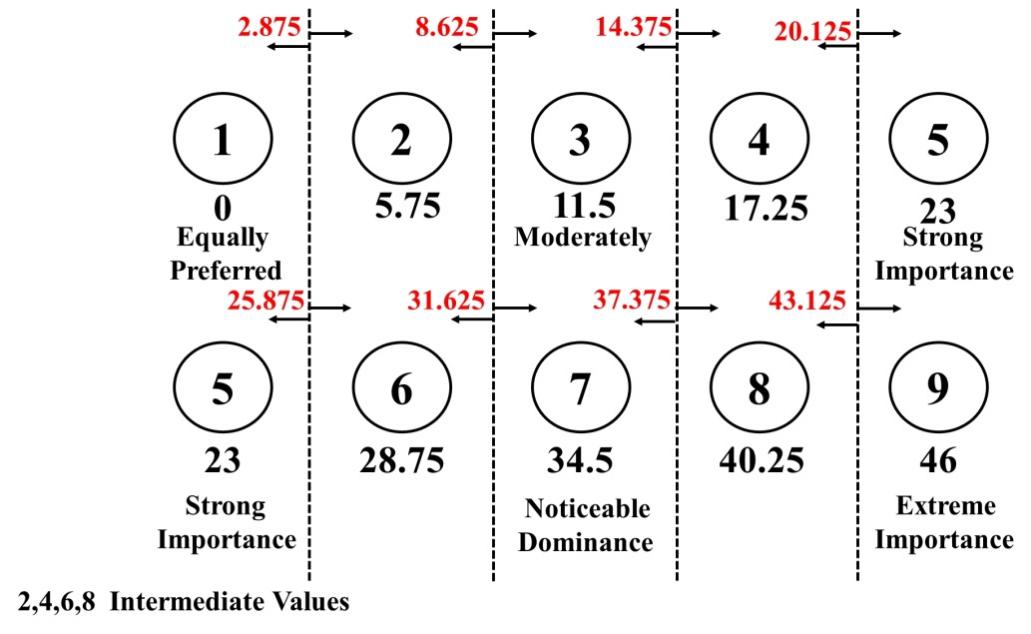
Figure 1. The AHP degrees of importance and their corresponding percentages of contributions.
As represented in Table 12, the difference in overall contribution between RS and TS is 12.8725%, so the grade of importance between RS and TS is 3, indicating that the RS somewhat more important than TS. The AHP pair comparisons and normalized matrix for the combination of RS, TS, and AF are given in Tables 13 and 14. The other relationships are expressed in the same manner. The weights of RS, TS, and AF are 0.589, 0.159, and 0.251, respectively. In this combination, the ranks of RS, TS, and AF are 1, 3, and 2, respectively. The consistency ratios were checked using the division between consistency index and random index (given in Table 15). The consistency ratio CR scores 0.027 (<0.1) suggesting a consistent comparison. In the following Figures, the relation (degree of importance) between two parameters is depicted by an arrow or a line. The arrow goes from the parameter with a higher importance degree over another. Also, the line denotes an equal degree of importance between the parameters. The relations and the degrees of importance of the optimized two-three, four, five, and seven parameters for aluminum and its alloys are depicted in Figures 2-5. The relations and the degrees of importance of the optimized three, four, and five parameters for magnesium alloys are in Figure 6. Also, the relations and the degrees of importance of the optimized eight parameters are in Figure 7. The relations and the degrees of importance of the optimized three parameters for steel and its alloys are depicted in Figure 8A. The relations and the degrees of importance of the optimized three parameters for copper and its alloys (i.e., brass) are in Figure 8B. The relations and the degrees of importance of the optimized two, three, four, and five parameters for dissimilar joints of aluminum to copper and their alloys are depicted in Figure 9. The relations and the degrees of importance of the optimized two, three, four, and five parameters for aluminum alloys to steel alloys are depicted in Figure 10. The relations and the degrees of importance of the optimized three parameters for aluminum alloys to magnesium alloys are in Figure 11A. The relations and the degrees of importance of the optimized three parameters for steel alloys to copper are in Figure 11B.
Table 13. AHP Pairs Comparison in the Combination of RS/TS/AF from Aluminum and Its Alloys Group
No. |
Parameters |
Symbol |
RS |
TS |
AF |
1 |
Rotational speed |
RS |
1.00 |
3 |
3 |
2 |
Traverse speed |
TS |
0.33 |
1.00 |
0.50 |
3 |
Axial force |
AF |
0.33 |
2.00 |
1.00 |
|
Total |
|
1.66 |
6.00 |
4.50 |
Table 14. Normalized Matrix for RS/TS/AF Combination from Aluminum and Its Alloys Group
No. |
Parameters |
Symbol |
RS |
TS |
AF |
Total |
AVG Weight |
Consistency Measure |
1 |
Rotational speed |
RS |
0.60 |
0.50 |
0.67 |
1.77 |
0.5892897 |
3.09087474 |
2 |
Traverse speed |
TS |
0.20 |
0.17 |
0.11 |
0.478 |
0.1593929 |
3.020721769 |
3 |
Axial force |
AF |
0.20 |
0.33 |
0.22 |
0.75 |
0.2513174 |
3.04224306 |
|
Total |
|
1.00 |
1.00 |
1.00 |
|
|
|
|
Lambda max λAV |
3.031482415 |
||||||
CI |
0.015741207 |
|||||||
RI |
0.58 |
|||||||
CR Ratio |
0.027140013 |
|||||||
Table 15. Random Index (RI) Table
N |
1 |
2 |
3 |
4 |
5 |
6 |
7 |
8 |
9 |
RI |
0 |
0 |
0.58 |
0.9 |
1.12 |
1.24 |
1.32 |
1.41 |
1.46 |
|
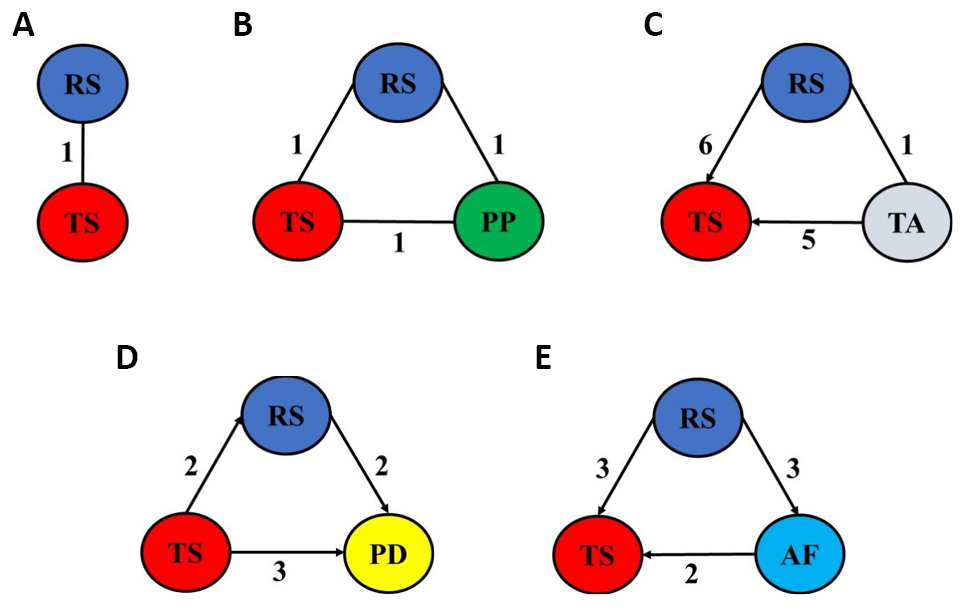
Figure 2. The relations and the degrees of importance of the optimized two-three process parameters for aluminum and its alloys: RS/TS (A), RS/TS/PP (B), RS/TS/TA (C), RS/TS/PD (D), and RS/TS/AF (E).
|
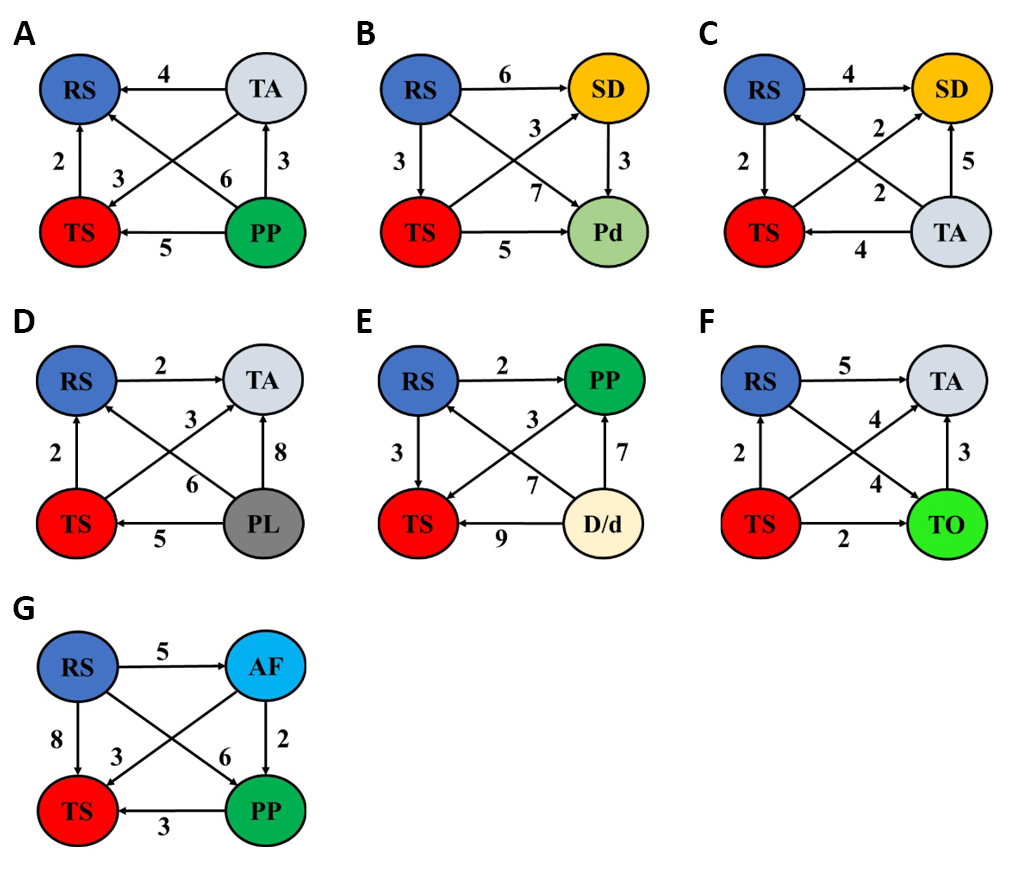
Figure 3. The relations and the degrees of importance of the optimized four process parameters for aluminum and its alloys: RS/TS/PP/TA (A), RS/TS/SD/Pd (B), RS/TS/TA/SD (C), RS/TS/TS/PL (D), RS/TS/PP//D/d ratio (E), RS/TS/TA/TO (F), and RS/TS/AF/PP (G).
|
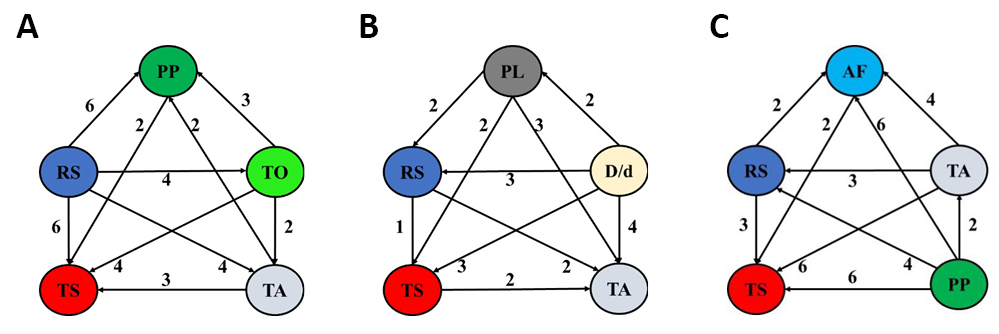
Figure 4. The relations and the degrees of importance of the optimized five process parameters for aluminum and its alloys: RS/TS/PP/TA/TO (A), RS/TS/TA/PL//D/d ratio (B), and RS/TS/AF/PP/TA (C).
|
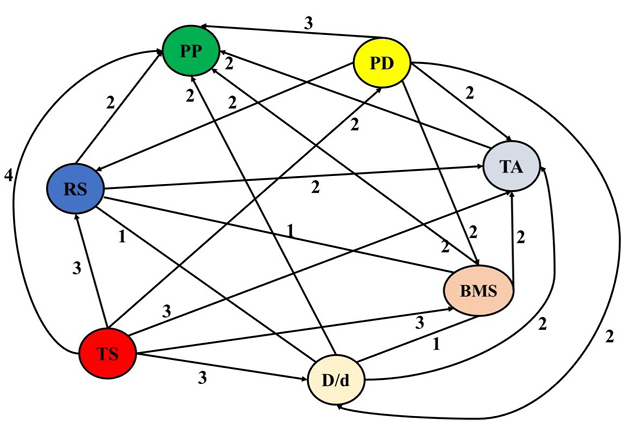
Figure 5. The relations and the degrees of importance of the optimized seven process parameters for aluminum and its alloys: RS/TS/PP/TA/PD/BMS//D/d ratio.
|
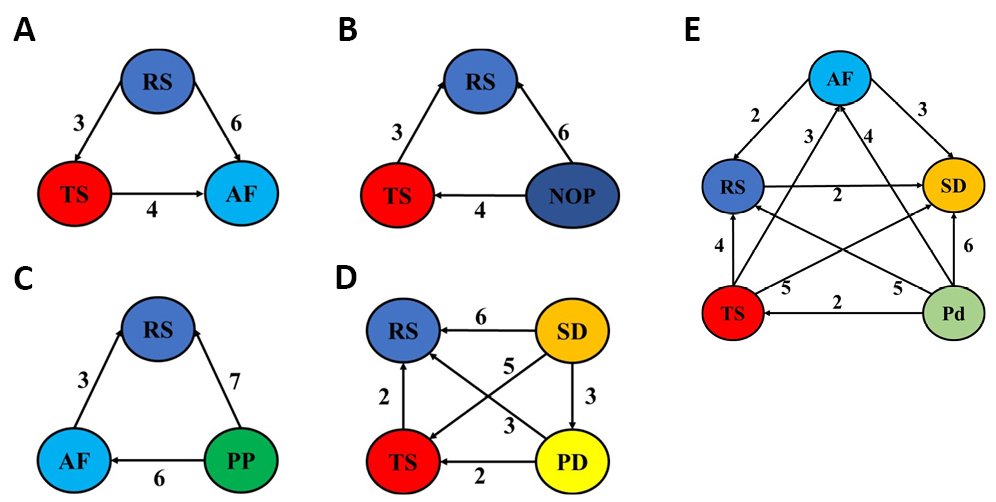
Figure 6. The relations and the degrees of importance of the optimized three-four-five process parameters for magnesium and its alloys: RS/TS/AF (A), RS/TS/NOP (B), RS/TS/PP(C), RS/TS/SD/PD (D), and RS/TS/AF/SD/Pd (E).
|
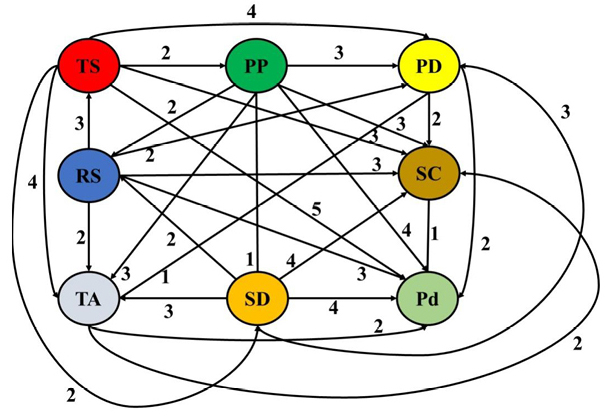
Figure 7. The relations and the degrees of importance of the optimized eight process parameters for magnesium and its alloys: RS/TS/PP/TA/SD/Pd/SC/PD.
|
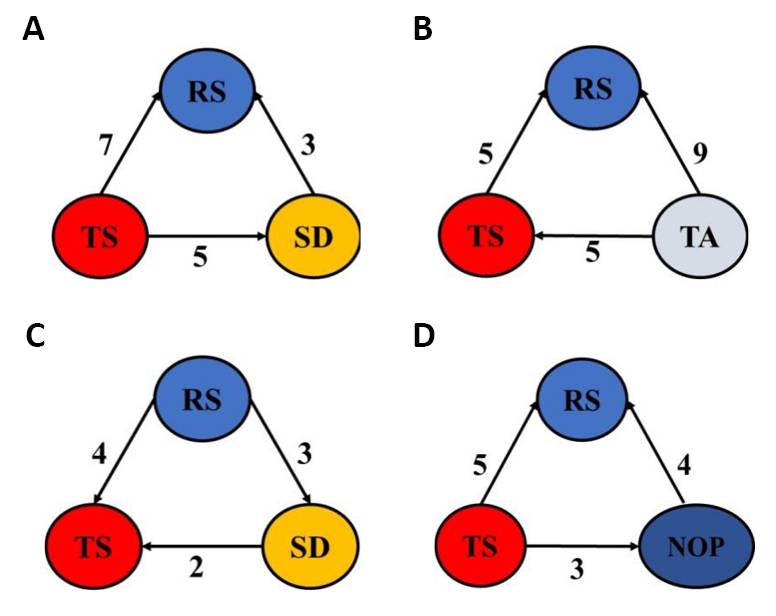
Figure 8. The relations and the degrees of importance of the optimized three process parameters for steel and its alloys: RS/TS/SD (A), and RS/TS/TA (B), and for copper and its alloys: RS/TS/SD (C), and RS/TS/NOP (D).
|
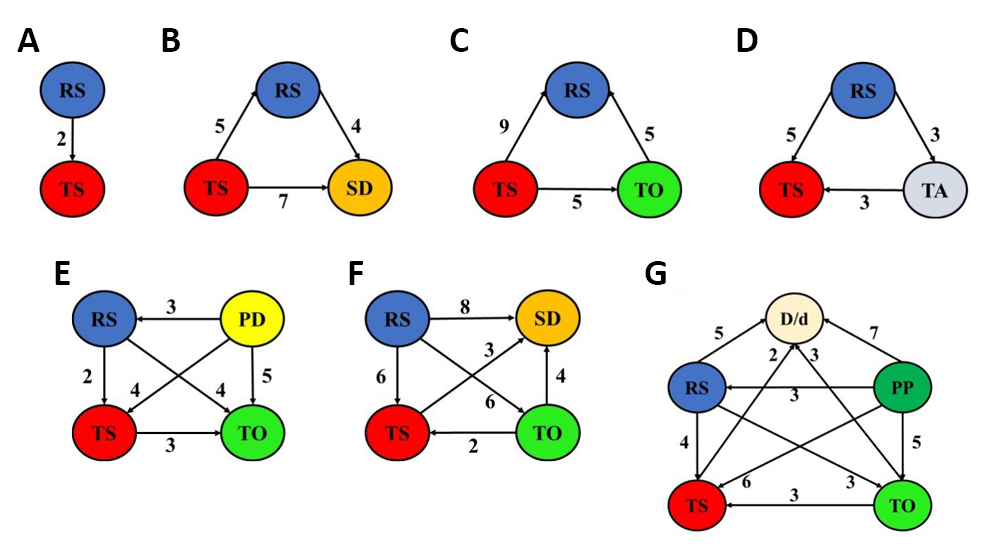
Figure 9. The relations and the degrees of importance of the optimized two-three-four-five process parameters for dissimilar aluminum-to-copper and their alloys: RS/TS (A), RS/TS/SD (B), RS/TS/TO (C), RS/TS/TA (D), RS/TS/PD/TO (E), RS/TS/SD/TO (F), and RS/TS/PP//D/d ratio/TO (G).
|
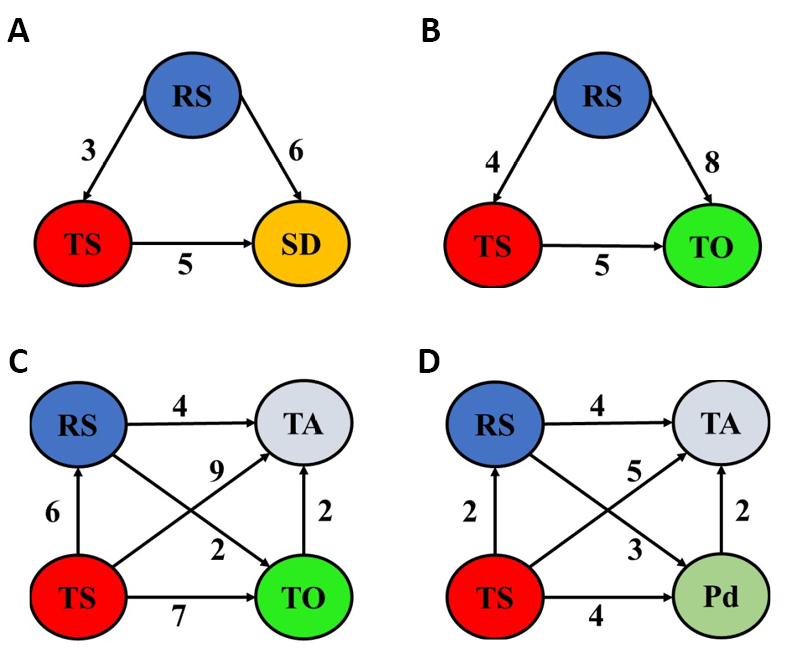
Figure 10. The relations and the degrees of importance of the optimized two-three-four-five process parameters for dissimilar aluminum-to-steel and their alloys: RS/TS/SD (A), RS/TS/TO (B), RS/TS/TA/TO (C) and RS/TS/TA/Pd (D).
|
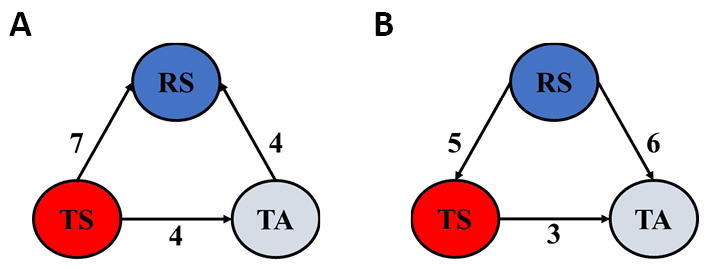
Figure 11. The relations and the degrees of importance of the optimized three process parameters for dissimilar aluminum-to-magnesium and their alloys: RS/TS/TA (A) and for dissimilar steel-to-copper and their alloys: RS/TS/TA (B)
The ranking and estimated weights of all optimized parameters in all sixteen combinations for aluminum and its alloys are given in Figure 12. The ranking and estimated weights of all optimized parameters in all six combinations for magnesium alloys are in Figure 13. The ranking and estimated weights of all optimized parameters in the two combinations for steel and its alloys are demonstrated in Figure 14A and 14B. The ranking and estimated weights of all optimized parameters in the two combinations for copper and its alloys (i.e., brass) are shown in Figure 14C and 14D. The ranking and estimated weights of all optimized parameters in all seven combinations for dissimilar joints of aluminum to copper and their alloys are shown in Figure 15. The ranking and estimated weights of all optimized parameters in all four combinations for aluminum alloys to steel alloys are given in Figure 16. The ranking and estimated weights of optimized parameters in the available combination for aluminum alloys to magnesium alloys are demonstrated in Figure 17A. The ranking and estimated weights of optimized parameters in the available combination for steel alloys to copper are demonstrated in Figure 17B. A comparison between the ranks of the parameters in the optimized combinations for all metal groups is illustrated in Table 14.
|
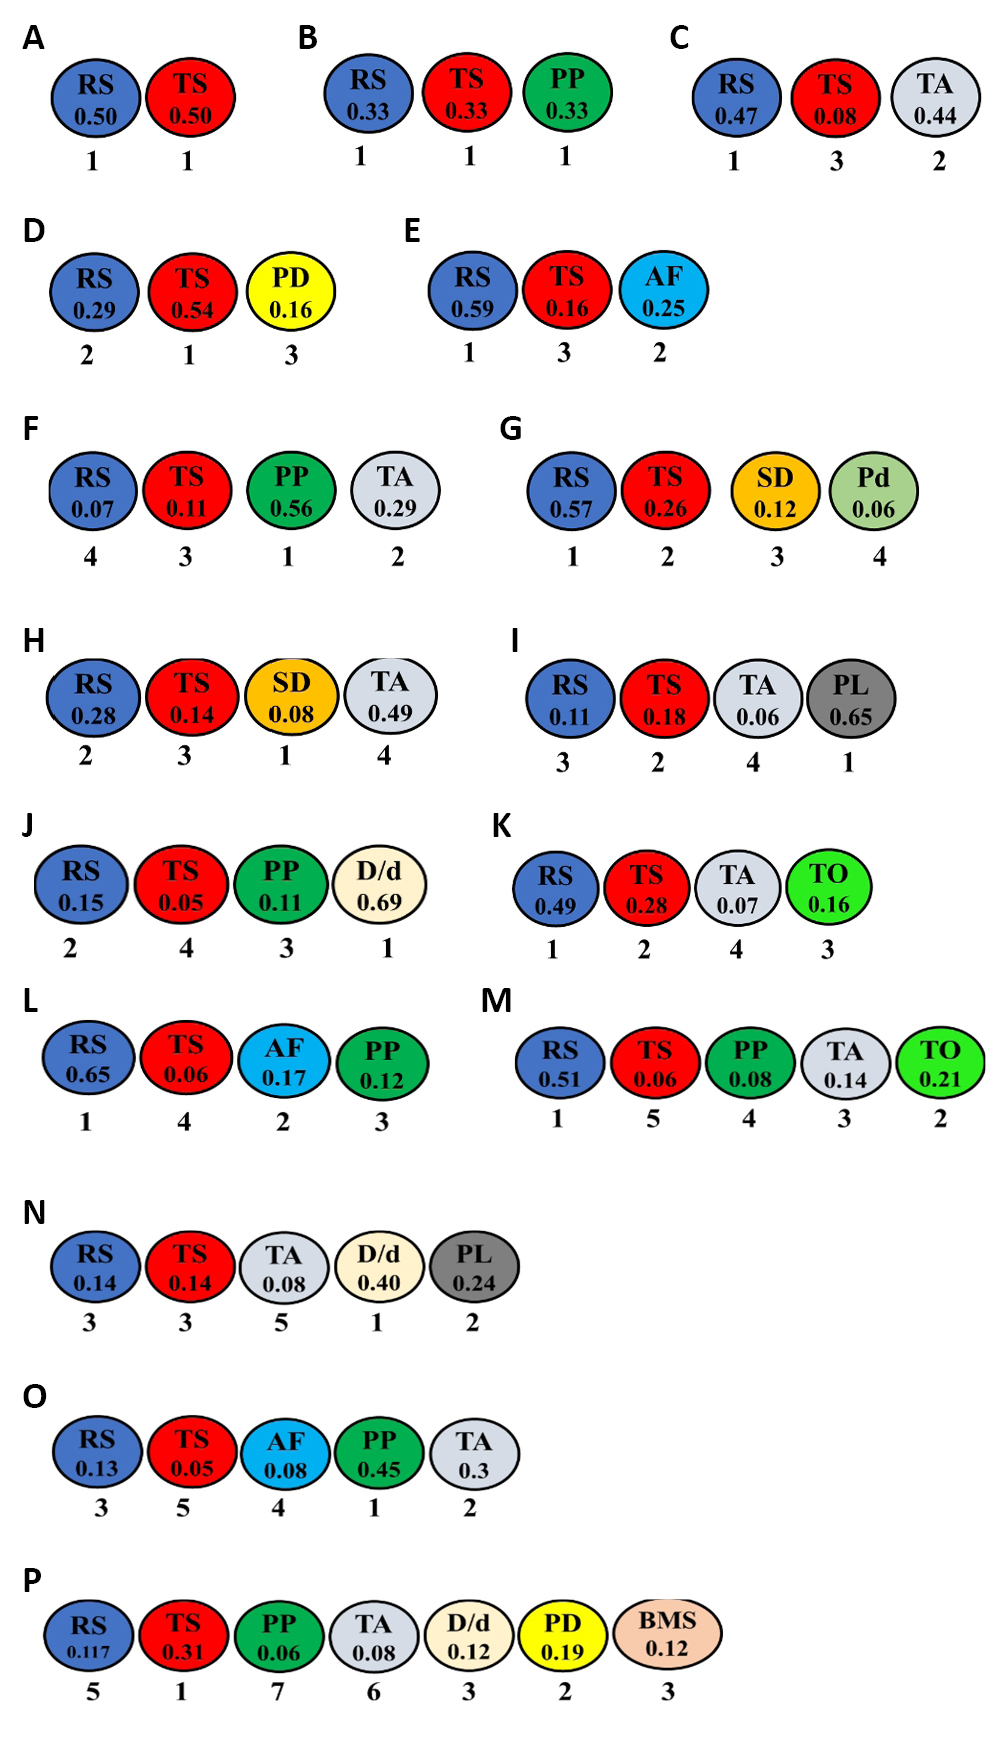
Figure 12. The ranks and estimated weights of all optimized parameters in the sixteen combinations for aluminum and its alloys: RS/TS (A), RS/TS/PP (B), RS/TS/TA (C), RS/TS/PD (D), RS/TS/AF (E), RS/TS/PP/TA (F), RS/TS/SD/Pd (G), RS/TS/TA/SD (H), RS/TS/TS/PL (I), RS/TS/PP//D/d ratio (J), RS/TS/TA/TO (K), RS/TS/AF/PP (L), RS/TS/PP/TA/TO (M), RS/TS/TA/PL//D/d ratio (N), RS/TS/AF/PP/TA (O), and RS/TS/PP/TA/PD/BMS//D/d ratio (P).
|
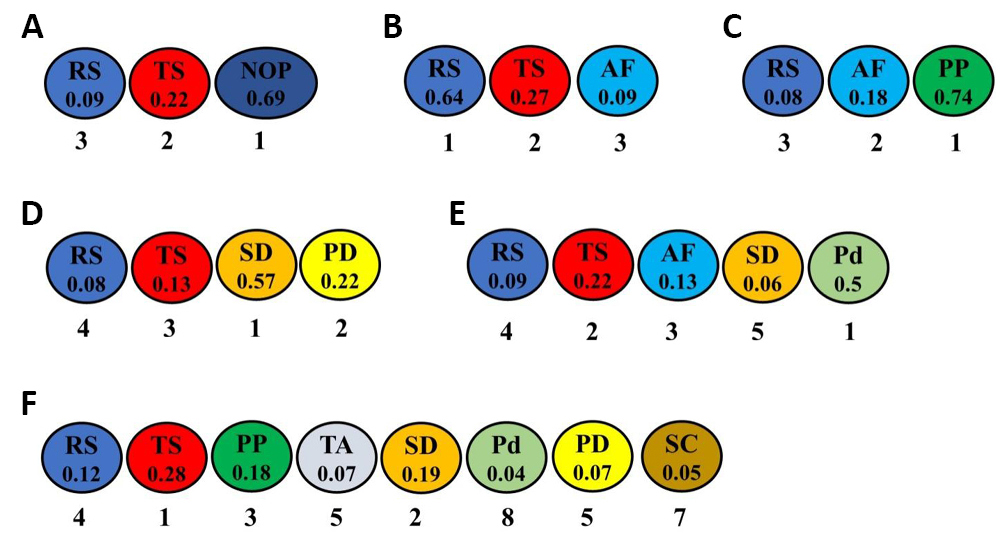
Figure 13. The ranks and estimated weights of all optimized parameters in the six combinations for magnesium and its alloys: RS/TS/NOP (A), RS/TS/AF (B), RS/TS/PP (C), RS/TS/SD/PD (D), RS/TS/AF/SD/Pd (E), and RS/TS/PP/TA/SD/Pd/SC/ PD (F).
|
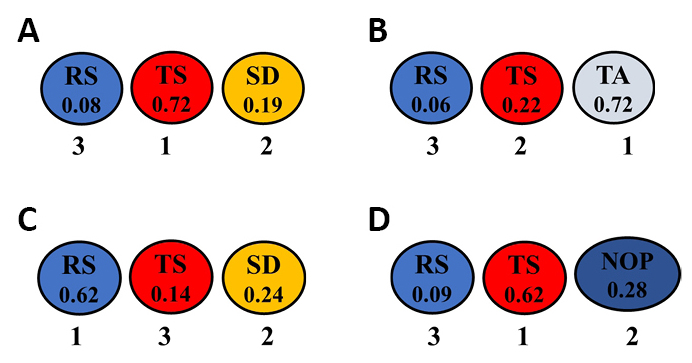
Figure 14. The ranks and estimated weights of all optimized parameters in the two combinations for steel and its alloys: RS/TS/SD (A), and RS/TS/TA (B) and for copper and its alloys: RS/TS/SD (C), and RS/TS/NOP (D).
|
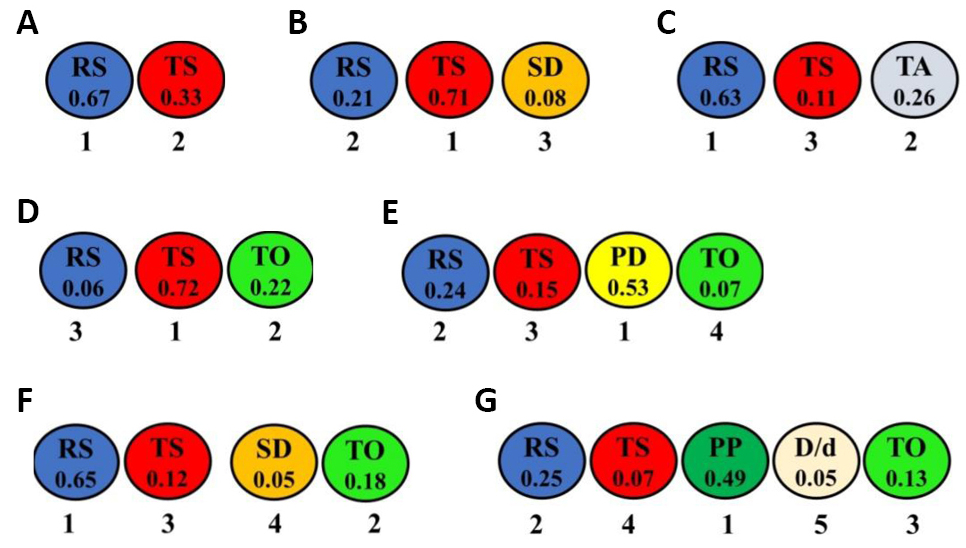
Figure 15. The ranks and estimated weights of all optimized parameters in the seven combinations for dissimilar aluminum-to-copper and their alloys: RS/TS (A), RS/TS/SD (B), RS/TS/TA (C), RS/TS/TO (D), RS/TS/PD/TO (E), RS/TS/SD/TO (F), and RS/TS/PP//D/d ratio/TO (G).
|
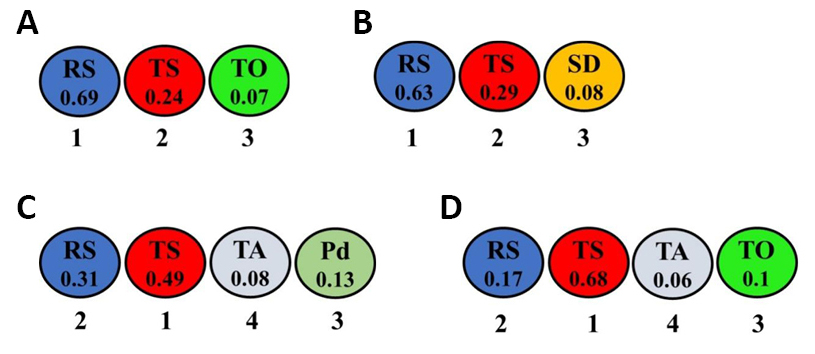
Figure 16. The ranks and estimated weights of all optimized parameters in the four combinations for dissimilar aluminum-to-steel and their alloys: RS/TS/TO (A), RS/TS/SD(B), RS/TS/TA/Pd (C), and RS/TS/TA/TO (D).
|
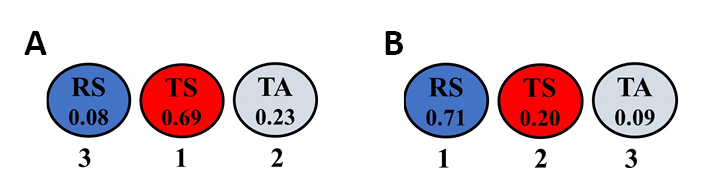
Figure 17. The ranks and estimated weights of optimized parameters for dissimilar aluminum-to-magnesium and their alloys: RS/TS/TA (A) and for dissimilar steel-to-copper and their alloys: RS/TS/TA (B).
Table 16. A Comparison between the Ranks of the Parameters in the Optimized Combinations for All Metal Groups
# |
Combinations of parameters |
Metal groups |
|||||||
Aluminum (Al) |
Magnesium (Mg) |
Steel (St) |
Copper (Cu) |
Al/St |
Al/Cu |
Al/Mg |
St/Cu |
||
2 |
RS/TS |
1/1 |
|
|
|
|
1/2 |
|
|
3 |
RS/TS/PP |
1/1/1 |
|
|
|
|
|
|
|
RS/TS/TA |
1/3/2 |
|
3/2/1 |
|
|
1/3/2 |
3/1/2 |
1/2/3 |
|
RS/TS/PD |
2/1/3 |
|
|
|
|
|
|
|
|
RS/TS/AF |
1/3/2 |
1/2/3 |
|
|
|
|
|
|
|
RS/TS/SD |
|
|
3/1/2 |
1/3/2 |
1/2/3 |
2/1/3 |
|
|
|
RS/AF/PP |
|
3/2/1 |
|
|
|
|
|
|
|
RS/TS/TO |
|
|
|
|
1/2/3 |
3/1/2 |
|
|
|
RS/TS/NOP |
|
3/2/1 |
|
3/1/2 |
|
|
|
|
|
4 |
RS/TS/PP/TA |
4/3/1/2 |
|
|
|
|
|
|
|
RS/TS/SD/Pd |
1/2/3/4 |
|
|
|
|
|
|
|
|
RS/TS/SD/PD |
|
4/3/1/2 |
|
|
|
|
|
|
|
RS/TS/SD/TO |
|
|
|
|
|
1/3/4/2 |
|
|
|
RS/TS/PD/TO |
|
|
|
|
|
2/3/1/4 |
|
|
|
RS/TS/TA/SD |
2/3/1/4 |
|
|
|
|
|
|
|
|
RS/TS/TA/PL |
3/2/4/1 |
|
|
|
|
|
|
|
|
RS/TS/TA/Pd |
|
|
|
|
2/1/4/3 |
|
|
|
|
RS/TS/PP//D/d ratio |
2/4/3/1 |
|
|
|
|
|
|
|
|
RS/TS/TA/TO |
1/2/4/3 |
|
|
|
2/1/4/3 |
|
|
|
|
RS/TS/AF/PP |
1/4/2/3 |
|
|
|
|
|
|
|
|
5 |
RS/TS/PP/TA/TO |
1/5/4/3/2 |
|
|
|
|
|
|
|
RS/TS/TA/PL//D/d ratio |
3/3/5/2/1 |
|
|
|
|
|
|
|
|
RS/TS/PP//D/d ratio/TO |
|
|
|
|
|
2/4/1/5/3 |
|
|
|
RS/TS/AF/PP/TA |
3/5/4/1/2 |
|
|
|
|
|
|
|
|
RS/TS/AF/SD/Pd |
|
4/2/3/5/1 |
|
|
|
|
|
|
|
7 |
RS/TS/PP/TA/PD/BMS// D/d ratio |
5/1/7/6/2/3/3 |
|
|
|
|
|
|
|
8 |
RS/TS/PP/TA/SD/Pd/SC/ PD |
|
4/1/3/5/2/8/7/5 |
|
|
|
|
|
|
2.3 Weights Aggregation of FSW Parameters
Herein, the goal is to aggregate the weights of each parameter from all relations and combinations for each metal group separately. Figures 18A-19B illustrate the aggregation process of weights of the twelve parameters optimized for aluminum and its alloys, the ten parameters optimized for magnesium and its alloys, the four parameters optimized for steel and its alloys, and the four parameters optimized for copper and its alloys, respectively. For the dissimilar joining of metals, Figure 20A and 20B illustrates the aggregation process of weights of the eight parameters optimized for dissimilar aluminum-to-copper and their alloys and the six parameters optimized for dissimilar aluminum-to-steel and their alloys, respectively.
|
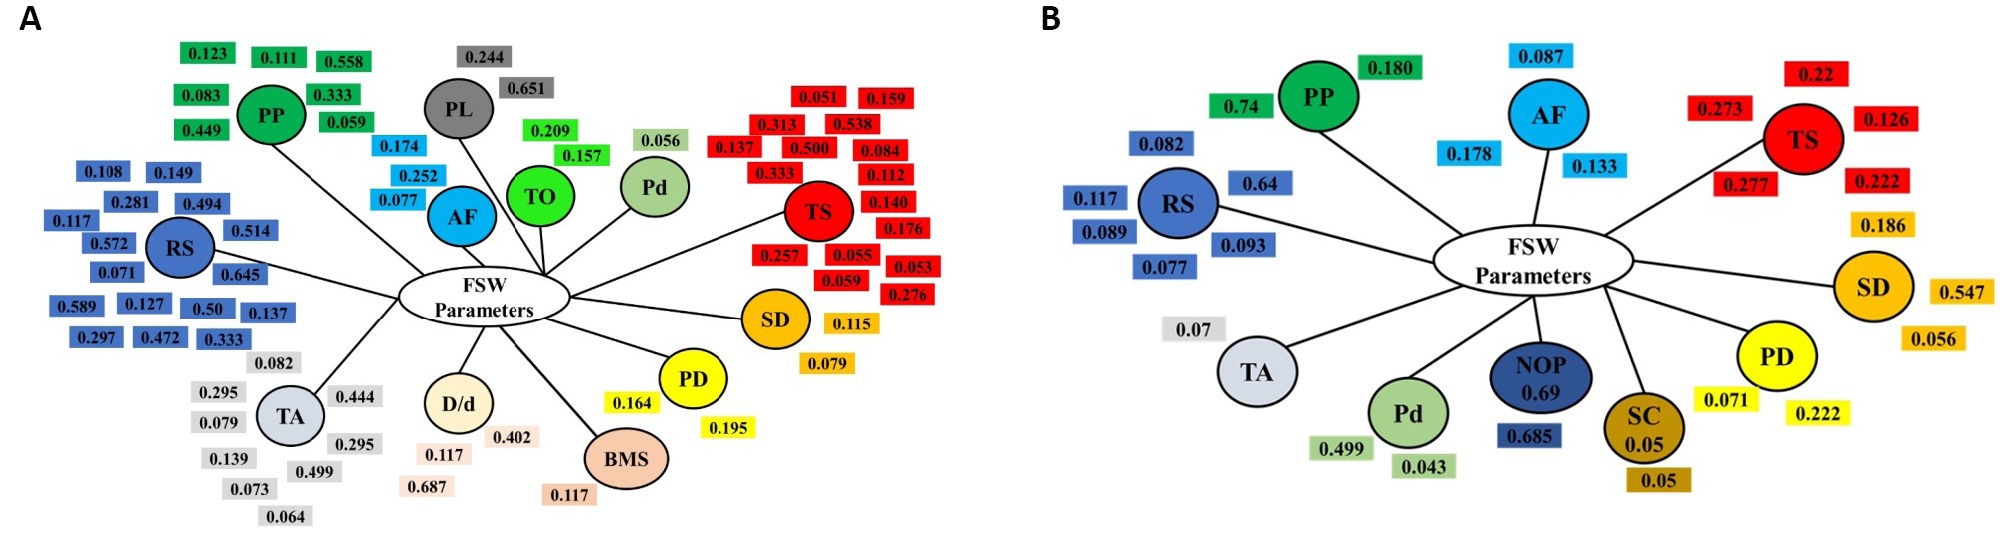
Figure 18. The aggregation of weights of the twelve FSW parameters optimized for aluminum and its alloys (A) and the aggregation of weights of the ten FSW parameters optimized for magnesium and its alloys (B).
|
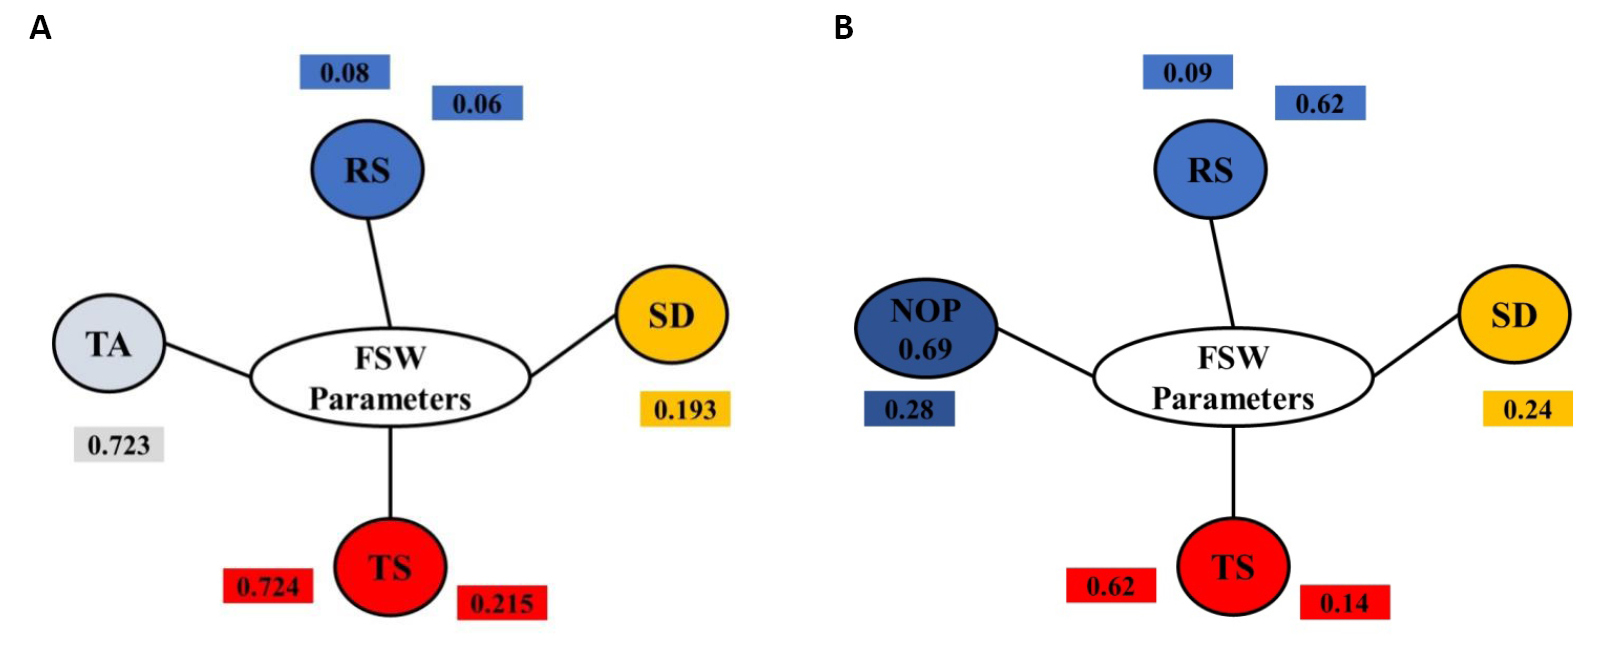
Figure 19. The aggregation of weights of the four FSW parameters optimized for steel and its alloys (A) and for copper and its alloys (B).
|
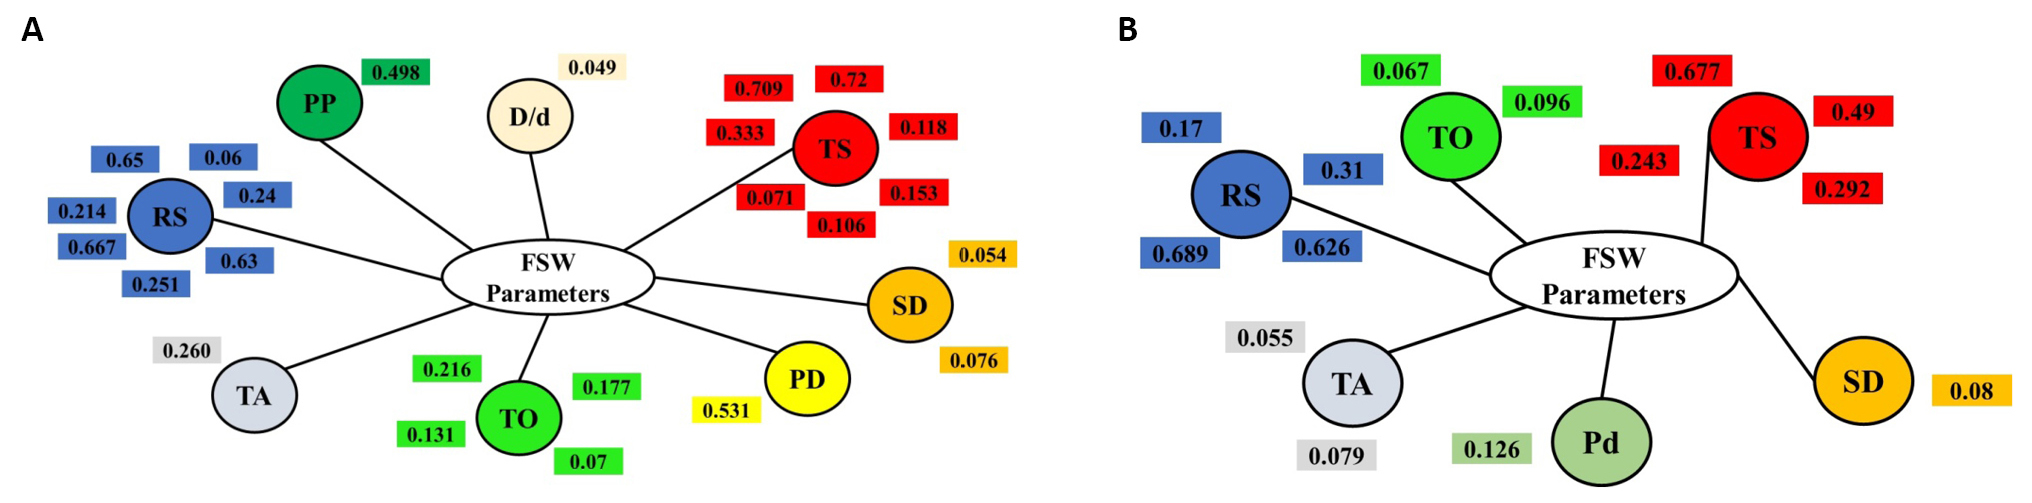
Figure 20. The aggregation of weights of the eight FSW parameters optimized for dissimilar aluminum-to-copper and their alloys (A) and the aggregation of weights of the six FSW parameters optimized for dissimilar aluminum-to-steel and their alloys (B).
3 RESULTS
3.1 The Final Ranking of FSW Parameters
After collecting all weights of the parameters, there was a deficiency in the number of collected weights of all parameters except for RS and TS, which were optimized in all combinations and rankings. Thus, to increase the accuracy, the overall ranking was estimated in following two manners. First, the ranking of a parameter in its metal group is based on its total weight divided by the total number of combinations in this metal group, called weight criterion 1. Second, the ranking of a parameter is based on its total weight divided by the number of combinations containing this parameter only in its metal group, called weight criterion 2. The two criteria were used to rank the parameters in each metal group. The overall ranking and weights of the parameters optimized for aluminum and its alloys, magnesium and its alloys, steel and its alloys, copper and its alloys, dissimilar aluminum-to-copper and their alloys, and dissimilar aluminum-to-steel and their alloys are shown in Figures 21-23. The overall ranking and weights of the parameters in the metal groups of dissimilar aluminum-to-magnesium and dissimilar steel-to-copper are identical to the estimated in its combination (Figure 17). This is attributed to the use of a single combination of parameters in these groups. Despite the alterations in the order of the parameters based on the type of metal, the RS, TS, TA, and PP are considered the most dominant parameters to maximize the responses of many various metal joints. It is also insufficient to control these parameters only. Some other parameters besides the previously mentioned should be handled according to their ranking for each metal type. It should control the D/d ratio and PL for the joints of aluminum and its alloys. The number of passes and SD should be handled for the joints of magnesium alloys. TO is significant in both aluminum-to-steel joints and aluminum-to-copper joints. A comparison of the overall ranking of the parameters for all metal groups is given in Table 17.
|
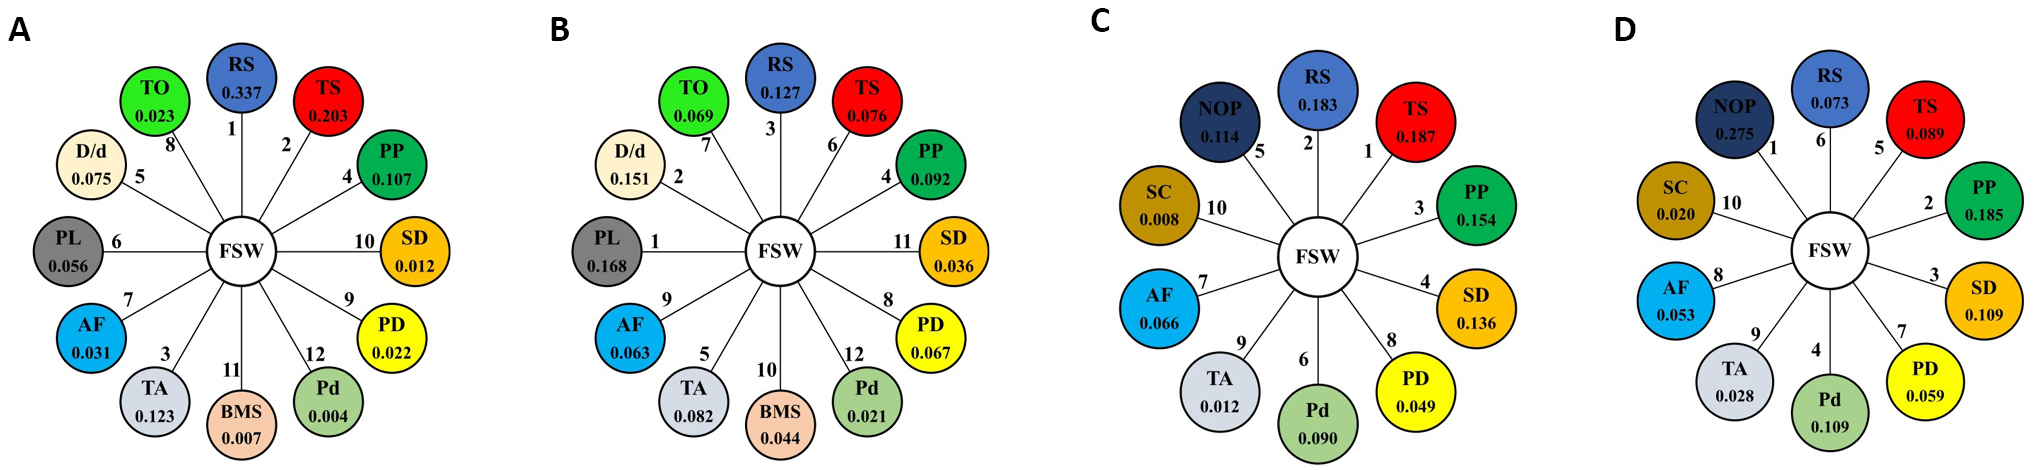
Figure 21. The final ranks and weights of the parameters optimized for aluminum and its alloys according to weight criterion 1 (A) and weight criterion 2 (B), and for magnesium and its alloys according to weight criterion 1 (C) and weight criterion 2 (D).
|
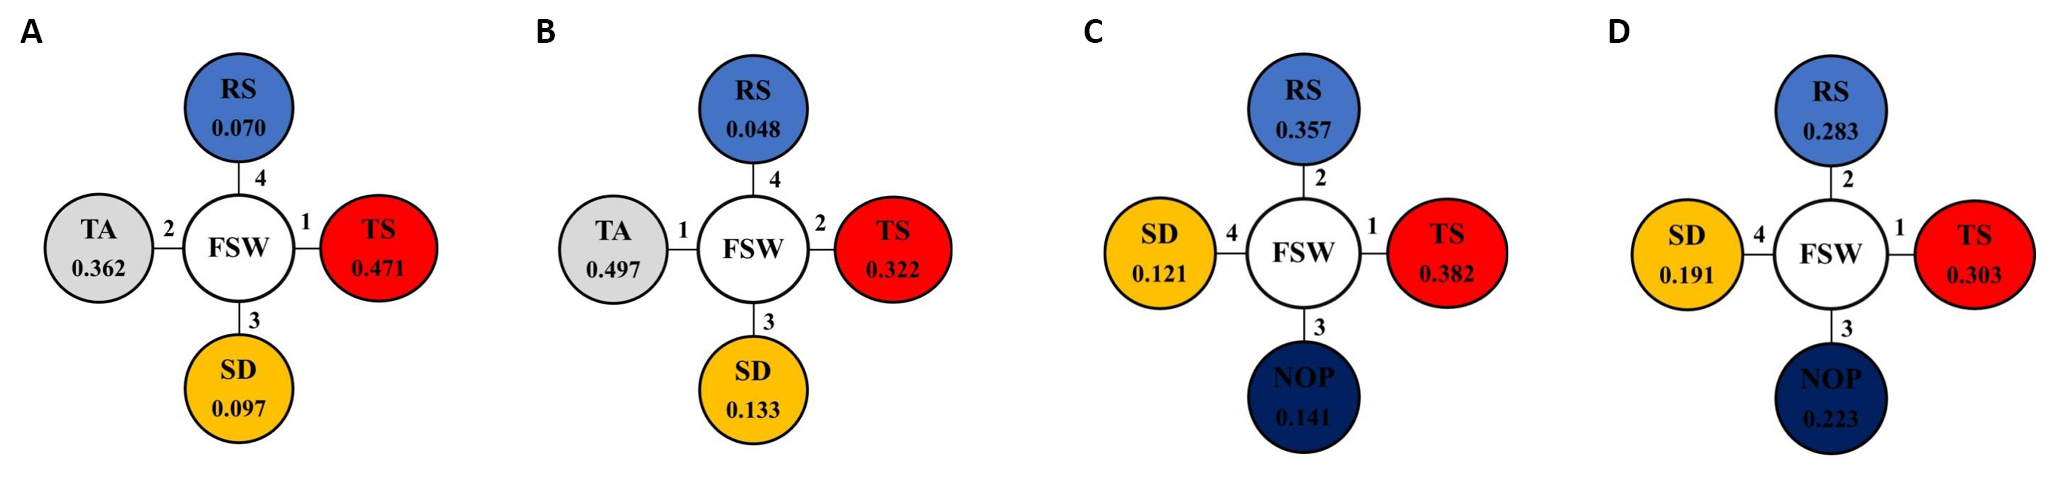
Figure 22. The final ranks and weights of the parameters optimized for steel and its alloys according to weight criterion 1 (A) and weight criterion 2 (B), and the final ranks and weights of the parameters optimized for copper and its alloys according to weight criterion 1 (C) and weight criterion 2 (D).
|
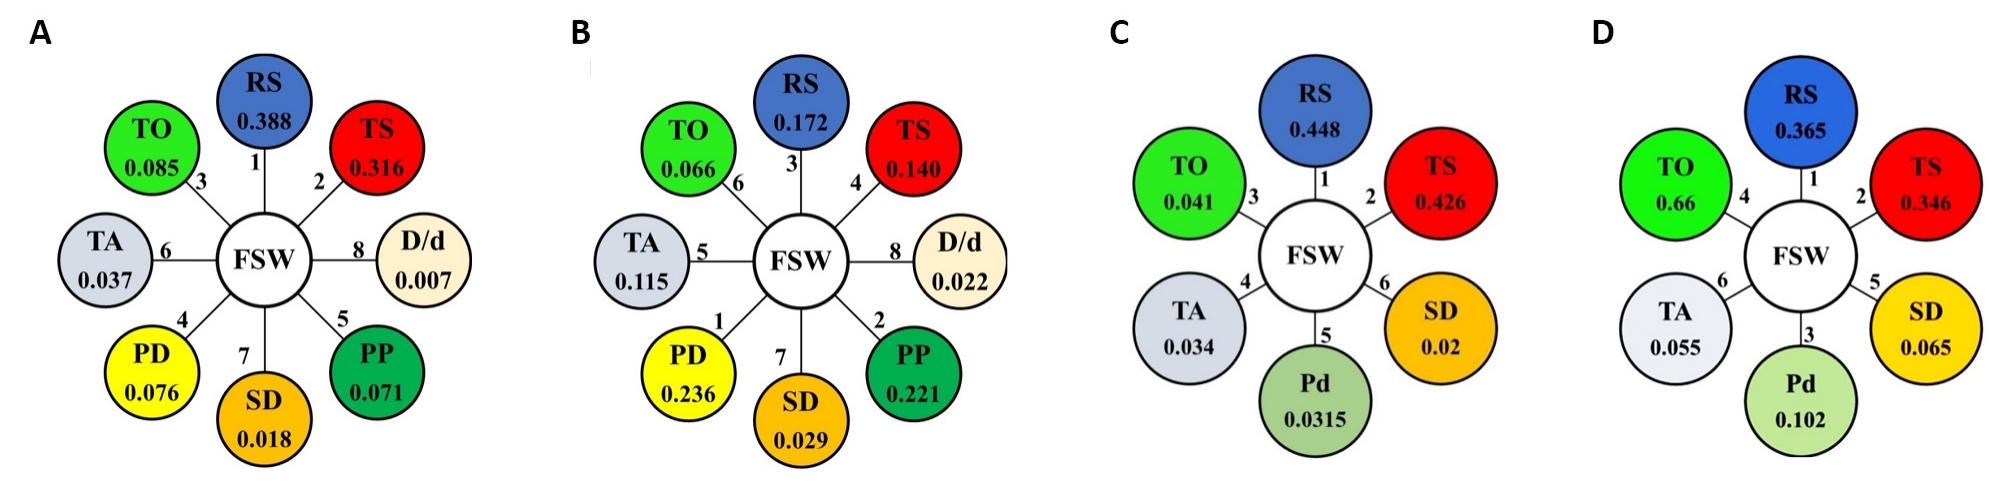
Figure 23. The final ranks and weights of the parameters optimized for dissimilar aluminum-to-copper and their alloys according to weight criterion 1 (A) and weight criterion (B) and the final ranks and weights of the parameters optimized for dissimilar aluminum-to-steel and their alloys according to weight criterion 1 (C) and weight criterion 2 (D).
Table 17. A Comparison of the Overall Ranking of the Parameters for All Metal Groups
Parameters |
Ranking |
|||||||
Aluminum |
Magnesium |
Steel |
Copper |
Aluminum /Steel |
Aluminum /Copper |
Aluminum/ Magnesium |
Steel/ Copper |
|
RS |
1/3 |
2/6 |
4/4 |
2/2 |
1/1 |
1/3 |
3/3 |
1/1 |
TS |
2/6 |
1/5 |
1/2 |
1/1 |
2/2 |
2/4 |
1/1 |
2/2 |
AF |
7/9 |
7/8 |
- |
- |
- |
- |
- |
- |
TA |
3/5 |
9/9 |
2/1 |
- |
4/6 |
6/5 |
2/2 |
3/3 |
SD |
10/11 |
4/3 |
3/3 |
4/4 |
6/5 |
7/7 |
- |
- |
PP |
4/4 |
3/2 |
- |
- |
- |
5/2 |
- |
- |
PD |
9/8 |
8/7 |
- |
- |
- |
4/1 |
- |
- |
Pd |
12/12 |
6/4 |
- |
- |
5/3 |
- |
- |
- |
TO |
8/7 |
- |
- |
- |
3/4 |
3/6 |
- |
- |
D/d ratio |
5/2 |
- |
- |
- |
- |
8/8 |
- |
- |
PL |
6/1 |
- |
- |
- |
- |
- |
- |
- |
BMS |
11/10 |
- |
- |
- |
- |
- |
- |
- |
NOP |
- |
5/1 |
- |
- |
- |
- |
- |
- |
SC |
- |
10/10 |
- |
- |
- |
- |
- |
- |
(1st No./2nd No.)*: 1st: first rank using weight criterion 1, 2nd: second rank using weight criterion 2
It is required to maintain these parameters at optimal levels depending on the process and production conditions, which requires pre-testing the levels of the parameters on the desired process. Based on the literature, the optimal levels (L) of the parameters were collected and formulated on a domain for each type of metal joint. The domain involves two limits, namely upper level, and lower levels. Operating out of the limits will drastically affect the responses (properties). The domains of the optimal levels are expressed in Equations (6)-(13) for aluminum, magnesium, steel, copper/brass, aluminum to copper, aluminum to steel, aluminum to magnesium, and steel to copper. The domain involving a limit should remain constant when testing levels.
|
Pin profile: S-Square, TC-Threaded Cylinder, H-Hexagonal
Pin length*: related to the thickness of the metal used, normally less than the metal thickness about 0.2-0.3 mm.
Units: RS: RPM; TS: min/min; AF: KN; PP: Shape; TA: º; D/d ratio: - ; SD: mm; Pd: mm; PD: mm; PL: mm; TO: mm; BMS: CW, CCW; NOP: #; SC: º.
3.2 The General Ranking of FSW Parameters
The final step was to develop the general ranking of the FSW parameters regardless of the type of metal used. This was done by aggregating the weights of each parameter from all metal groups and generating the general ranking. Figure 24A and 24B illustrates the aggregation process of weights of all FSW parameters optimized using weight criteria 1 and 2. The general ranking and final weights of the FSW parameters are shown in Figure 25. Despite the changes in the order of the parameters based on the different criteria used to estimate the weights, the parameters could be classified into three categories, namely highly significant, moderately significant, and insignificant. TS, RS, TA, and PP were highly significant parameters that require careful control to maximize the responses. The total contributions of these parameters to the output were 83.4% and 40.9% based on the criteria used to estimate weights. The insignificant parameters were the D/d ratio, BMS, SC, AF, and Pd, with a total contribution to the response between 4% and 14%. In between, there are moderately significant parameters. These parameters are the number of passes, TO, SD, PD, and PL. The failure to achieve the target specified in the standard by controlling only highly significant parameters signifies a need for further modification of the FSW process. Thus, parameters of moderate significance are potential parameters that need to be controlled to achieve the target. To limit the selection between these parameters, reference should be made to the type of metal used and then the parameters with the greatest impact on the metal are selected, i.e. controlling PL for aluminum, NOP, and SD for magnesium, and TO for aluminum-to-steel and aluminum-to-copper.
|
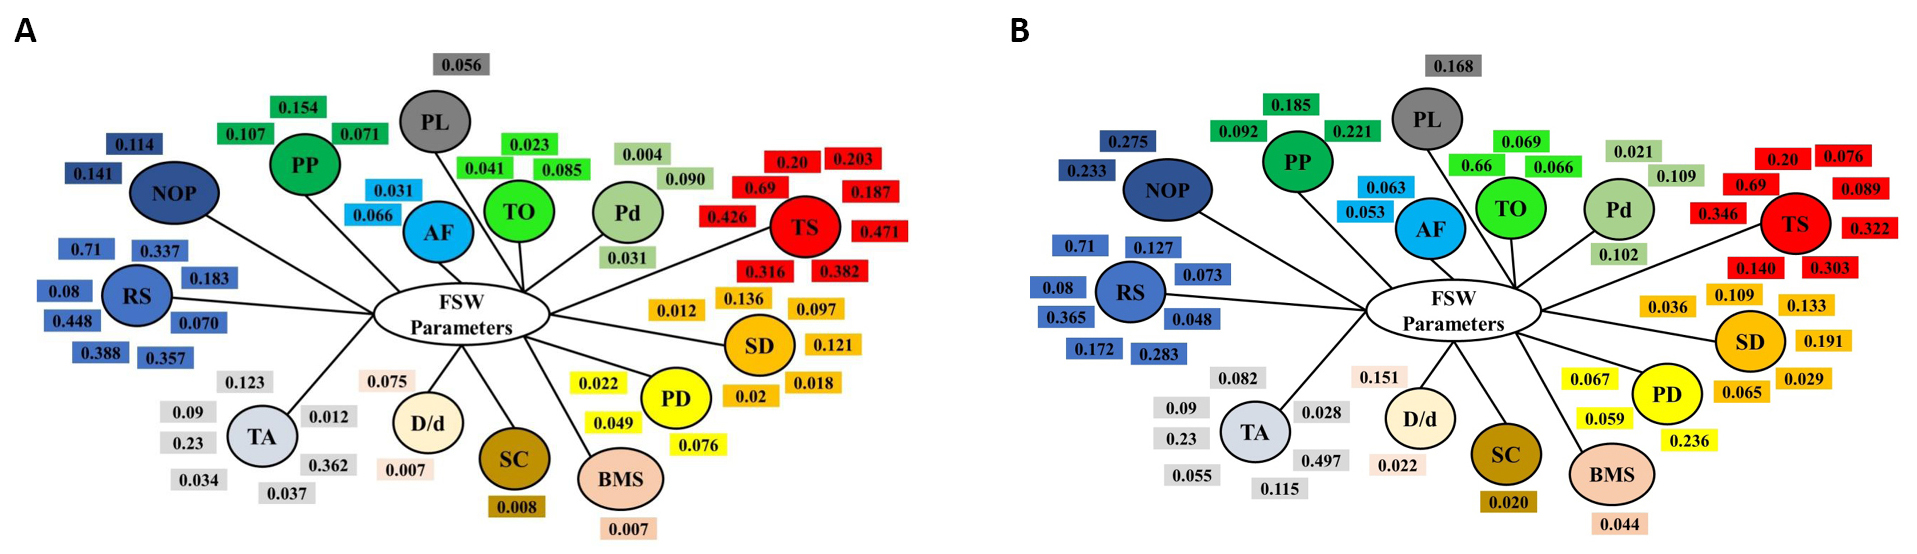
Figure 24. The aggregation of weights of the fourteen FSW parameters optimized for the general ranking using weight criterion 1 (A) and weight criterion 2 (B).
|
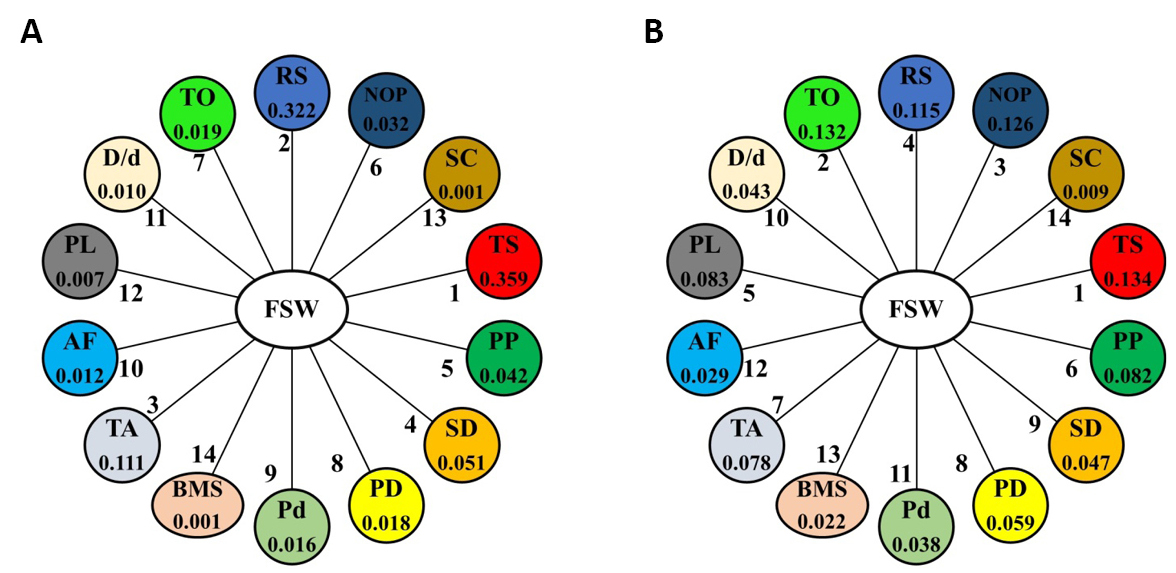
Figure 25. The general ranking and final weights of the FSW parameters optimized according to (A) weight criterion 1 and (B) weight criterion 2.
The data gathered from literature to be used in the ranking process were the contribution percentages and the degrees of the parameters obtained from the ANOVA of experimental studies. The data were sorted as per the type of metals used in the FSW joints. The weights of parameters were computed for each metal group individually and then aggregated to achieve the general ranking.
The results can be summarized as follows:
1) The parameters were classified into three categories, namely highly significant, moderately significant, and insignificant.
2) TS, RS, TA, and PP are highly significant parameters that necessitate careful control to maximize the responses.
3) The total contributions of the highly significant parameters to the output were 83.4% and 40.9% based on the two criteria used to estimate weights.
4) The insignificant parameters were the D/d ratio, BMS, SC, AF, and Pd.
5) The insignificant parameters may be ignored due to a low contribution of 14% or 4%, obtained from the two manners used for weight estimation.
6) The moderately significant parameters were the number of passes, TO, SD, PD, and PL.
7) The failure to achieve the target specified in the standard by controlling only highly significant parameters signifies a need for further modification of the FSW process. Thus, parameters of moderate significance are potential parameters that need to be controlled to achieve the target.
8) To limit the selection between these parameters, reference should be made to the type of metal used and then the parameters with the greatest impact on the metal are selected, i.e. controlling PL for aluminum, NOP, and SD for magnesium, and TO for aluminum-to-steel and aluminum-to-copper.
9) The optimal levels of the parameters were formulated on equations having a domain for each type of metal. Operating out of the limits will drastically affect the responses (properties).
Acknowledgements
Not applicable.
Conflicts of Interest
The authors declared no conflict of interest.
Author Contribution
Mohamed MAE was responsible for conceptualization, data curation, project administration, formal analysis, investigation, methodology, software, figures creation, writing-original draft, writing-review & editing. Abdelrahman A was responsible for software, editing, and figures creation.
Abbreviation List
AA, Aluminum alloy
AF, Axial Force
AHP, Analytic hierarchy process
ANOVA, Analysis of variance
AS, Advancing side
BBD, Box-Behnken design
BMS, Base metal side
CCD, Central composite design
CI, Consistency Index
CR, Consistency ratio
D/d ratio, Ratio between shoulder diameter to pin diameter
DOE, Design of experiments
FDD, Full factorial design
FSW, Friction stir welding
GRA, Gray relation analysis
LP, Number of levels and parameters
NOP, No of passes
Pd, Pin diameter
PD, Plunge depth
PL, Pin length
PP, Pin profile
RI, Random Index
RS, Rotational speed/ rpm
SC, Shoulder concavity
SC, Shoulder cavity
SD, Shoulder diameter
TA, Tilt angle
TO, Tool offset
TS, Traverse speed
UTS, Ultimate tensile strength
References
[1] Mishra RS, Ma ZY. Friction stir welding and processing. Mat Sci Eng, 2005; 50: 1-78. DOI: 10.1016/j.mser.2005.07.001
[2] Abd Elnabi MM, Osman TAE, El Mokadem AE et al. Modeling and optimization of friction stir welding parameters for joining dissimilar aluminum alloys. Adv J Grad Res, 2018; 4: 1-14. DOI: 10.21467/ajgr.4.1.1-14
[3] Abd Elnabi MM, Osman TA, El Mokadem A et al. Mechanical properties and macrostructure of dissimilar friction stir welding of aluminum alloys. Int J Dev Res, 2017; 7: 11884-11888.
[4] Abd Elnabi MM, Abdel-Mottaleb MM, Osman TA et al. Influence of friction stir welding parameters on metallurgical and mechanical properties of dissimilar AA5454-AA7075 aluminum alloys. J Mater Res Technol, 2019; 8: 1684-1693. DOI: 10.1016/j.jmrt.2018.10.015
[5] Silva AC, Braga DF, De Figueiredo MAV et al. Ultimate tensile strength optimization of different FSW aluminium alloy joints. Int J Adv Manuf Technol, 2015; 79: 805-814. DOI: 10.1007/s00170-015-6871-2
[6] Meengam C, Sillapasa K. Evaluation of optimization parameters of semi-solid metal 6063 aluminum alloy from friction stir welding process using factorial design analysis. J Manuf Mater Proc, 2020; 4: 123. DOI: 10.3390/jmmp4040123
[7] Guo C, Liu WM, Yan YF et al. A novel method to improve the integrity of friction stir welded joints of aluminum alloy: Microstructure and mechanical properties. Mater Res Express, 2019; 6: 086575. DOI: 10.1088/2053-1591/ab1efd
[8] Venkateswara Rao R, Senthil Kumar M. Effect of pin geometry on material flow characteristics of friction stir welded dissimilar AA6061/AA2014 alloys. Aust J Mech Eng, 2020; 20: 552-566. DOI: 10.1080/14484846.2020.1723864
[9] Balamurugan S, Jayakumar K, Subbaiah K. Influence of friction stir welding parameters on dissimilar joints AA6061-T6 and AA5052-H32. Arab J Sci Eng, 2021; 46: 11985-11998. DOI: 10.1007/s13369-021-05773-7
[10] Saeidi M, Manafi B, Besharati Givi MK et al. Mathematical modeling and optimization of friction stir welding process parameters in AA5083 and AA7075 aluminum alloy joints. P I Mech Eng B-J Eng, 2015; 230: 1284-1294. DOI: 10.1177/0954405415573697
[11] Simoncini M, Costa A, Fichera S et al. Experimental analysis and optimization to maximize ultimate tensile strength and ultimate elongation of friction stir welded AA6082 aluminum alloy. Metals, 2020; 11: 69. DOI: 10.3390/met11010069
[12] Saravanakumar R, Rajasekaran T, Dhanasekaran M. Process parameter optimization in underwater friction stir welding of dissimilar aluminium alloy butt joints by design of experiment. Mater Today Proc, 2021; 19: 7006-7013. DOI: 10.1016/j.matpr.2021.05.283
[13] Shanavas S, Edwin raja dhas J. Parametric optimization of friction stir welding parameters of marine grade aluminium alloy using response surface methodology. Trans Nonferrous Met Soc China, 2017; 27: 2334-2344. DOI: 10.1016/S1003-6326(17)60259-0
[14] Ghaffarpour M, Dariani BM, Kokabi AH et al. Friction stir welding parameters optimization of heterogeneous tailored welded blank sheets of aluminium alloys 6061 and 5083 using response surface methodology. P I Mech Eng B-J En, 2012; 226: 2013-2022. DOI: 10.1177/0954405412461864
[15] Rajendran C, Srinivasan K, Balasubramanian V et al. Data set on prediction of friction stir welding parameters to achieve maximum strength of AA2014-T6 aluminium alloy joints. Data Brief, 2019; 23: 103735, DOI: 10.1016/j.dib.2019.103735
[16] Chanakyan C, Sivasankar S, Meignanamoorthy M et al. Experimental investigation on influence of process parameter on friction stir processing of AA6082 using response surface methodology. Mater Today Proc, 2020; 21: 231-236. DOI: 10.1016/j.matpr.2019.05.384
[17] Vijayan S, Raju R, Rao SK. Multiobjective optimization of friction stir welding process parameters on aluminum alloy AA 5083 using Taguchi-based grey relation analysis. Mater Manuf Process, 2010; 25: 1206-1212. DOI: 10.1080/10426910903536782
[18] Chien Ch, Lin WB, Chen T. Optimal FSW process parameters for aluminum alloys AA5083. J Chin Inst Eng, 2011; 34: 99-105. DOI: 10.1080/02533839.2011.553024
[19] Raj A, Kumar JP, Rego AM et al. Optimization of friction stir welding parameters during joining of AA3103 and AA7075 aluminium alloys using Taguchi method. Mater Today Proc, 2021; 46: 7733-7739. DOI: 10.1016/j.matpr.2021.02.246
[20] Haribalaji V, Boopathi S, Asif MM. Optimization of friction stir welding process to join dissimilar AA2014 and AA7075 aluminum alloys. Mater Today Proc, 2022; 50: 2227-2234. DOI: 10.1016/j.matpr.2021.09.499
[21] Shunmugasundaram M, Kumar AP, Sankar LP et al. Optimization of process parameters of friction stir welded dissimilar AA6063 and AA5052 aluminum alloys by Taguchi technique. Mater Today Proc, 2020; 27: 871-876. DOI: 10.1016/j.matpr.2020.01.122
[22] Umanath K, Palanikumar K, Sankaradass V et al. Optimizations of friction stir welding process parameters of AA6063 aluminium alloy by Taguchi technique. Mater Today Proc, 2021; 46: 4008-4013. DOI: 10.1016/j.matpr.2021.02.539
[23] Koilraj M, Sundareswaran V, Vijayan S et al. Friction stir welding of dissimilar aluminum alloys AA2219 to AA5083-Optimization of process parameters using Taguchi technique. Mater Design, 2012; 42: 1-7. DOI: 10.1016/j.matdes.2012.02.016
[24] Pitchipoo P, Muthiah A, Jeyakumar K et al. Friction stir welding parameter optimization using novel multi objective dragonfly algorithm. Int J Lightweight Mater Manu, 2021; 4: 460-467. DOI: 10.1016/j.ijlmm.2021.06.006
[25] Pitchipoo P, Muthiah A, Jeyakumar K et al. Friction stir welding parameter optimization using novel multi objective dragonfly algorithm. Int J Lightweight Mater Manu, 2021; 4: 460-467. DOI: 10.1016/j.ijlmm.2021.06.006
[26] Bruce AR, Kumar PP, Arul K et al. Experimental characteristics and optimization of friction stir welded AA5052-AA6061 using RSM technique. Mater Today Proc, 2022; 59: 1379-1387. DOI: 10.1016/j.matpr.2021.12.099
[27] Abolusoro OP, Akinlabi ET. Optimization of process parameters using taguchi for friction stir welding of dissimilar aluminum alloys. Adv Manu Eng, 2020; 199-211. DOI: 10.1007/978-981-15-5753-8_19
[28] Farzadi A, Bahmani M, Haghshenas DF. Optimization of operational parameters in friction stir welding of AA7075-T6 aluminum alloy using response surface method. Arab J Sci Eng, 2017; 42: 4905-4916. DOI: 10.1007/s13369-017-2741-6
[29] Tamjidy M, Baharudin B, Paslar S et al. Multi-objective optimization of friction stir welding process parameters of AA6061-T6 and AA7075-T6 using a biogeography based optimization algorithm. Materials, 2017; 10: 533. DOI: 10.3390/ma10050533
[30] Patel BC, Chovatiya AB, Godhani LN. Process parameters optimization in friction stir welding of AA2024 and AA6061 dissimilar metal using fractional factorial design. Techno-Societal, 2020; 801-807. DOI: 10.1007/978-3-030-16962-6_80
[31] Sagheer-Abbasi Y, Ikramullah-Butt S, Hussain G et al. Optimization of parameters for micro friction stir welding of aluminum 5052 using Taguchi technique. Int J Adv Manuf Technol, 2019; 102: 369-378. DOI: 10.1007/s00170-018-3138-8
[32] D'Souza AD, Rao SS, Herbert MA. Taguchi method of optimization of process variables for ultimate tensile strength of friction stir welded joint of Al-Ce-Si-Mg aluminium alloy plates. Mater Today Proc, 2021; 46: 2691-2698. DOI: 10.1016/j.matpr.2021.02.391
[33] Vijayan D, Seshagiri Rao V, Anirudh VS. Determination of optimum tensile strength of friction stir welded AA2219 aluminum alloys using taguchi's method. Adv Mater Manuf Eng, 2021; 7: 489-497. DOI: 10.1007/978-981-15-6267-9_56
[34] Kumar S, Kumar S. Multi-response optimization of process parameters for friction stir welding of joining dissimilar Al alloys by gray relation analysis and Taguchi method. J Braz Soc Mech Sci Eng, 2015; 37: 665-674. DOI: 10.1007/s40430-014-0195-2
[35] Palanivel R, Koshy Mathews P, Murugan N. Optimization of process parameters to maximize ultimate tensile strength of friction stir welded dissimilar aluminum alloys using response surface methodology. J Cent South Univ, 2015; 20: 2929-2938. DOI: 10.1007/s11771-013-1815-1
[36] Ahmadnia M, Shahraki S, Kamarposhti MA. Experimental studies on optimized mechanical properties while dissimilar joining AA6061 and AA5010 in a friction stir welding process. Int J Adv Manuf Technol, 2016; 87: 2337-2352. DOI: 10.1007/s00170-016-8636-y
[37] Sefene EM, Tsegaw AA. Temperature-based optimization of friction stir welding of AA 6061 using GRA synchronous with Taguchi method. Int J Adv Manuf Technol, 2022; 119: 1479-1490. DOI: 10.1007/s00170-021-08260-3
[38] Hasan MM, Ishak M, Rejab M. Influence of machine variables and tool profile on the tensile strength of dissimilar AA7075-AA6061 friction stir welds. Int J Adv Manuf Technol, 2017; 90: 2605-2615. DOI: 10.1007/s00170-016-9583-3
[39] Jia H, Wu K, Sun Y et al. Experimental research and process parameter optimization of high-speed friction stir welding. Int J Adv Manuf Technol, 2021; 115: 3829-3838. DOI: 10.1007/s00170-021-07369-9
[40] Mohammadi SM, Ghazanfari H, Blais C. Friction stir welding of 5052-H18 aluminum alloy: Modeling and process parameter optimization. J Materi Eng Perform, 2021; 30: 1838-1850. DOI: 10.1007/s11665-021-05499-5
[41] Sarsılmaz F, Çaydaş U. Statistical analysis on mechanical properties of friction-stir-welded AA 1050/AA 5083 couples. Int J Adv Manuf Technol, 2009; 43: 248-255. DOI: 10.1007/s00170-008-1716-x
[42] Lakshminarayanan AK, Balasubramanian V. Process parameters optimization for friction stir welding of RDE-40 aluminium alloy using Taguchi technique. T Nonferr Metal Soc, 2008; 18: 548-554. DOI: 10.1016/S1003-6326(08)60096-5
[43] Murali Krishna P, Ramanaiah N, Prasada Rao K. Optimization of process parameters for friction Stir welding of dissimilar aluminum alloys (AA2024 -T6 and AA6351-T6) by using Taguchi method. Int J Ind Eng Comp, 2013; 4: 71-80. DOI: 10.5267/j.ijiec.2012.011.002
[44] Serio LM, Palumbo D, De Filippis LAC. Ludovico effect of friction stir process parameters on the mechanical and thermal behavior of 5754-H111 aluminum plates. Mater, 2016; 9: 122. DOI: 10.3390/ma9030122
[45] Abd Elnabi MM, El Mokadem A, Osman T. Optimization of process parameters for friction stir welding of dissimilar aluminum alloys using different Taguchi arrays. Int J Adv Manuf Technol, 2022; 121: 3935-3964. DOI: 10.1007/s00170-022-09531-3
[46] Ma Z, Sun X, Ji S et al. Influences of ultrasonic on friction stir welding of Al/Ti dissimilar alloys under different welding conditions. Int J Adv Manuf Technol, 2021; 112: 2573-2582. DOI: 10.1007/s00170-020-06481-6
[47] Sahu PK, Pal S. Multi-response optimization of process parameters in friction stir welded AM20 magnesium alloy by Taguchi grey relational analysis. J Magnes Alloy, 2015; 3: 36-46. DOI: 10.1016/j.jma.2014.12.002
[48] Haribalaji V, Boopathi S, Asif MM et al. Influences of Friction stir tool parameters for joining two similar AZ61A alloy plates. Mater Today Proc, 2022; 50: 2547-2553. DOI: 10.1016/j.matpr.2021.12.074
[49] Prasath S, Vijayan S, Raja DE. Multi response optimization of friction stir welding process parameters on dissimilar magnesium alloys AZ 31 and ZM 21 using Taguchi-based grey relation analysis. La Metallurgia Italiana, 2020; 8: 18-27.
[50] Senthilraja R, Sait AN. Optimization of the parameters of friction stir welding for AZ91D magnesium alloy using the taguchi design. Mater Sci, 2015; 51:180-187. DOI: 10.1007/s11003-015-9826-8
[51] Kumar P, Thakur L, Bhadouria N. Microstructure and mechanical behaviour of friction stir processed AZ91-D magnesium alloy- optimization of process parameters by using the Taguchi method. Kovove Mater, 2019; 57: 207-217. DOI: 10.4149/km_2019_3_207
[52] Asadi P, Akbari M, Besharati Givi MK et al. Optimization of AZ91 friction stir welding parameters using Taguchi method. P I Mech Eng L-J Mat, 2016; 230: 291-302. DOI: 10.1177/1464420715570987
[53] Siddiquee A, Pandey S, Khan NZ. Friction stir welding of austenitic stainless steel: A study on microstructure and effect of parameters on tensile strength. Mater Today Proc, 2015; 2: 1388-1397. DOI: 10.1016/j.matpr.2015.07.058
[54] Pradeep A, Muthukumaran S. An analysis to optimize the process parameters of friction stir welded low alloy steel plates. Int J Eng Sci Tech, 2013; 5: 25-35. DOI: 10.4314/ijest.v5i3.3
[55] Meena K, Kumar A, Pandya SN. Optimization of friction stir processing parameters for 60/40 brass using taguchi method. Mater Today Proc, 2017; 4: 1978-1987. DOI: 10.1016/j.matpr.2017.02.044
[56] Renani HK, Mirsalehi SE. Optimization of FSW lap joining of pure copper using Taguchi method and grey relational analysis. Mater Res Express, 2019; 6: 056525. DOI: 10.1088/2053-1591/ab021d
[57] Elfar OMR, Rashad RM, Megahed H. Process parameters optimization for friction stir welding of pure aluminium to brass (CuZn30) using Taguchi technique. MATEC Web Conf, 2016; 4: 03005. DOI: 10.1051/matecconf/20164303005
[58] Sharma N, AKhan Z, Arshad N et al. Effect of process parameters on microstructure and electrical conductivity during FSW of Al-6101 and pure copper. Mater Res Express, 2018; 5: 046519. DOI: 10.1088/2053-1591/aabbe0
[59] Sahu PK, Kumari PK, Pal K et al. Hybrid fuzzy-grey-Taguchi based multi weld quality optimization of Al/Cu dissimilar friction stir welded joints. Adv Manuf, 2016; 4: 237-247. DOI: 10.1007/s40436-016-0151-8
[60] Shojaeefard MH, Khalkhali A, Akbari M et al. Application of Taguchi optimization technique in determining aluminum to brass friction stir welding parameters. Mater Design, 2013: 52: 587-592. DOI: 10.1016/j.matdes.2013.06.003
[61] Kumar N, Dhuria GK, Singh R. Evaluation of tensile strength in friction stir welded aluminum alloy 6101-T6 and commercially pure Copper joints. Mater Today Proc, 2018; 5: 19230-19236. DOI: 10.1016/j.matpr.2018.06.279
[62] Sharma N, Khan ZA, Siddiquee AN et al. Multi-response optimization of friction stir welding process parameters for dissimilar joining of Al6101 to pure copper using standard deviation based TOPSIS method. P I Mech Eng C-J Mec, 2019; 233: 6473-6482. DOI: 10.1177/0954406219858628
[63] Panaskar N, Terkar R. Research the effect of process parameters on friction stir welded AA6063-ETP copper joint using Taguchi technique. La Metallurgia Italiana, 2019; 8: 884-888. DOI: 10.35940/ijrte.B1145.0982S1119
[64] Sharma N, Goel P, Wahid MA. Optimization of FSW process parameters during joining of Al to Cu using Taguchi-based GA. Adv Ind Prod Eng, 2019; 833-842. DOI: 10.1007/978-981-13-6412-9_77
[65] Khalilpourazary S, Abdi Behnagh R, Mahdavinejad R et al. Dissimilar friction stir lap welding of Al-Mg to CuZn34: Application of grey relational analysis for optimizing process parameters. J Comput Appl Res Mech Eng, 2014; 4: 81-88. DOI: 10.22061/jcarme.2014.74
[66] Sameer MD, Birru AK. Optimization and characterization of dissimilar friction stir welded DP600 dual phase steel and AA6082-T6 aluminium alloy sheets using TOPSIS and grey relational analysis. Mater Res Express, 2019; 6: 056542. DOI: 10.1088/2053-1591/aafba4
[67] Chen T, Lin WB. A study on dissimilar FSW process parameters in aluminum alloy and low carbon steel. Int Conf Smart Manuf Appl, 2008; 10028931: 9-14. DOI: 10.1109/ICSMA.2008.4505603
[68] Chen T. Process parameters study on FSW joint of dissimilar metals for aluminum-steel. J Mater Sci, 2009; 44: 2573-2580. DOI: 10.1007/s10853-009-3336-8
[69] Goel P, Saxena AK, Wahid MA et al. Influence of friction stir welding parameters on mechanical properties of dissimilar AA 7475 to AISI 304. Mat Sci Eng, 2020; 802: 012010. DOI: 10.1088/1757-899X/802/1/012010
[70] Darzi Naghibi H, Shakeri M, Hosseinzadeh M. Neural network and genetic algorithm based modeling and optimization of tensile properties in FSW of AA 5052 to AISI 304 dissimilar joints. Trans Indian Inst Met, 2016; 69: 891-900. DOI: 10.1007/s12666-015-0572-2
[71] Mohamed M. Abd Elnabi, Osman TA et al. Evaluation of the formation of intermetallic compounds at the intermixing lines and in the nugget of dissimilar steel/aluminum friction stir welds. J Mater Res Technol, 2022; 9: 10209-10222. DOI: 10.1016/j.jmrt.2020.07.027
[72] Abd Elnabi MM, Osman TAE, El Mokadem AE et al. Mechanical properties and microstructure of dissimilar friction stir welding of pure aluminum to low carbon steel. Adv J Grad Res, 2018; 4:47-58. DOI: 10.21467/ajgr.4.1.47-58
[73] Vasantha Kumar KP, Balasubramanian M. Analyzing the effect of FSW process parameter on mechanical properties for a dissimilar aluminium AA6061 and magnesium AZ31B Alloy. Mater Today Proc, 2020; 22: 2883-2889. DOI: 10.1016/j.matpr.2020.03.421
[74] Jafari M, Abbasi M, Poursina D et al. Microstructures and mechanical properties of friction stir welded dissimilar steel-copper joints. J Mech Sci Technol, 2017; 31: 1135-1142. DOI: 10.1007/s12206-016-1217-z
[75] Shanavas S, Dhas JER. Quality prediction of friction stir weld joints on AA 5052 H32 aluminium alloy using fuzzy logic technique. Mater Today Proc, 2018; 5: 12124-12132. DOI: 10.1016/j.matpr.2018.02.190
[76] Kamal Babu K, Panneerselvam K, Sathiya P et al. Parameter optimization of friction stir welding of cryorolled AA2219 alloy using artificial neural network modeling with genetic algorithm. Int J Adv Manuf Technol, 2018; 94: 3117-3129. DOI: 10.1007/s00170-017-0897-6
[77] Thakkar JJ. Analytic hierarchy process (AHP). Stud Syst Decis Contr, 2021; 336: 33-62. DOI: 10.1007/978-981-33-4745-8_3
Copyright ©2022 The Author(s). This open-access article is licensed under a Creative Commons Attribution 4.0 International License (https://creativecommons.org/licenses/by/4.0), which permits unrestricted use, sharing, adaptation, distribution, and reproduction in any medium, provided the original work is properly cited.


