Building a Better Roadmap toward a Green Economy through Advanced Rooftop Solar Mapping and Enhanced Energy Yield
Arindam Dutta1*, Akash Samanta1, Zuber Farooqui2, Jhumoor Biswas1
1Department of Energy Management, Indian Institute of Social Welfare and Business Management, Kolkata, India
2Department of Environmental Engineering, Texas A&M University-Kingsville, Kingsville, Texas, USA
*Correspondence to: Arindam Dutta, PhD, Professor, Department of Energy Management, Indian Institute of Social Welfare and Business Management, Madan Mohan Sen St, Kolkata, West Bengal, 700073, India; E-mail: arindamd@iiswbm.edu
Abstract
Objective: This study aims to develop a transparent roadmap for the implementation of rooftop solar (RTS) systems to boost solar energy adoption, addressing the lack of a definitive solar roadmap. The objective is to utilize Helioscope solar software to envision the maximum shadow-free area over building rooftops and simulate energy generation potential using fixed tilt-based and monthly optimum tilt-angle control-based solar photovoltaics systems.
Methods: The research employs HelioScope software to estimate shadow-free rooftop areas of government buildings in an Indian state, considering both fixed-tilt and optimum tilt angle control-based solar tracking systems. The study validates monthly optimum tilt angles for different districts and presents an experimental setup with a 2kWp RTS system.
Results: The district-wise analysis reveals the useful rooftop area and energy generation potential, indicating an increase in annual solar energy yield with the implementation of an optimum tilt angle control-based tracking system. The results suggest that chronological implementation based on available rooftop area can aid in achieving the mandated RTS target.
Conclusion: The proposed methodology provides a guideline for developing a transparent RTS installation roadmap. The study highlights the potential of an 8% increase in annual solar energy yield by incorporating monthly optimum tilt angle control. The district-wise spatial differences in solar energy production serve as a prototype for other states and countries, facilitating effective solar mapping and policy planning for RTS installations.
Keywords: solar policy, manual tracking, optimum tilt angle, HelioScope, solar energy yield
1 INTRODUCTION
The relationship between energy consumption, urbanization, and economic growth, as indicated by a country’s gross domestic product (GDP), displays a causal link[1,2]. The adoption of renewable energies leads to a reduction in carbon dioxide emissions resulting from energy production, which is a significant contributor to greenhouse gases[3]. The widespread implementation and efficient utilization of renewable energy also limit global surface temperature below 2℃ above pre-industrial levels following the Paris agreement on climate change[4]. Techno-economically feasible renewable energy solutions are the need of the hour to achieve the aforementioned target. Furthermore, it should be ensured that more than 80% of all newly added electrical power capacity must come from renewable sources, especially solar and wind[4]. Historically, a consistent growth in energy demand is observed, particularly in developing countries like India, due to the rapid population growth, urbanization, and economic growth[5,6]. Here, the rising energy demand could be met economically and sustainably with the extensive application of innovative renewable technologies[7]. Taking India as an example, the electricity sector accounts for more than 70% of greenhouse gas emissions. Despite being the second most populous nation, India possesses significant potential to generate a substantial amount of power, estimated at around 5,000 trillion kWh per year, owing to its vast geographic area[8]. To harness the potential, the Government of India (GoI) has set an ambitious target of installing 100GW of solar power by 2022 among which 40GW will be from the rooftop solar (RTS) system as part of the commitment to United Nations Framework Convention on Climate Change[9,10]. To expedite the matter, the GoI has increased the budget from around 82 million United States Dollar (USD) in the 12th five-year plan to 680 million USD for the program in the 13th five-year plan (2017-2022). The GoI also introduced several awareness programs, incentive schemes, and subsidies, such as ‘Achievement-Linked Incentive / Awards’ to motivate the mass community for increasing solar installation[9]. With the recent revision of the solar tariff to an affordable price of 0.027USD/kWh in December 2020[11], the solar power sector in India received a further boost and is recognised as one of the fastest-growing clean energy sectors globally. Despite the impressive overall performance, specifically, the RTS sector has made very slow progress in India with a cumulative installed capacity of 6.79GW, which is only 17% of the total target in the segment. A deep dive into the sector revealed a lack of clear roadmap, awareness, and financial constraints as some of the prominent reasons behind the underperformance of the RTS segment. In an effort to improve the progress of the RTS segment, this study attempts to create an effective guideline to comply with the GoI target set.
Conventional solar photovoltaics (SPV) modules are generally installed south-facing with a fixed tilt angle equal to the local latitude in the northern hemisphere[12]. SPV modules with sun tracking systems are highly effective to increase the energy yield from the same SPV modules[13,14]. Sensor-based automated sun-tracking devices continuously monitor the position of the sun and align the solar panels to maximize the energy generation by the panel. Despite being highly efficient in terms of energy generation, these are not suitable for small solar power plants due to the self-power consumption of the tracking system as well as the high implementation costs. On the contrary, manual solar tracking systems are highly cost-effective compared to automated tracking systems[15]. Here, Dutta et al.[16] proposed optimal monthly tilt angles for SPV modules as a mean to enhance solar irradiance on the panels, striking a balance between implementation costs and energy yield in comparison to fixed tilt and automated solar tracking systems. Therefore, the present study aims to demonstratethe effectiveness of optimum tilt angle-based solar tracking systems on annual energy yield and their role in escalating the RTS implementation rate to achieve the mandated implementation target. A case study, supported by experimental results, is presented to to provide a clear justification of the proposed concept. Among states of India, West Bengal has only achieved only 0.1% of its mandated target and lags behind many other states[12]. Therefore, West Bengal is considered as a case study to visualise the effectiveness of the proposed concept in developing an effective guideline and roadmap to improve RTS implementation.
The key contributions of the articles can be summarized as follows: (a) estimation of the available rooftop areas for all government buildings of West Bengal suitable for RTS installation; (b) Assessment of district-wise solar energy generation potential and (c) Computation of the increased energy yield achievable from the same set of RTS systems by incorporating a manual solar tracking system based on monthly optimum tilt angles. It is assumed that cumulative impacts of the research results will serve as a prototype for other states of India, aiding in the achievement of the ambitious target of 40GW of RTS installation of GoI. Furthermore, enhanced energy generation from the same RTS system using an optimum tilt angle control mechanism will inspire widespread adoption of solar power generation systems in the near future. The proposed strategy is simple, robust, and generalised and therefore could be used to develop similar roadmaps for other countries as well.
2 RESEARCH METHODOLOGY AND DATA COLLECTION
Primarily two broad research methodologies are considered for the present study to validate the effectiveness of the proposed concept in developing the solar implementation roadmap and to encourage the wide implementation of RTS. Firstly, the total shadow-free rooftop areas of all government buildings of the case district (West Bengal) are estimated using HelioScope[13]. Subsequently, the annual energy generation from both fixed-tilt and optimum tilt angle control-based RST is investigated using HelioScope considering actual local weather data, and a comparative study is performed on the annual energy yield between the different types of RST. Finally, energy maps are generated to visualize the available rooftop area, potential installation capacity, and the energy yield difference, thereby providing an RTS implementation roadmap and understanding the district-level impact of tilt angle optimizations.
2.1 Monthly Optimum Tilt Angles and Experimental Validation
The solar irradiance model proposed by Dutta et al.[16] is used to find the optimum monthly tilt angles for different districts of West Bengal. The model performance demonstrates that the optimal tilt is credibly simulated for different months of the year. The model correctly estimates the magnitude of solar radiation at an optimal inclination by validating with observed data. An example of the increase in solar radiation on a random date in winter and summer at a fixed tilt and optimum tilt angle for the Kolkata district of West Bengal is shown in Figure 1.
|

Figure 1. Simulated radiation at a south-facing optimum tilt angle in A winter and B summer at a random date.
Now, to assess the effectiveness of the proposed monthly optimum tilt angles, the existing RTS systems with a capacity of 2kWp at the research center is utilized. The RTS system consists of eight 250Wp SPV panels equipped with a manual tracking system. Among these eight SPV modules, four modules are kept fixed at a latitude of 22.57°N (corresponding to the latitude of Kolkata) throughout the year, while the optimum tilt angles of the remaining four modules are changed following the monthly optimum tilt angles. The energy generation data from the two sets of modules are recorded separately for comparative analysis. The schematic layout of the experimental RTS system is presented in Figure 2. The actual data logger and controller installed in the research centre is shown in Figure 3.
|

Figure 2. The schematic layout of the experimental RTS system.
|
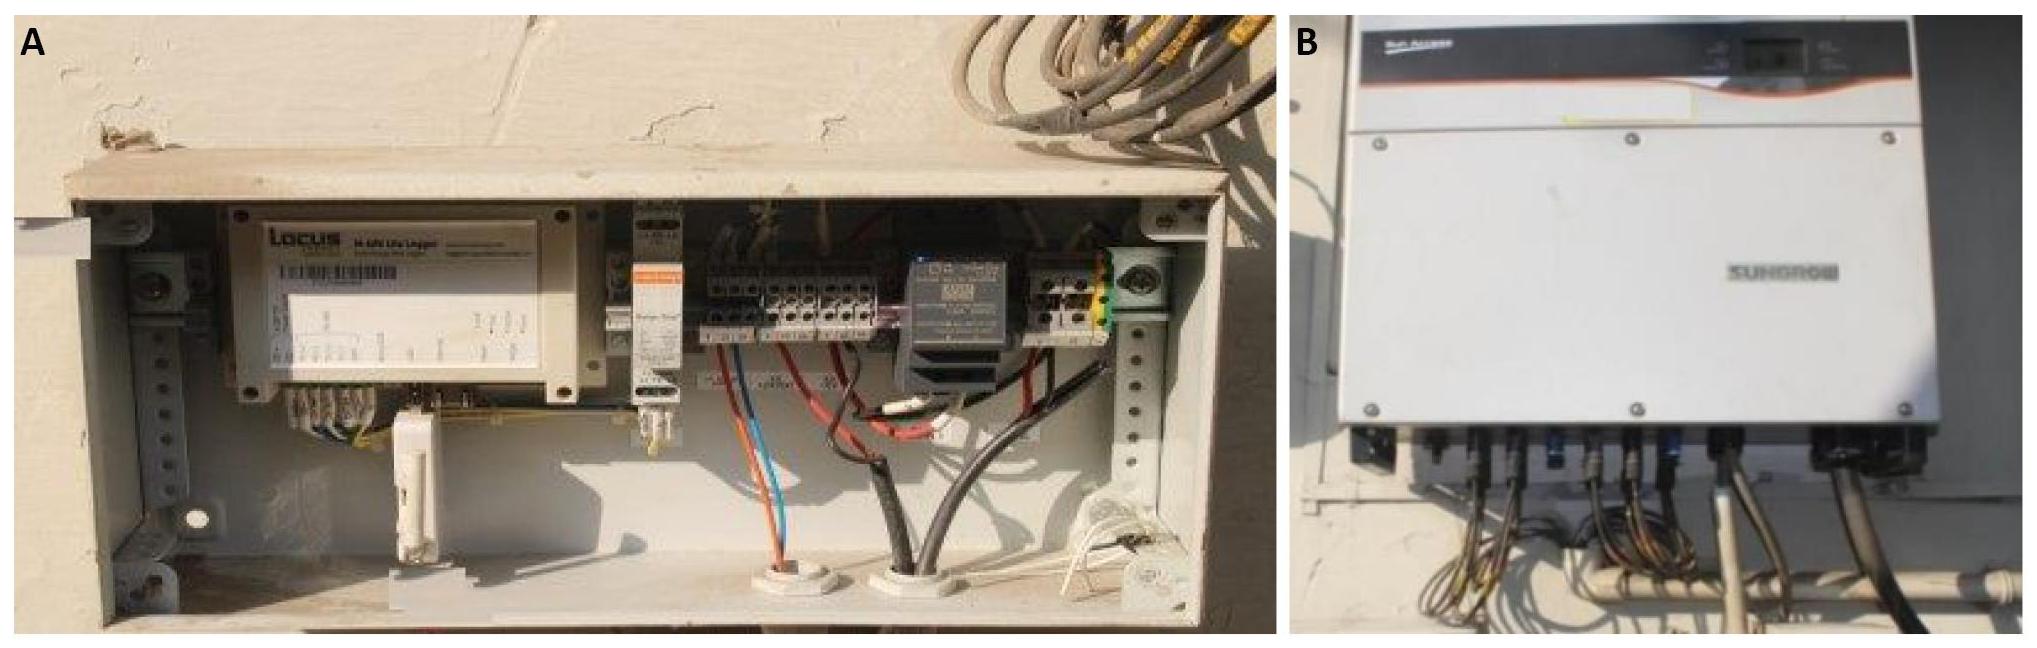
Figure 3. Photo of (A) data logger and (B) controller installed at research center.
2.3 HelioScope Software
HelioScope[17,18] is a web-based solar design software employed for designing solar power plants and estimating energy generation before actually commissioning the solar plant. In this way, it can be used to 1minimize the design cost and risk of development. Almost all types of solar panels are available within the software tool that can be used for RTS plant design and to calculate solar energy generation. It incorporates user-friendly features such as integration with Google Maps for obtaining rooftop characteristics, including the available shadow-free area of a building, local latitude, and available sun hours in a year. It can consider the effect of shadows on the panel and can compute solar radiation based on automatic calculation of tilt based on the fixed latitude and orientation of the solar panel, or optimal tilts of the solar panel can also be incorporated into the system.
The HelioScope software incorporates various factors such as weather conditions, shading parameters, and roof slope and aspect ratio to calculate the available area for installing RTS photovoltaic cells. HelioScope can also incorporate computer-aided design structures of buildings, although in this study Google Maps has been used. HelioScope considers meteorological parameters like ambient temperature and relative humidity, although these factors exhibit minimal fluctuations in the region under study. The user-friendly nature of HelioScope is attributed to its predefined wizard-based interface, facilitating seamless design and development processes. For accurate shadow effect calculations, modelling the shadow objects are required. Once the model is simulated the projected shadow object geometry (polylines) can easily distinguish the shadow-free area available for SPV installation, which is one of the main objectives to choose HelioScope software for our research. The project profile consisting of building-specific information, including the mechanical, electrical, and condition set profile is designed for each considered building and finally inserted into the profile selection window of the HelioScope. The detailed project profile is shown in Figure 4.
|
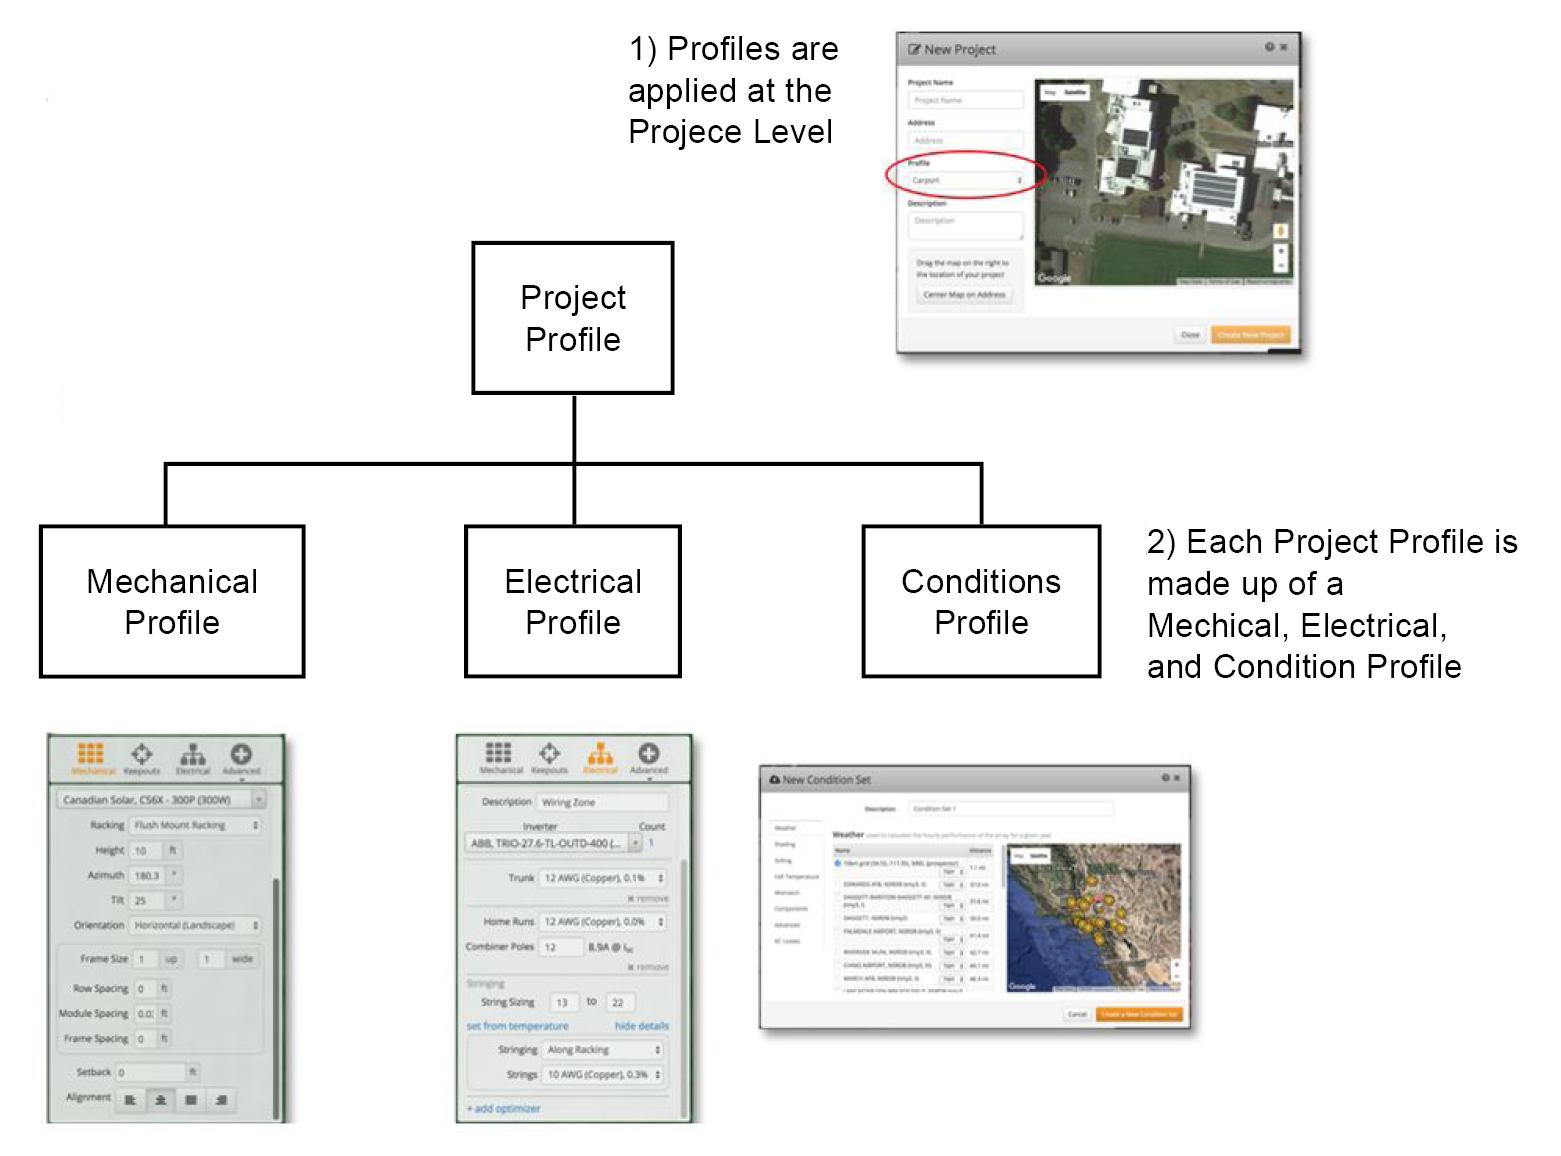
Figure 4. Detailed project profile in the HelioScope.
Based on the parameters of the project profile, default values for new designs and condition sets in the project are automatically populated. The software requires the building name and address, latitude, and longitude of the area where the building is located to interface with the satellite data and select a designated building. HelioScope generates summary reports consisting of hourly, monthly, and annual energy generation values alongside a detailed mechanical layout and module orientation from which the configurations of the solar panels are calculated. Several methods exist to define the spacing between modules for fixed-tilt and optimal tilt systems. Frames, which are groups of modules laid out together, enable the creation of objects such as multi-tiered ground mounts or regular rooftop mounts.
2.4 Modelling and Simulation of Fixed tilt and Optimum tilt RTS System
Two simulation models are developed for the study. One model consists of the fixed tilt-based SPV system and another model consists of an optimum tilt angle control-based solar tracking system based on the monthly optimum tilt angles. Fixed tilted modules are tilted up along a flat plane, whereas the optimum angle-based manual tracking system is installed on flush mount racking, which allows for the adjustment of monthly tilt angles. An example of the virtual installation of the RTS system in HelioScope is shown in Figure 5.
|
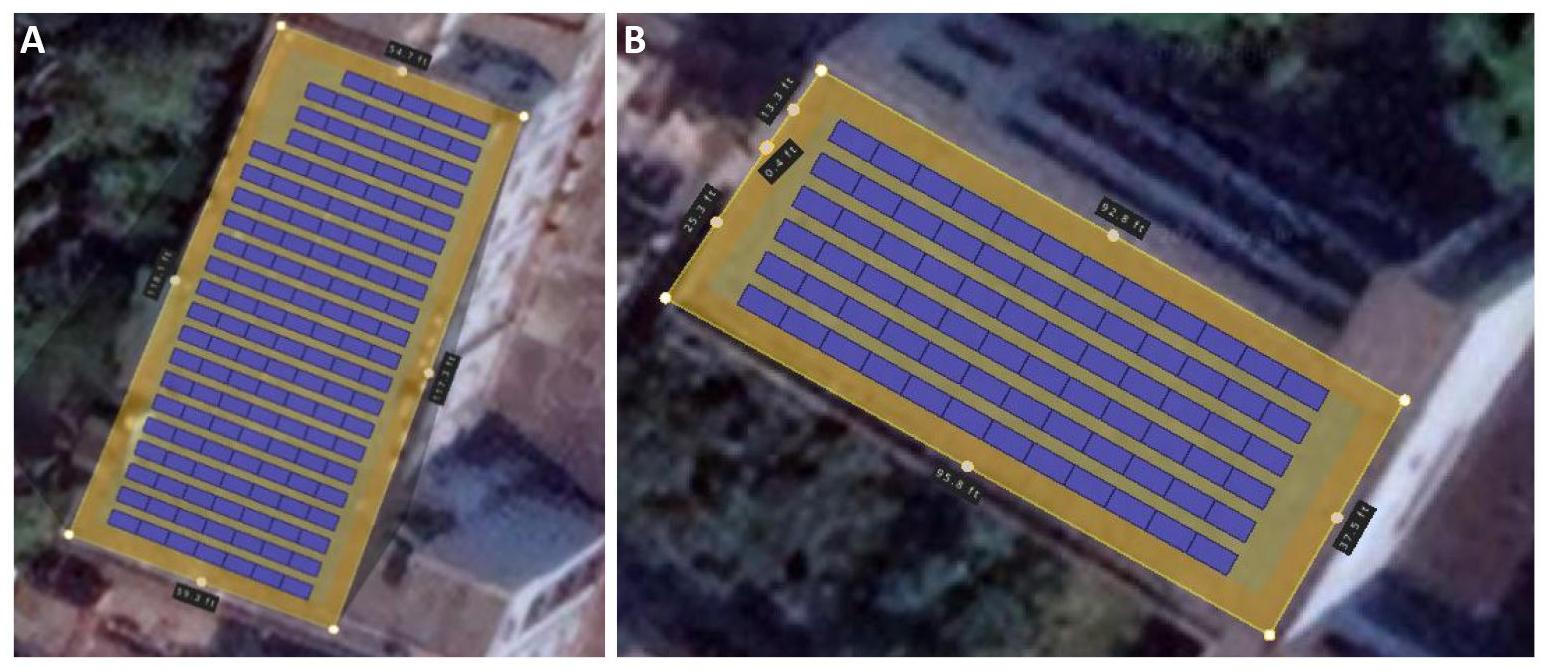
Figure 5. Virtual RTS implementation using HelioScope.
2.5 Calculation Methodology
To ensure realistic simulations, practical constraints and environmental influences must be taken into account during the modeling process. Therefore, the capacity of the nameplate, that is, the maximum power generation capacity of a solar panel, cannot be directly considered for the calculation of the energy generation. The influence of several parameters such as temperature, shading, module mismatch, line loss, and inversion efficiency must also be considered. The HelioScope software, with its integrated photovoltaic system capabilities, enables the simulation of system-level constraints and environmental impacts by utilizing two interdependent environments: The system model and the environment model. This software facilitates the design of individual solar panels, solar plant models, and module mounting structures within the system model environment.
The environment model provides all the assumptions for the system model and is mainly based on the geographical location of the installation. In this study the energy generation is computed for the two types of SPV plants, that is, one with a fixed tilt at latitude angle and another one with an optimal tilt angle control mechanism. To calculate the irradiance available for modules in the system requires calculating the position of the sun for each data point in the meteorological data, and then using a conversion interface to transform solar parameters (global horizontal irradiance and diffuse horizontal irradiance), the solar position (solar azimuth and elevation) and the collector angles (collector azimuth and tilt) into required direct, diffuse, and reflected solar irradiation. The other important parameters are solar azimuth angle (φs), solar altitude angle (βs), solar zenith angle (90° - βs), collector azimuth angle (φc), and solar incidence angle (Ʃc). The irradiance Ic reaching the surface of any of these types of collectors at any given time can be estimated from the following relationship.
|
Where Ib is incident direct beam radiation, Id is the diffuse sky radiation and Ir is the radiation reflected from the earth’s surface in front of the collector, θ is the incident angle of the sun’s rays to the collector and is the collector tilt.
|
Total irradiance on a tilted plane in HelioScope is calculated for a tilted solar collector using the HDKR model[19] and the fixed tilt is equal to the latitude, and optimum tilts are based on it[16]. HelioScope software is then used to find the energy yield district-wise of government building rooftops in West Bengal, India. The National Solar Radiation Database is considered here on an hourly basis for a typical meteorological year (8,760h). These data points, in conjunction with the detailed location and orientation of the solar modules, allow an accurate estimation of the raw solar capacity. On the other hand, the system model computes electrical relationships and the energy generation from the SPV system for a specified time frame under a prescribed set of assumptions like shading parameters, roof slope, and aspect ratio. In this study, in addition to the actual hourly weather data, all other prescribed parameters including shading, roof slope, and mechanical and electrical load of the building are considered in HelioScope as depicted in Figure 3. The background calculus[20] of HelioScope for estimating electrical energy generation from SPV is mentioned in Equation 3.
|
Where YPV, fPV, GT,stc, αp, TC and TC,stc are respectively the rated capacity of the PV array, meaning its power output under standard test conditions, the PV derating factor (it is used to account for factors such as shading, snow cover, aging, and so forth), the incident radiation under standard test conditions, the temperature coefficient of power (which indicates how strongly the power output of the PV array depends on the cell temperature), the PV cell temperature in the current time step, and finally the PV cell temperature under standard test conditions, i.e., 25℃. Finally, HelioScope software is then used to find the yearly generation of solar energy from government building roofs for all districts in both fixed-tilt and optimum monthly tilt angles for all the districts of West Bengal, India.
3 RESULTS AND DISCUSSION
West Bengal, a vast state comprising 23 districts, offers numerous government buildings suitable for the installation of RTS systems. HelioScope is used to calculate the total shadow-free rooftop area in all government buildings in each district of West Bengal and the annual generation of electrical energy is estimated through the virtual installation of RTS. The primary objective is to demonstrate the effectiveness of the proposed concept and to provide a guide to create an impactful roadmap for fulfilling the RTS target of India. The estimated results are presented in Table 1.
Table 1. District-wise Useful Rooftop Area and Energy Generation Potential Derived from HelioScope
District |
Latitude |
Useful Rooftop Area (sq. ft) |
Fixed Tilt (MWh)/year |
Optimum Tilt (MWh)/year |
East Midnapore |
22.19° |
42,014 |
5,152 |
5,513 |
West Midnapore |
22.41° |
94,314 |
11,566 |
12,410 |
Jhargram |
22.46° |
33,869 |
4,153 |
4,461 |
South 24 Parganas |
22.53° |
38,339 |
4,702 |
5,050 |
Kolkata |
22.57° |
208,473 |
26,147 |
28,107 |
Howrah |
22.59° |
49,816 |
6,248 |
6,723 |
North 24 Parganas |
22.62° |
75,942 |
9,525 |
10,248 |
Hooghly |
22.89° |
57,829 |
7,253 |
7,826 |
Bankura |
23.23° |
47,440 |
6,082 |
6,563 |
Bardhaman |
23.23° |
65,109 |
8,347 |
9,015 |
Purulia |
23.33° |
36,925 |
4,734 |
5,113 |
Nadia |
23.47° |
51,104 |
6,595 |
7,130 |
Birbhum |
23.84° |
52,239 |
6,742 |
7,295 |
Murshidabad |
24.17° |
46,778 |
5,997 |
6,495 |
Malda |
25.01° |
48,057 |
6,295 |
6,824 |
West Dinajpur |
25.37° |
63,929 |
8,374 |
9,086 |
East Dinajpur |
25.98° |
57,148 |
7,486 |
8,137 |
Coochbehar |
26.35° |
44,670 |
5,851 |
6,360 |
Alipurduar |
26.49° |
54,166 |
7,048 |
7,668 |
Jalpaiguri |
26.52° |
39,805 |
5,179 |
5,646 |
Darjeeling |
27.04° |
53,912 |
6,756 |
7,378 |
Kalimpong |
27.06° |
18,623 |
2,334 |
2,548 |
|
Total |
1,280,501 |
175,596 |
The fixed tilt angles are set in HelioScope according to the latitudes as given in Table 1. The latitudes of all the districts of West Bengal range from 22.19° to 27.06°. It is seen from Table 1 that the energy from fixed tilt angles is directly proportional to the rooftop areas. The intensity of solar radiation is influenced by atmospheric composition and the distance through the atmosphere travelled by the sun’s rays[21], resulting in slight variations with latitude changes. It was observed that compared to global horizontal irradiation, irradiation at optimum fixed tilt increases with increasing latitude, but here the extent of rooftop areas had a greater impact on the estimated radiation, as can be seen in Table 1. The mapping of useful rooftop areas in various government buildings of all districts of West Bengal calculated by HelioScope is shown in Figure 6A. Notably, West Bengal’s government-owned buildings offer a total available useful rooftop area of 1,280,501square feet, with a RTS installation potential of approximately 12.35MW. The state has the potential to produce a total annual RTS energy capacity of 162,566MWh with fixed tilt systems. It is worth mentioning that by implementing an optimum tilt angle control-based manual tracking system, the annual production capacity increases to 175,596MWh compared to fixed tilt panels. Therefore, it can be inferred that the optimum tilt-based tracking enables more than an 8% increase in annual solar energy yield compared to the fixed tilt. The spatial distribution of annual solar energy production in West Bengal is shown in Figure 6B. It is also observed that, compared to global horizontal irradiation, irradiation at optimum fixed tilt rises with increasing latitude, but here the extent of rooftop areas had more significant impact on the estimated radiation, as indicated in Table 1. It should be noted that the extra shading area for optimum tilt has also been considered during modelling in HelioScope.
Upon closer examination of the prediction results, it is evident that the megacity of Kolkata has substantial rooftop areas of approximately 208,473sq. ft when considering the combined rooftop areas of all government buildings. The potential rooftop areas of Kolkata are far exceeding the corresponding rooftop areas of other districts followed by West Midnapore (useful total rooftop area 94,314sq. ft, around 54%), Other districts with notable rooftop potential include Hooghly, North 24 Parganas, and Bardhaman. Consequently, the annual RTS energy yields exhibit significant variation, with Kolkata generating the highest energy production in fixed tilt systems, approximately 26,147MWh, followed by West Midnapore with around 11,566MWh. In conclusion, it can be inferred that the mandated RTS target could be smoothly achieved by implementing the RTS system chronologically based on the available rooftop area. Energy generated from RTS panels in all types of residential and commercial in densely populated regions of West Bengal can play a significant role in the reduction of carbon footprints in these urbanised regions.
|
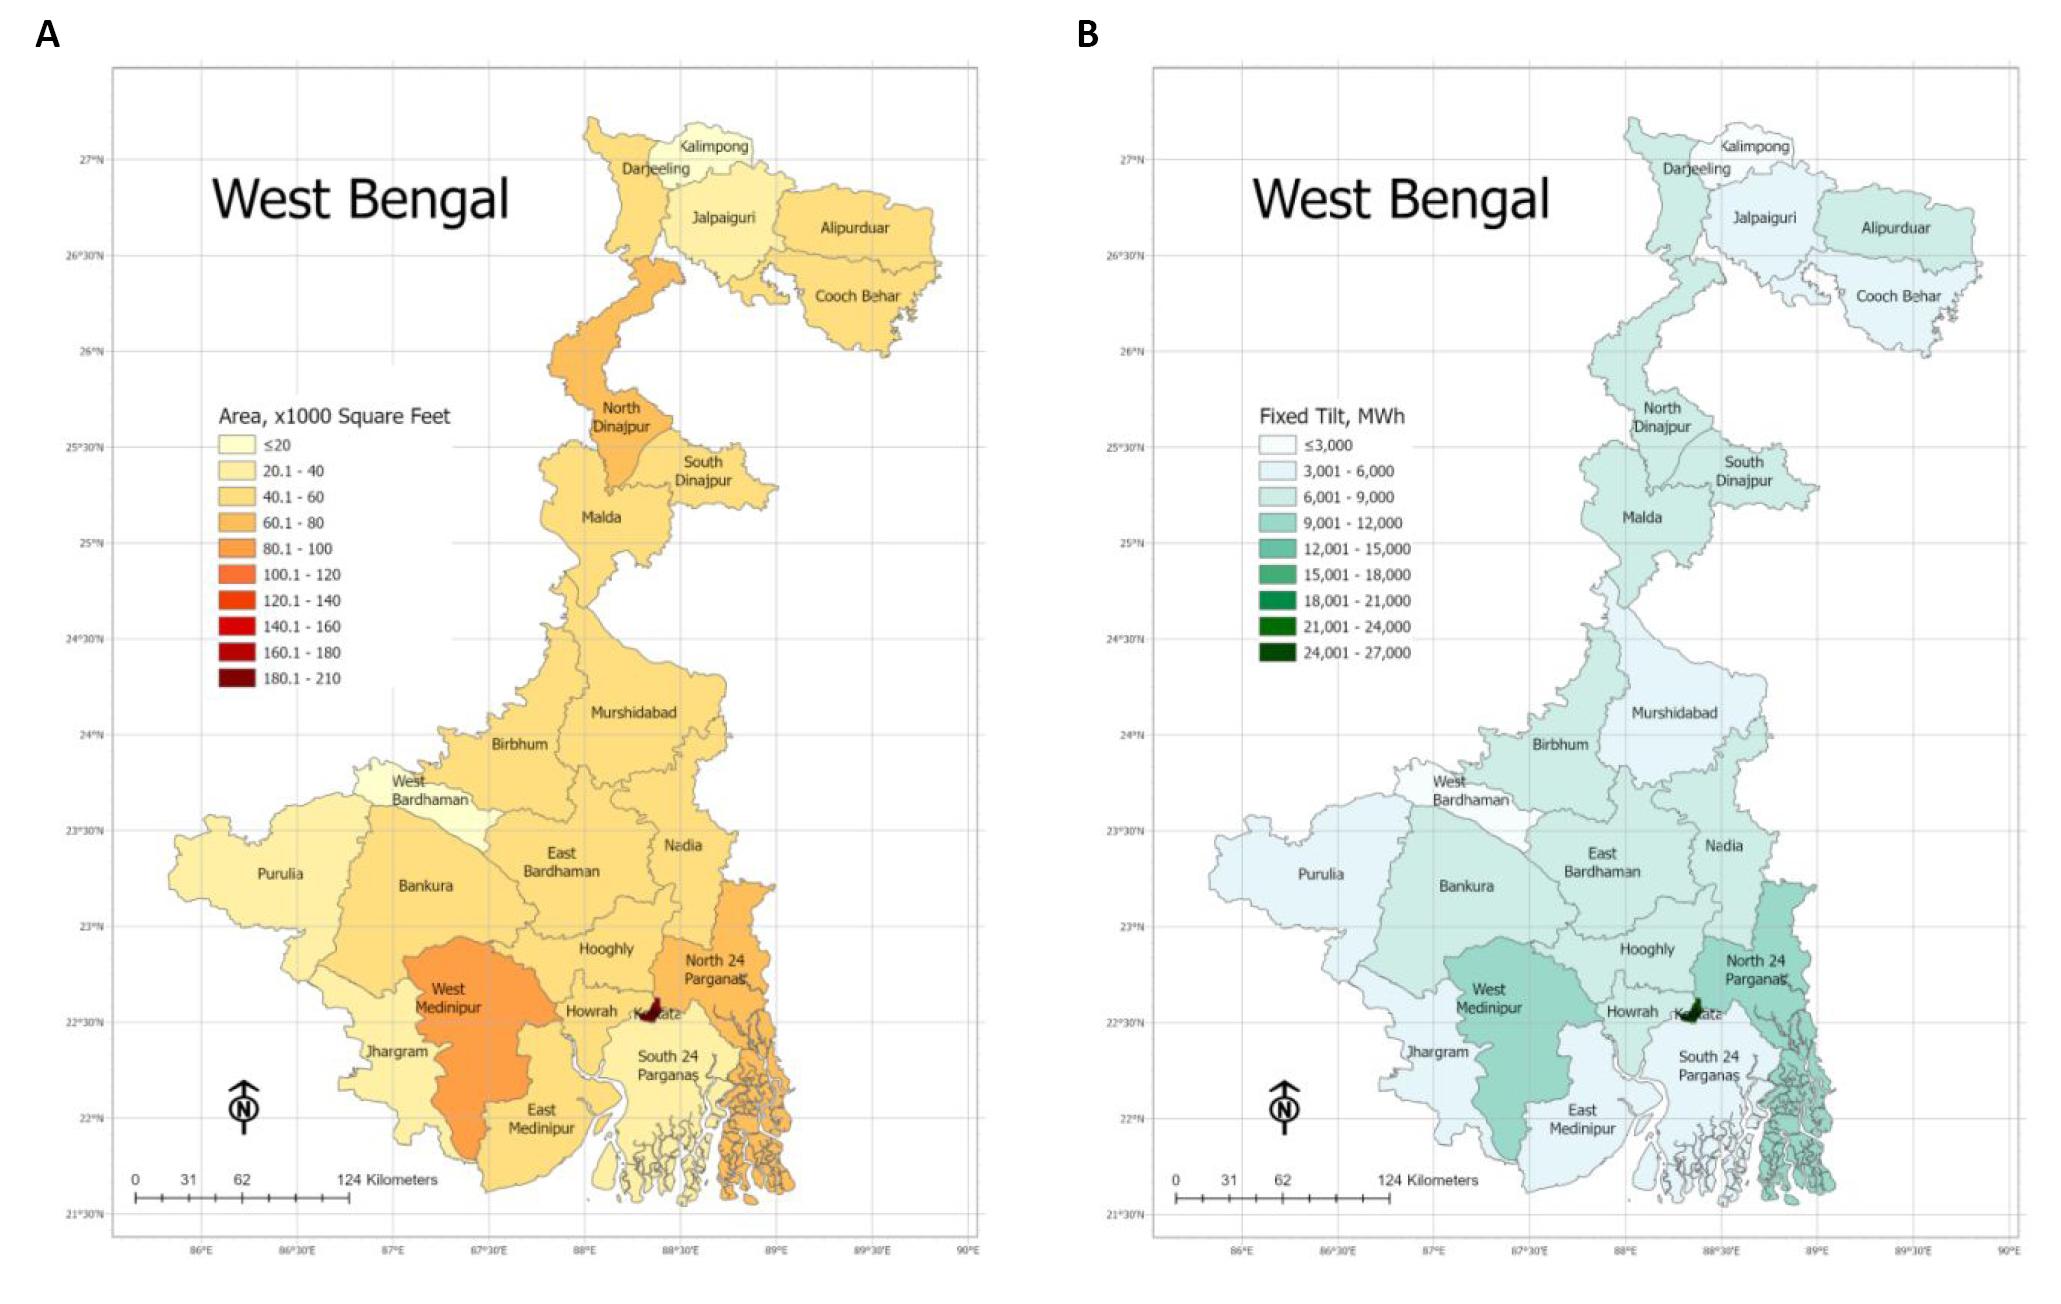
Figure 6. Rooftop areas of government buildings and spatial distribution of annual solar energy production in West Bengal. A: Rooftop areas of government buildings; B: Spatial distribution of annual solar energy production.
The district-wise spatial differences in annual energy solar production from RTS system with and without optimum tilt angle-based control, as simulated using HelioScope, as illustrated in Figure 7. The average annual increase in solar energy production is around 8% with Kolkata showing the highest annual increase of nearly 1,960MWH followed by West Midnapore, Hooghly, Bardhaman, and Bankura ranging between 844MWh, to 481MWh as can be seen from Table 1 and Figure 6. The other districts exhibit slightly lower yearly generation ranging from 214MWh to around 410MWh annually. A similar study can be conducted for other states of India to calculate the potential rooftop areas for RTS installation. This will enable the development of a roadmap toward the formulation of a cost-effective policy plan for RTS installation. The proposed methodology and the study will not only provide insights into the potential energy yields of RTS in different districts but will also help determine the order of implementation. A similar methodology can be extended to prepare effective solar mapping for other countries worldwide.
|
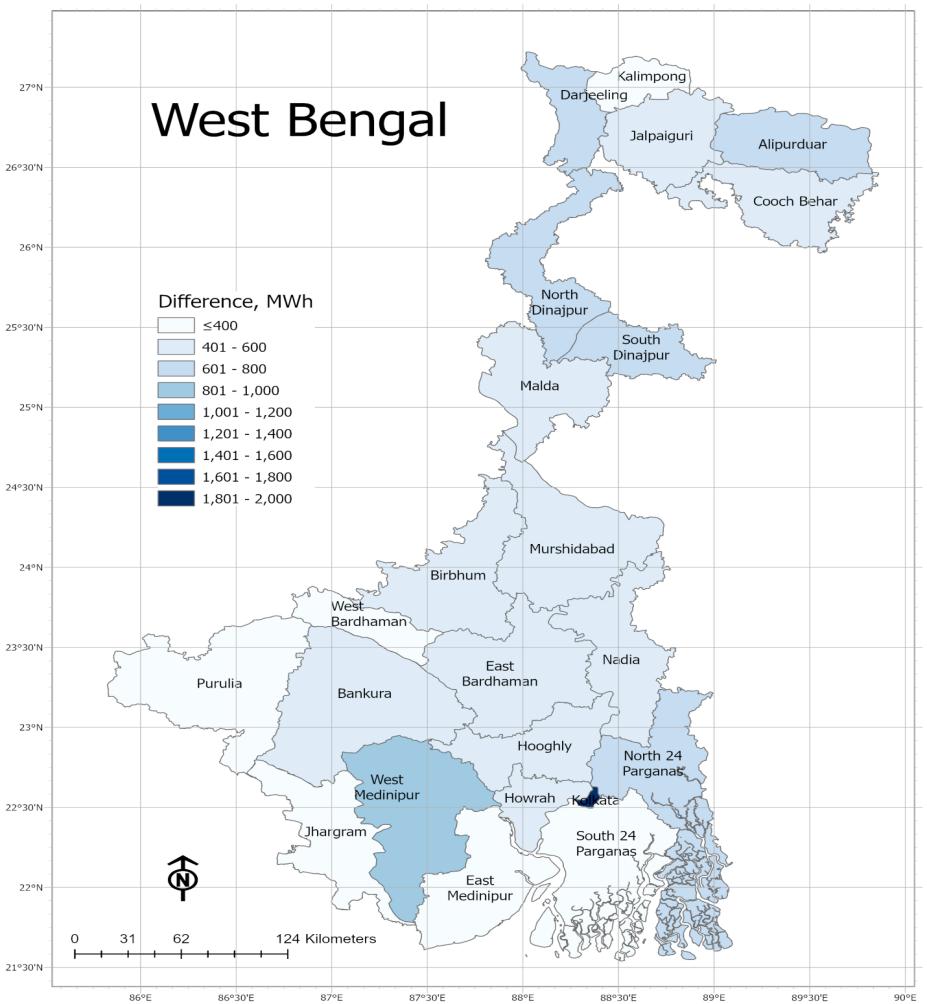
Figure 7. The difference in the spatial distribution of the total increase in annual energy yield (in MWh) of West Bengal between fixed tilt and optimum tilt.
4 CONCLUSION
The RTS system is a potential solution to address the challenge of limited installation areas; however, due to the absence of a transparent solar roadmap and very low energy yield, most countries lag behind their implementation target. Therefore, this paper proposed a method to develop an RTS system implementation roadmap and the possible increase in solar energy yield from the same RTS system by implementing an optimum tilt angle control-based manual tracking system. The effectiveness of the proposed method is demonstrated using a case study of a state in India, specifically considering the available rooftop area of government buildings and the district-wise solar energy generation potential, analyzed using the HelioScope software tool. Initially, an experimental setup of a 2kWp RTS system is used to validate the optimum tilt angles calculated for the location of the case. Subsequently, HelioScope is used to virtually implement the RTS system and estimate the annual solar energy generation from the rooftops of government buildings across all 23 districts of West Bengal, which has achieved only 0.1% of its mandated RTS target set by GoI.
An analysis of the distribution of useful rooftop areas of various government buildings in West Bengal suggests that implementing installations chronologically, starting with buildings having the highest rooftop areas, can greatly facilitate the achievement of India’s RTS target. The proposed RTS mapping technique can contribute to improved implementation planning. Furthermore, it is observed that the incorporation of an optimum tilt angle control-based manual tracking system can result in an annual energy production increase of approximately 8%. Although this study focuses exclusively on West Bengal, India, the strategies and methods proposed are not limited to this case and can be applied to assess RTS installation potential and the potential annual increase in energy generation in other regions worldwide. The prospect of enhanced energy yield through the adoption of a monthly optimum tilt angle control-based manual tracking system will further encourage the implementation of RTS systems.
Acknowledgements
Not applicable.
Conflicts of Interest
The authors declared no conflict of interest.
Author Contribution
Dutta A was involved in concept generation, data analysis, and draft review. Samanta A focused on mathematical analysis and contributed to the initial draft. Farooqui Z and Biswas J specialized in solar radiation modeling and data generation. All authors reviewed and approved the final version of the manuscript.
Abbreviation List
GoI, Government of India
RTS, Rooftop solar
SPV, Solar Photovoltaics
USD, United States Dollar
References
[1] Bakirtas T, Akpolat AG. The relationship between energy consumption, urbanization, and economic growth in new emerging-market countries. Energy, 2018; 147: 110-121.[DOI]
[2] Liu WC. The relationship between primary energy consumption and real gross domestic product: Evidence from major Asian countries. Sustainability, 2020; 12: 2568.[DOI]
[3] Pachauri RK, Meyer L. IPCC, 2014: Climate Change 2014: Synthesis Report. Contribution of Working Groups I, II and III to the Fifth Assessment Report of the Intergovernmental Panel on Climate Change. IPCC, Geneva, Switzerland, 2014. Available at:[Web]
[4] Gielen D, Boshell F, Saygin D et al. The role of renewable energy in the global energy transformation. Energy Strateg Rev, 2019; 24: 38-50.[DOI]
[5] Fronk BM, Neal R, Garimella S. Evolution of the transition to a world driven by renewable energy. J Energy Resour Technol, 2010; 132: 021009.[DOI]
[6] Wong KV, Bachelier B. Carbon nanotubes used for renewable energy applications and environmental protection/remediation: a review. J Energy Resour Technol, 2014; 136: 021601.[DOI]
[7] Jackson RS, Amano R. Experimental study and simulation of a small-scale horizontal-Axis wind turbine. J Energy Resour Technol, 2017; 139: 051207.[DOI]
[8] Ummadisingu A, Soni MS. Concentrating solar power-technology, potential and policy in India. Renew Sust Energ Rev, 2011; 15: 5169-5175.[DOI]
[9] Achievement-Linked Incentives and Awards Program Approved for Grid Connected Rooftop Solar. Accessed 23 September 2021. Available at:[Web]
[10] Dutta A, Neogi S. Reassessment of the Indian renewable energy policy through technology implementation, in International Conference on 2016 21st Century Energy Needs-Materials, Systems and Applications (ICTFCEN). IEEE, Kharagpur, India, 2016: 1-4.[DOI]
[11] MNRE, Annual Report(2020-2021). Available at:[Web]
[12] Benghanem M. Optimization of tilt angle for solar panel: Case study for Madinah, Saudi Arabia. Appl Energ, 2011; 88: 1427-1433.[DOI]
[13] Samanta A, Dutta A, Neogi S. A simple and efficient sun tracking mechanism using programmable logic controller. Appl Sol Energy, 2012; 48: 218-227.[DOI]
[14] Chang TP. Output energy of a photovoltaic module mounted on a single-axis tracking system. Appl Energ, 2009; 86: 2071-2078.[DOI]
[15] Nadia ALR, Isa NAM, Desa MKM. Efficient single and dual axis solar tracking system controllers based on adaptive neural fuzzy inference system. J King Saud Univ-Eng Sci, 2020; 32: 459-469.[DOI]
[16] Dutta A, Biswas J, Roychowdhury S et al. Optimum tilt angles for manual tracking of photovoltaic modules. Distr Gener Altern Energ J, 2016; 31: 7-35.[DOI]
[17] HelioScope advance software. Available at:[Web]
[18] Guittet DL, Freeman JM. Validation of Photovoltaic Modeling Tool HelioScope Against Measured Data. National Renewable Energy Lab, State of Colorado, USA, 2018.[DOI]
[19] Hay J E. Calculation of monthly mean solar radiation for horizontal and inclined surfaces. Sol Energy, 1979; 23: 301-307.[DOI]
[20] El Ouderni AR, Maatallah T, El Alimi S et al. Experimental assessment of the solar energy potential in the gulf of Tunis, Tunisia. Renew Sust Energ Rev, 2013; 20: 155-168.[DOI]
[21] Sarbu I, Sebarchievici C. Solar heating and cooling systems: Fundamentals, experiments and applications. Academic Press: Cambridge, USA, 2016.
Copyright © 2024 The Author(s). This open-access article is licensed under a Creative Commons Attribution 4.0 International License (https://creativecommons.org/licenses/by/4.0), which permits unrestricted use, sharing, adaptation, distribution, and reproduction in any medium, provided the original work is properly cited.


