The Potential of Multi-stage Pressure Retarded Osmosis for Blue Energy Harvesting
Waqas Akram1, Muhammad Awais1, Mostafa H Sharqawy1*
1School of Engineering, University of Guelph, Guelph, Ontario, Canada
*Correspondence to: Mostafa H Sharqawy, PhD, Associate Professor, School of Engineering, University of Guelph, Guelph, Ontario N1G 2W1, Canada; Email: melsharq@uoguelph.ca
Abstract
Objective: This study aims to investigate the potential benefits of using different multi-stage and multi-pass flow configurations for improving the efficiency of the pressure-retarded osmosis (PRO) process, which generates energy by utilizing the difference in osmotic pressure between two salinity solutions.
Methods: To achieve the objective, the study used a numerical simulation based on the solution diffusion model. A flat sheet forward osmosis membrane was simulated to investigate the potential of the proposed multi-stage PRO configurations.
Results: The results of the simulation showed that the multi-stage PRO arrangement generated 18% more power than the single-stage PRO system. Additionally, the multi-pass arrangement resulted in a 58% increase in power output.
Conclusion: This study provides important insights into the development of optimized PRO membrane and module configurations to improve the efficiency of energy generation. The findings highlight the potential benefits of multi-stage and multi-pass flow configurations, which can help to advance the field of renewable energy generation using the PRO process.
Keywords: pressure retarded osmosis, osmotic power, multi-stage, multi-pass
1 INTRODUCTION
With the growing demand for energy due to industrial and residential expansion, natural gas and coal have been the main sources for energy production, accounting for 60% of the world’s total energy production[1]. However, these sources are finite, and research has been conducted to find sustainable and renewable energy sources that do not harm the environment or human health. Solar and wind energy are currently the most common types of renewable energy sources. Still, researchers are exploring other sources, such as salinity gradient energy (SGE) generated from the chemical potential difference between saline and fresh water. SGE has a high energy potential due to the abundance of seawater and river mouths on earth and is even more reliable than other renewable energy sources. However, SGE faces challenges before commercialization and real-world applications. For example, researchers are developing techniques such as reverse electro dialysis (RED) and pressure retarded osmosis (PRO) to harvest SGE.
The PRO process is more commonly utilized compared to RED because of its similarity to conventional hydro-water energy processes[2]. This process uses a semi-permeable membrane that divides two water solutions: a high salt concentration solution known as the draw solution (DS) and a low salinity solution known as the feed solution (FS). Once the FS and DS are divided by the semi-permeable membrane, the osmotic pressure difference between the two solutions leads to the migration of water molecules in the FS stream to the pressurized DS stream[3]. As a result, the DS solution is diluted and its quantity increases, which can then be depressurized through a hydro turbine to generate net positive energy.
While the PRO method shows promise in producing renewable energy, it has encountered difficulties in industrial applications. For instance, when the first osmotic power plant was built in Norway in 2009, the energy output was much lower than expected[4]. To increase energy efficiency, some studies have suggested adding two or three membrane module stages to the PRO[5]. However, others, such as Altaee et al.[6], have argued that adding multiple stages to the PRO does not necessarily improve its performance. Traditionally, the PRO consists of a single stage where water permeates through a membrane to drive the hydro-turbine. Nevertheless, recent studies[7-10] have focused on developing new methods to enhance energy efficiency by incorporating additional stages, known as dual-stage or multi-stage PRO, into the PRO system.
Studies[7,11] found that adding a second stage of PRO can increase energy efficiency and have positive economic effects. Touati et al.[7] proposed two configurations with a second PRO stage. They found that the continuous draw and continuous feed (CDCF) configuration resulted in better energy efficiency than the conventional single-stage PRO. The divided draw and divided feed configuration showed lower efficiency. The CDCF configuration was found to be a good choice for implementation in a PRO plant, as analyzed by He et al.[10], who focused on flow configurations and power density. The dilution factor, or ratio of permeate water to DS flow rates, was found to be a factor affecting energy output in these studies[7,10].
In contrast to He et al.’s[10] simulation results, Altaee and Sharif[8] agreed that the FS for the second PRO stage should not come from the first PRO FS to obtain a higher power density. According to Altaee and Sharif[8], the chemical potential of the FS is significantly reduced when exiting the first PRO stage, which results in a decrease in energy production when it enters the second stage. Their study focused on membrane modules and configurations of multi-stage PRO using the highly concentrated salt dead sea as the DS source. Finally, they proposed six configurations, demonstrating substantial energy efficiency when a second stage of PRO is added to the system.
In summary, the studies discussed in papers[7-10] have examined various aspects of dual-stage PRO, such as the dilution factor, membrane modules, and flow rate, with the aim of creating an economically and environmentally viable method for increasing PRO’s energy output. Although an optimal configuration for PRO membranes and modules has yet to be determined, PRO has high potential as a new renewable energy source in the future. This paper aims to explore different multi-stage flow configurations of the PRO process and develop a numerical model to evaluate their performance. The objective is to identify the most effective configuration or arrangement for maximizing membrane power density.
2 METHODS
2.1 Process Description
The osmosis process involves moving water molecules from a high water chemical potential solution to a lower one through a semi-permeable membrane. This is known as forward osmosis (FO), driven by the osmotic pressure difference (Δπ) across the membrane between the two streams. In the FO process, the two streams are either not pressurized or pressurized to the same magnitude, resulting in the concentration of the low salinity stream and dilution of the high salinity stream. Conversely, in reverse osmosis (RO), the higher salinity solution is pressurized to a value greater than the osmotic pressure difference (Δp > Δπ) to force water to move from the high salinity side to the low salinity side through the membrane against the natural osmotic process. The PRO process is an intermediary between forward and RO. In this process, the high salinity DS is pressurized, similar to RO, but to a pressure lower than the osmotic pressure difference (Δp < Δπ) to let permeate move to the DS, similar to FO. The three processes are illustrated in Figure 1. The PRO process involves the flow of a low-salinity feed stream and high salinity draw stream on opposite sides of a semi-permeable membrane. However, the DS is at a higher pressure but lower than the osmotic pressure. Water moves through the membrane from the feed stream side to the draw stream side, increasing the volume flow rate of the pressurized draw stream. The draw stream then passes through a hydro turbine where energy is obtained by reducing its pressure. The osmotic pressure difference must be higher than the hydraulic pressure difference between the draw and feed streams to produce net power.
|
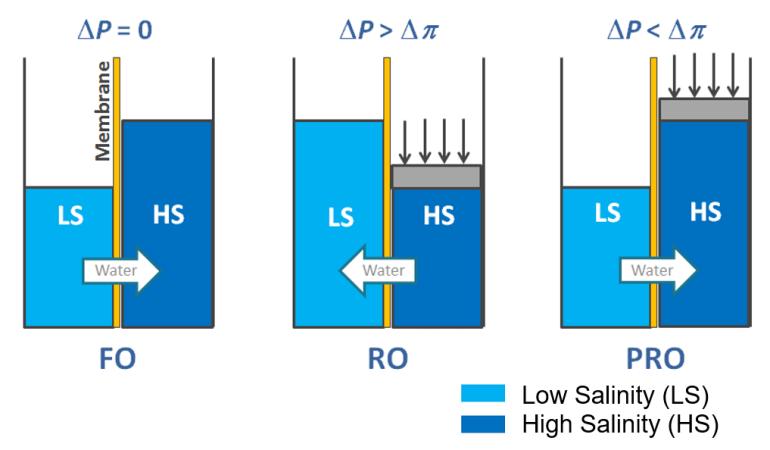
Figure 1. Schematic of FO, RO and PRO processes.
2.2 Mathematical Model
A numerical model that considers the changes in salt concentration of both the feed and draws solutions across the PRO membrane is created. The model considers the PRO membrane as a collection of finite areas and solves the discretized transport and mass conservation equations (as shown in Figure 2). The model also applies mass conservation for water and salt molecules in both the feed and draw streams, considering counter flow configuration.
|
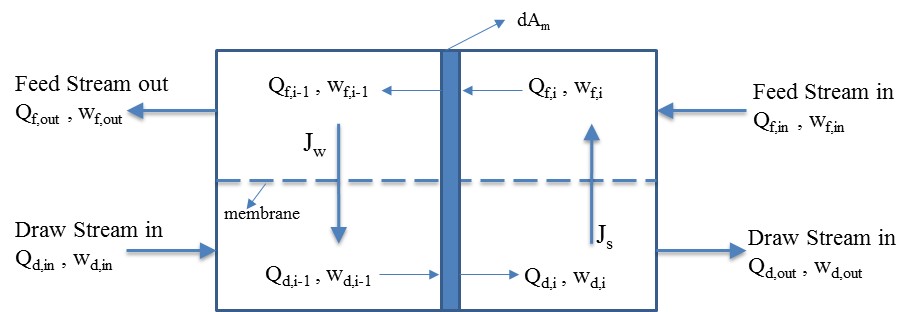
Figure 2. Schematic of model variable of PRO process.
|
|
Salt mass conservation:
|
|
Qf and Qd are the feed and draw volume flow rates, respectively, Jw is the water mass flux transferred, Am is the finite membrane surface area, wf and wd are the feed and DS salinity, respectively, and Js is the salt mass flux. The mixing ratio is the ratio of the volumetric flow rate of the DS to the FS at the inlets to the membrane.
|
The diffusion solution equation and Fick’s law calculate the water and salt flux through the membrane as follows.
|
|
|
where A is the coefficient of water permeability, B is the coefficient of salt permeability, Δπ is the osmotic pressure difference, and Δp is the hydraulic pressure difference. In this model, the hydraulic pressure drop along the feed and draw channels is assumed to be negligible.
The model equations described earlier can be considered an idealized model that does not account for the concentration polarization effect due to the accumulation of salts near the membrane interface. This leads to a decrease in the effective osmotic pressure difference and a subsequent reduction in water transfer across the membrane. Furthermore, the salt becomes concentrated on the feed side and diluted on the draw side of the membrane. To address this issue, Lee et al.[12] developed a model that calculates the water flux while considering the effect of internal concentration polarization. The water flux is determined by:
|
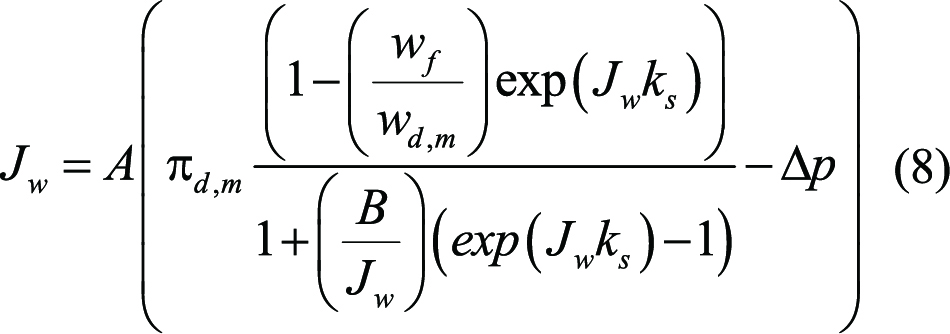
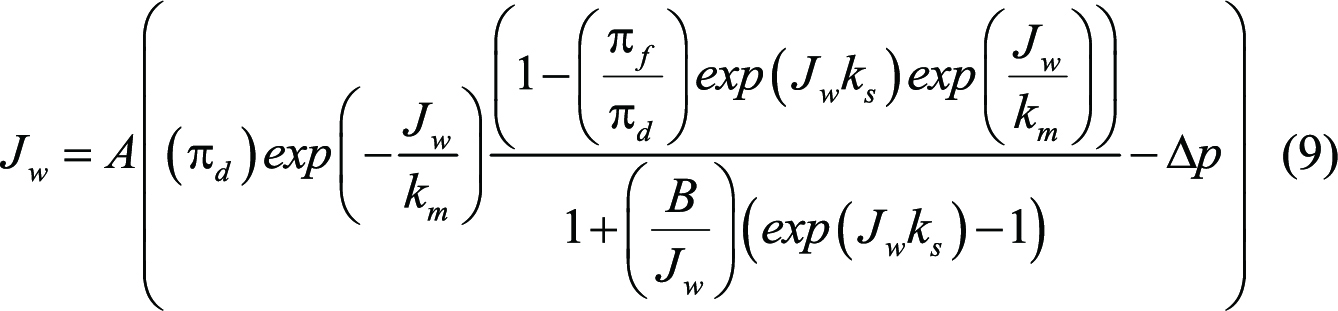
where wd,m is the DS salt concentration near the membrane surface, and ks is the diffusion solute resistivity in the support layer. The external concentration polarization (ECP) results in the salt content being diluted on the DS side of the membrane. Achilli et al.[13] modified Equation (8) to consider both ICP and ECP, which is given by the following resulting expression for the water flux:
|
On the other hand, the salt flux correlation that takes into consideration the CP effect is given by[13]:
|
The total water flow rate Qp permeated through the membrane is given by Equation (11).
|
The total power generated from the PRO process is given by:
|
The power density is determined by dividing the total power by the membrane area as given by:
|
Using the finite difference method, the equations governing the PRO process as described by Equations (1)-(13) are numerically solved. The numerical solution determines the power density, power generated, and total permeate flow rate. Various operating conditions, flow configurations, and membrane arrangements are considered to solve the ideal case (with no salt diffusion and negligible concentration polarization) and non-ideal (with concentration polarization). The model validation and results discussion are presented in the following section.
2.3 Multi-stage Configurations
The following two configurations are proposed for a PRO system to increase the power density under constant values of membrane characteristics and operating conditions.
2.3.1 Multi-stage PRO
The described setup comprises multiple single-stage PRO units, in which the FS exiting a stage (which, if it is not pure water, will be more concentrated at the outlet) is pressurized and employed as the DS in the following stage. The DS leaving the first stage has already been diluted within that stage, so it is depressurized to generate energy, as depicted in Figure 3, and it can be extended to encompass N stages. Simple mass balances can be conducted at each stage, and the following equations depict this setup. The flow rate and concentration of the draw stream input for stage (k) can be computed by:
|
|
|
where the “k” ranges from 1 to N number of stages. Similarly, the total power produced by the multi-stage PRO system is the summation of power produced by each PRO stage and can be calculated by:
|
|
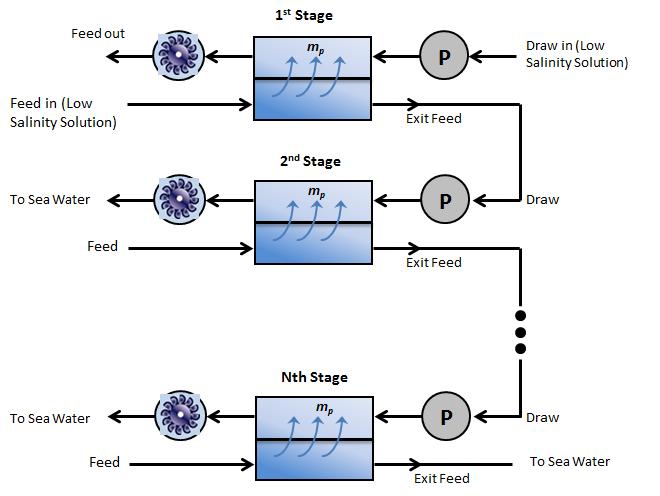
Figure 3. Multi-stage counter-flow PRO system.
2.3.2 Multi-pass PRO
This setup involves depressurizing the DS leaving the first PRO stage using a hydro turbine to achieve the ideal hydraulic pressure, after which it is directed to the subsequent stage or pass. The previously diluted DS is then introduced as a new input draw stream, with the same feed stream, into the second PRO pass. The DS exiting the second unit is depressurized to the optimum hydraulic pressure of the third PRO unit. This process can be expanded to N-passes, as shown in Figure 4. The draw stream’s inlet flow rate and salinity for each pass are as follows.
|
|
|
The total power produced by the multi-pass PRO system can be calculated using the following Equation (19).
|
where pd,N of the last pass should be the atmospheric pressure.
|
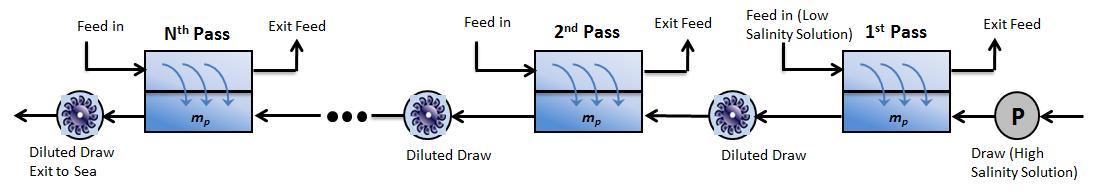
Figure 4. Multi-pass counter-flow PRO system.
3 RESULTS AND DISCUSSION
The mathematical model of the PRO single stage presented in Section 3 is used to analyze the performance of multi-stage and multi-pass PRO configurations. The membrane used in the analysis is a flat-sheet cellulose triacetate FO membrane (from Hydration Technology Innovations) and its properties are given in Achilli et al.’s research[13]. The operating conditions and membrane characteristics used in this analysis are shown in Table 1. The draw stream intake for the PRO system has a salinity of 70g/kg, while the FS salinity of 35g/kg is used for each pass/stage of PRO. The membrane area used is 1700m2 with an input DS of 12.7l/s. The counterflow configuration is used for the analysis of PRO systems.
Table 1. Input Parameters to Multi-stage and Multi-pass PRO Configurations
Parameter |
Value |
Membrane Area, Am |
1700m2 |
Water permeability coefficient, A |
1.13×10⁻⁸m/s-kPa |
Salt permeability coefficient, B |
1.73×10⁻⁷m/s |
Mass transfer coefficient, km |
8.48×10⁻⁵m/s |
Solute resistivity, ks |
1.76×10⁵s/m |
Inlet draw stream flow rate, Qd,in |
12.7l/s |
Mixing ratio, MR |
1 |
3.1 Multi-Stage PRO
Figures 5-7 exhibit the outcomes for a multi-stage PRO system, where the effect of concentration polarization is not considered. Figure 5 illustrates the variation in hydraulic and osmotic pressure differences of each stage along the membrane for a three-stage PRO system. Figure 6 displays the salinity variation of each stage along the membrane for three stages. A pressurized DS with a salinity of 70g/kg is introduced into the first stage, and it exits with a higher volume flow rate and a lower salinity of 53.7g/kg due to the addition of water permeate, which is then depressurized to generate power. Conversely, the salinity of the FS increases from 35g/kg to 50.3g/kg due to water loss. The exit feed stream is pressurized and used as a draw stream for the second stage. In the second stage, the draw stream’s volume flow rate increases with the addition of permeate, which is then depressurized to generate power. The exit FS of the second stage, with a salinity of 41.4g/kg, is pressurized and used as a DS for the third stage. The accumulated power produced by the three stages, without considering the effect of concentration polarization, is shown in Figure 7. The total power generated by the three stages is 6.22kW, which is 18% more than the power produced using a single-stage PRO system.
|
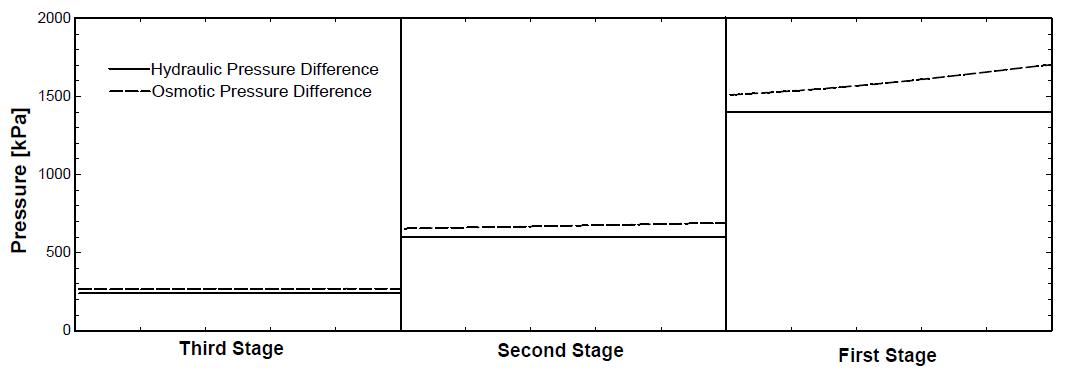
Figure 5. Hydraulic and osmotic pressure difference variation along the membrane for three PRO multi-stages.
|
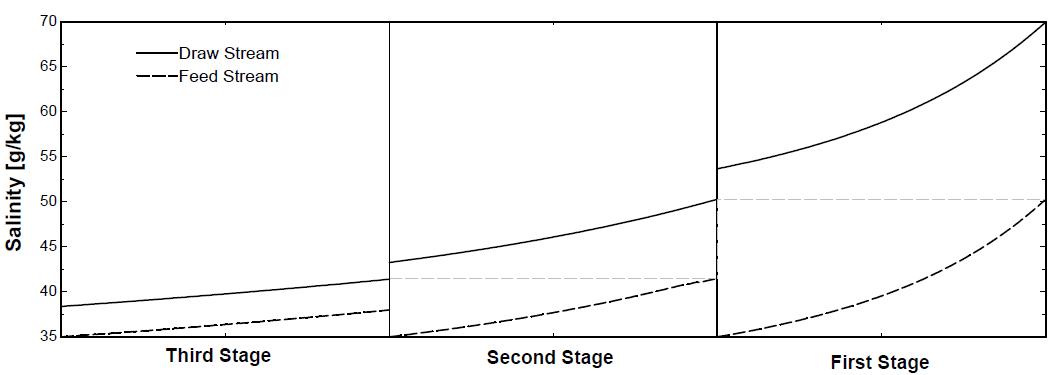
Figure 6. Salinity variation along the membrane for three PRO multi-stages.
|
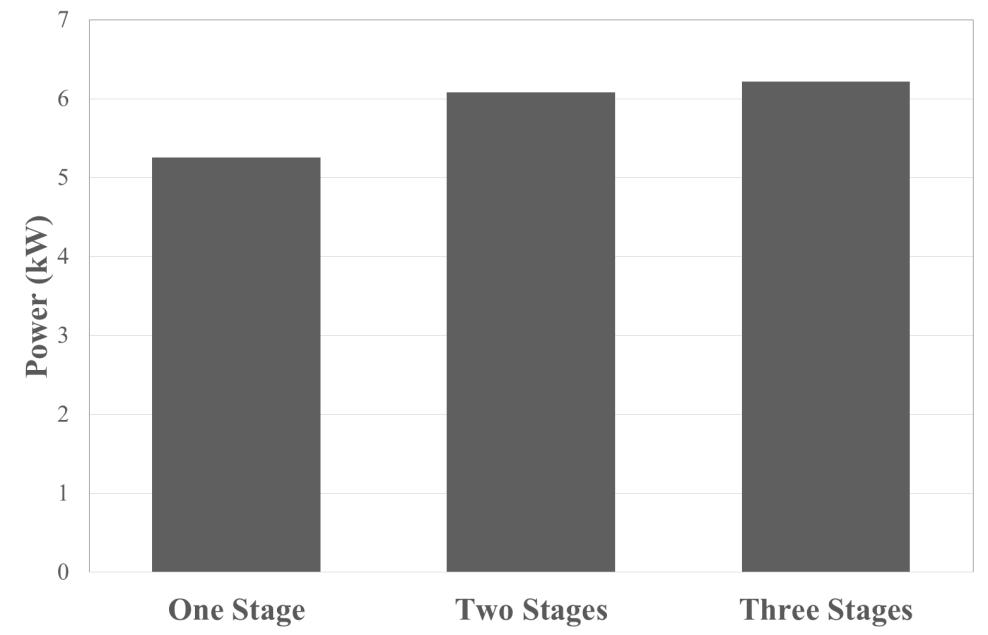
Figure 7. Accumulated power produced by three PRO multi-stages.
3.2 Multi-Pass PRO
The findings for the multi-pass PRO system without considering concentration polarization are presented in Figures 8-10. Figure 8 displays the variation of a hydraulic and osmotic pressure difference for each pass along the membrane of a four-pass PRO system. Figure 9 shows the salinity variation along the membrane of the four passes. The pressurized draw stream with a salinity of 70g/kg is introduced in the first pass, and with the addition of permeate, it leaves the first pass with a lower salinity of 53.7g/kg. The depressurized exit draw stream is then used as input to the second pass, where its volumetric flow rate increases and its salinity decreases to 45.7kPa before being introduced as the inlet draw stream to the third pass. The same process occurs between the third and fourth pass. Figure 10 shows the power produced by each turbine, power consumed by the pump, and total net power for the four passes. The total power produced by the four passes is 8.31kW, which is 58% more than the power produced by a single-unit PRO system when not considering concentration polarization.
|
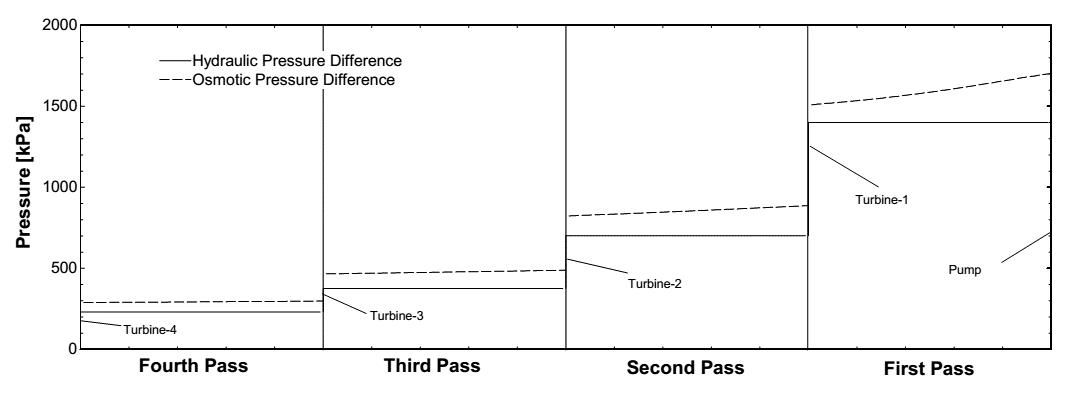
Figure 8. Hydraulic and osmotic pressure difference variation along the membrane for four PRO passes.
|
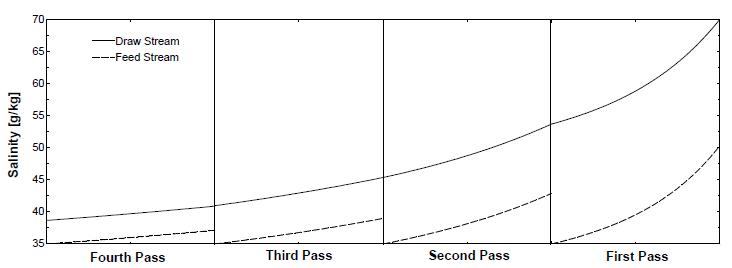
Figure 9. Salinity variation along the membrane for four PRO passes.
|
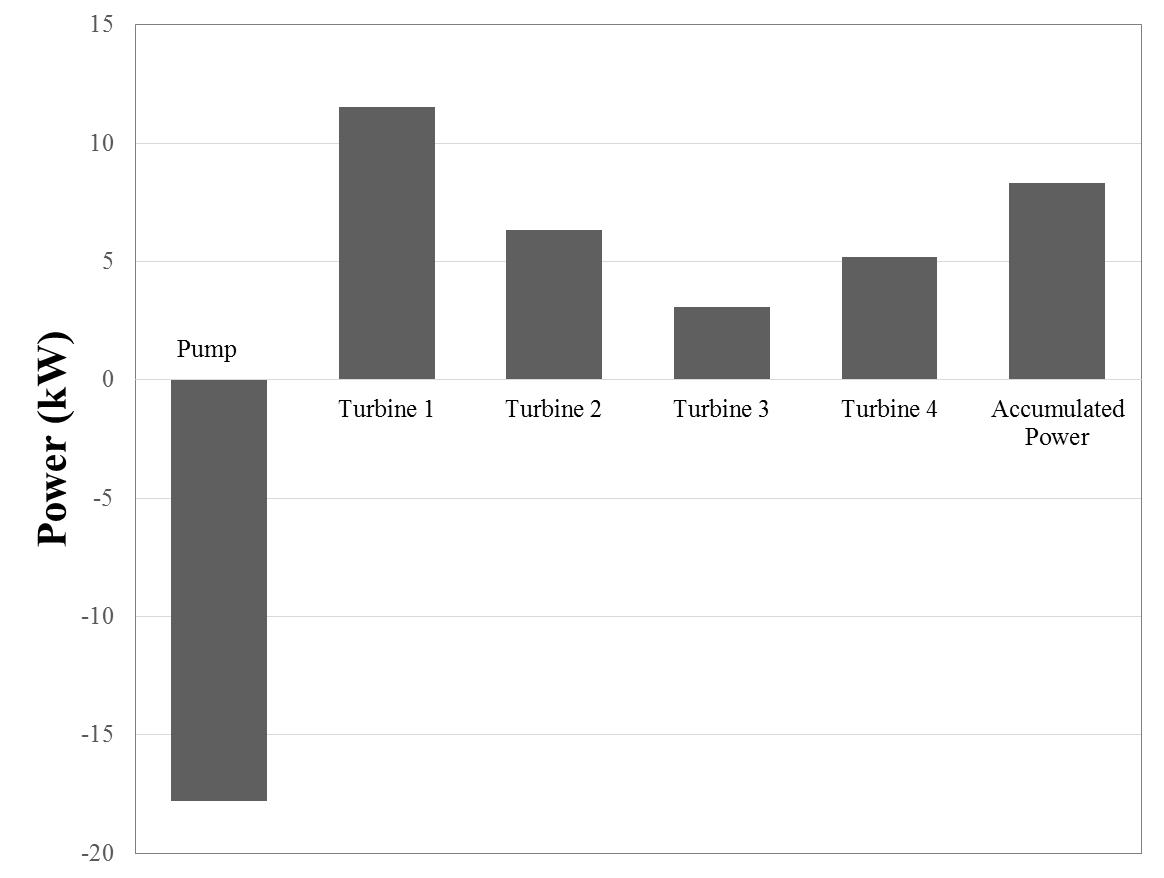
Figure 10. Power produced by four PRO passes.
4 CONCLUSION
This study has introduced novel PRO multi-stage configurations that have been shown to significantly enhance power production compared with a single-stage system. Specifically, the multi-stage and multi-pass PRO configurations developed in this study demonstrated remarkable improvements in power output when compared to a single-stage or single-pass PRO system. The simulation results revealed that the multi-stage PRO arrangement was able to generate 18% more power than the single-stage PRO system, while the multi-pass arrangement with four passes resulted in a 58% increase in power output. These findings highlight the potential of multi-stage and multi-pass flow configurations as a promising avenue for improving the efficiency of the PRO process and advancing renewable energy generation. Overall, the outcomes of this study provide a basis for future research and development in the field of PRO systems.
Acknowledgements
The authors would like to thank the Natural Sciences and Engineering Research Council of Canada (NSERC-Grant #401366) for the funding support provided for this research.
Conflicts of Interest
The authors declared that they have no conflict of interest.
Author Contribution
Akram W performed the investigation, data curation and writing-original draft; Awais M performed the data curation, and writing-revised draft; Sharqawy MH supervised the work, performed the conceptualization, methodology, writing- review & editing; All the authors contributed to writing the article, read and approved its submission.
Abbreviation List
A, Water permeability coefficient, m s-1 Pa-1
Am, Membrane area, m2
B, Salt permeability coefficient, m s-1
CDCF, Continuous draw and continuous feed
d, Draw
DS, Draw solution
ECP, External concentration polarization
f, Feed
FO, Forward osmosis
FS, Feed solution
i, Membrane element
in, Inlet
Js, Salt flux, m s-1
Jw, Water flux, m s-1
k, Stage or pass
km, Mass transfer coefficient, m s-1
Ks, Solute resistivity, s m-1
m, At membrane surface
MR, Mixing ratio
out, Outlet
p, Osmotic pressure, Pa
p, Permeate
P, Power, W
P, Pressure, Pa
PRO, Pressure-retarded osmosis
Q, Volume flow rate, m3 s-1
RED, Reverse electrodialysis
RO, Reverse osmosis
SGE, Salinity gradient energy
W, Salinity, kg kg-1
References
[1] International Energy Agency, World Energy Statistics 2017. OECD Publishing: Paris, France, 2017.
[2] Touati K, Tadeo F, Elfil H. Osmotic energy recovery from Reverse Osmosis using two-stage Pressure Retarded Osmosis. Energy, 2017; 132: 213-224.[DOI]
[3] Jia Z, Wang B, Song S et al. Blue Energy: Current Technologies for Sustainable Power Generation from Water Salinity Gradient. Renew Sustain Energy Rev, 2014; 31: 91-100.[DOI]
[4] Micale G, Cipollina A, Tamburini A. Salinity gradient energy, Sustainable Energy from Salinity Gradients. Woodhead Publishing: Soston, UK, 2016; 1-17.
[5] Altaee A, Zaragoza G, Drioli E et al. Evaluation the potential and energy efficiency of dual stage pressure retarded osmosis process. Appl Energy, 2017; 199: 359-369.[DOI]
[6] Altaee A, Palenzuela P, Zaragoza G et al. Single and Dual Stage Closed-Loop Pressure Retarded Osmosis for Power Generation: Feasibility and Performance. Appl Energy, 2017; 191: 328-345.[DOI]
[7] Touati K, Salamanca J, Tadeo F et al. Energy recovery from two-stage SWRO plant using PRO without external freshwater feed stream: theoretical analysis. Renew Energ, 2017; 105: 84-95.[DOI]
[8] Altaee A, Sharif A. Pressure retarded osmosis: Advancement in the process applications for power generation and desalination. Desalination, 2015; 356: 31-46.[DOI]
[9] Altaee A, Cipolina A. Modelling and optimization of modular system for power generation from a salinity gradient. Renew Energ, 2019; 141: 139-147.[DOI]
[10] He W, Wang Y, Shaheed MH. Enhanced Energy Generation and Membrane Performance by Two-Stage Pressure Retarded Osmosis (PRO). Desalination, 2015; 359: 186-199.[DOI]
[11] Han G, Zhang S, Li X et al. Progress in pressure retarded osmosis (PRO) membranes for osmotic power generation. Prog Polym Sci, 2015; 51: 1-27.[DOI]
[12] Lee KL, Baker RW, Lonsdale HK. Membrane for Power generation by pressure- retarded osmosis. J Memb Sci, 1981; 8: 141-171.[DOI]
[13] Achilli A, Cath TY, Childress AE. Power generation with pressure retarded osmosis: An experimental and theoretical investigation, J Memb Sci, 2009; 343: 42-52.[DOI]
Copyright © 2023 The Author(s). This open-access article is licensed under a Creative Commons Attribution 4.0 International License (https://creativecommons.org/licenses/by/4.0), which permits unrestricted use, sharing, adaptation, distribution, and reproduction in any medium, provided the original work is properly cited.


