Environmental Impacts of Energy Usage in Selected Tea Factories in Kenya
Joy Kibet1*, Sammy Letema1
1Department of Spatial and Environmental Planning, Kenyatta University, Nairobi, Kenya
*Correspondence to: Joy Kibet, Department of Spatial and Environmental, Kenyatta University, Thika Super Hwy, Nairobi 43844-00100, Kenya; Email: kibetjjoy@students.ku.ac.ke
Abstract
Objective: To assess the environmental impacts of various energy uses in Kenya tea factories to establish possible combinations for climate change mitigation. Tea industry provides livelihood for approximately 10% of the country’s total population but consumes considerable amount of energy during tea production and processing. The use of different energy sources in tea factories during processing causes different environmental impacts, which necessitates the search for environmentally friendly and sustainable energy source(s) through comparison of the environmental impacts of different energy sources. Few studies have assessed the combination of different energy use in tea factories or the use of modelling tools to explore environmental impacts. To this end, this paper assesses the environmental impacts of different energy usage by four tea factories in Kenya for a period of 5 years.
Methods: The study used the life circle assessment (LCA) method for comparative evaluation of environmental impacts of electricity, biogas, solar, firewood and briquettes as the source of energy. Simapro 7.1 software was used for the analysis of the LCA with Eco-indicator 99 as the assessment method. The problem-oriented and damage-oriented impact categories of ReCiPe 2016 global scale and single-issue method Intergovernmental Panel on Climate Change 2013 method were used in the impact assessment.
Results: Wood fuel has more impacts compared to other four sources of energy assessed, with a total value of 13996.23 points of the environmental load, whereas briquettes, biogas and solar showed 5826.746, 4275.474 and 5826.746 points, respectively. Depletion of minerals is the major cause of environmental impacts by wood fuel, with a score of 6440.5 points. Biogas, solar, briquettes and electricity yielded 1297.9, 0.004136, 3367 and 110 points, respectively resource consumption in each impact categories. Overall, the major environmental impacts categories caused by energy use in the four tea factories were resource depletion, respiratory inorganics, climate change, and carcinogens. Analysis of variance showed there was significant difference (0.05>P=0.017446) between environmental impacts of different energy use in the tea factories over the 5-year period.
Conclusion: The constant demand for energy in tea production and processing leads to increased environmental impacts and thus requires sustainable energy sources. Wood fuel has a high environmental impact, while solar energy has the least. Biogas energy using waste tea leaves has reduced environmental impacts compared to wood fuel. Macadamia briquettes are suitable for thermal energy because of reduced bulkiness, high energy yield and relatively low environmental impact. Tea factories can contribute to the Kenya’s Green Economy Strategy and Implementation Plan 2016-2030, which targets reducing energy consumption by 2% through utilization of off-grid solar systems to account for 20% of the total energy supply.
Keywords: energy mix, environmental impacts, life cycle assessment, tea factories, Kenya
1 INTRODUCTION
Kenya’s economy is dominated by agricultural production, and the tea sector contributes approximately 26% of the export earnings and 4% of the total gross domestic product[1]. Tea is a major cash crop in Kenya, and the industry provides livelihood for approximately 10% of the country’s total population[2]. There has been a growing demand for environmental awareness and precautionary measures to reduce or mitigate the rate of environmental degradation[3] and ensure sustainable development of the tea sector[4]. Despite the availability of renewable energy in the tea sector in Kenya, the resources are under-utilized[5].
Renewable energy source is gaining popularity as it accounts for approximately 18% of the global energy supply, with biomass energy accounting for about 13% of the renewable energy[6]. Despite increased environmental concerns because of the high dependency on non-renewable sources of energy, many systems globally are still highly dependent on use of fossil fuels[6-8].
Carbon-free and cheap energy sources are required in projecting the energy transition[10]. The use of briquettes fuel, which is manufactured by compaction of paper, sawdust, yard or agricultural waste under low pressure, has gained popularity as alternatives to wood pellets, firewood, and charcoal in Asia, South America, and some countries in Africa[11]. Consumption of a considerable amount and types of energy sources contributes to satisfying the constantly increasing energy demand[1]. Solar energy is one of the cleanest renewable energy sources[12]. Combustion of food waste valorises it and produces biogas, an important biofuel, which may serve as an alternative energy source[13]. Tea production and processing require specific thermal energy of 4.45-6.84kWh/kg and electric energy of 0.4-0.7kWh to produce 1kg of tea[14]. Significant changes in energy consumption are expected in 2050, with renewable wood at 30.9%, pellets at 21.4%, briquettes at 9.4%, and pellets of spent barley grain at 0.3%[15].
The total environmental impacts resulting from wood chips life cycle assessment (LCA) indicate global warming and respiratory inorganics have the high impacts per category impacts of the total environmental load[16]. A survey by Wang et al.[17] on life cycle environmental impact of the typical wood base confirmed land use as the top impact category with 10.6 impacts. Other impacts include respiratory inorganics and fossil fuel depletion with 4.7264 and 4.36852, respectively. High biogas and biofuel energy potentials have not been adopted in the tea sector in Kenya as demonstrated by Kipkemei et al[18].
2 MATERIALS AND METHODS
2.1 Description of the Study Area
The research is conducted on four tea factories utilizing different energy sources for their tea processing. These are Chemogondany in Kericho County, Kitumbe in Bomet County, Kagwe in Kiambu County and Makomboki in Murang’a County (Figure 1). Kagwe and Makomboki are managed by Kenya Tea Development Agency, while Chemogondany and Kitumbe tea factories are managed by Finlay’s. Kagwe, at 1°00'17" S latitude and 36°43'35" E longitude, about 2120m above sea level and near Aberdare ranges and Kinare Forest. Makomboki is located at 0°99'26" S latitude and 37°26'19" E longitude, about 2160m above sea level and bordering the Ndakai-in Dam to the south and the Aberdare Ranges on the northern side. Chemogondany tea factory is located at 0°28'45" S latitude and 35°18'30" E longitude, with an elevation of 1,859m above sea level and situated southeast of Cheptebes River. Kitumbe tea factory is located at 0°24'53" S latitude and 35°18'30" E longitude, about 2,108m above sea level, west of Kenya’s Great Rift Valley and 8km from the Mau Forest Complex.
|
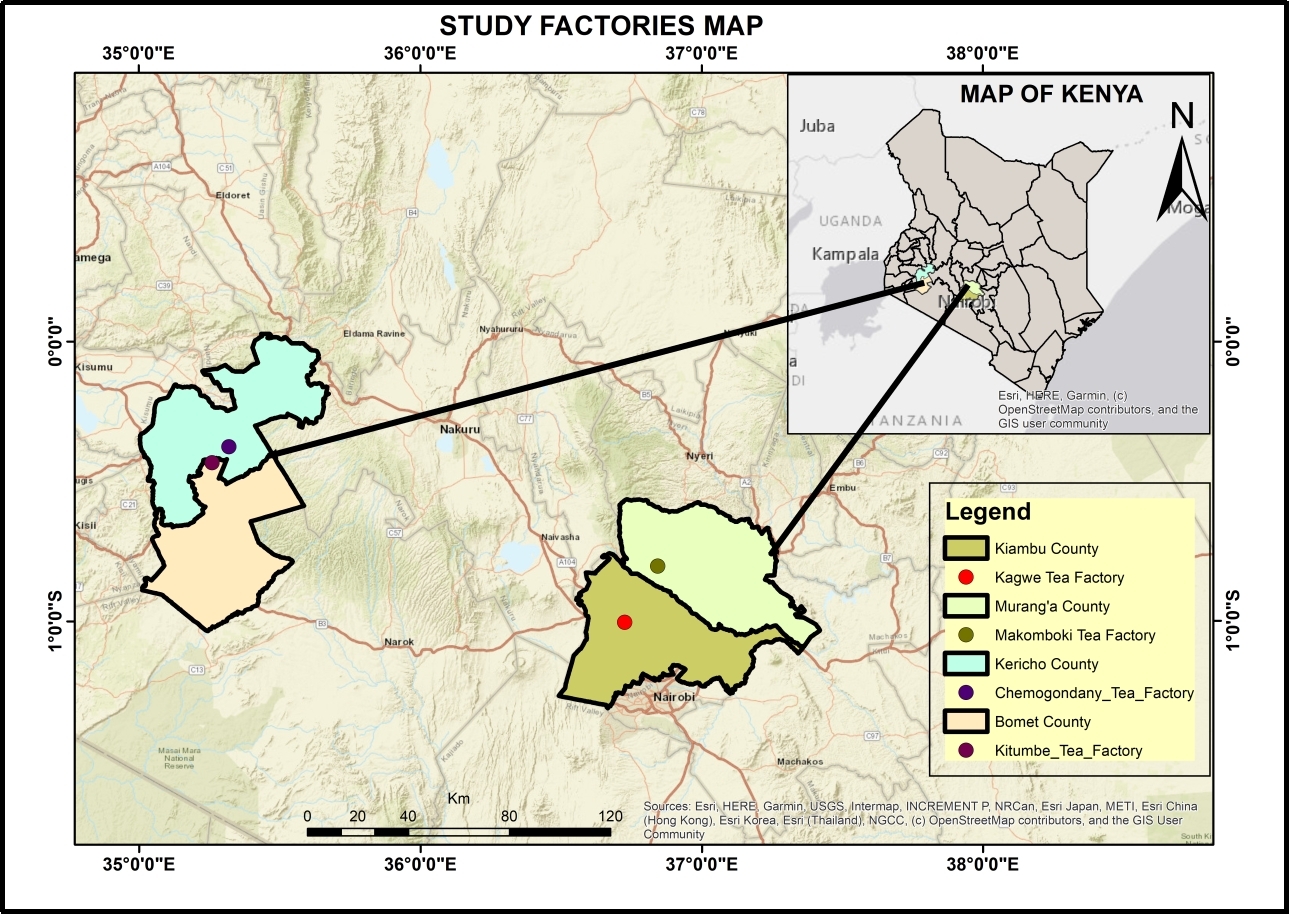
Figure 1. Location of selected tea factories in Kenya.
2.2 Approaches and Techniques to Data Collection
The target population is 86 tea factories, out of which four are sampled based on energy use. Primary data was acquired from interviewing factory managers and technical personnel. The secondary data was purposely retrieved from the tea factories' records, reports, and operational data for modeling. The study used the LCA method as a tool for comparative evaluation of the environmental impacts of electricity, biogas, solar, firewood and briquettes as the sources of energy. The material type, mass, energy use and waste type during tea processing were used as the input for the determination of the LCA. Simapro 7.1 software developed by Pré Consultants was used for the analysis of the LCA with Eco-indicator 99 (EI99) as the assessment method.
Simapro software was adopted in this study since it allows for the analysis of over one variable and produces more output items such as waste management and sustainability[19]. The LCA tool allows for assessments of environmental impacts and comparisons of different forms and types of energy[20]. EI99 is a damage-oriented method that focuses on impacts on three main categories, namely, ecosystem quality, human health, and resources. The midpoint impact assessment categories utilized in the study include land use, fossil fuel, mineral, ozone layer, carcinogens, eco-toxicity, acidification, eutrophication, respiratory organics, and respiratory inorganics, climate change, and radiation. The selected damage (endpoint) categories are human health, ecosystem quality, climate change, and resource depletion, which are in line with the recommendation by Brackley et al[21]. Carcinogens, climate change, ozone layer depletion, respiratory organics and radiation are measured by the unit disability adjusted life years. Acidification/eutrophication, eco toxicity and land use are measured using potentially fraction of plant species. Fossil fuels and minerals are measured by Mega Joule, extra energy requirement to compensate lower future grade. For EI99 method, “E” is the eco indicator score for materials and processes used in the LCA, resulting in environmental impacts[22]. All the units are the combined to form a point (Pt), which is the sum of the total impacts. Pt is the total environmental load expressed as a single score of characterization, normalization, damage assessment, and weighing[23].
The impact indicators and characterizations result from environmental impacts, which are classified into 6 categories (Table 1) and the modeling assumptions are indicated in Table 2.
Table 1. Model Impact Indicators, Characterization and Category
Impact Indicator |
Characterisation Model |
Impact Category |
Greenhouse gas emission |
Calculate total emissions in the reference unit of CO2 equivalent for CO2, methane and nitrous oxide |
Global warming |
Release to air decreases or thins the ozone layer |
Calculate the total ozone-forming chemicals in the stratosphere, including CFCs, HFSCS, chlorine and bromine. CFC equivalents are used as the reference unit |
Ozone depletion |
Release of air potentially resulting in acid rain (acidification) |
Calculate total hydrogen ions (H+) equivalent for released sulphur oxides, nitrogen oxides, hydrochloric acid and ammonia. H+ mole-eq. is used as a reference unit |
Acidification |
Release to air potentially resulting in smog |
Calculate the real substance that can be photo chemically oxidised. O3 is used as the reference unit. |
Photochemical smog |
Release to air potentially resulting in eutrophication of water bodies |
Calculate the total substances that contain available nitrogen and phosphorus. N-eq. is used as the reference unit |
Eutrophication |
Release to air potentially results in respiratory effects |
Calculate total carbon monoxide, nitrogen dioxide, nitrogen oxides, sulphur dioxides, ammonia, particles <2.5 and <10µm and total suspended particles |
Respiratory effect |
Notes: CO2, Carbon dioxide; CFC, Chlorofluorocarbon; HFSCs, Hydro fluorocarbon; O3, Ozone; N, Nitrogen.
Table 2. LCA Modeling Assumptions
Parameter |
Description |
Premium wood pellet moisture content |
6.5% (dry basis) |
Carbon content of wood |
50% |
Waste material for the wood energy is a content value |
8% |
Pellet higher heating value |
8,200 BTUs per pound |
Cut off impacts |
0.1% |
Kenya Power and Lighting Company Electricity |
Medium voltage at the grid |
Solar energy |
Non-rechargeable |
Notes: Source: Simapro software modelling.
2.3 Data Analysis
Data obtained from the records and reports of the factories were entered into the software to generate LCA models, followed by impact assessment determination. ReCiPe 2016 global scale problem-oriented and damage-oriented impact category and single-issue method Intergovernmental Panel on Climate Change 2013 method were used for impact assessment. EI99 method is performed based on damage-oriented approach or the endpoint. Normalization has been done to compare the quantified impact to the reference value in the system, as recommended by Ferreira et al[24]. Analysis of Variance (ANOVA) test was conducted to determine the presence of significant difference between the environmental impacts.
3 RESULTS AND DISCUSSION
3.1 Biogas Energy Use and Impact Assessment for Chemogondany Factory
Biogas production trend for five years by Chemogondany Tea Factory shows a decline in yearly production. The highest biogas production of 826,082kWh is recorded in 2016 (Table 3), while the lowest production of 470,948kWh is shown in 2017.
The life cycle modelling of biogas involves the delivery of the raw materials, which are the subassemblies, and the processing and disposal of the raw materials. Biogas production has a high impact on respiratory organics with a score of 1764.1 points of the total environmental load, with depletion of the ozone layer being the least with 0.1 points (Figure 2). Other impacts include depletion of minerals, climate change, land use change, respiratory inorganics, eco-toxicity, and carcinogens. Research by Fusi et al.[25] demonstrated different results, with the greatest effect of acidification, followed by climate change, and the least by ozone layer depletion.
|
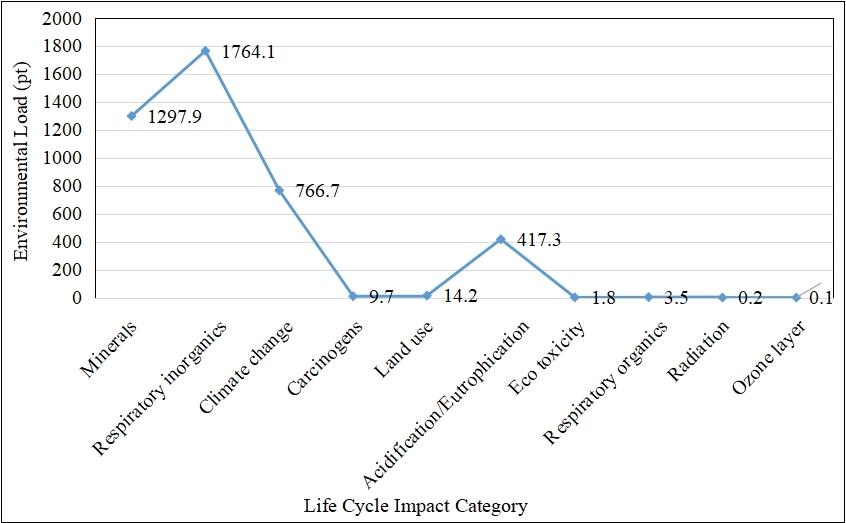
Figure 2. Biogas energy LCA impact assessment for Chemogondany Factory.
3.2 Solar Energy Impact Assessment for Kitumbe Factory
Solar production trend by Kitumbe Tea Factory for five years shows constant production. In 2016, 45,815kWh (Table 3) of electricity is produced from solar panels, which was the highest production over the 5 years, and the lowest is witnessed in 2017. According to Florio et al.[7], the minimum direct normal irradiance for Photovoltaic installations solar thermal is 5kWh/m2, and the average solar thermal per day is 0.85kWh/m2. The daily solar thermal power difference is attributed to reduced light intensity and the technology of the solar panels.
The solar energy life cycle includes transportation from another continent via air or sea, which requires the use of fuel carried by delivery vans to the respective location before being mounted at the roof top. The transport has a greater impact than the use of the solar energy. The model was created about the system boundaries of solar energy as recommended by Goedkoop et al[26]. Solar technology has more impacts on climate change with a score of 0.007351 points, followed by respiratory inorganics with 0.00709, with the least being depletion of ozone layer with 0.00000279 (Figure 3). On the contrary, Gekas et al.[27] found that the significant impact of solar LCA is land use, followed by fossil fuel and the least being acidification. The cause of the difference is attributed to the difference in the solar technology used.
|
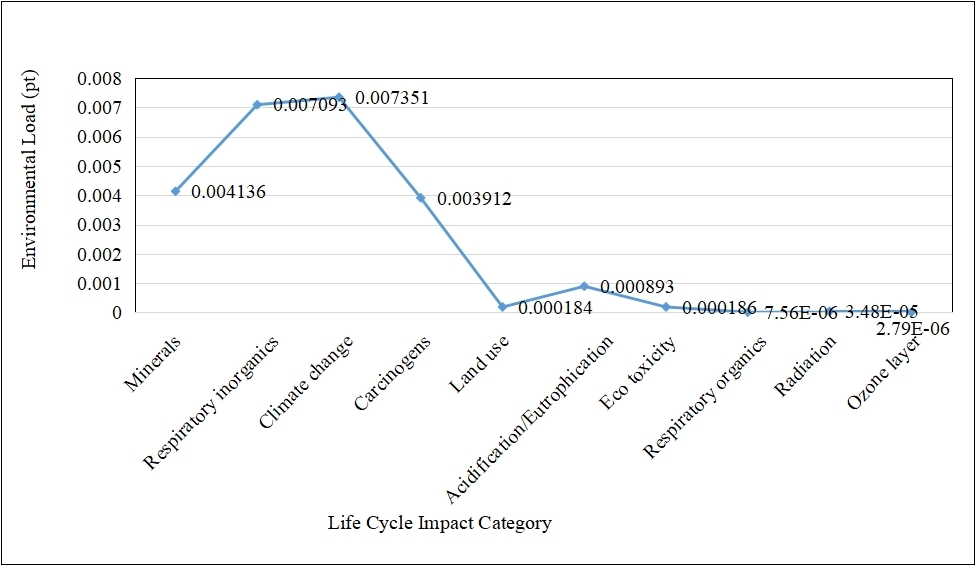
Figure 3. Solar energy LCA impact assessment.
3.3 Firewood and Briquette Energy Use and Impact Assessment by Kagwe Tea Factory
Kagwe factory consumes two types of energy, namely, wood fuel and electricity. Firewood consumption trend by Kagwe factory shows a very slight change over the years with the highest consumption of 25,628.70m3 in 2020 (Table 3).
Wood processing to produce energy involves massive felling down of trees to obtain firewood. The delivery van then carries the wood into the respective locations for the generation of engine fuels. Electricity is then consumed to run the machines that use firewood to produce heat. The ash waste from the wood burning is stored in a disposal site and used by some farmers on their farms.
Similar model results were demonstrated by Wang et al.[17] on the wood LCA as the life cycle of the same product is almost constant; only the quantity and processes differ.
The major environmental impact on the wood life cycle is the depletion of resources with a score of 6440.4 points, followed by respiratory inorganics with 3058.0, and then climate change with 3024.9 (Figure 4). The study results differ from the results demonstrated by Wang et al.[17] who found that land use is the major contributor to environmental impacts, followed by respiratory inorganics and fossil fuels. The difference in the results is attributed to different types of wood fuel consumed by the tea factories.
|
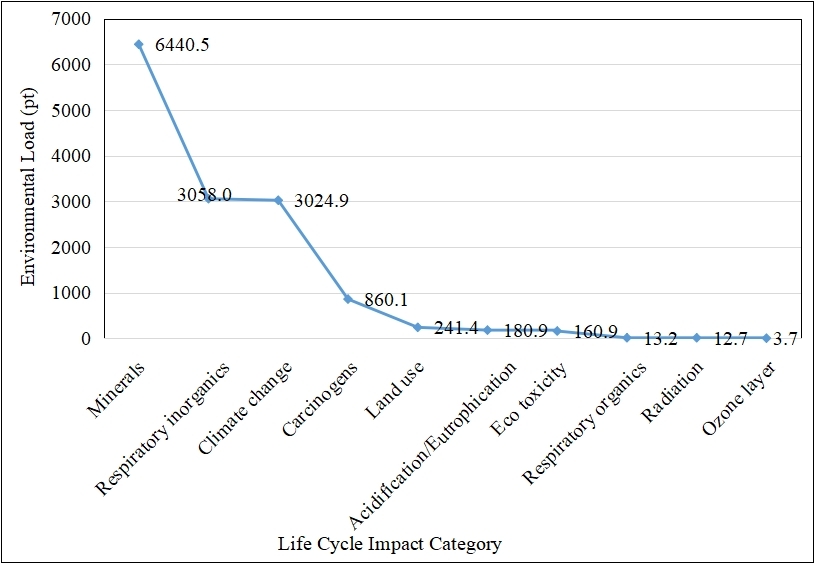
Figure 4. Firewood impact assessment for Kagwe Factory.
3.4 Wood and Macadamia Briquettes Energy Use and Impact Assessment by Makomboki Tea Factory
Macadamia briquettes consumption shows a fluctuating trend over five years (Table 3). The contributing factor to the changing trend is the availability of macadamia shells from the companies. In the absence of fuel, wood briquettes were used to supplement the fuel. Firewood is used in very small quantities to boost the briquettes energy sources. McDougal et al.[11] stated that waste biomass from fruits has a higher calorific content compared to charcoal, sawdust, and wood pellets, which is the same case with the macadamia briquettes.
The manufacturing of wood pellets produces briquettes. The process involves sheet rolling and the use of sheet alloys.
The rolling consumes electricity for the conversion of low alloys Conversion of low alloys leads to the production of nickel and other products such as ferronickel. The most significant impact of briquettes LCA is the depletion of mineral resources with a score of 3367.0 environmental load points, and the lowest is depletion of the ozone layer with 0.1 points (Figure 5). Other impacts include respiratory inorganics, climate change, land use and acidifications with 1435.5, 450.9, 390.6, 83.3 scores respectively. Alanya-Rosenbaum and Bergman[28] found that the major impact of briquettes LCA is eutrophication and acidification, which differ from this research findings. However, the impact category is similar, and only the quantity per category is different.
|
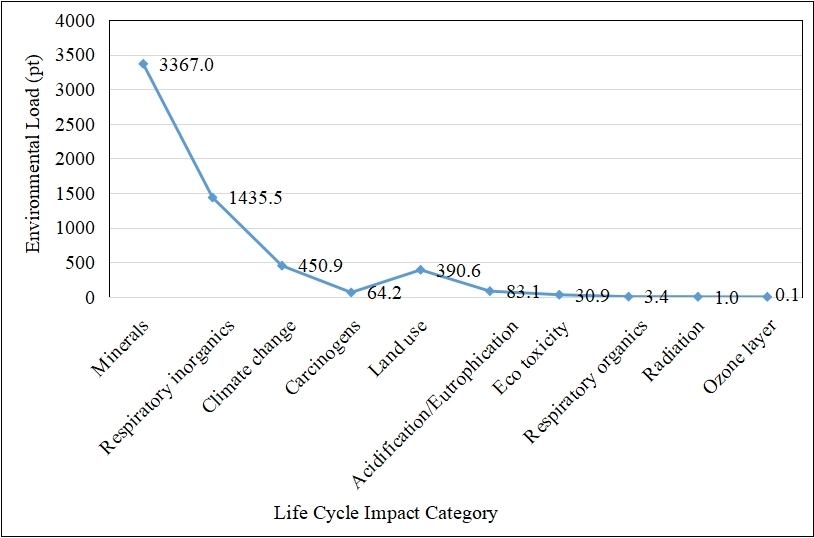
Figure 5. Briquettes impact assessment.
3.5 Electricity Energy Impact Assessment
Electricity consumption at Chemogondany tea factory shows a slight change in the first four years. The highest electricity consumption of 7,262,809kWh is observed in 2020, and the lowest production of 3,827,461kWh in 2019 (Table 3). Kitumbe factory reported a higher energy consumption of 5,930,723kWh in 2020 and the least consumption of 3,959,842kWh in 2017.
Kagwe tea factory recorded the highest electricity consumption of 3,659,705kWh in 2020 and the least in 2017 with 2,742,769kWh. Makomboki tea factory shows a continuous increasing trend except the year of 2020, where it slightly decreases. The highest electricity consumption of 4,199,381kWh is witnessed in 2019 and the lowest consumption of 3,068,042kWh in 2016.
Electricity production and use from the utility agency Kenya Power and Lighting Company show little significant impact on the environment (Figure 6). The highest impact of electricity use is climate change with environmental impacts of 80-126 points for the four factories. Mineral depletion and respiratory inorganics also show significant contribution to environmental load of 70-110 and 51-83 points, respectively. The low environmental impacts show high process efficiency, the maturity of the technology and the treatment of the flue gas present.
|
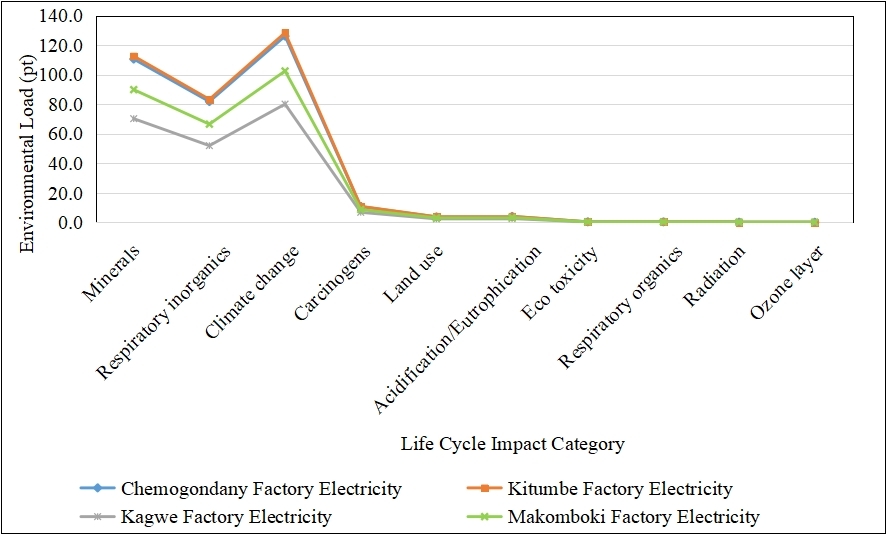
Figure 6. Electricity impact assessment.
Table 3. 5-years Energy Trend for the Four Tea Factories
Year |
Chemogondany Factory Biogas (kWh) |
Kitumbe Factory Solar (kWh) |
Kagwe Factory Wood Fuel (M3) |
Makomboki Factory Wood Fuels (M3) |
Makomboki Factory Macadamia Briquettes (Kgs) |
Makomboki Factory Firewood (M3) |
Chemogondany Factory Electricity (kWh) |
Kitumbe Factory Electricity (kWh) |
Kagwe Factory Electricity (kWh) |
Makomboki Factory Electricity (kWh) |
2016 |
826,082 |
45,815 |
17,878 |
51,904 |
4,015,107 |
4,993 |
4,546,823 |
5,059,312 |
3,137,513 |
3,068,042 |
2017 |
470,948 |
37,151 |
15,708 |
272,557 |
3,170,938 |
7,163 |
3,946,072 |
3,959,842 |
2,742,769 |
3,154,982 |
2018 |
696,740 |
40,612 |
21,047 |
920,096 |
100,412 |
20,414 |
4,266,615 |
4,712,495 |
2,768,200 |
3,488,726 |
2019 |
791,676 |
39,452 |
19,990 |
469,302 |
128,624 |
24,292 |
3,827,461 |
4,609,846 |
2,853,489 |
4,199,381 |
2020 |
644,259 |
40,060 |
25,628 |
94,432 |
14,429 |
23,647 |
7,262,709 |
5,930,723 |
3,659,705 |
3,851,368 |
Total |
3,429,705 |
203,090 |
100,253 |
1,808,291 |
7,429,240 |
80,510 |
23,849,680 |
24,272,218 |
15,161,676 |
17,762,499 |
3.6 Comparative Analysis of Environmental Impact Assessment by the Four Factories
Wood production and consumption by Kagwe factory show high environmental impact with depletion of minerals being the most impact category with a score of 6440.5 points. Solar energy produces the least significant impact on the environment, as indicated in Figure 7.
|
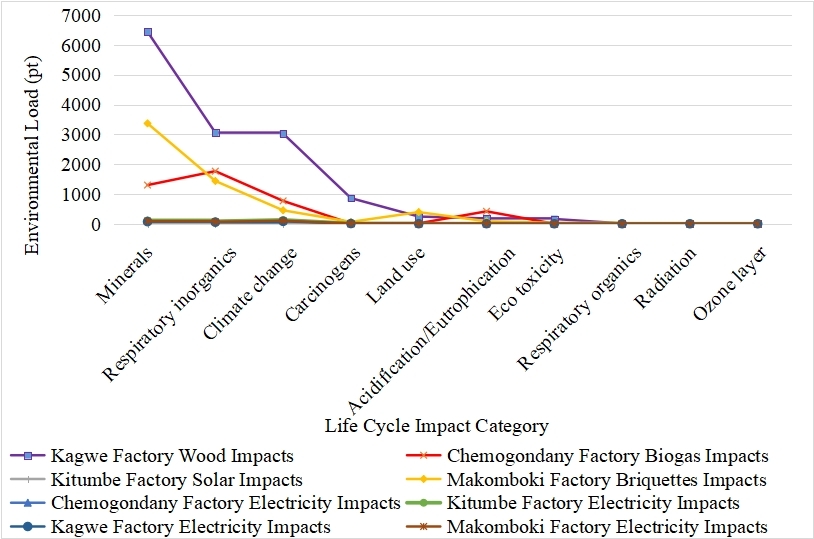
Figure 7. Comparison of different impact assessments from energy use.
A comparison of different fuel use shown in Table 4 indicates that wood used in energy production causes more impact than solar, briquettes, and biogas, with a total score of 13996.23 points. Briquettes production is the second on environmental impact category with a total of 5826.746 points, followed by biogas with 4275.474 points and solar energy the least with 0.0238 points. Climate change and mineral depletion is the leading impact category on wood production and use. Electricity use has moderate impacts on the environment, which are lower than wood and briquettes but higher than solar energy. Electricity from the grid demonstrated low impacts compared to biogas in the study by Fusi et al.[25], which is similar to these findings. The increased biogas impact is the life cycle of the feedstock, which is included in the modeling, indicating that that feedstock type affects the LCA of the energy production from biogas.
ANOVA to determine the significance difference of environmental impacts (Table 5) of different energy uses shows that the P value (0.017446) does not reach the statistical standard for the samples (P<0.05), while the F value is less than the Fcrit value. The results show a significant difference between the environmental impacts and the type of energy use by the four tea factories in Kenya.
Table 4. Different Energy Use and Impact Assessment Per Energy Category for the Four Tea Factories
Kagwe Factory Wood |
Chemogondany Factory Biogas |
Kitumbe Factory Solar |
Makomboki Factory Briquettes |
Chemogondany Factory Electricity |
Kitumbe Factory Electricity |
Kagwe Factory Electricity |
Makomboki Factory Electricity |
|
Total |
13996.23 |
4275.474 |
0.0238 |
5826.746 |
337.5912 |
343.7086 |
214.3364 |
274.349497 |
Carcinogens |
860.0921 |
9.730726 |
0.003912 |
64.23926 |
10.65553 |
10.84862 |
6.765191 |
8.659409073 |
Respiratory organics |
13.16044 |
3.489823 |
7.56E-06 |
3.367699 |
0.313919 |
0.319607 |
0.199307 |
0.255111491 |
Respiratory inorganics |
3057.993 |
1764.14 |
0.007093 |
1435.496 |
81.79191 |
83.27405 |
51.92963 |
66.46965157 |
Climate change |
3024.941 |
766.6857 |
0.007351 |
450.9128 |
126.1057 |
128.3908 |
80.06439 |
102.482 |
Radiation |
12.67098 |
0.212774 |
3.48E-05 |
0.959616 |
0.090597 |
0.092239 |
0.05752 |
0.073625489 |
Ozone layer |
3.680409 |
0.127516 |
2.79E-06 |
0.140372 |
0.045274 |
0.046094 |
0.028744 |
0.036792542 |
Eco toxicity |
160.9381 |
1.76999 |
0.000186 |
30.91704 |
0.328383 |
0.334334 |
0.20849 |
0.266866499 |
Acidification/Eutrophication |
180.855 |
417.2787 |
0.000893 |
83.12767 |
4.007725 |
4.080349 |
2.544502 |
3.256949254 |
Land use |
241.3945 |
14.15154 |
0.000184 |
390.6167 |
3.680437 |
3.74713 |
2.336707 |
2.990972627 |
Minerals |
6440.506 |
1297.887 |
0.004136 |
3366.969 |
110.5718 |
112.5754 |
70.20194 |
89.85811843 |
Table 5. ANOVA on Environmental Impacts for the Four Factories
ANOVA |
|
|
|
|
|
|
Source of Variation |
SS |
df |
MS |
F |
P-value |
F crit |
Between Groups |
17380514 |
10 |
1738051 |
2.388073 |
0.01746 |
1.977476 |
Within Groups |
48035123 |
66 |
727804.9 |
|
|
|
Total |
65415637 |
76 |
|
|
|
|
Notes: SS, Sum of squares; df, Degree of freedom; MS, Mean of squares; F, Variation between and within samples; P, significance level; F crit, Critical level of significance.
4 CONCLUSION
The constant demand for energy in tea production and processing leads to increased environmental impacts and diversification of energy sources. There is significant difference between environmental impacts in terms of environmental load in the four tea factories. Due to the high environmental impact of wood-based fuels, conversion to wood-based fuel consumption can reduce the impact. The environmental impact of biogas energy is relatively low, yet its impact depends on the type of feedstock used. Use of waste materials such as spent or waste leaves is a sustainable way. Macadamia briquettes are suitable for thermal energy because of reduced bulkiness, high energy yield and relatively low environmental impact. Solar energy has the least impacts on the environment and thus is more sustainable source of electrical energy.
LCA shows that wood fuel has the highest environmental impacts with depletion of minerals being the leading impact category of environmental load. The major categories causing environmental impacts for all the energy sources are depletion of minerals, respiratory inorganics, and climate change.
Utilizing sustainable energy sources in tea factories contributes to the protection of the environment and mitigation of climate change as recommended by the Republic of Kenya Energy Act[29]. Likewise, tea factories can contribute to Kenya’s Green Economy Strategy and Implementation Plan 2016-2030, which targets to reduce energy consumption by 2% by utilizing off-grid solar systems. Government interventions are therefore needed to provide a guideline to enable the achievement of the target in the tea factories.
Considering a shift to more than one energy mix, i.e., solar and electricity for electrical energy and macadamia nut briquettes for thermal energy, could result in significant environmental savings full stop Similarly, exploration of additional uses for wood ash to avoid accumulation at disposal sites will also reduce the environmental impact.
Acknowledgements
We are thankful to Finlay’s Kenya and Kenya Tea Development Authority for providing data and information required for the research.
Conflicts of Interest
The authors declared that there were no conflict of interest regarding the publication of this paper. No potential conflict of interest was reported by the authors.
Author Contribution
Both authors participated in the drafting and writing of the manuscript. Both authors contributed to the manuscript and approved the final version.
Abbreviation List
ANOVA, Analysis of Variance
EI99, Eco-Indicator 99
H+, Hydrogen ions
kWh, Kilowatt hour
kWh/m2, Kilowatt per hour per square metre
LCA, Life cycle assessment
Pt, Point
References
[1] Ahmad T, Zhang D. A critical review of comparative global historical energy consumption and future demand: The story told so far. Energy Rep, 2020; 6: 1973-1991. DOI: 10.1016/j.egyr.2020.07.020
[2] Kenya. Rainforest Alliance. Taking renewable energy to Kenya’s tea landscapes. Accessed 2022. Available at https://www.rainforest-alliance.org/energycampaign
[3] UNEP. Report of the United Nations Environment Programme: 13th Session of the UN‐Permanent Forum on Indigenous Issues 2014, New York, USA, 12-23 May 2014.
[4] Munasinghe M, Deraniyagala Y, Dassanayake N et al. Economic, social and environmental impacts and overall sustainability of the tea sector in Sri Lanka. Sustain Prod Consump, 2017; 12: 155-169. DOI: 10.1016/j.spc.2017.07.003
[5] Inoti Mwenda J. Analysis of energy utilization and renewable energy potential in KTDA region two tea factories in Kenya [master’s thesis]. Juja, Kenya: Jomo Kenyatta University of Agriculture and Technology; 2016.
[6] Sreevani P. Wood as a renewable source of energy and future fuel: AIP Conference Proceedings, Andhra Pradesh, India: 8-10 February 2018. Andhra Pradesh, India: AIP Publishing LLC; 2018. DOI: 10.1063/1.5047972
[7] Florio C, Fiorentino G, Corcelli F et al. A life cycle assessment of biomethane production from waste feedstock through different upgrading technologies. Energies, 2019; 12: 718. DOI: 10.3390/en12040718
[8] Nosratabadi S, Mosavi A, Shamshirband S et al. Sustainable business models: A review. Sustainability, 2019; 11: 1663. DOI: 10.3390/su11061663
[9] Sharma A, Dutta AK, Bora MK et al. Study of energy management in a tea processing industry in Assam, India: Current Trends in Renewable and Alternate Energy, Guwahati, India: 4-6 December 2018. Andhra Pradesh, India: AIP Publishing LLC; 2019. DOI: 10.1063/1.5096503
[10] USA. USAID. Greenhouse Gas Emissions Factsheet: Vietnam. Accessed 2022. Available: https://www.climatelinks.org/resources/greenhouse-gas-emissions-factsheet-vietnam
[11] USA. A Boise State University. McDougal O, Eidemiller S, Weires N. Biomass Briquettes: Turning Waste Into Energy. Accessed 2022. Available at https://biomassmagazine.com/articles/5148/biomass-briquettes-turning-waste-into-energy
[12] Abreu JA, Albert C, Beer J et al. Response to: “Critical analysis of a hypothesis of the planetary tidal influence on solar activity” by S. Poluianov and I. Usoskin. Sol Phys, 2014; 289: 2343-2344. DOI: 10.1007/s11207-014-0473-2
[13] Alghoul O, El-Hassan Z, Ramadan M et al. Experimental investigation on the production of biogas from waste food. Energ Source Part A, 2019; 41: 2051-2060. DOI: 10.1080/15567036.2018.1549156
[14] Kumar KR, Dashora K, Krishnan N et al. Feasibility assessment of renewable energy resources for tea plantation and industry in India-A review. Renew Sustain Ener Rev, 2021; 145: 111083. DOI: 10.1016/j.rser.2021.111083
[15] Ruíz-Carmona O, Islas-Samperio JM, Larrondo-Posadas L et al. Solid biofuels scenarios from rural agricultural and forestry residues for Mexican industrial SMEs. Energies, 2021; 14: 6560. DOI: 10.3390/en14206560
[16] Klavina K, Romagnoli F, Blumberga D. Comparative life cycle assessment of woodchip uses in pyrolysis and combined heat and power production in Latvia. Energy Procedia, 2017; 113: 201-208. DOI: 10.1016/j.egypro.2017.04.055
[17] Wang S, Su D, Zhu S. A comparative study on life cycle assessment of typical wood base furniture: Proceedings of the 2016 5th International Conference on Sustainable Energy and Environment Engineering, Zhuhai, China, 12-13 November 2016. Amsterdam, Netherlands: Atlantis Press; 2016. DOI: 10.2991/icseee-16.2016.115
[18] Kipkemei I, Simiyu GM, Rono M. Production of biogas from waste tea leaves: A case of integrated waste management at DL koisagat tea factory, Nandi Hills. Afr Environ Rev, 2019; 3: 156-165.
[19] Silva D, Nunes AO, da Silva Moris A et al. How important is the LCA software tool you choose comparative results from GaBi, openLCA, SimaPro and Umberto: Proceedings of the VII Conferencia Internacional de Análisis de Ciclo de Vida en Latinoamérica, Medellin, Colombia, 10-15 June 2017.
[20] Esteban B, Riba JR, Baquero G et al. Environmental assessment of small-scale production of wood chips as a fuel for residential heating boilers. Renew Energ, 2014; 62: 106-115. DOI: 10.1016/j.renene.2013.06.041
[21] Brackley AM, Nicholls DL, Puettmann M et al. Life cycle assessment of wood energy for residential heating-opportunities for wood pellet production in southeast Alaska. US Department of Agriculture, Forest Service, Pacific Northwest Research Station; 2017. DOI: 10.2737/PNW-GTR-951
[22] Frischknecht R, Benetto E, Dandres T et al. LCA and decision making: when and how to use consequential LCA; 62nd LCA forum, Swiss Federal Institute of Technology, Zürich, 9 September 2016. Int J Life Cycle Ass, 2017; 22: 296-301. DOI: 10.1007/s11367-016-1248-9
[23] B. V Pré Consultants, 4/24/2021 SimaPro-PRé Sustainability, 2021.
[24] Ferreira JV, Viana H, Esteves B et al. Life cycle assessment of residual forestry biomass chips at a power plant: a Portuguese case study. Int J Energy Envir E, 2014; 5: 1-7. DOI: 10.1007/s40095-014-0086-4
[25] Fusi A, Bacenetti J, Fiala M et al. Life cycle environmental impacts of electricity from biogas produced by anaerobic digestion. Front Bioeng Biotech, 2016; 4: 26. DOI: 10.3389/fbioe.2016.00026
[26] Goedkoop M, Oele M, Leijting J et al. Introduction to LCA with SimaPro. Accessed 2022. Available at https://pre-sustainability.com/legacy/download/SimaPro8IntroductionToLCA.pdf
[27] Gekas V, Frantzeskaki N, Tsoutsos T. Environmental impact assessment of solar energy systems. Results from a life cycle analysis: Proceedings of the International Conference “Protection and Restoration of the Environment VI”, Skiathos, Greece, 1-5 July 2002.
[28] Alanya-Rosenbaum S, Bergman R. Using life-cycle assessment to evaluate environmental impacts of briquette production from forest residues. US Department of Agriculture, Forest Service, Forest Products Laboratory; 2018. DOI: 10.2737/FPL-GTR-262
[29] Republic of Kenya. The Energy Act 2019. Accessed 2022. Available at https://www.epra.go.ke/download/the-energy-act-2019
Copyright ©2022 The Author(s). This open-access article is licensed under a Creative Commons Attribution 4.0 International License (https://creativecommons.org/licenses/by/4.0), which permits unrestricted use, sharing, adaptation, distribution, and reproduction in any medium, provided the original work is properly cited.


