Experimental Analysis of CO2 Entrance Pressure Dependence on Temperature
Abrar Almutairi1, Talal AL-Bazali1*
1Petroleum Engineering Department, College of Engineering and Petroleum, Kuwait University, Kuwait
*Correspondence to: Talal AL-Bazali, PhD, Associate Professor, Petroleum Engineering Department, College of Engineering and Petroleum, Kuwait University, Jamal Abdul Nasser St, Kuwait City 54551, Kuwait; Email: albazali1972@outlook.com
Abstract
Objective: In this study, changes in capillary entry pressure of shale upon interaction with CO2 under different temperatures have been investigated. The combined impact of temperature and petrophysical properties of shale (water content, water activity, permeability, and porosity) on capillary entry pressure was addressed.
Methods: Pressure breakthrough measurements were used to evaluate the minimum entry pressure of CO2 through shale. A heavy-duty oven was used to vary the temperature to investigate the impact of temperature on CO2 capillary entry pressure through shale.
Results: The obtained findings revealed that the shale’s capillary entry pressure upon interaction with CO2 was highly affected by temperature. Higher temperatures decreased the capillary entry pressure of shale. We believe that pore dilation, where pore throat size expands due to the high temperature, may have caused this decrease in capillary entry pressure. However, in some cases, higher temperature activated clay swelling that may have caused an apparent decrease in pore throat radii of shale, which translated into higher capillary entry pressure. Furthermore, no distinct relationship between shale’s petrophysical properties and measured capillary entry pressure was detected upon interaction with CO2 at different temperatures.
Conclusion: Heat could alter pore throat radii and cause pore dilation, which could change capillary entry pressure. Interfacial tension decreases with increasing temperature, which can be attributed to the weakening of intermolecular forces at the two immiscible fluids interface. The swelling of clay could be related to the temperature-induced transition from passive to active clay.
Keywords: CO2 sequestration, pore dilation, clay swelling, shale sealing capacity, entrance pressure
1 INTRODUCTION
The idea of reducing the concentration of carbon dioxide (CO2 sequestration) in the atmosphere is receiving increasing attention from scientists and policymakers round the globe. CO2 is a hazardous "greenhouse" gas that warms the earth’s surface, depletes the atmosphere of oxygen, and absorbs and emits infrared radiation. CO2 sequestration is simply defined as catching and storing carbon in geologic formations, or underground aquifers to reduce its concentration in the atmosphere. A strong scientific basis outlining the associated hydrologic-geochemical-geomechanically processes which can control the long-term fate of CO2 in the subsurface for operation is obligatory[1]. The captured CO2 would then be separated, transported, and stored either in the ocean or injected underground in deep depleted reservoir formations with high porosity[2]. The second option, deep depleted reservoir formations, is the purpose of the present study. This option requires methods to characterize and select sequestration sites, subsurface engineering to optimize performance, and cost approaches to ensure safe operation, monitoring technology, remediation methods, regulatory overview, and an institutional approach for managing long-term liability[3]. To better understand the mechanism of storing carbon dioxide in deep reservoir formations, several concepts are required to be clarified.
1.1 Subsurface Traps and Shale Caprocks
Subsurface traps are below-ground traps where low permeability caprocks overlay a permeable reservoir rock (high porosity). Caprocks can take several forms, all preventing the fluid’s upward flow to the surface. Any fluid that hits the reservoir rock moves upward via the rock’s pore spaces until it is halted by a sealed barrier (caprock). The low-permeability caprocks generally represent the shale or low-permeability sandstones and carbonate rocks[4].
|
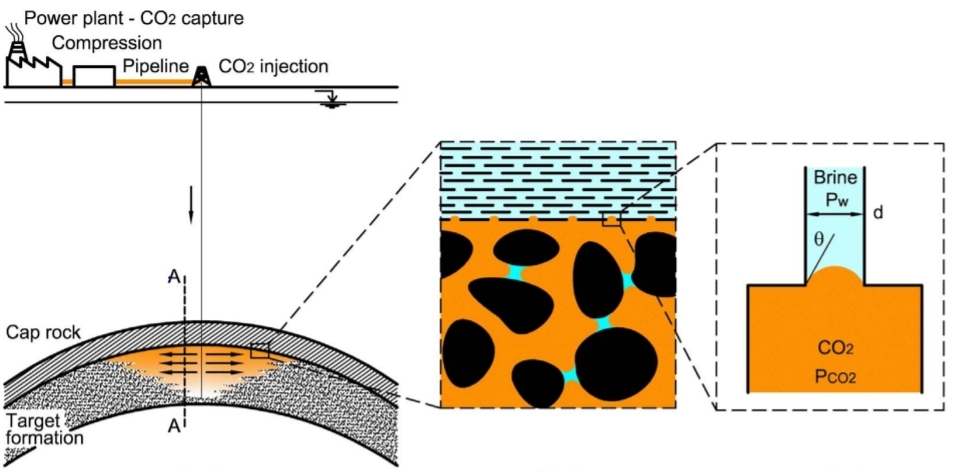
Figure 1. Carbon geological storage, where the CO2 is injected and stored in high permeability and porosity formation with overlying caprock[6].
1.2 Capillary Entry Pressure
|
As it is clear from Equation (1), for CO2 insertion into a shale, the distinction pressure between the carbon dioxide and H2O should be exceeded the least capillary entry "threshold" pressure of the shale. The minimum capillary entry pressure is a capillary pressure in which the non-wetting phase, especially in oil or gas, begins to disturb the wetting phase, commonly brine, contained in the largest pore[9]. According to Equation (1), in very narrow pore throat shales, the capillary entrance pressure may be high (permeability). The least capillary entrance pressure may approximate the height of a hydrocarbon column that a shale caprock can trap. The following equation determines the height of the hydrocarbon column at equilibrium:
|
It can be seen from Equation (2) that the minimum capillary entry pressure (Pc, min) must be known to estimate the sealing capacity of shale (h).
1.3 Factors Affecting Capillary Entry Pressure
There are direct and indirect factors that affect the capillary entry pressure. The direct factors can be obtained from Equation (1), where water-wet shale and non-wetting fluid characteristics affect capillary entry pressure. More specifically, The wettability angle, shale pore throat radius, and interfacial tension between the shale pore fluid and the non-wetting fluid are all factors in determining the capillary entry pressure. The indirect factors that affect the capillary entry pressure are the reservoir’s physical and geometric properties (e.g., entry value, permeability, layering, heterogeneity and spatial correlation, anisotropy, and dipping), injection rate, and pressure[10]. Also, in situ pressure and temperature affects the shale’s capillary entry pressure since the CO2 density is highly affected by both pressure and temperature[11].
1.4 Methods of Evaluating Capillary Entry Pressure
The capillary entry pressure of caprocks is measured by two different methods. The first method is direct laboratory scale injection that can be done on core samples, and the second method is an indirect procedure that are characteristically depend upon the evaluation of the material pore size, wettability, and mineralogical composition; however, they are constrained by the testing circumstances, casting doubt on the reliability of the calculated capillary entry-pressure[11].
Many articles related to “CO2 sequestration”, especially in depleted reservoirs, and the methodologies used to measure the capillary entry pressure of caprocks, particularly shales, were studied and investigated. It has been noticed that it is important to understand how the CO2 behaves during the sequestration under two conditions, high pressure and high temperature, to accomplish effective and safe storage of the overlaying caprock. However, in most of the previous studies, the first condition, high pressure, had been considered while the second condition, high temperature, had been largely ignored. This report will examine the effect of thermal changes on capillary entry pressure.
1.5 Literature Review
Many studies observed various factors that could impact the capillary pressure of various fluids in shale. For instance, previously, Favero and Laloui[12] studied the impact of CO2 injection on the hydro-mechanical behavior of a clay-rich shaly caprock at atmospheric temperature. Their major findings revealed the effects brought by the occurrence of CO2 as a non-wetting fluid which should be carefully considered; decrease of the interfacial tension and the possible variation in wettability angle. These aspects were found to cause a reduction of the entry pressure in the presence of CO2.
Farokhpoor et al.[13] targeted to present a project about the possible changes in wettability due to physical-geochemical processes which could decrease the capillary entrance pressure and reduce the sealing integrity of the caprock. Their obtained findings showed that exposing muscovite mica mineral to CO2 showed a marked increase in wettability angle and minerals became significantly less water wet. Additionally, measures of capillary entry pressure led to a decrease in capillary entrance pressure. The permeability measurements after each test showed a significant change in shale absolute permeability to brine.
Pini et al.[14] used sandstone rock cores with variant lithology and pore size distribution to measure drainage capillary pressure curves of CO2 and water. The study observed that these measurements provide independent confirmation that sub-core scale capillary heterogeneity plays a vital role in controlling during multiphase flow. Comisky et al.[15] examined mercury injection capillary pressure (MICP) profiles on tight shale samples of varying diameters. MICP profiles are highly dependent on sample size for two reasons: 1. pore accessibility and conformity 2; Ultra-low perm systems have shown to require cuttings and core profiles for calibrating well logs. AL-Bazali et al.[16] focused on proofing that the shale properties (CEC and permeability), fluid type, and interfacial tension can make a difference in the values of capillary entry pressures of shales at atmospheric temperature (T=70°F). Their obtained findings revealed that the worth of interfacial tension increases by increasing capillary entrance pressure.
Abdoulghafour et al.[17] targeted measuring capillary pressure curves as a function of water saturation, saturation history, rock matrix, and thermo-physical conditions. Sandstone samples showed that the CO2 saturation increased with increasing CO2 injection rate, typical for a non-wetting phase displacement. There was also a clear increase in the Saturation of CO2 with increasing Pc. Plug and Bruining[18] investigated capillary pressure for the sand-CO2-water system under various pressure conditions at the atmospheric temperature (T=27°C). Their findings revealed a decrease of drainage and imbibition capillary pressure for increasing CO2 pressures and pronounced dissolution rate effects for gaseous CO2. Significant capillary pressure fluctuations and negative values during imbibition are observed at near-critical conditions.
Dewhurst et al.[19] investigated, using the drying method, threshold pressure determinations for the Muderong shale and indicated that the determination of threshold pressure was not profoundly influenced by the drying method. Muderong Shale’s observed capillary characteristics indicated that, in the absence of additional risk factors, it has the potential to serve as an effective seal for hydrocarbons and the geological storage of carbon dioxide. In addition, compositional differences in the Muderong Shale series, remarkably increasing smectite interlayer concentration in illite-smectite deposits lower in the sequence in the deeper basin, would likely improve seal capability.
Donnelly et al.[20] studied capillary pressure-saturation relationships for gas shales measured using a water activity meter. As anticipated, the Brooks and Corey parameters were verified statistically among the various shale types. However, the Brooks and Corey parameters for the wetting and drying measurements did not differ significantly, indicating that hysteresis may not need to be taken into account in leak-off models.
Olabode and Radonjic[21] investigated the caprock integrity in CO2 sequestration in their study. Their results showed that shale rock properties could be significantly altered by minute geochemical changes that are hard to detect. These geochemical changes impact the specific surface area and pore network of shale caprock, and their values tended to grow with time in all of the samples studied but at slower rates later in the experiment. Chenevert and Amanullah[22] discussed results obtained with a specially preserved, highly reactive shale core. This study showed that shales must be preserved at their native water content if accurate physical measurements are to be made. The data on swelling revealed that shales that were altered during handling (hydrated or dehydrated) did not respond properly even when restored to their native hydration conditions and experienced excessive swelling compared to cores kept at their native water content.
Hale et al.[23] investigated the role of chemical potential on wellbore stability. Their results were explained based on chemical potential differences between the oil-based drilling fluid and shale. The alteration in shale water content produced by these variances has been recognized as the primary element influencing shale mechanical behavior and hence borehole stability. A review of geological applications and interpretations of the capillary pressure in reservoir studies was presented by Vavra et al.[24] They evaluated the seal potential of shale caprocks and presented important equations that can help estimate the shale sealing capacity and reservoir versus non-reservoir or pay versus non-pay zones in detail.
Some new models and methodologies have been proposed that can be useful, for instance, Seyyedattar et al. and Busch et al.[25,26] have studied, where they developed a new ET model for the prediction of (Bo and Pb) using only two parameters (Rsi and γg). The developed models exhibit strong performance and comparably accurate predictions. Moreover, Mathias et al.[27], in another study, developed a two-layer vertical equilibrium model for the injection of carbon dioxide into a low-pressure porous reservoir containing methane and water. Their results showed that as the reservoir’s initial pressure decreases, the pressure buildup and temperature change increase. Zendehboudi et al.[28] proposed a new method for the acceleration of CO2 dissolution to lower the risk of CO2 leakage for carbon capture and storage technology. This new approach could possibly reduce or eliminates possible leakage of CO2 from an underground formation.
Bennion and Bachu[29] studied permeability and relative permeability at reservoir conditions for CO2-Water systems for different caprocks. They found that any appreciable losses of CO2 over a non-geological time scale would be minimal to non-existent. Burnside and Naylor[30] discussed the geological trapping mechanisms, which can guarantee immobilization of CO2 in the reservoir, even in the event of leakage. They found that all the shale samples and all but three carbonate samples have low KrCO2 values (P<0.2). The main goal of Eshraghi et al.[31] work is to minimize the fraction of cumulatively produced CO2 to cumulatively produced oil. According to their results of several simulations and optimizations and compared to reservoir history, amounts of stored CO2 and recovered oil increased for a real geological formation. Ziabakhsh-Ganji and Kooi[32] investigated the impact of the presence of other gases (impurities) in the injected CO2 stream on Joule-Thomson cooling. Their main results showed that the presence of gases (impurities) affects both the spatial extent of the zone around the wellbore in which cooling occurs and the magnitude of cooling. Al-Bazali et al.[33] did an observation regarding thermal and pressure transients in carbon dioxide wells. Injection of carbon dioxide-rich gases can cause substantial cooling of the reservoir close to the injection point. The effect of this cooling on reservoir properties needs further investigation.
1.5.1 Temperature Affects the Interfacial Tension
A fundamental understanding of surfactant adsorption at water/oil interfaces is crucial for many industrial processes, including oil recovery[34]. The interfacial tension at a water/oil interface normally decreases as temperature rises. Surfactants may greatly exacerbate the situation; as a result, the interfacial tension may either increase or decrease as the temperature rises[35]. Increasing in temperature can reduce the amount of time an interfacial tension needs to reach equilibrium. Temperature also affects the dynamic interfacial tension. However, due to synergism, the effect of temperature on the interfacial tension between an oil and a surfactant solution in a mixing surfactant system is not noteworthy[35]. In many engineering processes, such as microcellular foaming, where the surface tension between a polymer melt and fluid is a key determinant of cell nucleation and growth, the surface tension of polymers in a supercritical fluid is one of the most significant physicochemical characteristics[36]. Previously, a study reported the polystyrene surface tension in supercritical carbon dioxide and theoretical estimates for a related system. By using the Axisymmetric Drop Shape Analysis-Profile (ADSA-P), which involves designing and building a high-pressure and temperature cell to assist the production of a pendant drop of polystyrene melt, the surface tension is ascertained. To model the surface tension of a related system, self-consistent field theory (SCFT) calculations are used, and good qualitative agreement with the experiment is found[37]. In conclusion, the temperature affects the interfacial tension because the cohesive forces are reduced as molecule thermal activity rises, and surface tension generally decreases as temperature rises. The sticky effect liquid molecules have at the interface is what causes the environment to have an impact.
1.5.2 Temperature Affects the Viscosity of Oil
Viscosity is a measure of an oil’s flow resistance[38]. In general, a liquid’s viscosity decreases, and it gets easier to pour as its temperature rises; this means the temperature is inversely proportional to the viscosity of oil[39]. The temperature impacts viscosity, just like it does with other physical characteristics; a lower temperature results in a higher viscosity. The viscosity of the majority of oils varies greatly as a function of temperature logarithm. At low temperatures, oils that flow easily at high temperatures can create a slow-moving, viscous mass[40]. In a previous study, the effects of temperature on relative permeability to oil and water were examined using a heavy-oil sample taken from a block of Venezuelan oil. According to this study’s findings, fluid flow capability is drastically unbalanced between oil and water, with relative permeability being high in the oil phase and very low in the water phase. At equal-permeability sites, irreducible water saturation grows linearly with temperature, residual oil saturation decreases nonlinearly, and water saturation increases nonlinearly[41]. A variety of factors influence the viscosity of oils. These include an oil’s density, molecular weight, melting point, and level of unsaturation, among other physical and chemical characteristics. However, the temperature significantly impacts the viscosity of oils[42]. According to certain reports, the viscosity of fats and oils linearly reduced with temperature[43]. Surprisingly, little is known about how the temperature affects the viscosity of solutions of oils. However, a study using a capillary viscometer to measure the viscosity of a maize oil-ligroine solution at 0 to 100% corn oil found that the viscosity reduced as the temperature rose from 25 to 80°C[44].
After looking into these earlier studies that shed light on the shale sealing capacity, it was discovered that the majority of them were carried out at ambient temperature, which does not accurately reflect in-situ circumstances. In addition, these studies did not observe the impact of temperature on the interacting fluids and their physical properties, petrophysical properties of shale such as permeability and porosity, and physicochemical properties of shale such as clay swelling, water activity, and water content. The physical and chemical characteristics of shale and CO2 can vary thermally, which can have an impact on shale sealing ability.
In this study, changes in capillary entry pressure of CO2 have been studied, with shale under variant ranges of temperatures such as 25-250°C. Moreover, how temperature affects shale’s physicochemical and petrophysical characteristics was also discussed. The impact of temperature on a wet angle, pore throat radius, and the interfacial tension between CO2 and shale pore fluid is investigated. CO2 sequestration in shale formations projects may be compromised if the temperature impact is completely ignored.
2 MATERIALS AND METHODS
In the current study, three shale types, shales A, B, and C, were investigated. Shales A, B, and C have been donated by an oil company in Kuwait for research studes. When shale cores arrived at Kuwait University, they were coated and covered in a thick polyethylene bag and well-preserved in a closed barrel. This handling procedure avoids shale pore structure contamination by air since air penetration could cause shale properties alteration.
To avoid shale damage such as microfractures, fissures, and cracks, the polyethylene bag was carefully removed, and the shale cores were immediately uncovered and entirely immersed in cans full of mineral oil. The immersion of shale cores in mineral oil prevents air interaction with shale and preserves its native water content and activity[45]. The petrophysical properties and mineralogical composition of shales A, B, and C are shown in Tables 1 and 2, respectively.
Table 1. Petrophysical Properties of Shales A, B, and C
|
Water Content (%) |
Water Activity |
Porosity (%) |
Permeability (Milli Darcy) |
Shale (A) |
5.9 |
0.91 |
15.3 |
3.1 E-06 |
Shale (B) |
6.1 |
0.86 |
13.8 |
1.3 E-06 |
Shale (C) |
5.8 |
0.89 |
14.7 |
2.7 E-06 |
Table 2. Mineralogical Composition of Shales A, B, and C
X-Ray Diffraction |
Shale (A) % by Weight |
Shale (B) % by Weight |
Shale (C) % by Weight |
Quartz |
17 |
23 |
19.8 |
Feldspar |
3.8 |
3.9 |
4 |
Calcite |
2.9 |
0 |
1.9 |
Dolomite |
7.5 |
1.6 |
3.1 |
Pyrite |
2.3 |
1.9 |
2 |
Siderite |
1.1 |
3.7 |
3.5 |
Total clay |
64.1 |
64.5 |
68.5 |
Chlorite |
3.1 |
2.9 |
3.2 |
Kaolinite |
6.4 |
5.5 |
6.1 |
Illite |
11.8 |
15 |
14.8 |
Smectite |
11.5 |
11.7 |
12.1 |
Mixed layer |
31.3 |
29.4 |
32.3 |
This test was used to measure the capillary entry pressure of shale when interacting with CO2 under variant temperatures. Figure 2 shows the experimental setup and equipment for the minimum capillary entry pressure test. The equipment and experimental setup shown in Figure 2 are fitted inside a heavy-duty oven; therefore, the temperature can be changed as needed.
The shale sample was located in the main cell. The CO2 was positioned at the top chamber vessel, where a pressure regulator was used to control the pressure of injected CO2. Attached cylinder to the vessel’s bottom chamber. The pressure vessel’s top chamber and the main cell were joined by a flow pipe, allowing CO2 to enter the shale. A pressure gauge was positioned inside the flow line to investigate the pressure of CO2.
Additionally, a valve is added to the flow pipe to drain the CO2 after the test is finished. On the opposite side of the main cell, a volume chamber was connected to the bottom of the cell. This chamber is filled with a simulated pore fluid and pressurized to 50psi using an injection pump. A pressure gauge was used to monitor pressure changes in this chamber. The following steps were taken to measure the capillary entry pressure of CO2 through shale:
1) Insert the shale sample in the main cell situated inside the oven and set the oven’s temperature to the desired temperature.
2) The injection pump fills the downstream chamber with simulated pore fluid and pressurizes to 50psi. Using a simulated pore fluid prevents water exchange between shale and the downstream chamber by chemical osmosis.
3) Fill the top compartment of the pressure chamber, connected to the CO2 cylinder, with CO2.
4) Open the CO2 cylinder by opening the valve above it, allowing CO2 to flow through the bottom compartment, forcing the piston to push the CO2 in the top compartment through the shale.
5) The flowing CO2 pressure is monitored through pressure (P2), while the simulated pore pressure in the downstream chamber is monitored through pressure (P1).
6) If the simulated pore pressure in the downstream chamber did not change, increase the CO2 flowing pressure by allowing more volume of CO2 to flow from the CO2 cylinder.
7) Once a pressure change is detected in the downstream chamber (P1), the test is terminated, and the pressure reading on pressure (P2) reflects the capillary entry pressure of CO2 through the shale sample at the set temperature.
8) Change the oven temperature to a different value and repeat the test to obtain the capillary entry pressure of CO2 through shale at the new temperature. A full description of the experimental protocol is found in a previous study conducted by Al-Bazali et al[9].
|
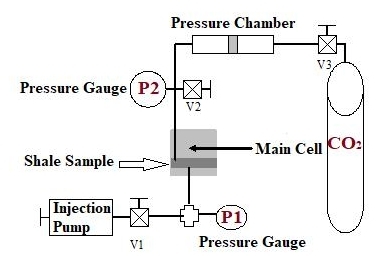
Figure 2. Experimental setup and equipment used for capillary entry pressure test.
3.1 General Analysis of Capillary Entry Pressure When Shale Interacts with CO2
Table 3 and Figure 3A show experimental results of capillary entry pressure measurements with three different shales interacting with CO2 at variant temperatures (25-250°C).
Table 3. Capillary Pressure Measurements for Shales A, B, and C at Different Temperatures
Temperature (°C) |
Shale A (Pc), psi |
Shale B (Pc), psi |
Shale C (Pc), psi |
25 |
480 |
560 |
630 |
100 |
461 |
510 |
577 |
150 |
428 |
482 |
543 |
200 |
399 |
470 |
530 |
250 |
401 |
468 |
533 |
Figure 3A shows the difference in the capillary entry pressure values of shales A, B, and C, where shale A has the lowest values of capillary entry pressure and shale C has the largest values of capillary entry pressure. Many parameters can affect shale capillary entry pressure, such as chemical composition, petro-physical properties, wettability, fluid properties (interfacial tension and wettability angle), density differences between fluid pairs, and formation saturation history[46]. The difference in capillary entry pressure can be attributed to the differences in these parameters for each shale. Figure 3B, shows the values of capillary pressure for shales A and C decreased until 200°C, after which it increased slightly. However, the values of capillary entry pressure for shale B decreased for all temperatures.
Based on Equation (1), capillary entry pressure depends on three factors; interfacial tension (σ), wettability angle (θ), and shale pore throat radius (r). Capillary entry pressure was in contrast to pore throat radius (r), where an increase in (r) will cause a decrease in the capillary entry pressure of shale. It can be argued that increasing temperature may have caused pore dilation. Pore dilation is scientifically defined as the enlarging, expanding, or widening of pores which will cause an increase in the pore throat radius of shale[47].
The second parameter that must be discussed is interfacial tension directly proportional to capillary entry pressure. When the value of interfacial tension decreases, the value of capillary entry pressure will decrease and vice versa. It has been stated that increasing temperature will affect interfacial tension between two immiscible fluids[48-51]. These studies, among others, have shown that an increase in temperature decreases the interfacial tension between two immiscible fluids owing to the weakening of intermolecular forces at the two immiscible fluids’ interface. According to Equation (1), a decrease in interfacial tension between two immiscible fluids will cause a decrease in capillary entry pressure developed at their interface.
The third parameter that needs to be investigated is the wettability angle. As found in the literature, there was a discrepancy between studies regarding wettability angle (θ), where some studies found that (θ) would increase with temperature[52], and other studies found that wettability angle (θ) would decrease with increasing temperature[53-55]. This discrepancy may be attributed to differences in salt concentration, salt type, or surface roughness. This shows that the wettability angle may increase or decrease with temperature depending on the parameters involved. We believe that the combined effect of wettability angle and interfacial tension may have caused a decrease in the capillary entry pressure of shale.
The Figure 3C shows the values of capillary entry pressures at 250°C increased in shales A and C and decreased for shale B. A closer look at the mineralogical composition for the three shales indicates that this increase is due to shale swelling because shales A and C contain larger amounts of swelling clay (smectite and mixed layers) than shale B. Smectite and mixed layers clays are highly swelling clays containing high amount of montmorillonite clay which causes water adsorption and subsequent clay swelling. Generally, clays are divided into two types: macroscopically swelling, ‘active’ clays, and ‘passive’ or non-swelling clays. According to Al-Bazali et al.[56-59] temperature could induce a transition that turns passive non-swelling clay to active swelling clay. Stacks of clay particles are kept together by net attractive forces at low temperatures, however, at higher temperatures, swelling of the clay is advantageous energetically due to the entropy acquired by counterions released during swelling.
The sum of smectite and mixed layers ‘active clays’ in shales A, B, and C were found to be 42.8, 41.1, and 44.4 %by weight, respectively. Shale B has the lowest amount of swelling “active” clay, which could explain why the capillary pressure did not increase at 250 °C. This could be since the amount of active clay was not enough to cause shale swelling at 250 °C. At 250 °C, shale C had a larger increase in capillary entry pressure than shale A. This may be attributed to the larger amount of active swelling clay in shale C than in shale A. Clay swelling may cause an apparent decrease in shale pore throat radii, which translates into higher capillary entry pressure, according to Equation (1), as CO2 interacts with shale.
|
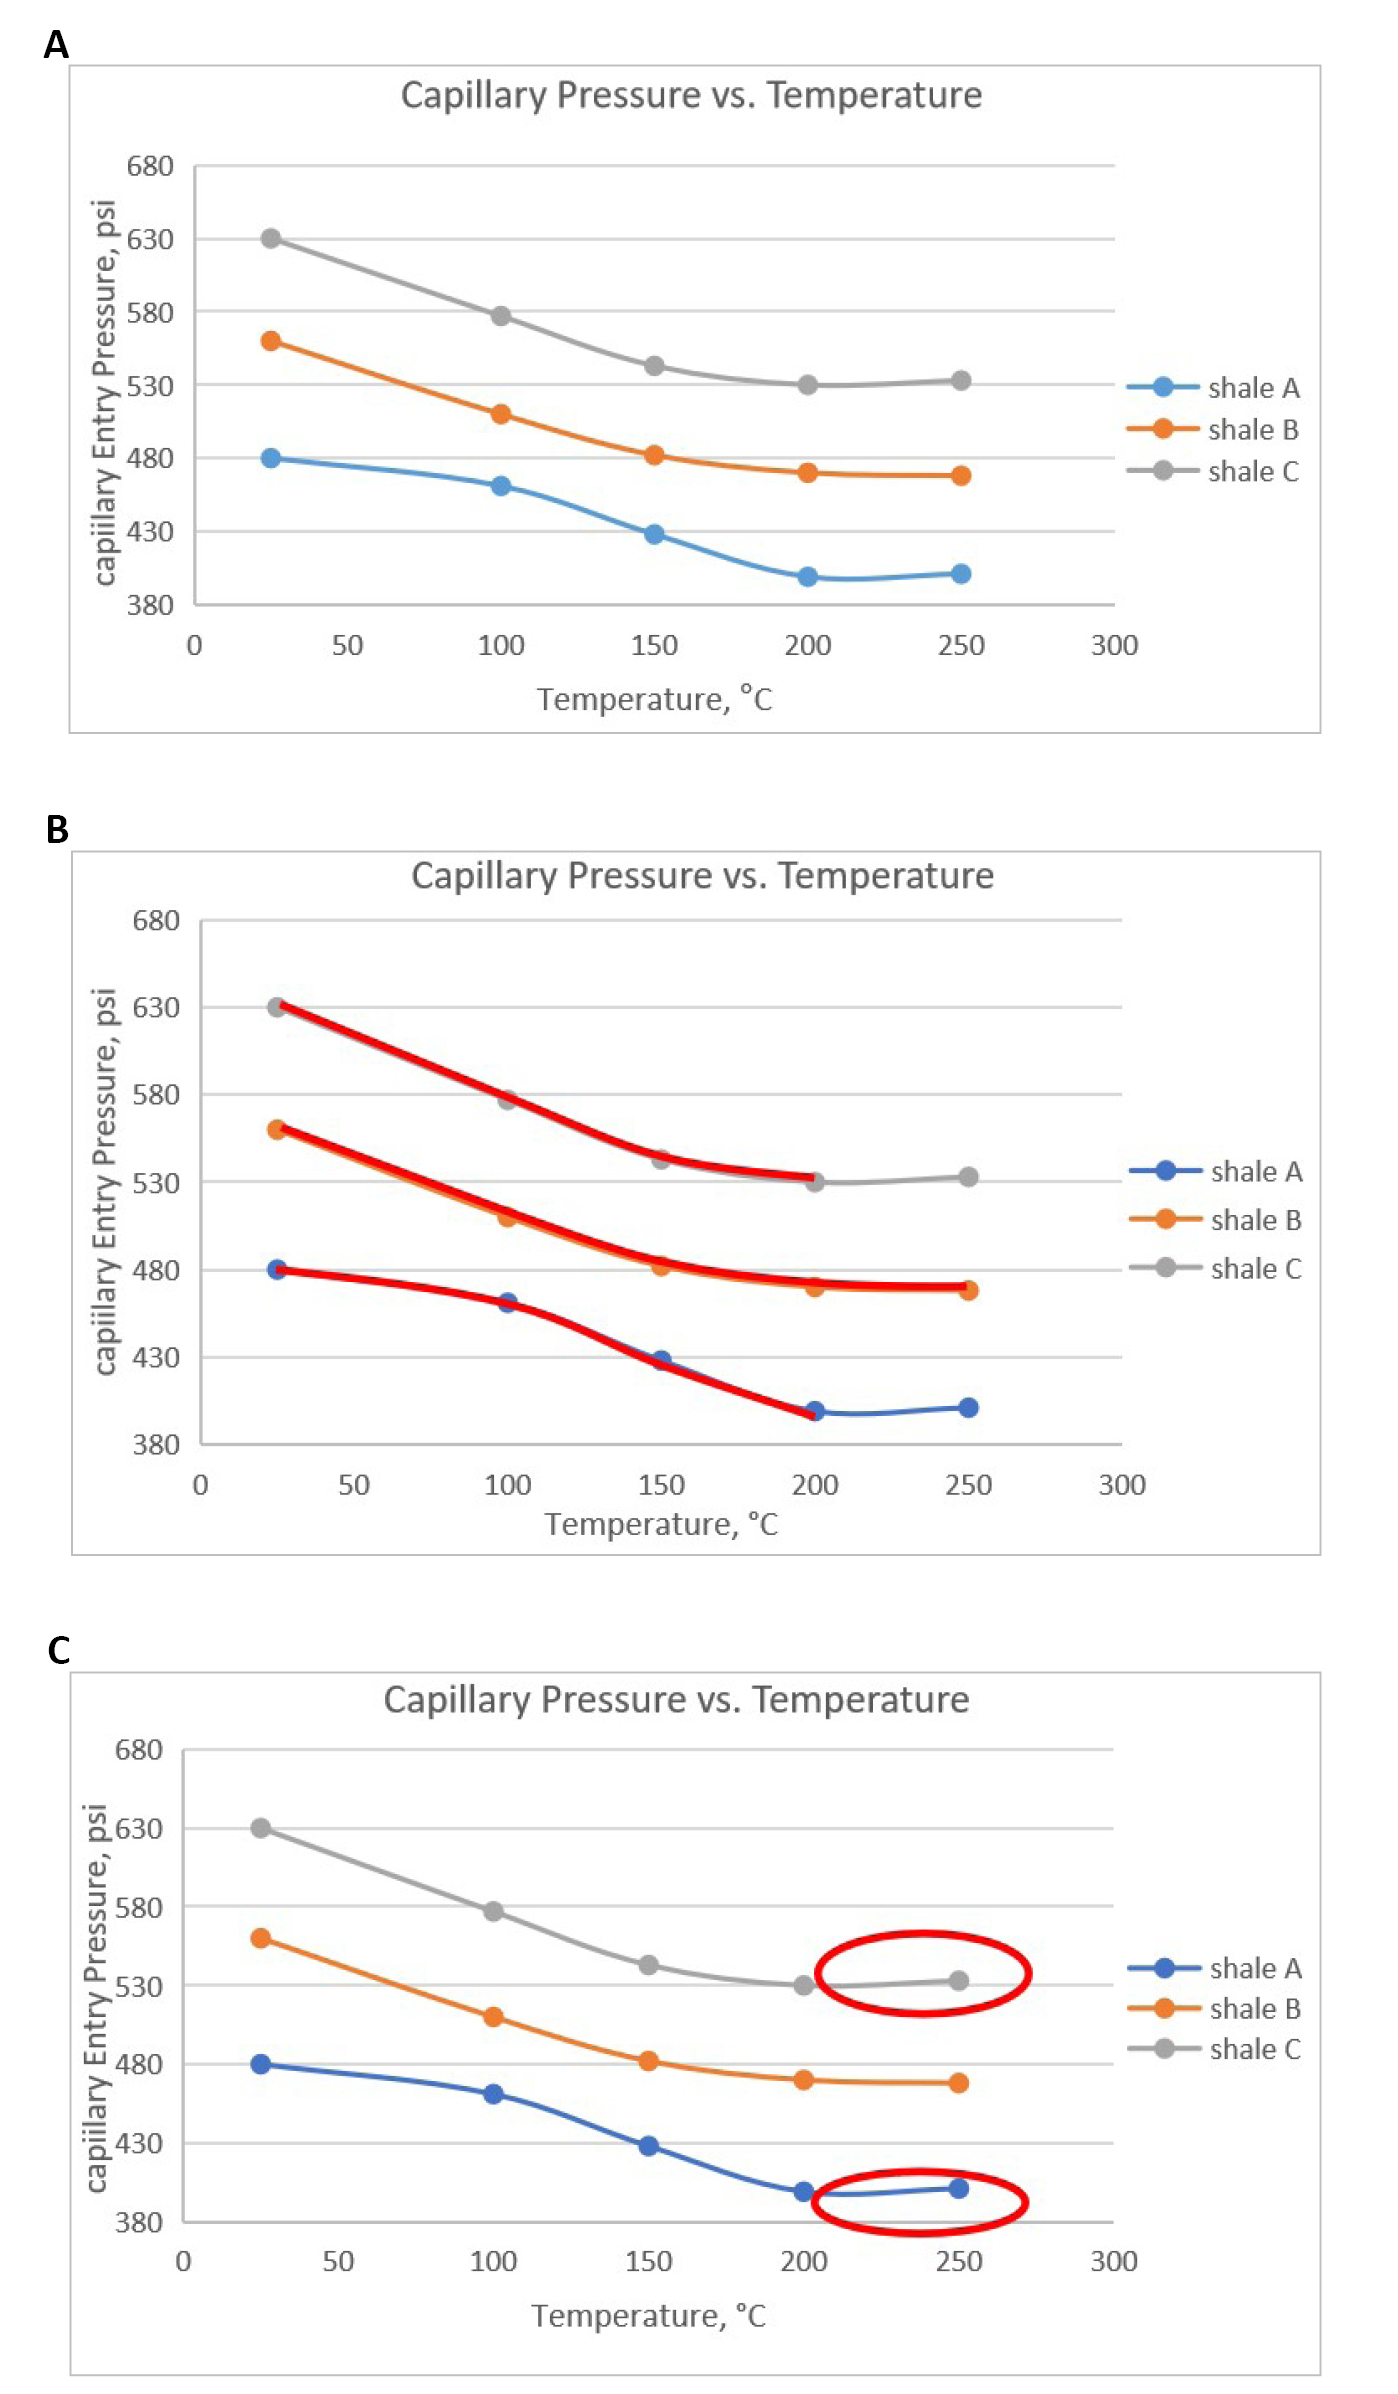
Figure 3. Capillary entry pressure for shales A, B, and C. A: Capillary entry pressure for shales A, B, and C at variant temperatures; B: Capillary entry pressure for shales A and C VS shale B at variant temperatures; C: A look at capillary entry pressure for shales A, B, and C at 250°C.
3.2 Impact of Water Content (w%) on Capillary Entry Pressure
Figure 4 shows measured capillary entry pressure versus shale water content as a temperature function. Water content is defined as the ratio of the weight of water to the weight of the solids for a given mass of material and is usually expressed as a percentage[60]. There exists no distinct relationship between shale water content and the expected capillary entry pressure as shale interacts with CO2. The impact of water content may be levied within other factors such as pore throat radii. Green et al., 2008 argue that the capillary entry pressure of shale caprocks decreases with an increasing water content of shale due to the spontaneous imbibition of water. Due to imbibition, the increase in water saturation causes an increase in its relative permeability and decrease in capillary pressure since the capillary pressure is inversely proportional to relative permeability[61].
|
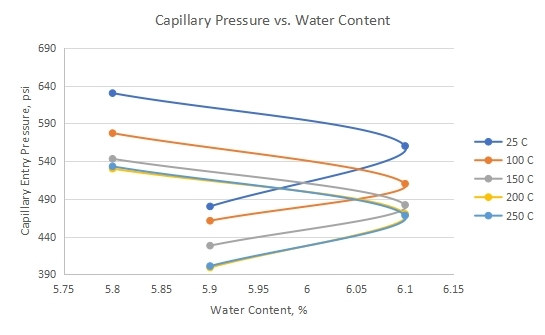
Figure 4. Measured capillary entry pressure versus shale’s water content as a temperature function.
3.3 Impact of Water Activity (aw) on Capillary Entry Pressure
Water activity (aw) is the difference between the vapour pressure of pure water at a given temperature and the vapor pressure of water vapor in a substance[62]. Figure 5 illustrated the measured capillary entry pressure as a function of shale water activity as shale interacts with CO2 at different temperatures. Same as water content, there is no consistent relationship between shale water activity and measured capillary entry pressure. This could be attributed to shale’s mineralogical and chemical composition. It can be seen that the measured capillary entrance pressure reductions as temperature decreases regardless of the shale water activity. This leads me to believe that the impact of water activity on the capillary entry pressure of shale is secondary as other primary factors such as interfacial tension, pore throat radii, and wettability angle plays a more dominant role, as discussed in section 6.1.
|

Figure 5. Measured capillary entry pressure versus water activity of shale as a function of temperature.
3.4 Impact of Shale Permeability on Capillary Entry Pressure
The average pore throat radius of shale pores serves as a proxy for shale permeability. The following equation can be used to convert the typical shale’s pore radius to the shale’s permeability:
|
From Equation (1), it can be concluded that pore radius is inversely proportional to capillary entry pressure. This means that low permeability shales should record higher capillary entry pressures than high permeability shales. This did not happen consistently in our experiments, as shown in Figure 6. In Figure 6, shale C (k=2.7 E-06 Milli Darcy) had higher capillary entry pressure than shale B (k=1.3 E-06 Milli Darcy) at all applied temperatures. This is counter-intuitive and could be related to the effect of temperature on pore throat radii size and structure. Rocks are composed of minerals, a bounding matrix, and cracks and pores[63]. Temperature fluctuations are one of the main factors affecting rocks’ integrity and physical characteristics in engineering rock structures. It causes the creation of new cracks and microcracks in the rock, altering its microstructure and contributing to an increase in the volume of the space[64]. Pore throat radii may have experienced pore dilation upon exposure to heat, which may have caused changes in pore throat radii sizes. The mechanism is known as “pore dilation” which is used to allow heat to change the size of pore throats. A porosity change influences rock’s transport properties and elastic moduli while circulating water in a geothermal reservoir[65]. Different shales may respond to heat differently depending on the shale texture, fabric, pore network structure, and mineralogical composition. Therefore, higher temperatures could have changed the mechanical structure of shale by impacting its pore throat size and distribution. Consequently, excessive heat could have affected the size of shale’s largest pore throat, which may have caused lower-than-expected capillary entry pressures for shale B. In a previous study, the rock samples were exposed to 200, 400, 600, 800, and 1000 °C, respectively to check the integrity, physical, and mechanical properties. Their obtained findings revealed that the density values did not change. However, the porosity of natural rocks was significantly increased with the increased temperature (P<0.05)[66].
Measured capillary entry pressures for shale A (k=3.1 E-06 Milli Darcy) came in expectation and agreement with Equations (1) and (3). Shale A had the highest permeability and, in turn, would have the highest pore throat radii and should record the lowest capillary entry pressure, as seen in Table 3.
|
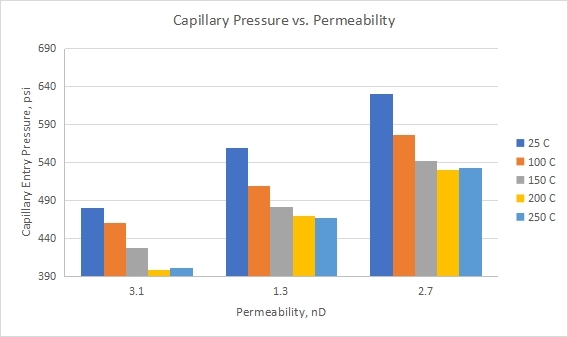
Figure 6. Measured capillary entry pressure versus permeability of shale as a function of temperature.
3.5 Impact of Shale Porosity on Capillary Entry Pressure
The porosities of shales A, B, and C correlate very well with their permeabilities, as shown in Table 4.
Table 4. Porosities and Permeabilities of Shales A, B, and C
|
Porosity (%) |
Permeability (Milli Darcy) |
Shale A |
15.3 |
3.1 E-06 |
Shale B |
13.8 |
1.3 E-06 |
Shale C |
14.7 |
2.7 E-06 |
On average, low permeability rocks should have smaller pore throat radii and thus exhibit higher capillary entry pressure. Our data did not follow this argument precisely because shale B (f=13.8%) showed lower capillary entry pressure than shale C (f=14.7%). Shale A (f=15.3%) seems to agree with our expectations.
We could use the same argument that we used in section 6.4, where heat could have altered the pore throat radii and caused pore dilation. Shales A, B, and C pore structures responded differently to applying heat depending on each shale fabric, texture, and mechanical properties. This pore dilation may have been responsible for the measured capillary entry pressure discrepancy.
4 CONCLUSIONS AND RECOMMENDATIONS
The following conclusions and recommendations were drawn from this work:
1) Differences in the capillary entry pressure values of shales A, B, and C can be attributed to the differences in petrophysical properties, chemical composition, wettability, fluid properties (interfacial tension and wettability angle), density differences between fluid pairs, and formation saturation history for each shale.
2) The capillary entry pressure of shales A and C decreased until 200 °C, after which it increased slightly.
3) The values of capillary entry pressure for shale B decreased at all temperatures.
4) With the temperature increasing, pores are exposed to a phenomenon called pore dilation. Pore dilation means the action of enlarging, expanding, or widening pores which will cause an increase in the pore throat radius r.
5) Interfacial tension decreases with increasing temperature, which can be attributed to the weakening of intermolecular forces at the two immiscible fluids interface.
6) Wettability angle discrepancy may be attributed to differences in salt concentration, salt type, or surface roughness.
7) At 250 °C, capillary entry pressure increased for shales A and C, which may be attributed to the swelling of clay minerals.
8) Swelling of clay could be related to the temperature-induced transition from passive to active clay.
9) The amount of swelling clay in shale C was higher than in shale A which could explain why the increase of capillary entry pressure at 250 °C in shale C was higher than in shale A.
10) There exists no distinct relationship between shale water content and water activity, and the expected capillary entry pressure as shale interacts with CO2.
11) Heat could alter the pore throat radii and cause pore dilation. This pore dilation may have been responsible for the measured capillary entry pressure discrepancy.
12) Shales A, B, and C pore structure responded differently to the application of heat depending on each shale fabric, texture, and mechanical properties.
13) It is recommended to elevate pressure with elevating the temperature to investigate the effect of increasing pressure and temperature together, in in-situ conditions.
Acknowledgments
Conflicts of Interest
The authors declared that there was no funding, grants, or other support was received for conducting this study. Moreover, the authors had no relevant financial or non-financial interests to disclose.
Author Contribution
The manuscript was written through the contributions of both authors. Both authors had approved the final version of the manuscript.
Abbreviations List
MICP, Mercury injection capillary pressure
Pc, min, Minimum capillary entry pressure
PCO2, Pressure in CO2 phase
Pwater, pressure in the water phase
g, Acceleration due to gravity
h, Sealing capacity of shale
k, Shale’s permeability
r, Shale’s pore throat radius
θ, Wettability angle
ρo, density of oil
ρw, density of water
Σ, Interfacial tension between CO2 and water
, Shale’s porosity
σ, Interfacial tension
References
[1] Qiao Z, Wang Z, Zhang C et al. PVAm-PIP/PS composite membrane with high performance for CO2/N2 separation. AIChE J, 2013; 59: 215-228. DOI: 10.1002/aic.13781
[2] Shukla R, Ranjith P, Haque A et al. A review of studies on CO2 sequestration and caprock integrity. Fuel, 2010; 89: 2651-2664. DOI: 10.1016/j.fuel.2010.05.012
[3] Benson SM, Cole DR. CO2 sequestration in deep sedimentary formations. Elements, 2008; 4: 325-331. DOI: 10.2113/gselements.4.5.325
[4] Broadhead R. Petroleum Geology: an Introduction. Socorro, New Mexico: New Mexico Bureau of Geology and Mineral Resources, 2012.
[5] Traps P. Gas Oil. Mang T et al. Encyclopedia of Lubricants and Lubrication. Springer: Berlin, German, 2014; 727-727. DOI: 10.1007/978-3-642-22647-2_200181
[6] Espinoza DN, Santamarina JC. CO2 breakthrough-Caprock sealing efficiency and integrity for carbon geological storage. Int J Greenh Gas Con, 2017; 66: 218-229. DOI: 10.1016/j.ijggc.2017.09.019
[7] Jennings JB. Capillary Pressure Techniques: Application to exploration and development geology. AAPG Bulletin, 1987; 71: 1196-1209. DOI: 10.1306/703c8047-1707-11d7-8645000102c1865d
[8] Egermann P, Lombard JM, Bretonnier P. A fast and accurate method to measure threshold capillary pressure of caprocks under representative conditions: International Symposium of the Society of Core Analysts, Trondheim, Norway, 12-16 September 2006.
[9] Al-Bazali TM, Zhang J, Chenevert ME et al. Estimating the reservoir hydrocarbon capacity through measurement of the minimum capillary entry pressure of shale caprocks: SPE Annual Technical Conference and Exhibition, New Orleans, USA, 4-7 October 2009. Texas, USA: Society of Petroleum Engineers; 2009.
[10] Chang YB, Lim MT, Pope GA et al. CO2 flow patterns under multiphase flow: Heterogeneous field-scale conditions. SPE Reprint Series, 1994; 9: 208-216. DOI: 10.2118/22654-PA
[11] Berg RR. Capillary pressures in stratigraphic traps. AAPG bulletin, 1975; 59: 939-956. DOI: 10.1306/83D91EF7-16C7-11D7-8645000102C1865D
[12] Favero V, Laloui L. Impact of CO2 injection on the hydro-mechanical behaviour of a clay-rich caprock. Int J Greenh Gas Con, 2018; 71: 133-141. DOI: 10.1016/j.ijggc.2018.02.017
[13] Farokhpoor R, Bjørkvik BJA, Lindeberg E et al. Wettability behaviour of CO2 at storage conditions. Int J Greenh Gas Con, 2013; 12: 18-25. DOI: 10.1016/j.ijggc.2012.11.003
[14] Pini R, Krevor SCM, Benson SM. Capillary pressure and heterogeneity for the CO2/water system in sandstone rocks at reservoir conditions. Adv Water Resour, 2012; 38: 48-59. DOI: 10.1016/j.advwatres.2011.12.007
[15] Comisky JT, Santiago M, McCollom B et al. Sample size effects on the application of mercury injection capillary pressure for determining the storage capacity of tight gas and oil shales: Canadian unconventional resources conference, Calgary, Canada, 15-17 November 2011. USA: Society of Petroleum Engineering; 2011. DOI: 10.2118/149432-MS
[16] Zhang J, Yu M, Al-Bazali T et al. Maintaining the stability of deviated and horizontal wells: Effects of mechanical, chemical and thermal phenomena on well designs: International Oil & Gas Conference and Exhibition in China, Beijing, China, 5-7 December 2006. USA: Society of Petroleum Engineering; 2006. DOI: 10.2118/100202-MS
[17] Abdoulghafour H, Sarmadivaleh M, Hauge LP et al. Capillary pressure characteristics of CO2-brine-sandstone systems. Int J Greenh Gas Con, 2020; 94: 102876. DOI: 10.1016/j.ijggc.2019.102876
[18] Plug WJ, Bruining J. Capillary pressure for the sand-CO2-water system under various pressure conditions. Application to CO2 sequestration. Adv Water Resour, 2007; 30: 2339-2353. DOI: 10.1016/j.advwatres.2007.05.010
[19] Dewhurst DN, Jones RM, Raven MD. Microstructural and petrophysical characterization of Muderong Shale: application to top seal risking. Petrol Geosci, 2002; 8: 371-383. DOI: 10.1144/petgeo.8.4.371
[20] Donnelly B, Perfect E, McKay LD et al. Capillary pressure-saturation relationships for gas shales measured using a water activity meter. J Nat Gas Sci Eng, 2016; 33: 1342-1352. DOI: 10.1016/j.jngse.2016.05.014
[21] Olabode A, Radonjic M. Experimental investigations of caprock integrity in CO2 sequestration. Energy Procedia, 2013; 37: 5014-5025. DOI: 10.1016/j.egypro.2013.06.415
[22] Chenevert ME, Amanullah M. Shale preservation and testing techniques for borehole-stability studies. SPE Drill Compl, 2001; 16: 146-149. DOI: 10.2118/73191-PA
[23] Hale AH, Mody FK, Salisbury DP. The influence of chemical potential on wellbore stability. SPE Drill Compl, 1993; 8: 207-216. DOI: 10.2118/23885-PA
[24] Vavra CL, Kaldi JG, Sneider RM. Geological applications of capillary pressure: a review. AAPG bulletin, 1992; 76: 840-850. DOI: 10.1306/bdff88f8-1718-11d7-8645000102c1865d
[25] Seyyedattar M, Ghiasi MM, Zendehboudi S et al. Determination of bubble point pressure and oil formation volume factor: Extra trees compared with LSSVM-CSA hybrid and ANFIS models. Fuel, 2020; 269: 116834. DOI: 10.1016/j.fuel.2019.116834
[26] Busch A, Alles S, Gensterblum Y et al. Carbon dioxide storage potential of shales. Int J Greenh Gas Con, 2008; 2: 297-308. DOI: 10.1016/j.ijggc.2008.03.003
[27] Mathias SA, McElwaine JN, Gluyas JG. Heat transport and pressure buildup during carbon dioxide injection into depleted gas reservoirs. J Fluid Mech, 2014; 756: 89-109. DOI: 10.1017/jfm.2014.348
[28] Zendehboudi S, Khan A, Carlisle S et al. Ex situ dissolution of CO2: A new engineering methodology based on mass-transfer perspective for enhancement of CO2 sequestration. Energ Fuel, 2011; 25: 3323-3333. DOI: 10.1021/ef200199r
[29] Bennion DB, Bachu S. Permeability and relative permeability measurements at reservoir conditions for CO2-water systems in ultra low permeability confining caprocks: EUROPEC/EAGE Conference and Exhibition, London, UK, 11-14 June 2007. USA: Society of Petroleum Engineering; 2007. DOI: 10.2523/106995-ms
[30] Burnside NM, Naylor M. Review and implications of relative permeability of CO2/brine systems and residual trapping of CO2. Int J Greenh Gas Con, 2014; 23: 1-11. DOI: 10.1016/j.ijggc.2014.01.013
[31] Eshraghi SE, Rasaei MR, Zendehboudi S. Optimization of miscible CO2 EOR and storage using heuristic methods combined with capacitance/resistance and Gentil fractional flow models. J Nat Gas Sci Eng, 2016; 32: 304-318. DOI: 10.1016/j.jngse.2016.04.012
[32] Ziabakhsh-Ganji Z, Kooi H. Sensitivity of Joule-Thomson cooling to impure CO2 injection in depleted gas reservoirs. Appl Energ, 2014; 113: 434-451. DOI: 10.1016/j.apenergy.2013.07.059
[33] Al-Bazali TM, Zhang J, Chenevert ME et al. An experimental investigation on the impact of diffusion osmosis, chemical osmosis, and capillary suction on shale alteration. J Porous Media, 2008; 11: 719-731. DOI: 10.1615/JPorMedia.v11.i8.20
[34] Iglauer S, Favretto S, Spinelli G et al. X-ray tomography measurements of power-law cluster size distributions for the nonwetting phase in sandstones. Phys Rev E, 2010; 82: 056315.
[35] Kovalchuk VI, Loglio G, Bykov AG et al. Effect of temperature on the dynamic properties of mixed surfactant adsorbed layers at the water/hexane interface under low-gravity conditions. Colloid Interfac, 2020; 4: 27. DOI: 10.3390/colloids4030027
[36] Ye Z, Zhang F, Han L et al. The effect of temperature on the interfacial tension between crude oil and gemini surfactant solution. Colloid Surfaces A, 2008; 322: 138-141. DOI: 10.1016/j.colsurfa.2008.02.043
[37] Park H, Thompson RB, Lanson N et al. Effect of temperature and pressure on surface tension of polystyrene in supercritical carbon dioxide. J Phys Chem B, 2007; 111: 3859-3868. DOI: 10.1021/jp065851t
[38] Meyer RF, Attanasi ED. Heavy oil and natural bitumen-strategic petroleum resources. World, 2003; 434: 650-7.
[39] Clifford AA, Williams JR. Introduction to Supercritical Fluids and Their Applications. In: Williams JR, Clifford AA eds. Supercritical Fluid Methods and Protocols. Methods In Biotechnology. Humana Press: New Jersey, US, 2000; 1-16. DOI: 10.1385/1-59259-030-6:1
[40] Wang Z, Fingas M, Yang C et al. Crude oil and refined product fingerprinting: Principles. In Morrison RD, Murphy BL ed. Environmental forensics. Academic Press: Cambridge, UK, 1964; 339-407. DOI: 10.1016/B978-012507751-4/50038-0
[41] Qin Y, Wu Y, Liu P et al. Experimental studies on effects of temperature on oil and water relative permeability in heavy-oil reservoirs. Sci Rep-UK, 2018; 8: 1-9. DOI: 10.1038/s41598-018-31044-x
[42] Igwe IO. The effects of temperature on the viscosity of vegetable oils in solution. Ind Crop Prod, 2004; 19: 185-190. DOI: 10.1016/j.indcrop.2003.09.006
[43] Peredi J, Szungyi M, Olaj, Szappan, Kozmetika. 1976; 25: 45.
[44] Zhmyria LP, Orel AI, Dadenkova MN. Viscosity and density of the maize oil-benzine system. Izv Vyssh Uchenbn Zaveid Pishch Technol, 1980; 2: 126.
[45] Al-Bazali T, Zhang J, Chenevert ME et al. Experimental and numerical study on the impact of strain rate on failure characteristics of shales. J Petrol Sci Eng, 2008; 60: 194-204. DOI: 10.1016/j.petrol.2007.09.001
[46] McPhee C, Reed J, Zubizarreta I. Developments in Petroleum Science. Elsevier: Amsterdam, Netherlands, 2015; 449-517. DOI: 10.1016/B978-0-444-63533-4.00009-3
[47] Schwartz B, Huffman K, Thornton D et al. The effects of mineral distribution, pore geometry, and pore density on permeability evolution in gas shales. Fuel, 2019; 257: 116005. DOI: 10.1016/j.fuel.2019.116005
[48] Jennings HY, Newman GH. The effect of temperature and pressure on the interfacial tension of water against methane-normal decane mixtures. Soc Petrol Eng J, 1971; 11: 171-175. DOI: 10.2118/3071-PA
[49] Okasha TM, Al-Shiwaish AA, Aramco S et al. Investigation of the effect of temperature and pressure on interfacial tension and wettability of shu'aiba reservoir, saudi arabia: 7th Middle East Geosciences Conference and Exhibition, Manama, Bahrain, 27-29 March 2006. AAPG Search and Discovery Article; 2006.
[50] Okasha TM, Al-Shiwaish AJA. Effect of temperature and pressure on interfacial tension and contact angle of Khuff gas reservoir, Saudi Arabia: SPE/DGS Saudi Arabia Section Technical Symposium and Exhibition, Al-Khobar, Saudi Arabia, 4-7 April 2010. USA, Society of Petroleum Engineers; 2010.
[51] Sarmadivaleh M, Al-Yaseri AZ, Iglauer S. Influence of temperature and pressure on quartz-water-CO2 contact angle and CO2-water interfacial tension. J Colloid Interf Sci, 2015; 441: 59-64. DOI: 10.1016/j.jcis.2014.11.010
[52] Saraji S, Piri M, Goual L. The effects of SO2 contamination, brine salinity, pressure, and temperature on dynamic contact angles and interfacial tension of supercritical CO2/brine/quartz systems. Int J Greenh Gas Con, 2014; 28: 147-155. DOI: 10.1016/j.ijggc.2014.06.024
[53] Al-Bazali TM, Zhang J, Chenevert ME et al. Capillary entry pressure of oil-based muds in shales: the key to the success of oil-based muds. Energ Source Part A, 2007; 30: 297-308. DOI: 10.1080/15567030600820609
[54] Fauziah CA, Al-Yaseri AZ, Beloborodov R et al. Carbon dioxide/brine, nitrogen/brine, and oil/brine wettability of montmorillonite, illite, and kaolinite at elevated pressure and temperature. Energ Fuel, 2018; 33: 441-448. DOI: 10.1021/acs.energyfuels.8b02845
[55] Saraji S, Goual L, Piri M et al. Wettability of supercritical carbon dioxide/water/quartz systems: Simultaneous measurement of contact angle and interfacial tension at reservoir conditions. Langmuir, 2013; 29: 6856-6866. DOI: 10.1021/la3050863
[56] Al-Bazali TM, Zhang J, Chenevert ME et al. A Rapid, Rigsite Deployable, Electrochemical Test for Evaluating the Membrane Potential of Shales. Paper presented at the SPE Annual Technical Conference and Exhibition, Dallas, Texas, October 2005. DOI: 10.2118/96098-MS
[57] Shirazi SM, Kazama H, Kuwano J et al. The influence of temperature on swelling characteristics of compacted bentonite for waste disposal. Environ Asia, 2010; 3: 60-64. DOI: 10.14456/ea.2010.9
[58] Akinwunmi B, Sun L, Hirvi JT et al. Influence of temperature on the swelling pressure of bentonite clay. Chem Phys, 2019; 516: 177-181. DOI: 10.1016/j.chemphys.2018.09.009
[59] Teich-McGoldrick SL, Greathouse JA, Jove-Colon CF et al. Swelling properties of montmorillonite and beidellite clay minerals from molecular simulation: comparison of temperature, interlayer cation, and charge location effects. J Phys Chem C, 2015; 119: 20880-20891. DOI: 10.1021/acs.jpcc.5b03253
[60] Vermeulen N. The water content of soils-Inaugural Lecture: 13th African Regional Conference on Soil Mechanics and Geotechnical Engineering, Marrakech, Morocco, September 2003.
[61] Al-Bazali TM. Membrane Efficiency Behavior in Shales [doctor’s thesis]. Austin, Texas: The University of Texas at Austin; 2003. DOI: 10.26153/tsw/7742
[62] Jarrett MA, Gusler B, Xiang T et al. Improved competence in water activity measurement: AADE Technical Conference, Houston, Texas, 6-7 April 2004.
[63] Yavuz H, Demirdag S, Caran S. Thermal effect on the physical properties of carbonate rocks. Int J Rock Mech Min, 2010; 47: 94-103. DOI: 10.1016/j.ijrmms.2009.09.014
[64] Chaki S, Takarli M, Agbodjan WP. Influence of thermal damage on physical properties of a granite rock: porosity, permeability and ultrasonic wave evolutions. Constr Build Mater, 2008; 22: 1456-1461. DOI: 10.1016/j.conbuildmat.2007.04.002
[65] Hassanzadegan A, Blöcher G, Milsch H et al. The effects of temperature and pressure on the porosity evolution of Flechtinger sandstone. Rock Mech Rock Eng, 2014; 47: 421-434. DOI: 10.1007/s00603-013-0401-z
[66] Ozguven A, Ozcelik Y. Effects of high temperature on physico-mechanical properties of Turkish natural building stones. Eng Geol, 2014; 183: 127-136. DOI: 10.1016/j.enggeo.2014.10.006
Copyright ©2022 The Author(s). This open-access article is licensed under a Creative Commons Attribution 4.0 International License (https://creativecommons.org/licenses/by/4.0), which permits unrestricted use, sharing, adaptation, distribution, and reproduction in any medium, provided the original work is properly cited.


