Changes in Intergranular Air Properties and Chemical Parameters of Short-term Stored Bulk Shelled Corn with Slightly High Moisture Content
Zheng Wei1, Yusan Jiang2, Xingjun Li1*, Minghui Zhao1,3, Jianzhang Wu3, Enfeng Yan2
1Academy of the National Food and Strategic Reserves Administration, Beijing, China
2Pingyuan Grain Reserve Depot Ltd. Co., Luliang Jituan, Dezhou, Shandong Province, China
3College of Grain, Oil and Food, Henan University of Technology, Zhengzhou, Henan Province, China
*Correspondence to: Xingjun Li, PhD, Professor, Academy of the National Food and Strategic Reserves Administration, No.26, NortheastRoad, Changping District, Beijing, 102209, China; E-mail: lixingjun888@aliyun.com
Abstract
Objective: This study is to determine the main parameters influencing the storage of shelled corn with slightly high moisture content (MC) so that its quality can be maintained.
Methods: The intergranular air properties and chemical changes was determined in 4,169 tonnes of shelled corn bulk with an average MC of 15.3% and a height of 5m, which was stored for 90 days in a large warehouse in Shandong Province, China, from winter to early spring. The intergranular air property parameters were calculated with self-compiled software.
Results: Fans were used to achieve temperature-equalizing aeration at a low rate (5.87m3/h/t) after warehousing, which decreased the bulk temperature from 6.8 to 4.7℃. Afterwards, with the increase in ambient temperature, the surface-layer grain temperature increased drastically, while that of the bottom layer increased slowly and those of the middle layers increased even more slowly. The minimum and mean cumulative dry-bulb, wet-bulb and dew-point temperatures (DPT) increased in the order of middle layer˂ bottom layer˂ surface layer. Free fatty acid content, kernel breakage percentage, water adsorption rate, gelatinization enthalpy, peak enthalpy, and fatty acid profiles (C16:0, C18:0, C18:3n3, C20:0 and C20:1) were significantly related to the cumulative intergranular air properties of grain bulk.
Conclusion: The above physio-chemical parameters were significantly influenced by the minimum and mean cumulative values of relative humidity, Humidity ratio and DPT in the bulk, and can be used to evaluate the quality of shelled corn with slightly high MC during short-term storage.
Keywords: shelled corn bulk with slightly high moisture, intergranular air properties, water absorption rate, fatty acid profile, cumulative relative humidity
1 INTRODUCTION
Corn is the third important cereal grain worldwide after wheat and rice[1]. It is referred to as “the cereal of the future” for its nutritional value and the utility of its products and by-products[2]. Corn has various uses, including food processing, animal feed and ethanol production[3], which is a basic staple food grain for large parts of the world, including Africa, Latin America and Asia[4,5]. Second only to the US, China contributes to 22% of global corn production. Due to its large population, some shelled corn in China is stored long-term at a safe moisture content (MC). Shelled corn storage is relatively difficult compared to wheat and rice storage because corn kernels have a large embryo with a high respiration rate[6]. The storage temperature and MC of shelled corn grain are the two key features affecting its quality, biochemical reactions, dry matter losses, allowable storage periods and overall storage management[7,8]. In recent years, advancement in sensor technology has provided cereal grain storage operators with two primary options for temperature monitoring from cable-based sensors and wireless sensors[9]. Cable-based sensors utilize physical cables that can traverse through the grain mass with sensors located at some predetermined locations, while wireless sensors offer options for sensors to be randomly distributed within the stored grain mass[9]. The mature grain status detection system based on cable sensors are run one time every 3-4 days in Chinese large warehouses, but the development of on-line MC detection in grain mass is very slow due to the detection accuracy. From the year of 2000, ground-level large flat warehouses have been used to store shelled corn in China; however, few studies have investigated the intergranular air properties in bulk shelled corn and their relationships with biochemical reactions and grain quality.
As a multipurpose grain, shelled corn can be used directly as human food, although it provides even greater nutritional value when used as an ingredient in processed food and animal feed[10]. The safe MC of shelled corn for storage and transport is 13-14% wet basis (WB)[11,12]. However, the food processing and animal feed industries prefer shelled corn with slightly higher moisture (15-15.5% w.b.). One reason is that the intact starch granules are more easily maintained during processing. Another is that chilled storage may have an economic advantage over dry storage because the energy required to evaporate 6% of the moisture from a grain mass is at least six times greater than that required to cool it from 25℃ to 5℃ using refrigerated air[13]. Thus, to store shelled corn with slightly high MC during winter, some warehousing businesses use a cooler centre in the grain bulk to store it until early in the next summer. However, the biochemical and thermal properties and fatty acid profile of this kind of grain bulk have received less study.
In this study, changes in the intergranular air properties of shelled corn bulk with a 15.3% MC stored in a large flat warehouse in Pingyuan County, Shandong Province, China, were analysed during a three-month storage period. The effects of the cumulative intergranular air properties on the biochemical and thermal properties and the fatty acid profile of grain bulk were explored. The aim was to determine the main parameters influencing the storage of shelled corn with slightly high MC so that its quality can be maintained.
2 MATERIALS AND METHODS
2.1 Experimental Shelled Corn Warehouse
An experiment was carried out in a commercial shelled corn warehouse located in Pingyuan County, Shandong Province, China (37.2°N, 116.4°E, elevation 25m), which is in a basin with a warm-temperate, semi-humid monsoon climate. The experimental warehouse had internal dimensions of 42m×24m and was equipped with four aeration vents distributed at the lower side of the northern wall, which was oriented in an east-west direction along the warehouse’s length. The four aeration vents were connected to four U-shaped ground cage aeration ducts. The eight aeration ducts were spaced 5.5m apart, with the first and tenth ducts being 1.75m away from the east and west walls, respectively. The ratio of the longest (6.8m) to shortest (5.0m) air pathway was 1.36. A total of 4,169 tonnes of yellow shelled corn was loaded into the warehouse to a depth of 5.0m on January 28, 2021. The initial MC of shelled corn was determined on site to be 15.3% w.b. using a capacitance-type cereal grain moisture meter (LDS-1G, Taizhou Grain Instrument Factory, Zhejiang Province, China). Content of adulterants, including foreign seeds, shrivelled kernels, and unavailable corn, was measured as 0.7% by screening with a series of sieves with mesh diameters of 12 to 3.5mm. Smart temperature sensor cables were arranged into grain bulk on January 29, 2021.
After levelling the grain surface, equalizing-temperature aeration was carried out from January 29 to February 17, 2021. The aeration air was sucked (by negative pressure) into the warehouse through four vents at floor level and then flowed upwards through the grain bulk before being exhausted from two fans fixed in the south gable wall. The two aeration fans (YTOS-4, 1.1kW power, Hengli Explosion Proof Electric Co., Ltd., Dezhou, China) were each rated at 187Pa of full pressure and 12,238m3h-1 of airflow rate at a motor speed of 1,450rpm. The calculated aeration rate was 5.87m3h-1t-1. The fans and aeration vents were located on the opposite side of the warehouse. The fans were run from 17:30 to 8:30 daily, providing aeration for 15h each day for 13 days, amounting to a total of 195h.
2.2 Measurements of Grain Temperature and MC
A network of temperature sensors was installed in the corn bulk and a relative humidity (RH)-temperature sensor was installed in the headspace (Figure 1). The temperature sensors (DS1820, Dallas Semiconductor Inc., Texas, USA) have a measurement range of -40 - 60C, with an accuracy of ±0.5℃ in the range from -10 - 60℃ and ±2℃ in the range of -40 to -10℃. The humidity sensor has a measurement range of 0-99% and an accuracy of ±3% RH. Nine temperature sensor cables were installed across the width of the warehouse at approximately 5.0m intervals and each cable had six branch lines 4.6m apart along the cable. Each branch line had four temperature sensors located at grain depths of 0.3m, 1.8m, 3.3m and 4.8m from the top grain bulk surface. These four depths were denoted as Surface layer, Middle 1 layer, Middle 2 layer and Bottom layer, respectively. Grain temperatures were recorded every three to four days until April 27, and 202 data points were collected on each inspection day. The corn bulk was removed from storage from April 28 to 30.
|
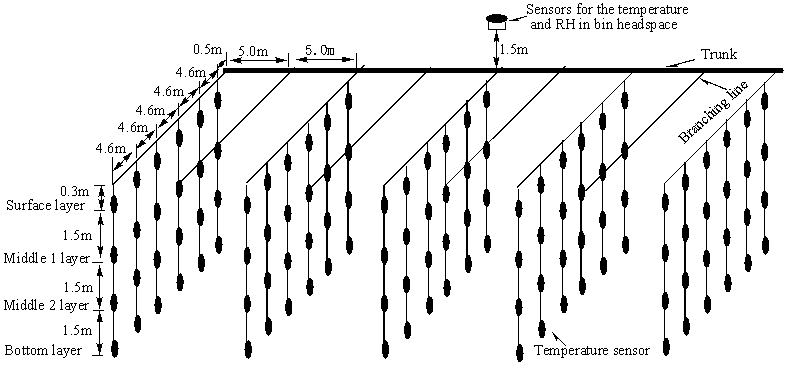
Figure 1. Distribution of temperature sensors and cables in the shelled corn bulk.
Grain samples were taken at 44 locations throughout the grain bulk for MC and quality measurement (Figure 2). Given that the warehouse had an east-west orientation and received sunlight on its southern wall, more sampling locations were arranged near the southern and northern walls where temperatures were more variable, and fewer were placed in the central region. Specifically, there were four sampling locations 0.5m from the southern and northern walls that were evenly spaced 13.6m apart, while there were three sampling locations along the centreline that were 11m apart. The sampling depths were 0.4m, 1.8m, 3.2m and 4.6m from the grain surface, denoted as L1, L2, L3 and L4, respectively. The average of L2 and L3 is the middle layer. Samples were taken on April 27, 2021, each containing 500g of grain. The MC of the grain samples was determined on-site as 14.9% with a capacitance-type cereal grain moisture meter (LDS-1G). Each grain sample was placed in a sealed bag (200mm×140mm×0.04mm, Apple Brand, Shanghai, China), transferred to the laboratory in a carton, and stored at 15℃ for further analysis. The corn grade indexes such as bulk weight, percentages of defective kernels and moldy kernels, as well as color and odour were determined according to China national standard GB1353-2018[14].
|
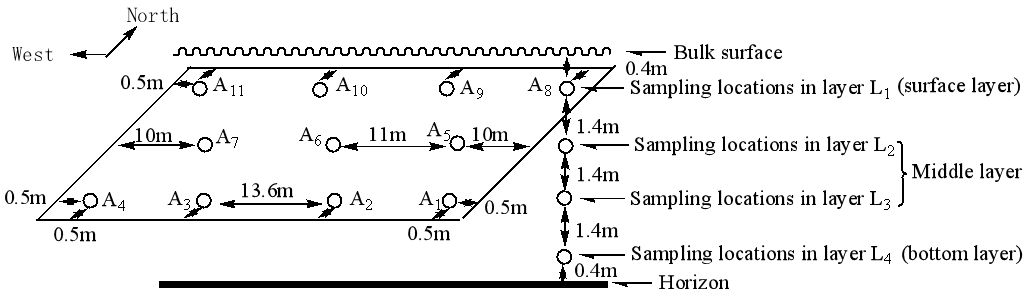
Figure 2. Distribution of sampling locations in shelled corn bulk.
2.3 Psychrometric Properties of Intergranular Air in the Corn Bulk
The psychrometric properties of intergranular air include the equilibrium relative humidity (ERH), humidity ratio (HR), dry-bulb and wet-bulb temperatures, and dew-point temperature (DPT)[15]. The ERH should be < 70-75% to inhibit mould gowth in the grain bulk. The wet-bulb temperature can be used to control the growth of major storage insect pests. The dry-bulb temperature, HR and DPT are commonly used for making aeration decisions[16]. This section presents a method for estimating them from grain temperature and MC, which is commonly measured in grain storage facilities.
For a given condition of stored grain, such as its grain temperature and MC, there is a corresponding ERH of the intergranular air. In the present study, the modified Chung-Pfost Equation[17] [Equation (1)] was used to calculate the intergranular air RH from the grain MC:
|
where ERH was the intergranular air RH in equilibrium with grain (decimal); M was the equilibrium grain MC (%); T was grain temperature (℃); and a, b and c were parameters of the equation, which are 537.71, 54.82 and 0.221 respectively for yellow shelled corn[18].
The grain moisture was noted to change little during the short period of cooling aeration despite the temperature changes quickly, thus the grain MC was assumed to be constant within any sampling period. Once the ERH was determined, the HR of intergranular air was calculated as follows[15]:
|
|
Where w was the HR of intergranular air at dry-bulb temperature T (kg/kg); patm was atmospheric pressure (101,325 Pa); and ps was the saturation vapour pressure of intergranular air at temperature T (Pa).
The relationship among the HR, saturation vapour pressure, and wet-bulb temperature can be described as follows[15]:
|
Where Tw was the intergranular air wet-bulb temperature (℃) and ww was the HR at saturation (kg/kg).
Newton-Raphson method was used to search for a Tw value to satisfy Equation (4). Specifically, Equation (4) was first differentiated with respect to Tw:
|
The following iteration process was then carried out:
|
Where Twp and Twp+1 were the pth and (p + 1)th estimates of the wet-bulb temperature, respectively.
In the above equations, the saturation HRww was a function of the saturation vapour pressure ps which in turn was a function of the wet-bulb temperature Tw. Therefore, the derivative dww/dTw could be expressed as Equation (7):
|
|
|
From Equations (5)-(9), the wet-bulb temperature Tw was determined by iteration until the absolute difference between consecutive values became less than a specified error tolerance, which was the desired accuracy and was chosen as 10-6.
The HR wdp of saturated air at the DPT Tdp was determined by using Equation (2) with ERH = 1:
|
|
Where psdp is the saturation vapour pressure at temperature Tdp.
Newton-Raphson method was used to solve Equation (11) for Tdp as follows:
|
|
|
|
|
The DPT Tdp was determined by iteration until the absolute difference between consecutive values was below a specified error tolerance, which was selected as 10-6.
The cumulative dry-bulb temperature in corn bulk layers was the cumulative everyday dry-bulb temperature minus 17℃. The cumulative wet-bulb temperature in corn bulk layers was the accumulation of everyday wet-bulb temperatures minus 9℃. The cumulative ERH in corn bulk layers was the accumulation of everyday ERH minus 70%. The cumulative HR in corn bulk layers was the accumulation of everyday HR minus HR0. The HR0 was the initial HR calculated by a software with inputs of 17℃ and the average MC of the bulk layers. The cumulative DPT in bulk layers was the accumulation of everyday DPT minus DPT0. DPT0 was the initial DPT calculated by software with inputs of 17℃ and the average MC of the bulk layers. The cumulative dry-bulb, wet-bulb and DPTs, and the RH or HR, were recorded from February 4, 2020.
2.4 Analysis of Shelled Corn Quality
2.4.1 MC, Free Fatty Acid (FFA) Content and Kernel Breakage Percentage
The MC was determined by an oven-drying method[19]. Ten grams of corn kernels was crushed on a pulverizer with a 60-mesh screen (JFSD-100-II, Jiading Grain and Oils Instrument Co. Ltd., Shanghai, China). The powder (3.0000g) was weighed in triplicate on a balance (0.0001g, AL204-IC, Mettler Toledo Instrument Co., Ltd, Shanghai, China) and dried in an electrothermal constant temperature blast drying oven (DHG-9040A, Hangzhou Lantian instrument factory, China) at 103℃ for 3h.
FFA content of corn meal was extracted by anhydrous ethyl alcohol and then determined by hand titration with a 0.01M sodium hydroxide-ethanol solution using phenolphthalein as an indicator, according to the procedure described in GB/T 20570-2015[20].
Kernel breakage percentage of shelled corn was determined by light absorption at 610nm[21], which was measured with an ultraviolet-visible spectrophotometer (UV1700PC, Shanghai Aoxi Instrument Co. Ltd., China). A 10-g sample of shelled corn was dyed by 0.1% Fast Green FCF (Sigma-Aldrich Co., USA) alkaline solution for 20min on a shaking table, then the sample was washed until the washing water showed no blue colour. The dyed sample was eluted by 10mmol L-1 NaOH solution for 30min before measurement. Whole shelled corn kernels were chosen and cut in half along the central axis. The half kernels were mixed with whole kernels at percentages of 0, 10%, 20%, 40%, 60% and 80% to make a standard curve of kernel breakage percentage. A linear equation between 610nm (y) and kernel breakage percentage (x) was used to calculate the kernel breakage percentage of the samples. The percentage of corn kernel breakage is compared to the unsound kernel percentage stipulated by GB/T 20570-2015[20].
2.4.2 Deoxynivalenol (DON) Content
DON content in shelled corn flour was determined by ROSA FAST5 DON Quantitative Tests on a mycotoxin rapid detection system (Charm Rosa, USA). The protocol comprised: (1) Diluted extract: the shelled corn was mixed well and crushed into 20 mesh size with a crushing mill (JFSD-100 milling machine, Shanghai Jiading Grain and Oil Instrument Co. Ltd., China). Five grams (5.0±0.1g) of powder were weighed and added to a 50mL clean centrifugal tube, and DON extract solution was added to a volume that was five times to the mass of the sample. After vigorous oscillation and settlement for 1min, a small amount of supernatant was transferred to a 1.5mL centrifugal tube and centrifuged for 40s at 4,000rpm. One hundred microlitres of supernatant were transferred into a new 1.5mL centrifugal tube and 1.0mL of diluted buffer solution was added, enclosed, mixed, and labelled as “diluted extract”. (2) Second diluted extract: 300µL of the above diluted extract was transferred to a centrifugal tube and 1.0mL of diluted buffer solution was added, enclosed, mixed and labelled as the “second diluted extract”. (3) Measurement: The temperature of an incubator was set to (45±1) ℃ and a test strip was labelled to avoid intrusion into the sample room and placed flat in a ROSA incubator. The test strip film was removed carefully as far as the indicator line. A pipette was positioned upright and 300µL of diluted extract was carefully transferred to the sample room. The incubator was covered, and a timer started automatically, as indicated by a flashing red light. After incubation, the test strip was removed, placed at one end of the sample room before reading, and the result was read within 2min.
2.4.3 Other Biochemical Parameters
2.4.3.1 Water Absorption Rate
The water adsorption rate of corn kernels was determined according to previous reports[22] with some modification. Three grams of shelled corn (m1) were weighed and put into a 50mL sharp-bottomed plastic centrifugal tube, 40mL deionized water was added, and a lid was put on. After soaking for 4h, the supernatant was discarded and the corn kernels were drained and dried on filter paper and weighed (m2). The rate of water absorption by corn kernels was calculated as:
|
2.4.3.2 Free Amino Acid (FAA) Content
FFA content in corn flour was determined by ninhydrin colorimetric analysis[23] with some modification. One gram of corn flour powder was weighed and 15mL hexane added, then the mixture was oscillated at room temperature for 3h after full vertexing. After centrifugation at 6,000rpm and 4℃ for 10min, the hexane layer was removed by a fume cupboard and the precipitate was transferred to a mortar and pestle. Five millilitres of distilled water lacking ammonia was added to this and fully ground, and the sample solution was transferred into a 50mL centrifugal tube along with 5mL distilled water with which the mortar and pestle were washed. After centrifugation at 6,000rpm and 4℃ for 10min, the supernatant was aspirated and used for FAA extract determination. The reaction mixture included 0.5mL aliquots, 0.5mL distilled water lacking ammonia, 0.5mL acetate buffer solution, 0.5mL of 3% ninhydrin, and 0.05mL of 0.1% ascorbic acid. After staying in a water bath at 85℃ for 12min, the reaction glass tube was cooled, and 5mL 95% alcohol was added and vortexed vigorously. The volume of the reaction mixture was increased to a constant volume of 10mL and used to measure the absorption values at 570nm. Leucine was used for plotting a standard curve.
2.4.3.3 Soluble Protein Content
One gram of corn flour powder was weighed and added to a mortar, then 15mL of pH 7.2 Tris-HCl buffer was added and then ground. After centrifugation at 4000rpm and 4℃ for 10min, the supernatant was aspirated and used for soluble protein extract. The soluble protein content was determined by Coomassie Blue G250 staining[24] and bovine albumin solution was used to obtain a standard curve.
2.4.3.4 Sulfhydryl (SH) Group Content
The SH group content in corn flour was determined by the method of Tian et al[25]. Two grams of corn flour powder was weighed, 15mL of 50% ethanol was added, and the mixture was oscillated in an ultrasound oscillator for 10min after full vertexing. After centrifugation at 3,000rpm and 4℃ for 20min, 4mL of the supernatant was transferred toa glass tube with a cap, and 2mL of potassium dichromate-acetic acid solution was added and then maintained in a water bath at 90℃ for 10min. After the volume of reaction mixture was increased to 10mL, the absorption values at 571nm were determined. Cysteine was used for plotting the standard curve.
2.4.3.5 Contents of Reducing Sugar, Pentosan and Amylose
One gram of the defatted cornmeal was ground using a mortar and pestle with 15mL of distilled water, then extracted for 5min at room temperature. After centrifugation at 4,000rpm for 10min, the supernatant was aspirated and used for reducing sugar extract. The content of reducing sugars was determined by the 3,5-dinitro salicylic acid (DNS) colorimetric method. The extract (800μL) was mixed with 600μL of 4.4mM DNS reagent and boiled in a water bath for 5min. After cooling, the solution was diluted to a volume of 10mL with distilled water and the absorbency at 540nm was measured. Glucose was used to make the standard curve.
Pentosan content in cornmeal was determined using the method of Gao et al.[26] with some modification. Ten milligrams (m0) of the defatted sample was weighed into a 10mL glass tube with a glass stopper, 2mL of distilled water was added, then 10mL of extraction reagent was added. The tubes were kept in a boiling water bath for 20min and a chromogenic reaction occurred while shaking twice. After cooling, the supernatant was used to determine the absorbency at 510nm and 552nm. The extraction reagent was made consisting of 2g phloroglucinol, 10mL absolute ethanol, 110mL glacial acetic acid, 2mL concentrated hydrochloric acid and 1mL of 17.5g/L glucose solution. The pentosan content was calculated as:
|
Amylose content in cornmeal was determined according to GB/T 15683-2008[27] with some revision. Two grams of the cornmeal was defatted twice with a petroleum ether-ethanol (4:1) solution for 1.5h each time, and dried for 3h at 60℃ after volatilization of the organic solution. Then, 10mg of defatted sample was weighed into a 10mL graduated test tube, and 100μL of 95% ethanol and 900μL of 1M NaOH solution were successively added. After shaking, the tubes were heated in boiling water for 10min. After cooling to room temperature, the sample solution was added to 10mL with distilled water. The reaction solution included 500μL of sample solution, 4.5mL of distilled water, 100μL of 1M acetate solution, and 200μL of 2% KI-0.2% I2 solution in a 10mL graduated test tube. After the reaction solution was added to a constant volume of 10mL with distilled water, the absorption value at 720nm was determined. Potato amylose was used for making a standard curve.
2.4.4 Thermal Properties
The thermal properties of shelled corn flour were determined with a differential scanning calorimeter (DSC; 200F3, Netzsch, Germany) according to Jiang and Li[28]. A sample (5.0-5.1mg) was weighed into an aluminium crucible and distilled water was added to make a water to sample ratio of 2:1. The aluminium crucible was sealed and equilibrated at 4℃ overnight. The DSC temperature increased from 30 to 110℃ at the heating rate of 10℃/min.
2.4.5 Fatty Acid Profile Analysis
Fatty acid analysis was conducted according to a protocol described by Concepcion et al[29]. For lipid extraction, shelled corn flour (ca. 100mg) was weighed into a 10mL plastic centrifugal tube and mixed with 1mL hexane and 0.25mL of 2mol/L KOH-methanol solution for 30s. After extraction for 40min in a water bath at 30℃ with a 300W ultrasonic probe, the sample was cooled to room temperature and mixed for 1min after adding 0.25mL of 2mol/L HCl solution. After centrifugation at 8,414rpm for 10min, the supernatants were used for gas chromatography-mass spectrometry analysis. The extraction of each sample was triplicated.
Fatty acid methyl esters (FAME) in each sample were determined with a gas chromatography system (Agilent 8890 GC) equipped with a fused-silica column (HP-5MS UI; 30m length × 0.25mm internal diameter × 0.25μm film thickness) coupled with a mass selective detector (5977B, Agilent Technologies, Santa Clara, CA, USA). Samples were injected in split mode (0.3μL, split ratio 10) at an initial temperature of 130℃ for 3min, then the temperature increased at 5℃/min to 180℃. After 8min, the temperature again increased at 5℃/min to 240℃ and kept for 12min. Helium (1.0mL/min) was used as the carrier gas and the solvent delay time was 1.6min. For the MS system, the temperatures of the injection port, ionization source, transfer line and quadrupole were 260℃, 230℃, 280℃ and 150℃, respectively; and electron-impact mass spectra were recorded at a 70eV ionization voltage. The acquisitions were performed in full scan mode (40-400amu).
The MS information of each FAME peak was submitted to Mass Hunter Qualitative Analysis V10.0 software (Agilent Technologies, Santa Clara, CA, USA), and compared to the off-line MS library of NIST08s and the online NIST Chemistry Web Book, SRD 69 (https://webbook.nist.gov/chemistry/#), considering a minimum similarity value of 80%. The FAME standards were followed and the experimental retention indices of a series of n-alkanes (C7-C30, Sigma-Aldrich Co., USA) in an HP-5MS column were compared with those reported in the literature under the same experimental conditions. The measured concentration, expressed as μg/L, was quantified with the external standard method, in which 37 kinds of FAME (Sigma-Aldrich Co., USA) mixed with different gradients were used. The linear ranges of the standard curves were 0.5-400μg/L, with R2>0.99.
2.6 Data Analysis
For paired data, Excel software (Microsoft 2016) was used to obtain scatterplots, linear trendlines and determination coefficients. SPSS (Version 17.0[30]) was used for data analysis. One-way analysis of variance (ANOVA) and independent-samples t-tests were respectively used to compare multiple and pairs of means. To observe the effects of several factors, a general linear model-univariate method was used to compare means by least significant difference test. Statistical significance was declared at P<0.05. To observe the influence of various factors on corn quality, the regression-linear method was used to obtain multiple linear regression equations, where the dependent variables in the equation represent significantly positive or negative influences.
3 RESULTS
3.1 Changes in RH and Dry-Bulb, Wet Bulb and DPTs of Grain in Different Bulk Layers
Figure 3 showed the changes in the dry-bulb temperature and RH of grain in different bulk layers. Due to the 195h equalizing-temperature aeration during January 29 to February 17, between the end of warehouse placement and the 36th day of storage (March 8, 2021), the maximum temperatures in surface, middle, and bottom layers decreased drastically, and then decreased to their lowest values after a small increase (Figure 3A).
|
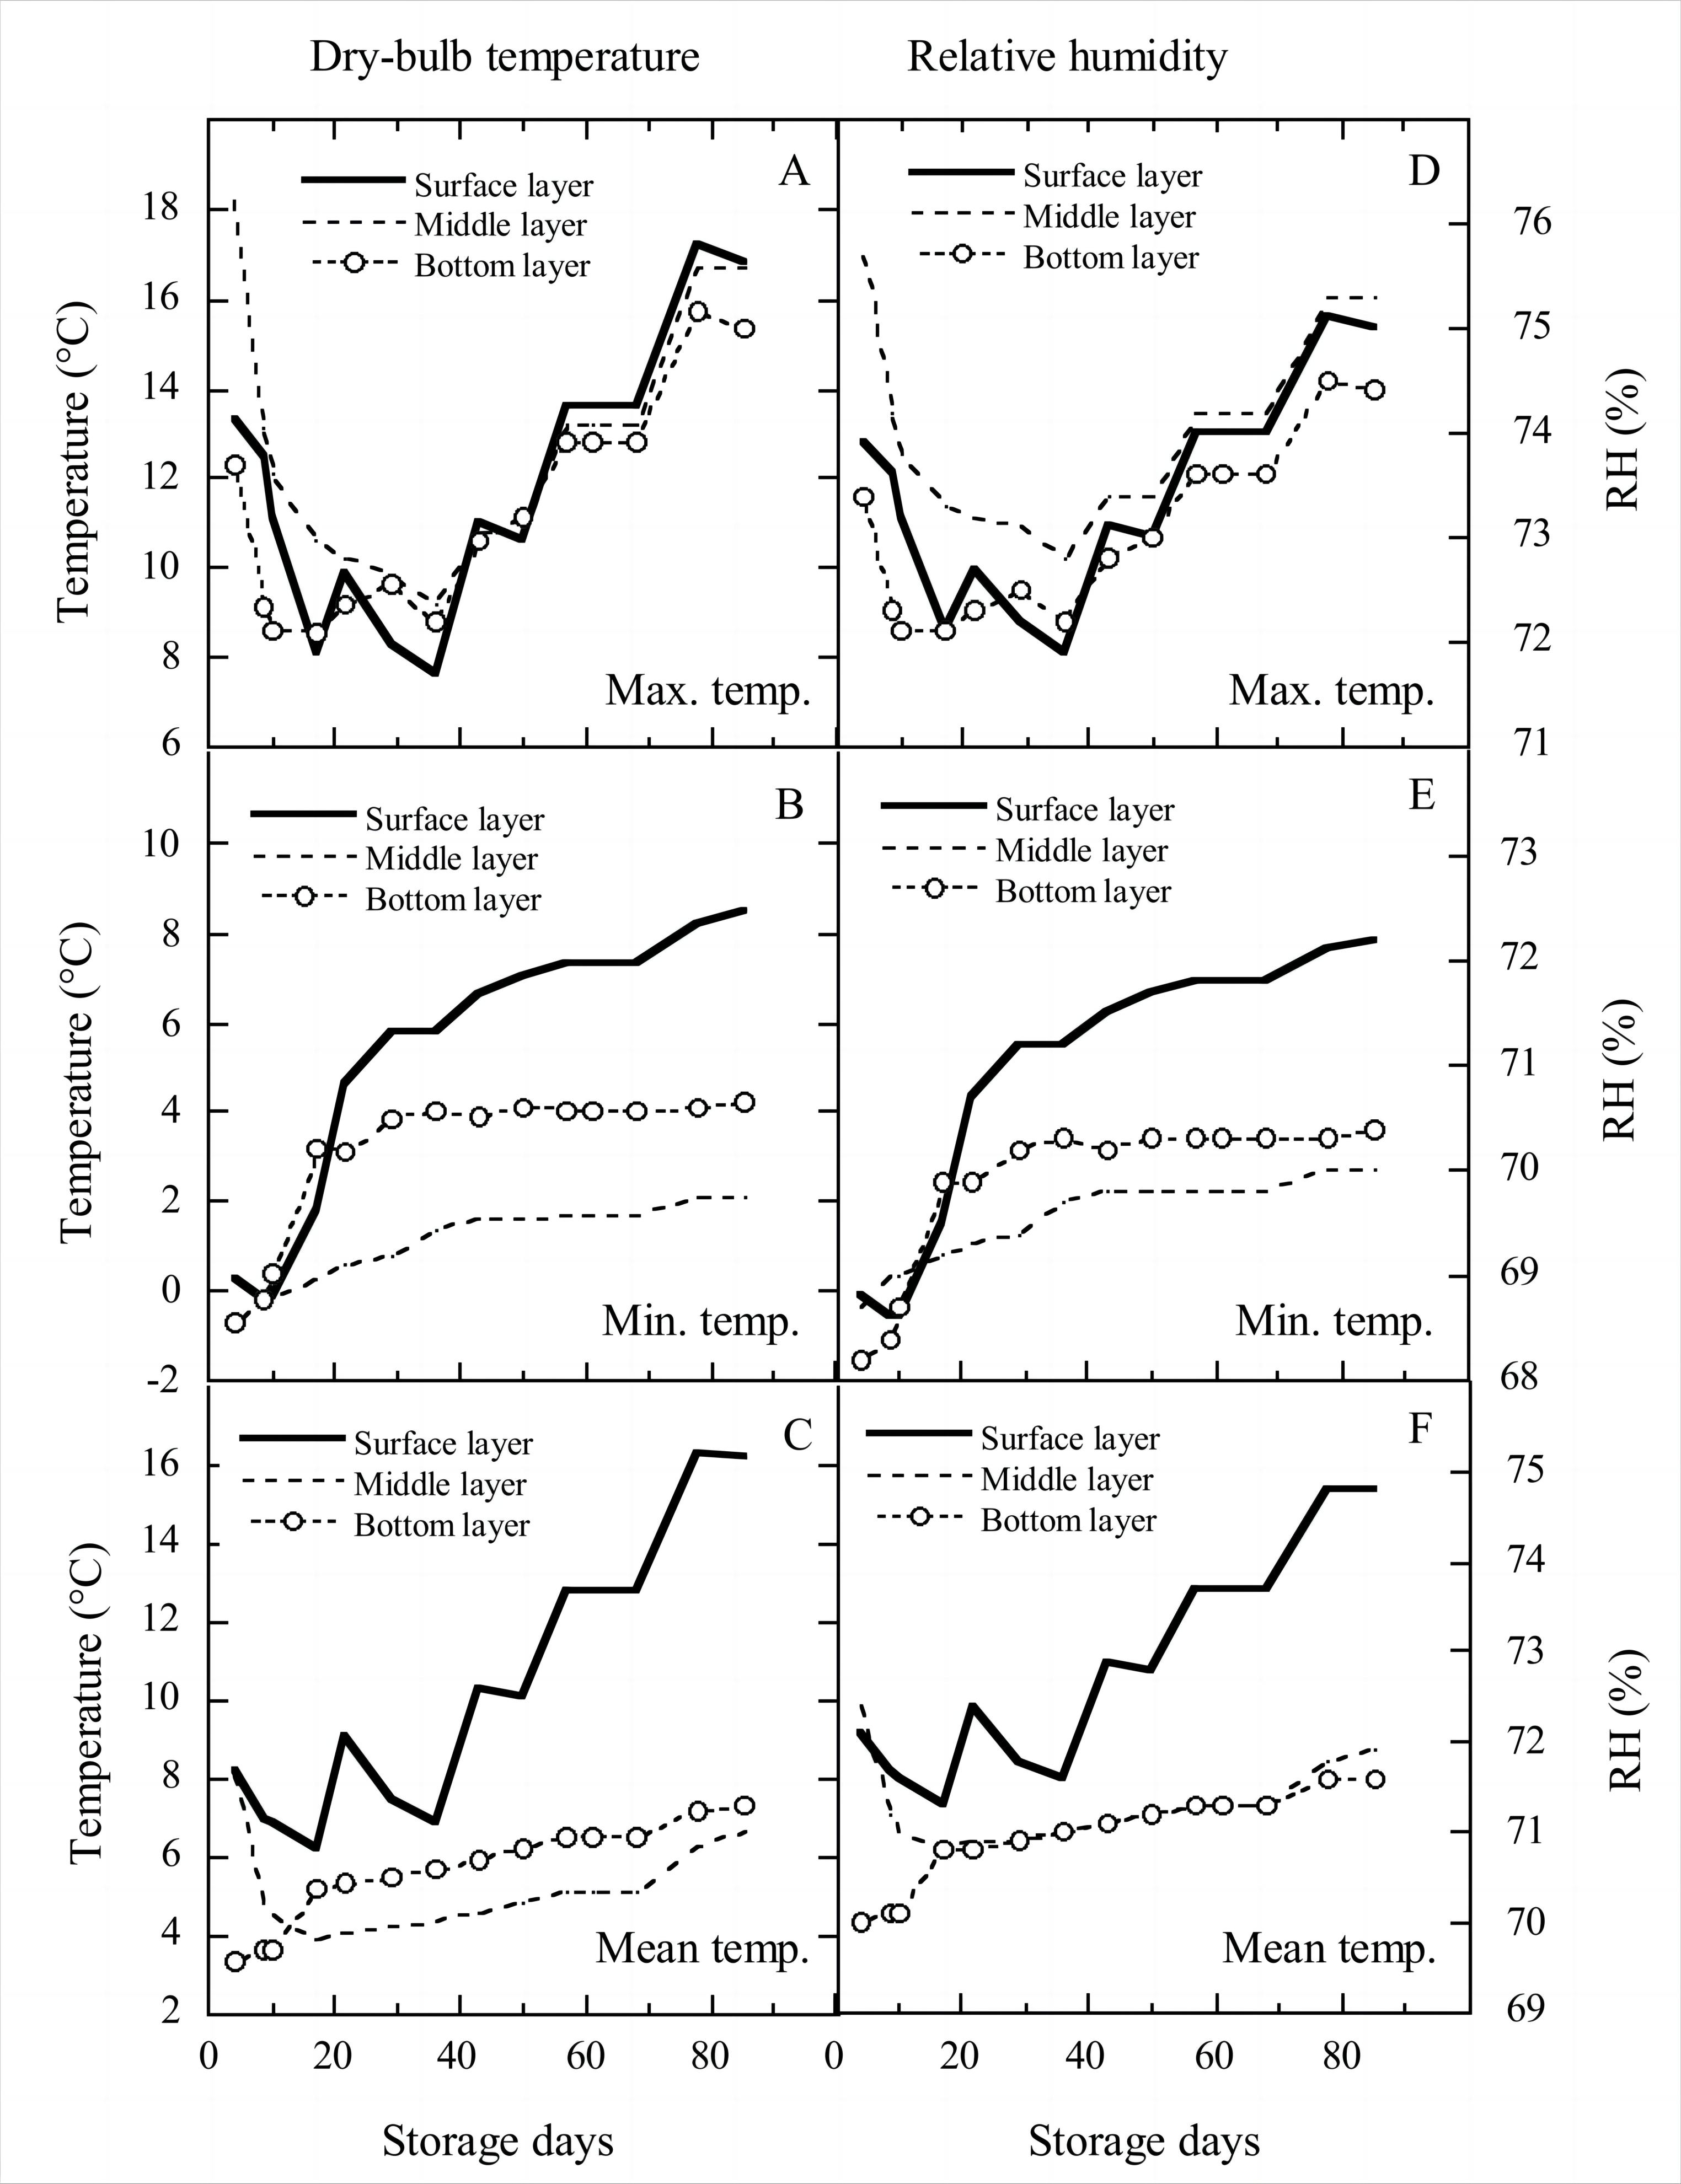
Figure 3. Variations in maximum, minimum and mean dry bulb temperatures and RH over time in the different layers of bulk grain.
At the 36th day, the maximum temperature of the surface layer was lower than those of the bottom and middle layers. Afterwards, the maximum temperatures in the three bulk layers showed a fluctuating increase until the 85th storage day. On day 85, the maximum temperature at the bottom was lower than those of the middle and surface layers, and the maximum temperature at the surface layer was lower than 17℃, meaning that the loss from stored insects can be not considered. The minimum temperatures in surface and bottom layers increased sharply at the same rates for the first 20 storage days, then increased by 6℃ and 2℃ till day 85, respectively (Figure 3B). The minimum temperature in the middle layer steadily increased from -0.7℃ to 2.1℃ on day 85.
The surface layer mean temperature first decreased from 8.2℃ to 6.2℃ on day 17, then had a fluctuating increase to 16.3℃ on day 85 (Figure 3C). The middle layer mean temperature first decreased from 8.1℃ to 3.9℃ on day 17, and then increased steadily to 6.7℃ at the 85th storage day. The bottom layer mean temperature first increased from 3.3℃ to 5.2℃ on day 17, then steadily increased to 7.3℃ on day 85. From day 17 to 85, the mean and surface layer minimum temperatures were drastically higher than those of the bottom and middle layers; the mean temperatures (3.9-7.3℃) of bottom and middle layers were in the temperature range of insects coma, and surface layer mean temperature (˂16.3℃) was not fit for Rhyzopertha dominica growth.
The variations in RH in the three bulk layers were essentially similar to those of dry-bulb temperature. For the RHs corresponding to the maximum temperatures (Figure 3D), the surface layer maximum RH in the first 36 days decreased from 73.9% to 72.1%, then increased to 72.7% before decreasing to 71.8%, and finally showed a fluctuating increase to 75% at the 85th storage day. The middle layer maximum RH quickly decreased from 75.7% to 73.3% over the first 17 days, then slowly decreased to 72.8% on day 36 and increased unsteadily to 75.3% on day 85. The bottom layer maximum RH decreased from 73.4% to 72.1% over the first 10 days, then unsteadily increased to 74.4% on day 85. The changes of the maximum RHs in three bulk layers ranged from 71.5% to 75.5% during the 85 days storage, and the possible growth of storage fungi are Aspergillus restrictus, Aspergullus glaucus, and Aspergillus candidus. However, the maximum dry temperatures in these three bulk layers was in range of 7-18℃, which were much below the optimal temperature for these fungi growth (25℃ for Aspergillus restrictus and Aspergullus glaucus, and 28℃ for Aspergillus candidus[31-32]).
The surface layer minimum RH quickly increased from 68.6% to 70.7% over the first 22 storage days, then slowly increased to 72.2% on day 85 (Figure 3E). The middle layer minimum RH steadily increased from 68.7% to 70% over the 85-day storage. The bottom layer minimum RH quickly increased from 68.2% to 69.9% over the first 22 days, then slowly increased to 70.4% on day 85.
The surface layer mean RH first decreased from 72.1% to 71.3% over the first 17 days, then increased unsteadily to 74.8% on day 85 (Figure 3F). The middle layer mean RH first decreased from 72.4% to 70.8% over the first 17 storage days, then steadily increased to 71.9% on day 85. The bottom layer mean temperature first increased from 70% to 70.8% over the first 17 days, then steadily increased to 71.5% at the 85th storage day. From storage days 17 to 85, the mean and minimum RHs of surface layer were drastically higher than those of the bottom and middle layers; the mean RH in surface layer should be paid close attention to.
Figure 4 showed the changes in wet-bulb and DPT of the grain in different bulk layers. Their trends were essentially similar to those of dry-bulb temperature. Within the first 36 storage days, the maximum wet-bulb temperatures in the surface, middle and bottom layers decreased by 5.4℃, 8.5℃ and 3.6℃, respectively; thereafter, they respectively increased by 8.7℃, 7.1℃ and 6.4℃. From storage days 36 to 85, the difference in wet-bulb temperatures in the three layers was very small (Figure 4A). During the 85-day storage period, the minimum wet-bulb temperatures in the surface, middle and bottom layers increased from -2.0C, -2.4C and -2.5C to 6.2C, 0.2C and 2.2C, respectively (Figure 4B). Within the first 17 days, the mean wet-bulb temperatures in the surface and middle layers decreased from 5.9℃ and 5.8℃ to 4.1℃ and 1.9℃, respectively, then they respectively increased to 13.5℃ and 5.0℃, but the mean wet-bulb temperature in the bottom layer increased rapidly from 1.3℃ to 3.1℃ over the first 17 days, then steadily increased to 5.1C (Figure 4C). When the average wet-bulb temperature in surface layer was respectively above 9℃ on day 57 and above 12℃ on day 78, Sitophilus oryzae and R. dominica could grow.
|
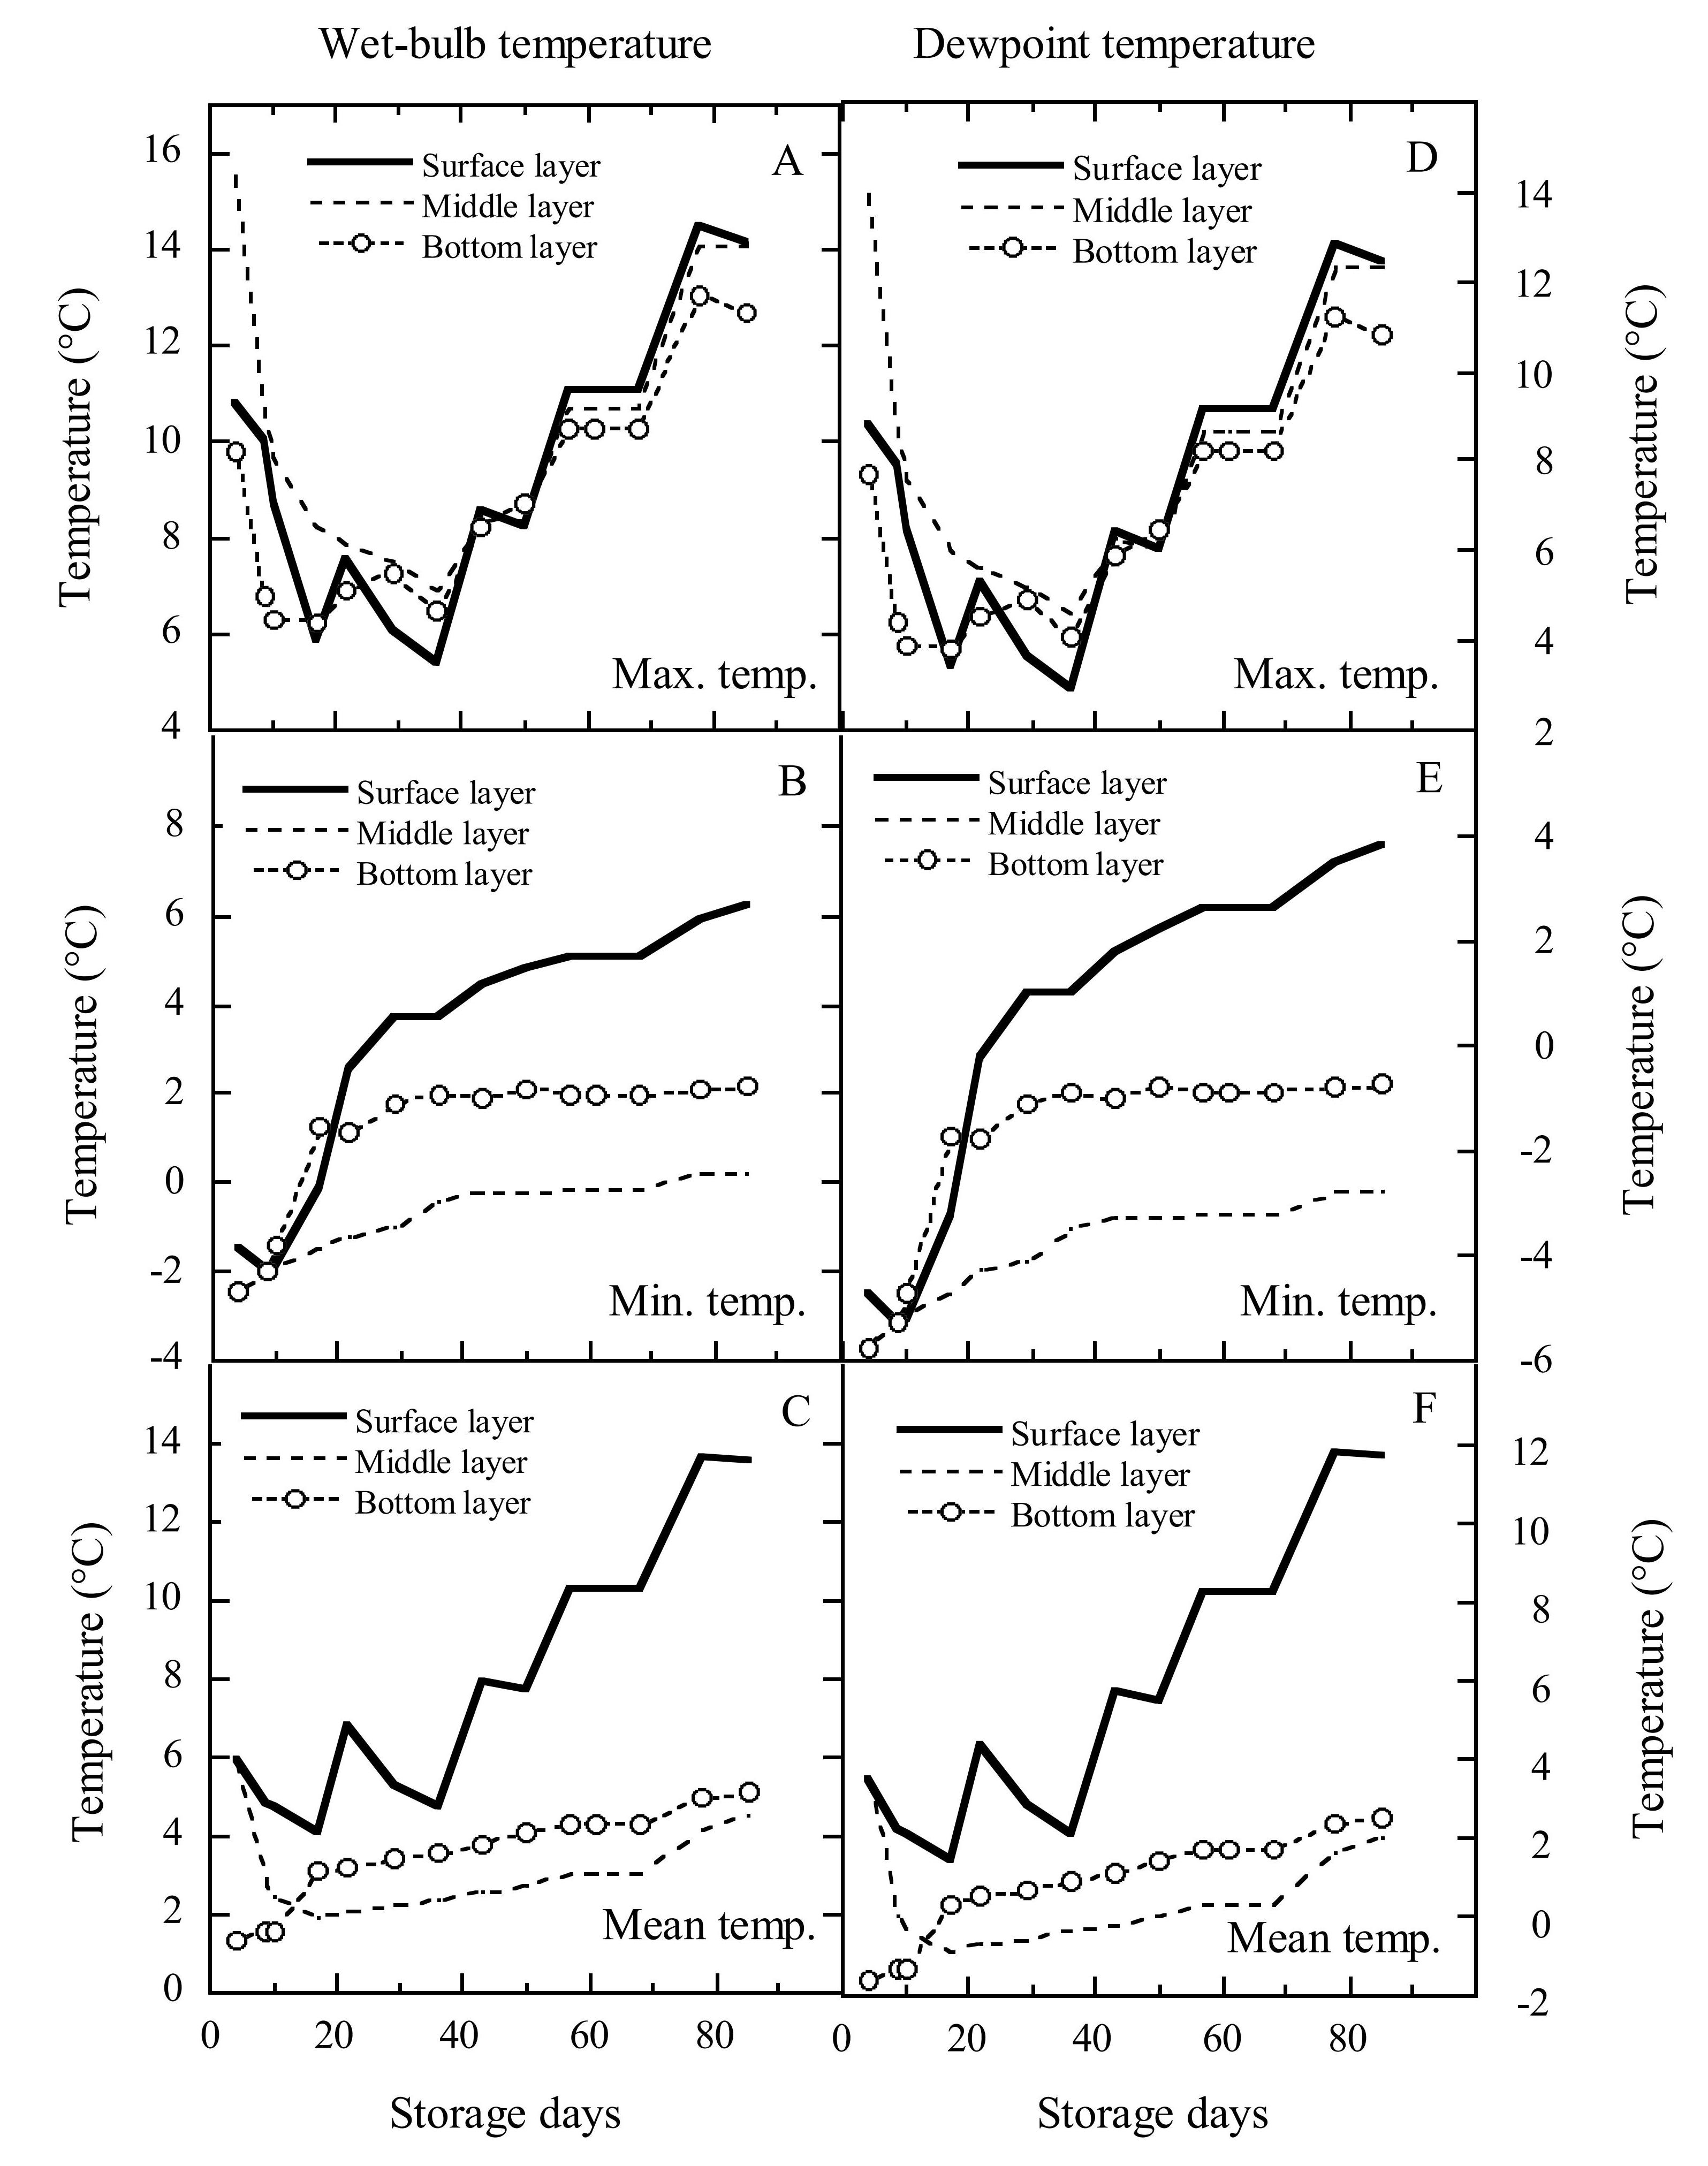
Figure 4. Variations in wet-bulb and dewpoint temperatures over the storage period in different bulk layers of grain.
Within the first 36 storage days, the maximum DPTs in the surface, middle, and bottom layers decreased by 9.3℃, 3.9℃, and 9.2℃, respectively; thereafter, they respectively increased by 7.7℃, 7.0℃, and 7.8℃. From storage days 36 to 85, the difference in DPTs in the three layers was very small (Figure 4D). Over the 85 storage days, the minimum DPTs in the surface, middle, and bottom layers increased from -5.3℃, -5.7℃, and -5.8℃ to 3.8℃, -2.8℃, and -0.7℃, respectively (Figure 4E). Within the first 17 days, the mean DPTs in surface and middle layers decreased from 3.5C and 3.5C to 1.4C and -0.9C, respectively, then they respectively increased to 11.7℃ and 2.0℃; however, the bottom layer mean wet-bulb temperature quickly increased from -1.6C to 0.3℃ over the first 17 days, then steadily increased to 2.5℃ (Figure 4F).
3.2 Changes in Cumulative RH and Dry-Bulb, Wet-Bulb and DPTs of Grain in Different Bulk Layers
Figure 5 showed the changes in cumulative RH, dry-bulb, wet-bulb and DPTs of grain in different bulk layers. The cumulative maximum dry-bulb temperatures (Figure 5A) were ranked in order from highest to lowest as middle layer, surface layer, and bottom layer. However, both cumulative minimum and mean dry-bulb temperatures were ranked: surface layer > bottom layer > middle layer.
|
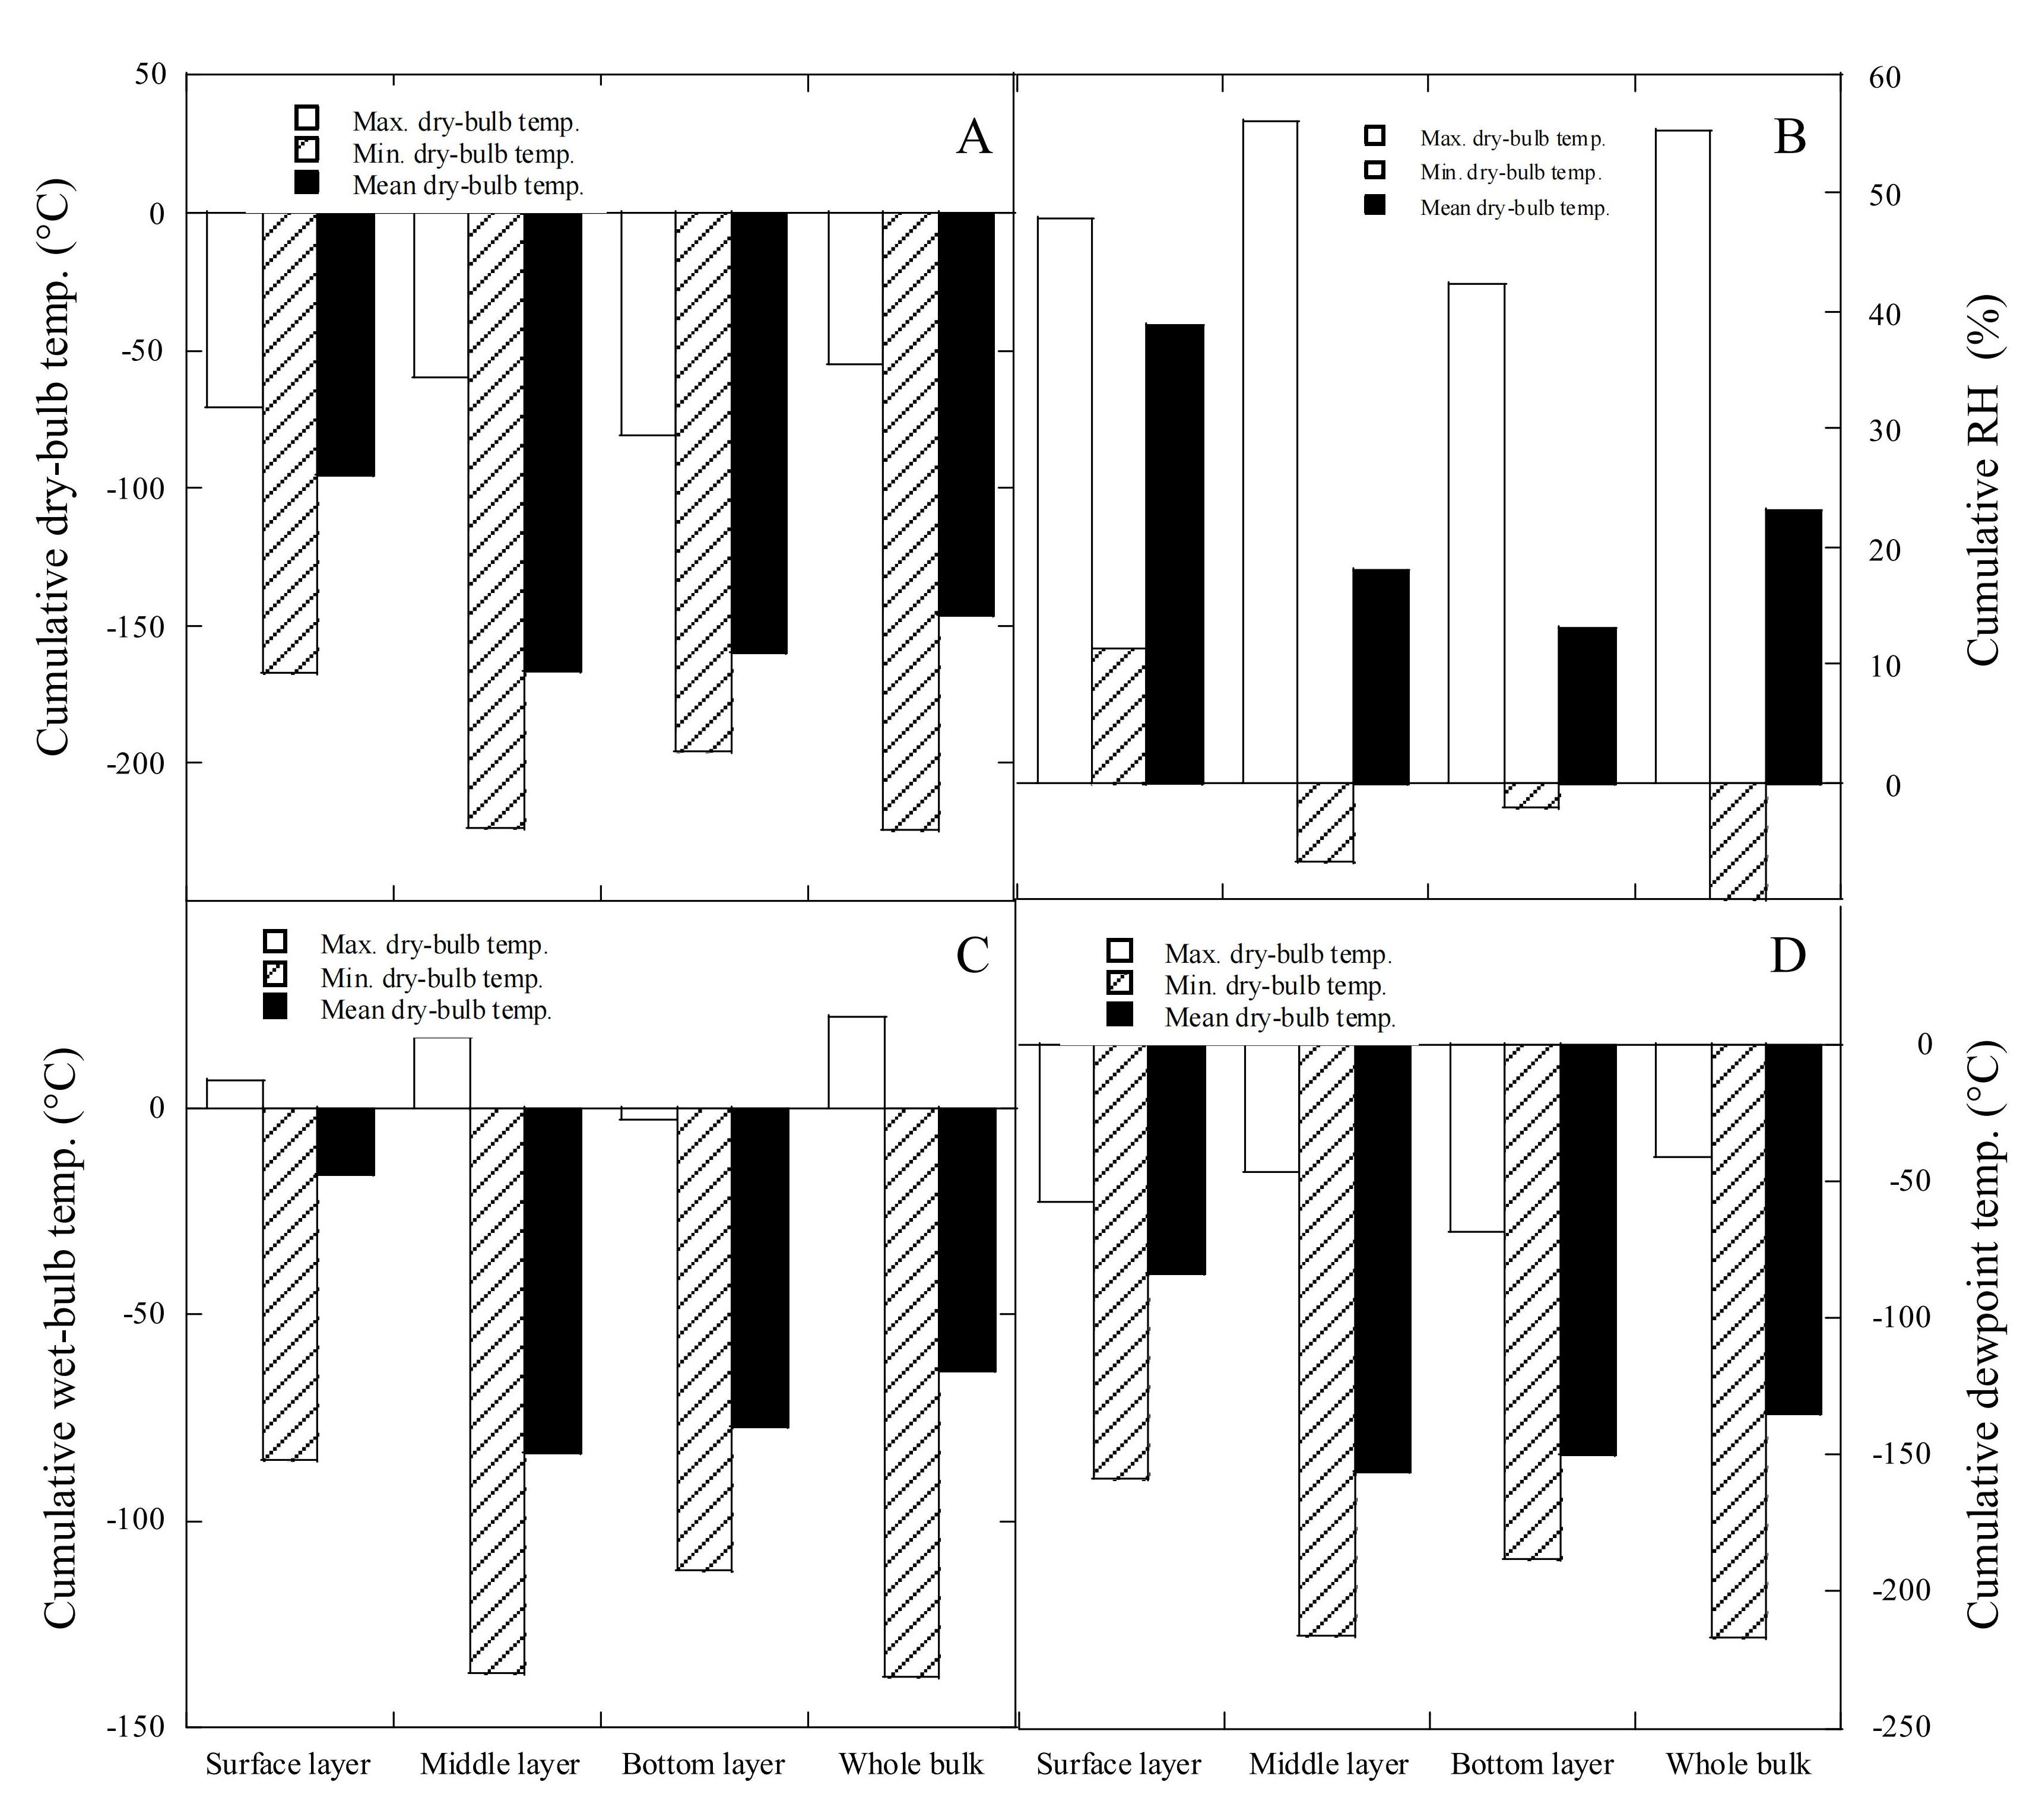
Figure 5. Changes in cumulative dry-bulb temperature (A), relative humidity (B), wet-bulb (C) and dew-point temperature (D) in different grain bulk layers.
The cumulative maximum RHs (Figure 5B) were ranked: middle layer > surface layer > bottom layer. The cumulative minimum RHs were ranked: surface layer >bottom layer > middle layer. The cumulative mean RHs were ranked: surface layer > middle layer > bottom layer. The cumulative maximum wet-bulb temperatures (Figure 5C) were ranked: middle layer > surface layer > bottom layer. Both cumulative minimum and mean RHs were ranked: surface layer > bottom layer > middle layer. The ranking of cumulative DPTs from highest to lowest in the three bulk layers were the same as that of cumulative dry-bulb temperatures (Figure 5D).
We assumed that stored grain pests could emerge at the cumulative maximum wet-bulb temperature in grain bulk. According to Demarchelier[33], the development of Sitophilus oryzae was at a threshold seed wet-bulb temperature (denoted as T0) of 9.0℃. In the present study, the maximum wet-bulb temperature difference (the maximum Twb-T0) for S. oryzae from January 29 to April 26 were calculated to be 6.79℃, 17.17℃, -2.92℃ and 22.13℃ in surface layer, middle layer, bottom layer and whole corn bulk, respectively, and the population multiplication (Nt/N0) can be calculated as:
|
Where Twb was wet-bulb temperature, ℃; T0 was threshold seed wet-bulb temperature, ℃; k was the rate coefficient; t was time, weeks; Nt was the pest population after t weeks; N0 was the pest population at t=0. The rate coefficient k was assumed to be 0.052 (℃ week)-1 for S. oryzae according to Wilson and Desmarchelier[16]. Therefore, the insect population multiplications of S. oryzae were estimated to be 4.2, 10.7, and 13.8 in the surface layer, middle layer, and whole corn bulk, respectively. After these values are divided by the grain weight, the unit heads of S. oryzae in the surface layer, middle layer, and whole corn bulk are much below 2 heads per kilogram of grain that is stipulated by the guideline for evaluation of maize storage (China national standard GB/T 20570-2015[20]). Thus, due to no damage or hazard from stored grain fungi and pests, this shelled corn bulk with slightly high moisture was explored for the effects of cumulative intergranular air properties on the biochemical and thermal properties and the fatty acid profile of grains.
3.3 Correlations between Cumulative Intergranular Air Properties with Biochemical and Thermal Parameters
The samplings after storage on April 27, 2021, had bulk weight of 695g/L, defective kernel percent of 5.8%, and 2% moldy kernels with normal colour and odour, indicating a kept second grade of shelled corn. Thus, their biochemical and thermal parameters were further analysed. Tables 1 and 2 showed the values of the biochemical parameters in 11 grain bulk locations. Location A4 had the highest contents of DON and FFA but its MC content was not the highest. The uneven distribution of DON content in the shelled corn bulk was due to different batches of grain with different DON contents. The average DON content was <0.8μg/g, which was the Chinese standard limit for shelled corn. Location A3 had a higher FFA content, water absorption rate, thermal properties, and fatty acid profiles (C16:0, C18:3n3, C20:0, and C20:1). Most biochemical parameters in the middle layers (L2 and L3) and bottom layer (L4) of the grain bulk were higher than those in the surface layer (L2). Table 3 showed the similar other biochemical and thermal parameters among different grain bulk layers. These results suggested that the low cumulative values of RH, HR, and DPT in the middle and bottom layers of the grain bulk are useful in maintaining the above biochemical and thermal parameters.
Table 1. The Values of Biochemical Parameters in Grain Bulk Locations
Location |
No. |
MC (%) |
FFA (mgKOH /100g) |
DON (ppb) |
Kernel Breakage (%) |
Water Adsorption Rate (%) |
ΔH (J/g) |
Sampling |
A1 |
15.00±0.13c |
31.75±1.74ab |
368.8±133.0fgh |
6.2±2.1cd |
134.5±2.2e |
2.72±0.28a |
A2 |
15.65±0.13a |
28.63±1.74bcd |
668.8±133.0e |
8.3±2.1bc |
139.1±2.2d |
2.75±0.28a |
|
A3 |
14.24±0.13ef |
30.38±1.74abc |
1131.3±133.0c |
4.6±2.1cd |
151.6±2.2ab |
2.72±0.28a |
|
A4 |
15.01±0.13c |
33.25±1.74a |
3250.0±133.0a |
7.4±2.1bcd |
144.6±2.2c |
2.72±0.28a |
|
A5 |
15.33±0.13b |
31.88±1.74ab |
612.5±133.0efg |
6.3±2.1cd |
153.1±2.2a |
1.99±0.28b |
|
A6 |
14.34±0.13e |
31.88±1.74ab |
706.3±133.0de |
14.6±2.1a |
151.2±2.2ab |
2.26±0.27abc |
|
A7 |
14.05±0.13f |
33.00±1.74a |
1993.8±133.0b |
4.7±2.1cd |
147.5±2.2bc |
2.39±0.28ab |
|
A8 |
14.64±0.13d |
26.50±1.74d |
350.0±133.0gh |
11.4±2.1ab |
145.4±2.2c |
1.78±0.28c |
|
A9 |
15.49±0.13ab |
27.50±1.74cd |
281.3±133.0h |
8.8±2.1bc |
145.1±2.2c |
2.42±0.28ab |
|
A10 |
14.46±0.13d |
30.63±1.74abc |
956.3±133.0cd |
3.8±2.1d |
151.6±2.2ab |
2.20±0.28abc |
|
A11 |
14.10±0.13ef |
28.38±1.74bcd |
462.5±133.0efgh |
5.5±2.1cd |
150.7±2.2ab |
2.07±0.27bc |
|
Layer |
L1 |
14.74±0.08ab |
28.23±1.05c |
904.6±80.2bc |
4.5±1.3b |
145.2±1.3b |
2.45±0.17a |
L2 |
14.85±0.08a |
31.59±1.05ab |
1275.0±80.2a |
7.5±1.3a |
147.1±1.3ab |
2.29±0.19a |
|
L3 |
14.77±0.08ab |
31.91±1.05a |
959.1±80.2b |
8.4±1.3a |
146.4±1.3ab |
2.29±0.19a |
|
L4 |
14.67±0.08b |
29.64±1.05bc |
781.8±80.2c |
9.2±1.3a |
148.4±1.3a |
2.43±0.17a |
Notes: MC, moisture content; FFA, free fatty acid content; DON, deoxynivalenol; ΔH, enthalpy of gelatinization. Within a column under the same factor, the values followed by the same superscript letter are not significantly different at P>0.05 according to Duncan’s multiple ranges test.
Table 2. The Values of Thermal Properties and Contents of Important Fatty Aicds in Grain Bulk Locations
Location |
No. |
Tp (C) |
Peak Enthalpy (0.01mW/mg) |
C16: 0 (mg/100g) |
C18: 0 (mg/100g) |
C18: 3n3 (mg/100g) |
C20: 0 (mg/100g) |
C20: 1 (mg/100g) |
Sampling |
A1 |
73.98±0.19abc |
8.91±0.54a |
112.97±4.31cd |
24.92±0.85e |
30.95±0.90bc |
5.88±0.20b |
6.60±0.21b |
A2 |
74.08±0.19ab |
8.64±0.54ab |
117.14±4.31bc |
24.47±0.85e |
31.97±0.90b |
5.84±0.20bc |
6.59±0.21b |
|
A3 |
74.03±0.19abc |
8.74±0.54a |
128.32±4.31a |
27.38±0.85bcd |
34.11±0.90a |
6.47±0.20a |
7.16±0.21a |
|
A4 |
74.04±0.19ab |
6.82±0.54d |
112.07±4.31d |
26.35±0.85de |
29.42±0.90cde |
5.54±0.20bc |
6.11±0.21cd |
|
A5 |
74.18±0.19a |
6.79±0.54d |
118.24±4.31bc |
29.13±0.85a |
30.13±0.90cd |
5.83±0.20bc |
6.22±0.21b |
|
A6 |
73.79±0.18bc |
7.58±0.54bcd |
100.46±4.31e |
25.02±0.85e |
27.77±0.90e |
4.99±0.20d |
5.53±0.21e |
|
A7 |
74.07±0.19ab |
7.59±0.54bcd |
123.42±4.31ab |
28.18±0.85abc |
31.23±0.90bc |
5.92±0.20b |
6.55±0.21b |
|
A8 |
74.09±0.19ab |
6.71±0.54d |
111.73±4.31d |
27.96±0.85abcd |
29.59±0.90cd |
5.61±0.20bc |
5.98±0.21d |
|
A9 |
73.66±0.19c |
8.24±0.54abc |
107.82±4.31de |
26.78±0.85cd |
28.62±0.90de |
5.47±0.20c |
6.09±0.21cd |
|
A10 |
73.81±0.19abc |
7.60±0.54bcd |
122.46±4.31ab |
28.71±0.85abc |
30.76±0.90bc |
5.91±0.20b |
6.41±0.21bcd |
|
A11 |
73.86±0.18abc |
7.22±0.52cd |
121.41±4.31abc |
28.86±0.85ab |
31.14±0.90bc |
5.80±0.20bc |
6.44±0.21bc |
|
Bulk Layer |
L1 |
73.93±0.11ab |
7.49±0.32a |
110.99±2.59b |
26.01±0.51b |
29.59±0.54b |
5.54±0.12b |
6.15±0.13b |
L2 |
74.05±0.12a |
7.71±0.33a |
118.43±2.59a |
27.48±0.51a |
31.01±0.54a |
5.84±0.12a |
6.39±0.13ab |
|
L3 |
74.11±0.12a |
7.68±0.33a |
116.05±2.59ab |
27.13±0.51a |
30.32±0.54ab |
5.79±0.12a |
6.36±0.13ab |
|
L4 |
73.77±0.11b |
7.98±0.32a |
118.55±2.59a |
27.65±0.51a |
31.12±0.54a |
5.82±0.12a |
6.45±0.13a |
Notes: Tp, peak temperature of gelatinization; C16:0, palmitic acid; C18:0, stearic acid; C18:3n3, α-linolenic acid; C20:0, arachidic acid; C20:1, cis-11-eicosenoic acid. Within a column under the same factor, the values followed by the same superscript letter are not significantly different at P>0.05 according to Duncan’s multiple ranges test.
Table 3. Comparison of Other Biochemical and Thermal Parameters among the Bulk Layers
Location |
Reducing Sugar (mg/g) |
Pentosan (mg/g) |
Amylose (%) |
Soluble Protein (mg/g) |
SH (mg/g) |
AA (mg NH2-N/g) |
L1 |
16.63±2.46a |
58.28±14.13a |
9.16±1.28a |
5.26±1.02a |
1.17±0.12a |
120. 8±13.5a |
L2 |
16.56±2.99a |
58.37±15.55a |
9.15±0.91a |
5.54±0.94a |
1.16±0.12a |
119.5±18.4a |
L3 |
17.05±2.91a |
54.29±15.56a |
9.19±1.33a |
5.16±1.42a |
1.15±0.12a |
115.9±11.3a |
L3 |
16.32±2.06a |
50.44±11.60a |
9.05±1.49a |
5.27±0.84a |
1.16±0.12a |
120.2±13.4a |
Mean |
16.64±1.67a |
55.34±12.45a |
9.14±1.39a |
5.31±0.78a |
1.16±0.12a |
119.1±9.4a |
Location |
To |
Tc |
Peak width(℃) |
C12:0 |
C14:0 |
C14:1 |
L1 |
70.91±1.01a |
76.88±0.86a |
5.45±1.00a |
1.44±0.51a |
1.01±0.19a |
0.74±0.23a |
L2 |
70.47±0.87a |
77.05±0.92a |
5.76±0.59a |
1.57±0.61a |
1.05±0.21a |
0.81±0.29a |
L3 |
70.76±1.57a |
77.26±1.87a |
5.41±1.03a |
1.59±0.64a |
1.04±0.21a |
0.81±0.24a |
L3 |
69.66±1.24a |
76.59±1.15a |
5.82±0.57a |
1.55±0.48a |
1.06±0.19a |
0.84±0.22a |
Mean |
70.47±1.23a |
77.04±1.26a |
5.66±0.84a |
1.54±0.56a |
1.04±0.19a |
0.81±0.24a |
Location |
C15:0 |
C15:1 |
C16:1 |
C17:0 |
C17:1 |
C18:1n9c |
L1 |
0.97±0.21a |
1.95±1.41a |
3.16±0.66a |
1.87±0.39a |
1.01±0.18a |
360.4±48.8a |
L2 |
1.06±0.26a |
2.11±1.19a |
3.19±0.54a |
2.04±0.23a |
1.04±0.14a |
357.3±33.4a |
L3 |
1.06±0.27a |
2.13±1.25a |
3.02±0.41a |
1.99±0.24a |
1.06±0.15a |
363.4±47. 9a |
L3 |
1.06±0.21a |
2.09±1.43a |
3.07±0.48a |
2.01±0.21a |
1.03±0.13a |
359.9±42.5a |
Mean |
1.04±0.24a |
2.07±1.31a |
3.11±0.53a |
1.98±0.28a |
1.04±0.15a |
360.3±43.1a |
Location |
C20:2 |
C21:0 |
C20:3n6 |
C20:4n6 |
C20:5n3 |
C18:2n6c |
L1 |
1.25±0.36a |
4.35±1.11a |
3.21±0.39a |
2.44±0.39a |
1.63±0.63a |
1462±259a |
L2 |
1.23±0.41a |
4.18±0.91a |
3.38±0.42a |
2.31±0.48a |
1.87±0.54a |
1541±187a |
L3 |
1.14±0.39a |
4.32±0.93a |
3.31±0.38a |
2.66±0.48a |
1.81±0.49a |
1482±189a |
L3 |
1.18±0.43a |
4.23±1.19a |
3.44±0.60a |
2.55±0.48a |
1.93±0.48a |
1535±152a |
Mean |
1.20±0.39a |
4.27±1.04a |
3.33±0.46a |
2.49±0.48a |
1.81±0.55a |
1505±201a |
Location |
C22:1n9 |
C22:2n6 |
C23:0 |
C24:0 |
Total FA |
Saturated FA |
L1 |
3.80±1.10a |
5.65±0.89a |
2.17±0.91a |
2.57±0.52a |
2039±325a |
156.9±27.7a |
L2 |
3.56±1.14a |
5.61±0.86a |
1.63±0.81a |
2.80±0.28a |
2127±229a |
166.1±16.9a |
L3 |
4.29±1.21a |
5.92±2.40a |
1.88±0.86a |
2.72±0.35a |
2072±236a |
163.6±20.5a |
L3 |
3.46±1.03a |
5.77±0.77a |
2.13±0.99a |
2.77±0.29a |
2125±194a |
166.9±15.4a |
Mean |
3.77±1.15a |
5.74±1.39a |
1.95±0.91a |
2.72±0.38a |
2091±251a |
163.4±20.8a |
Location |
Unsaturated FA |
MUSFA |
PUSFA |
Ratio |
|
|
L1 |
1883±298a |
377.3±50.2a |
1505±264a |
12.05±0.55a |
|
|
L2 |
1961±214a |
374.4±34.1a |
1587±189a |
11.81±0.58a |
|
|
L3 |
1908±216a |
381.1±48.6a |
1527±192a |
11.70±0.51a |
|
|
L3 |
1958±180a |
376.9±43.1a |
1581±154a |
11.75±0.52a |
|
|
Mean |
1928±231a |
377.4±44.0a |
1550±205a |
11.82±0.55a |
|
|
Notes: SH, sulfhydryl group; AA, free amino acids; To, onset temperature of gelatinization; Tc, final temperature of gelatinization; C12:0, Lauric acid; C14:0, Myristic acid; C14:1, Myristoleic acid; C15:0, Pentadecanoic acid; C15:1, cis-10-Pentadecenoic acid; C16:1, Palmitoleic acid; C17:0, Heptadecanoic acid; C17:1, Ginkgolic acid;C18:1n9c, Oleic acid; C20:2, cis-11,14-Eicosatrienoic acid; C21:0, Heneicosanoic acid; C20:3n6, cis-8,11,14-Eicosatrienoic acid; C20:4n6, Arachidonic acid; C20:5n3, cis-5,8,11,14,17-Eicosapentataenoic acid; C18:2n6c, Linoleic acid; C22:1n9, Erucic acid; C22:2n6, cis-13,16-Docosadienoic acid; C23:0, Tricosanoic acid; C24:0, Lignoceric acid; FA, fatty acids, the units of all fatty acids are mg/100g; MUSFA, mon-unsaturated FA; PUSFA, poly-unsaturated FA; Ratio, the ratio of unsaturated to saturated FA content. Means with the different superscript letters in a column are different significantly (P<0.05) among different bulk layers.
Table 4 showed the coefficients of correlation between biochemical and thermal properties. The FFA content was significantly correlated to kernel breakage percentage and DON content. Kernel breakage percentage was significantly correlated to pentosan content. Pentosan content was significantly correlated to the contents of amylose and amino acids and gelatinization peak width. Amylose content was significantly related to contents of moisture, reducing sugars and SH groups.
Table 4. Correlation Analysis between Biochemical and Thermal Properties
|
MC |
FFA Content |
Breakage Percentage |
DON Content |
Water Adsorption |
Reducing Sugar |
Pentosan Content |
Amylose Content |
Soluble Protein |
MC |
|
-0.1000 |
0.0316 |
-0.0436 |
-0.2337** |
0.1411 |
0.1473 |
0.2644** |
-0.1253 |
FFA |
-0.1005 |
- |
0.3090** |
0.3523** |
0.1201 |
0.1331 |
-0.1334 |
0.0332 |
0.0283 |
Breakage percentage |
0.0332 |
0.3090** |
- |
-0.0714 |
0.0141 |
-0.1005 |
-0.1892* |
0.0714 |
-0.0511 |
DON |
-0.0436 |
0.3523** |
-0.0714 |
- |
0.0491 |
0.0436 |
-0.0245 |
-0.0491 |
0.0991 |
Water adsorption |
-0.2337** |
0.1200 |
0.0141 |
0.0490 |
- |
-0.1511 |
-0.0781 |
-0.0141 |
-0.0641 |
Reducing sugar |
0.1411 |
0.1330 |
-0.1005 |
0.0436 |
-0.1511 |
- |
-0.1308 |
0.2088* |
0.2086* |
Pentosan |
0.1473 |
-0.1334 |
-0.1892* |
-0.0245 |
-0.0781 |
-0.1308 |
- |
-0.3404** |
-0.0458 |
Amylose |
0.2644** |
0.0316 |
0.0714 |
-0.049 |
-0.0141 |
0.2088* |
-0.3404** |
- |
-0.1212 |
Soluble Pro |
-0.1253 |
0.0283 |
-0.0510 |
0.0990 |
-0.0641 |
0.2093* |
-0.0458 |
-0.1212 |
- |
AA |
0.0954 |
0.0949 |
-0.0100 |
-0.0469 |
-0.2575** |
0.3251** |
0.2071* |
-0.1453 |
0.1801* |
SH |
0.1338 |
0.1170 |
0.0700 |
-0.0300 |
-0.0346 |
0.0245 |
-0.1407 |
0.3351** |
0.0224 |
ΔH |
0.1015 |
-0.0592 |
-0.0640 |
0.0938 |
-0.0412 |
0.1546 |
0.0678 |
-0.0424 |
0.0728 |
Tp |
-0.0173 |
0.0831 |
-0.0332 |
0.1091 |
-0.1971* |
0.0721 |
-0.0964 |
0.0491 |
0.0529 |
To |
-0.0424 |
-0.0071 |
-0.0566 |
0.0458 |
-0.1439 |
0.0224 |
-0.0557 |
0.0045 |
-0.0387 |
Tc |
0.1162 |
0.1131 |
0.0837 |
0.2227** |
-0.1063 |
0.1497 |
-0.0265 |
0.0201 |
0.0917 |
Peak width |
0.1559 |
-0.0100 |
0.0374 |
-0.0608 |
0.0412 |
0.1428 |
0.1811* |
-0.0671 |
0.0933 |
Peak enthalpy |
0.0964 |
-0.0283 |
-0.0412 |
0.0316 |
-0.0265 |
0.1766* |
0.0714 |
-0.0001 |
0.0374 |
|
AA Content |
SH Content |
ΔH |
Tp |
To |
Tc |
Peak Width |
Peak Enthalpy |
|
MC |
0.0954 |
0.1338 |
0.1015 |
-0.0173 |
-0.0424 |
0.1162 |
0.1559 |
0.0964 |
|
FFA |
0.0954 |
0.1171 |
-0.0583 |
0.0831 |
-0.0031 |
0.1136 |
-0.0101 |
-0.0283 |
|
Breakage percentage |
-0.0101 |
0.0701 |
-0.0648 |
-0.0374 |
-0.0641 |
0.0812 |
0.0412 |
-0.0424 |
|
DON |
-0.0469 |
-0.0301 |
-0.0964 |
0.0458 |
0.1101 |
0.2238** |
0.0301 |
-0.0608 |
|
Water adsorption |
-0.2575** |
-0.0346 |
-0.0412 |
-0.1971* |
-0.1439 |
-0.1063 |
0.0412 |
-0.0265 |
|
Reducing sugar |
0.3251** |
0.0245 |
0.1546 |
0.0721 |
0.0224 |
0.1497 |
0.1428 |
0.1766* |
|
Pentosan |
0.2071* |
-0.1407 |
0.0678 |
-0.0964 |
-0.0557 |
-0.0265 |
0.1811* |
0.0714 |
|
Amylose |
-0.1453 |
0.3351** |
-0.0424 |
0.0491 |
0.0045 |
0.0201 |
-0.0671 |
-0.0001 |
|
Soluble Pro |
0.1801* |
0.0224 |
0.0728 |
0.0529 |
-0.0387 |
0.0917 |
0.0933 |
0.0374 |
|
AA |
- |
0.0843 |
0.0971 |
0.0574 |
-0.0332 |
0.1473 |
0.2411** |
0.0787 |
|
SH |
0.0843 |
- |
0.0748 |
0.1513 |
-0.0511 |
0.1786* |
0.1849* |
0.1559 |
|
ΔH |
0.0971 |
0.0748 |
- |
-0.1353 |
-0.2301* |
0.2066* |
0.4787** |
0.5853** |
|
Tp |
0.0574 |
0.1513 |
-0.1353 |
- |
0.6191** |
0.3489** |
-0.3072** |
-0.2782** |
|
To |
-0.0332 |
-0.0511 |
-0.2301** |
0.6191** |
- |
0.0201 |
-0.5702** |
-0.4747** |
|
Tc |
0.1473 |
0.1786* |
0.2066* |
0.3489** |
0.0201 |
- |
0.4107** |
0.2861** |
|
Peak width |
0.2411** |
0.1849* |
0.4787** |
-0.3072** |
-0.5702** |
0.4119** |
- |
0.7909** |
|
Peak enthalpy |
0.0787 |
0.1559 |
0.5853** |
0.2709** |
-0.4747** |
0.2861** |
0.7909** |
- |
|
Notes: MC, moisture content (% w.b.); FFA, free fatty acids (mg KOH/100g); DON, deoxynivalenol (ppb); FAA, free amino acids (mg NH2-N/g); SH, sulfhydryl group (mg/g); ∆H, enthalpy of gelatinization (J/g); To, onset temperature of gelatinization (℃); Tp, peak temperature of gelatinization (℃); Tc, final temperature of gelatinization (℃). **very significant, *significant, df=130, P=0.171 for α=0.05, P=0.223 for α=0.01.
Reducing sugar content was significantly related to contents of amino acids and soluble proteins and gelatinization peak enthalpy. Soluble protein content was significantly related to amino acid content. The content of amino acids was significantly related to water adsorption rate and gelatinization peak width. SH content was significantly related to the conclusion temperature (Tc) and peak width of gelatinization. Water adsorption rate was significantly related to MC and the peak temperature (Tp) of gelatinization.
The DON content was significantly related to Tc. The enthalpy of gelatinization (ΔH) was significantly related to To, Tc, the peak width and peak ΔH. Tp was significantly related to To, Tc, the peak width and peak ΔH. Both To and Tc were significantly related to the peak width and peak ΔH. The peak width of gelatinization was significantly related to the peak ΔH. These results showed that the eleven biochemical indexes and six thermal parameters listed in Table 1 could be used for screening for the parameters that influence the short-term storage of shelled corn with slightly high MC.
Table 5 further showed the coefficients of the correlations between the cumulative values of intergranular air properties and biochemical and thermal parameters in bulk grain. The FFA content was significantly related to the cumulative values of minimum dry-bulb temperature, minimum HR, minimum wet-bulb temperature, and minimum DPT. Breakage percentage was significantly related to the cumulative values of mean dry-bulb temperature, mean RH, mean HR, mean wet-bulb temperature, and mean DPT. The water adsorption rate was significantly related to the cumulative mean RHs. The ΔH was significantly related to the cumulative values of minimum HR and minimum RH. Tc was significantly related to the cumulative maximum RH. The peak ΔH was significantly related to the cumulative values of minimum dry-bulb temperature, minimum HR, minimum RH, minimum wet-bulb temperature, and minimum DPT. Thus, FFA content, water absorption rate, kernel breakage percentage and thermal property parameters like the ΔH and peak ΔH could be used to evaluate the short-term storage of shelled corn with slightly high MC.
Table 5. Correlation Analysis among the Cumulative Values of Intergranular Air Properties in Grain Bulk and Biochemical and Thermal Parameters
Parameter |
|
MC |
FFA Content |
Breakage Percentage |
DON Content |
Water Adsorption |
Reducing Sugar |
Pentosan Content |
Amylose Content |
Soluble Protein |
Cumulative |
max. |
0.7388 |
0.5881 |
-0.0877 |
0.6432 |
-0.3524 |
0.6102 |
0.5127 |
0.7346 |
0.2059 |
Dry bulb |
min. |
-0.5695 |
-0.9154* |
-0.6329 |
-0.5302 |
-0.3723 |
-0.3582 |
0.0894 |
-0.2471 |
-0.2567 |
Temp. |
mean |
-0.2982 |
-0.8626 |
-0.9125* |
-0.3059 |
-0.7291 |
-0.0943 |
0.4491 |
0.1356 |
-0.2156 |
Cumulative |
max. |
0.8475 |
0.7323 |
-0.0141 |
0.7422 |
-0.3243 |
0.6861 |
0.528 |
0.8031 |
0.2482 |
RHs |
min. |
-0.3751 |
-0.8204 |
-0.7469 |
-0.3655 |
-0.5485 |
-0.1831 |
0.2874 |
-0.0141 |
-0.2152 |
|
mean |
-0.0361 |
-0.6784 |
-0.9802** |
-0.0800 |
-0.8877* |
0.1277 |
0.6561 |
0.4126 |
-0.1481 |
Cumulative |
max. |
0.7501 |
0.5982 |
-0.0872 |
0.6531 |
-0.3561 |
0.6193 |
0.5193 |
0.7451 |
0.2093 |
Tumidity |
min. |
-0.5146 |
-0.9009* |
-0.6841 |
-0.4845 |
-0.4395 |
-0.3056 |
0.1587 |
-0.1718 |
-0.2476 |
Ratio |
mean |
-0.2681 |
-0.8443 |
-0.9246* |
-0.2804 |
-0.7513 |
-0.0686 |
0.4759 |
0.1694 |
-0.2086 |
Cumulative |
max. |
0.7468 |
0.5970 |
-0.0849 |
0.6503 |
-0.3527 |
0.6162 |
0.5157 |
0.7408 |
0.2086 |
Wet bulb |
min. |
-0.5651 |
-0.9138* |
-0.6366 |
-0.5264 |
-0.3774 |
-0.3541 |
0.0949 |
-0.2411 |
-0.2557 |
Temp. |
mean |
-0.2912 |
-0.8585 |
-0.9154* |
-0.3002 |
-0.7343 |
-0.0883 |
0.4553 |
0.1435 |
-0.2141 |
Cumulative |
max. |
0.7502 |
0.5942 |
-0.0938 |
0.6529 |
-0.3621 |
0.6204 |
0.5238 |
0.7481 |
0.2083 |
dewpoint |
min. |
-0.5593 |
-0.9123* |
-0.6418 |
-0.5217 |
-0.3842 |
-0.3486 |
0.1021 |
-0.2332 |
-0.2551 |
temp. |
mean |
-0.2872 |
-0.8560 |
-0.9171* |
-0.2966 |
-0.7373 |
-0.0849 |
0.4591 |
0.1481 |
-0.2131 |
Parameter |
|
AA content |
SH content |
ΔH |
Tp |
To |
Tc |
Peak width |
Peak enthalpy |
|
Cumulative |
max. |
-0.5122 |
-0.4001 |
0.3567 |
0.8179 |
0.6336 |
0.8663 |
-0.2661 |
0.6856 |
|
drybulb |
min. |
0.6625 |
0.8176 |
-0.8477 |
-0.3335 |
-0.0055 |
-0.6067 |
-0.2267 |
-0.9934** |
|
Temp. |
mean |
0.5689 |
0.8504 |
-0.8290 |
0.0283 |
0.4055 |
-0.2375 |
-0.4569 |
-0.8331 |
|
Cumulative |
max. |
-0.5207 |
-0.4073 |
0.3497 |
0.8267 |
0.6408 |
0.8748 |
-0.2720 |
0.6861 |
|
Humidity |
min. |
0.6413 |
0.8201 |
-0.8849* |
-0.2588 |
0.0700 |
-0.5471 |
-0.2800 |
-0.9939** |
|
Ratio |
mean |
0.5514 |
0.8405 |
-0.8602 |
0.1187 |
0.4338 |
-0.2142 |
-0.4815 |
-0.8422 |
|
Cumulative |
max. |
-0.6207 |
-0.5221 |
0.3205 |
0.8702 |
0.6534 |
0.9341* |
-0.2871 |
0.7153 |
|
RHs |
min. |
0.5625 |
0.7784 |
-0.9542* |
-0.1044 |
0.2133 |
-0.4119 |
-0.3805 |
-0.9750** |
|
|
mean |
0.4015 |
0.7355 |
-0.8277 |
0.3759 |
0.6471 |
0.0412 |
-0.5947 |
-0.6913 |
|
Cumulative |
max. |
-0.5191 |
-0.4069 |
0.3540 |
0.8231 |
0.6369 |
0.8722 |
-0.2687 |
0.6877 |
|
Wet bulb |
min. |
0.6605 |
0.8173 |
-0.8512 |
-0.3276 |
0.0004 |
-0.6021 |
-0.2309 |
-0.9937** |
|
Temp. |
mean |
0.5649 |
0.8482 |
-0.8301 |
0.0975 |
0.4126 |
-0.2302 |
-0.4612 |
-0.8303 |
|
Cumulative |
max. |
-0.5184 |
-0.4027 |
0.3438 |
0.8295 |
0.6453 |
0.8753 |
-0.2762 |
0.6813 |
|
Dewpoint |
min. |
0.6583 |
0.8176 |
-0.8553 |
-0.3202 |
0.0084 |
-0.5961 |
-0.2364 |
-0.9940** |
|
Temp. |
mean |
0.5625 |
0.8468 |
-0.8279 |
0.1025 |
0.4170 |
-0.2249 |
-0.4631 |
-0.8264 |
|
Notes: MC, moisture content (% w.b.); FFA, free fatty acids (mg KOH/100g); DON, deoxynivalenol (ppb); FAA, free amino acids (mg NH2-N/g); SH, sulfhydryl group (mg/g); ΔH, enthalpy of gelatinization (J/g); To, onset temperature of gelatinization (℃); Tp, peak temperature of gelatinization (℃); Tc, final temperature of gelatinization (℃). **very significant, *significant, df=3, P=0.8783 for α=0.05, P=0.9587 for α=0.01.
3.4 Correlations between the Cumulative Values of Intergranular Air Properties in Bulk Grain and the Fatty Acid Profile
Table 6 showed the coefficients of correlation between the fatty acid profile and certain biochemical and thermal parameters of cornmeal. The water adsorption rate was significantly related to 13 of the 24 species of fatty acid compounds. The FFA content and breakage percentage were both significantly related to nine species of fatty acid compounds. The ΔH was significantly related to eight species of fatty acid compounds. Pentosan content, Tp, peak enthalpy, and Tc were significantly related to seven, six, five, and four species of fatty acid compounds, respectively. DON was not significantly correlated to any of the 24 fatty acid compounds.
Table 6. Correlation Analysis between Fatty Acids Profile and Biochemical and Thermal Properties
Fatty Acid Species |
FFA Content |
Breakage Percentage |
DON Content |
Water Adsorption Rate |
Pen-tosan Content |
ΔH |
Tp |
Tc |
Peak Enthalpy |
C12:0 |
0.0901 |
0.1031 |
0.1175 |
0.3158** |
0.1233 |
-0.2559** |
-0.0481 |
-0.1095 |
-0.2437** |
C14:0 |
-0.0539 |
-0.0201 |
0.0641 |
0.3477** |
0.1031 |
-0.2179* |
-0.0877 |
-0.1507 |
-0.2095* |
C14:1 |
0.1145 |
0.0954 |
0.1697 |
0.3941** |
0.0608 |
-0.2032* |
-0.0583 |
-0.0889 |
-0.2184* |
C15:0 |
0.0663 |
0.1171 |
0.0539 |
0.3315** |
0.1649 |
-0.2553** |
-0.0755 |
-0.0894 |
-0.1481 |
C15:1 |
0.0387 |
0.1217 |
0.0265 |
0.3726** |
0.0511 |
-0.2152* |
-0.1269 |
-0.1233 |
-0.1521 |
C16:0 |
-0.2326** |
-0.2567** |
0.0332 |
-0.1127 |
0.0006 |
0.0401 |
0.1568 |
0.0346 |
-0.0173 |
C16:1 |
-0.2484** |
-0.1543 |
-0.0141 |
0.0141 |
-0.0265 |
0.0071 |
-0.1507 |
-0.0812 |
0.0084 |
C17:0 |
-0.1729* |
-0.2352** |
0.0332 |
-0.1521 |
0.0332 |
0.0283 |
0.1688 |
-0.0101 |
0.0101 |
C17:1 |
0.0346 |
-0.0889 |
0.1667 |
0.0714 |
-0.1766* |
0.1327 |
0.1249 |
-0.0101 |
0.0084 |
C18:0 |
-0.2166* |
-0.1847* |
0.0063 |
0.0436 |
0.0641 |
-0.1044 |
0.1166 |
-0.0141 |
-0.1158 |
C18:1n9c |
-0.3165** |
-0.2668** |
-0.0861 |
0.0141 |
-0.1775* |
0.0601 |
0.0011 |
-0.0447 |
0.0481 |
C18:2n6c |
-0.1871* |
-0.2011* |
-0.0101 |
-0.2666** |
0.0283 |
0.0995 |
0.2261** |
0.1162 |
0.0173 |
C18:3n3 |
-0.2502** |
-0.2293** |
-0.0245 |
-0.2027* |
-0.0346 |
0.1136 |
0.1786* |
0.0964 |
0.0283 |
C20:0 |
-0.2315** |
-0.2379** |
-0.0173 |
-0.1873* |
-0.0574 |
0.0641 |
0.1836* |
0.0592 |
0.0141 |
C20:1 |
-0.2220* |
-0.2335** |
-0.0201 |
-0.2472** |
-0.0557 |
0.1122 |
0.1597 |
0.0843 |
0.0557 |
C20:2 |
-0.0063 |
-0.0964 |
-0.1679 |
-0.0469 |
0.3233** |
-0.1127 |
0.0173 |
-0.1794* |
-0.1114 |
C21:0 |
0.0964 |
-0.0735 |
0.1562 |
-0.3289** |
-0.2375** |
0.1769* |
0.1721* |
0.2302** |
0.1281 |
C20:3n6 |
-0.0794 |
-0.1118 |
0.1082 |
-0.0735 |
-0.0843 |
-0.0412 |
0.0616 |
0.0361 |
0.0283 |
C20:4n6 |
-0.0265 |
0.0283 |
0.0201 |
-0.0768 |
-0.2052* |
0.0971 |
0.0529 |
0.2289** |
0.1005 |
C20:5n3 |
-0.1697 |
-0.1497 |
-0.1466 |
0.1292 |
0.1961* |
-0.0641 |
0.1005 |
-0.1487 |
-0.0748 |
C22:1n9 |
0.1162 |
-0.0574 |
0.0481 |
-0.2831** |
-0.1936* |
0.1526 |
0.2269** |
0.1769* |
0.1364 |
C22:2n6 |
-0.0332 |
0.0511 |
-0.0374 |
-0.0601 |
-0.0933 |
0.1729* |
-0.1166 |
0.0447 |
0.2362** |
C23:0 |
0.0084 |
-0.1356 |
0.0412 |
-0.2468** |
-0.0265 |
0.2317** |
0.1345 |
0.1183 |
0.2159* |
C24:0 |
-0.0819 |
-0.1766* |
0.1389 |
-0.1723* |
-0.1166 |
0.0077 |
0.2812** |
0.1671 |
-0.0447 |
Total |
-0.2276** |
-0.2322** |
-0.0201 |
-0.2229* |
-0.0101 |
0.0943 |
0.1982* |
0.0906 |
0.0224 |
Saturated |
-0.2216* |
-0.2518** |
0.0436 |
-0.1054 |
0.0001 |
0.0245 |
0.1676 |
0.0412 |
-0.0245 |
Unsaturated |
-0.2267** |
-0.2291** |
-0.0265 |
-0.2326** |
-0.0101 |
0.1005 |
0.2002* |
0.0943 |
0.0265 |
Mono-unsaturated |
-0.3122** |
-0.2653** |
-0.0812 |
0.0141 |
-0.1792* |
0.0583 |
0.0045 |
-0.0436 |
0.0458 |
Polyunsaturated |
-0.1889* |
-0.2015* |
-0.0101 |
-0.2655** |
0.0265 |
0.1005 |
0.2245** |
0.1162 |
0.0201 |
Ratio |
0.0671 |
0.1401 |
-0.2095* |
-0.2914** |
-0.0141 |
0.1769* |
0.0283 |
0.1131 |
0.1315 |
Notes: FFA, free fatty acids (mg KOH/100g); DON, deoxynivalenol (ppb); ΔH, enthalpy of gelatinization (J/g); Tp, peak temperature of gelatinization (℃); Tc, final temperature of gelatinization (℃). Ratio is the ratio of unstaturated to saturated fatty acid content. **, very significant, *significant, df=130, P=0.171 for α=0.05, P=0.223 for α=0.01.
For fatty acid contents > 5mg/100g, the C16:0 and C18:0 ratios showed significant correlations to FFA content and breakage percentage. C18:1n9c was significantly correlated to FFA content, breakage percentage and pentosan content. C18:2n6c, C18:3n3, and C20:0 was significantly correlated to FFA content, breakage percentage, water adsorption rate and Tp. C20:1 was significantly correlated to FFA content, breakage percentage, and water absorption rate. C22:2n6 was significantly correlated to the ΔH and peak enthalpy.
Total unsaturated, and poly-unsaturated fatty acids were significantly related to FFA content, breakage percentage, water adsorption rate and Tp. Saturated fatty acids were significantly related to FFA content and breakage percentage, whilst mono-unsaturated fatty acids were significantly related to FFA content, breakage percentage, and pentosan content. The ratio of unsaturated to saturated fatty acids was significantly related to water absorption rate, DON content, and ΔH.
These results showed that FFA content, breakage percentage, water adsorption rate, and thermal properties such as Tp and the ΔH, as well as fatty acid profiles such as C16:0, C18:0, C18:1n9c, C18:2n6c, C18:3n3, C20:0, C20:1 and C22:2n6, could be used to indicate the storage quality of shelled corn with slightly high MC.
Tables 7 and 8 showed the coefficients of correlation between the cumulative values of intergranular air properties in bulk grain and fatty acid profiles. C12:0 was significantly related to the cumulative minimum dry-bulb, wet-bulb, and DPTs, RH and HR. Twelve fatty acids (C12:0, C14:0, C14:1, C15:0, C15:1, C16:0, C17:0, C18:0, C20:0, C20:1, C20:5n3 and C24:0) were significantly related to the cumulative mean dry-bulb, wet-bulb, and DPTs, RH and HR, respectively. Moreover, C18:3n3 and C20:3n6 were significantly related to the mean RH cumulative values.
Table 7. Correlation Analysis between the Cumulative Drybulb Temperature or the Cumlative RH in Grain Bulk and Fatty Acids Profile
Fatty Acid Species |
Cumu- lative |
Drybulb |
Temp |
Cumu- lative |
RH |
|
Cumulative |
Humidity |
Ratio |
Max. |
Min. |
Mean |
Max. |
Min. |
Mean |
Max. |
Min. |
Mean |
|
C12:0 |
0.3203 |
-0.8806* |
-0.9867** |
0.4461 |
-0.8786* |
-0.9065* |
0.3268 |
-0.8971* |
-0.9815** |
C14:0 |
-0.1345 |
-0.6042 |
-0.9032* |
-0.0663 |
-0.7312 |
-0.9877** |
-0.1345 |
-0.6592 |
-0.9173* |
C14:1 |
-0.1572 |
-0.5844 |
-0.8912* |
-0.0927 |
-0.7173 |
-0.9839** |
-0.1578 |
-0.6411 |
-0.9063* |
C15:0 |
0.2052 |
-0.8355 |
-0.9994** |
0.3192 |
-0.8747 |
-0.9624** |
0.2101 |
-0.8634 |
-0.9995** |
C15:1 |
0.2934 |
-0.8696 |
-0.9891** |
0.4164 |
-0.8758 |
-0.9187* |
0.2995 |
-0.8887* |
-0.9849** |
C16:0 |
0.0045 |
-0.6862 |
-0.9259** |
0.0901 |
-0.7738 |
-0.9602** |
0.0063 |
-0.7295 |
-0.9341* |
C16:1 |
0.0911 |
0.2504 |
0.3972 |
0.0648 |
0.3161 |
0.4464 |
0.0922 |
0.2777 |
0.4048 |
C17:0 |
0.1628 |
-0.7941 |
-0.9701** |
0.2698 |
-0.8378 |
-0.9475* |
0.1671 |
-0.8243 |
-0.9717** |
C17:1 |
0.5641 |
-0.8437 |
-0.7809 |
0.6977 |
-0.7484 |
-0.6027 |
0.1601 |
-0.8277 |
-0.7631 |
C18:0 |
-0.0346 |
-0.6717 |
-0.9309* |
0.0469 |
-0.7714 |
-0.9797** |
-0.0332 |
-0.7187 |
-0.9409* |
C18:1n9c |
0.0501 |
0.0095 |
0.0447 |
0.0521 |
0.0283 |
0.0656 |
0.0511 |
0.0173 |
0.0481 |
C18:2n6c |
-0.1179 |
-0.4668 |
-0.7071 |
-0.0663 |
-0.5702 |
-0.7781 |
-0.1187 |
-0.5111 |
-0.7187 |
C18:3n3 |
-0.1122 |
-0.5633 |
-0.8338 |
-0.0481 |
-0.6771 |
-0.9076* |
-0.1122 |
-0.6129 |
-0.8463 |
C20:0 |
0.1459 |
-0.7986 |
-0.9872** |
0.2526 |
-0.8492 |
-0.9715** |
0.1501 |
-0.8314 |
-0.9897** |
C20:1 |
-0.0812 |
-0.6459 |
-0.9258* |
-0.0055 |
-0.7591 |
-0.9917** |
-0.0806 |
-0.6971 |
-0.9378* |
C20:2 |
-0.1229 |
0.5869 |
0.7158 |
-0.2017 |
0.6186 |
0.6983 |
-0.1257 |
0.6092 |
0.7171 |
C21:0 |
-0.0458 |
0.5197 |
0.6745 |
-0.1114 |
0.5708 |
0.6842 |
-0.0469 |
0.5471 |
0.6786 |
C20:3n6 |
-0.2091 |
-0.5024 |
-0.8134 |
-0.1575 |
-0.6435 |
-0.9222* |
-0.2105 |
-0.5602 |
-0.8301 |
C20:4n6 |
-0.1308 |
-0.0938 |
-0.2102 |
-0.1253 |
-0.1533 |
-0.2666 |
-0.1319 |
-0.1158 |
0.2179 |
C20:5n3 |
-0.1072 |
-0.6143 |
-0.8997* |
-0.0361 |
-0.7329 |
-0.9742** |
-0.1068 |
-0.6667 |
-0.9126* |
C22:1n9 |
0.4702 |
-0.2317 |
-0.0141 |
0.5231 |
-0.0906 |
0.1609 |
0.4771 |
-0.1881 |
-0.0084 |
C22:2n6 |
0.0424 |
-0.3271 |
-0.4156 |
0.0849 |
-0.3541 |
-0.4161 |
0.0436 |
-0.3426 |
-0.4175 |
C23:0 |
-0.6548 |
0.7811 |
0.6382 |
-0.7854 |
0.6447 |
0.4208 |
-0.6654 |
0.7499 |
0.6151 |
C24:0 |
0.0831 |
-0.7286 |
-0.9331* |
0.1775 |
-0.7932 |
-0.9385* |
0.0861 |
-0.7648 |
-0.9378* |
Total |
-0.1068 |
-0.5198 |
-0.7716 |
-0.0481 |
-0.6259 |
-0.8411 |
-0.1068 |
-0.5661 |
-0.7833 |
Saturated |
-0.0245 |
-0.6746 |
-0.9283* |
0.0583 |
-0.7711 |
-0.9733** |
-0.0224 |
-0.7206 |
-0.9379* |
Unsaturated |
-0.1158 |
-0.4977 |
-0.7473 |
-0.0601 |
-0.6042 |
-0.8189 |
-0.1158 |
-0.5436 |
-0.7592 |
Mono-unsaturated |
0.1201 |
-0.0901 |
-0.0458 |
0.1371 |
-0.0583 |
-0.0026 |
0.1217 |
-0.0812 |
-0.0401 |
Polyunsaturated |
-0.1192 |
-0.4713 |
-0.7139 |
-0.0671 |
-0.5757 |
-0.7856 |
-0.1196 |
-0.5161 |
-0.7256 |
Ratio |
-0.1323 |
0.1401 |
0.9481* |
-0.2337 |
0.8141 |
0.9359* |
-0.1361 |
0.7954 |
0.9508* |
Notes: Ratio is the ratio of unsaturated to saturated fatty acid content; **very significant, *significant, df=3, P=0.8783 for α=0.05, P=0.9587 for α=0.01.
Among the eight fatty acids with contents above 5mg/100g, five fatty acids-C16:0, C18:0, C18:3n3, C20:0 and C20:1-were significantly related to the cumulative mean intergranular air properties in bulk grain. The content of saturated fatty acids and the ratio of unsaturated to saturated fatty acids were significantly related to the mean cumulative values of intergranular air properties in bulk grain.
Table 8. Correlation Analysis between the Cumulative Wet-bulb Temperature or the Cumlative Dewpoint Temp. in Grain Bulk and Fatty Acids Profile
Fatty Acid Species |
Cumulative |
Wetbulb |
Temp. |
Cumulative |
Dewpoint |
Temp. |
Max. |
Min. |
Mean |
Max. |
Min. |
Mean |
|
C12:0 |
0.3273 |
-0.8814* |
-0.9856** |
0.3211 |
-0.8831* |
-0.9849** |
C14:0 |
-0.1315 |
-0.6081 |
-0.9065* |
-0.1407 |
-0.6138 |
-0.9084* |
C14:1 |
-0.1552 |
-0.5885 |
-0.8948* |
-0.1646 |
-0.5943 |
-0.8968* |
C15:0 |
0.2107 |
-0.8373 |
-0.9996** |
0.2037 |
-0.8401 |
-0.9996** |
C15:1 |
0.3002 |
0.8707 |
-0.9882** |
0.2938 |
-0.8726 |
-0.9876** |
C16:0 |
0.0077 |
0.6893 |
-0.9278* |
-0.0002 |
-0.6937 |
-0.9289* |
C16:1 |
0.0906 |
-0.2524 |
0.3991 |
0.0954 |
0.2551 |
0.4001 |
C17:0 |
0.1682 |
0.7959 |
-0.9706* |
0.1609 |
-0.7991 |
-0.9708** |
C17:1 |
0.5723 |
-0.8421 |
-0.7769 |
0.5701 |
-0.8404 |
-0.7745 |
C18:0 |
-0.0332 |
-0.6751 |
-0.9333* |
-0.0401 |
-0.6799 |
-0.9346* |
C18:1n9c |
0.0511 |
0.0101 |
0.0458 |
0.0521 |
0.0101 |
0.0458 |
C18:2n6c |
-0.1162 |
-0.4701 |
-0.7099 |
-0.1237 |
-0.4746 |
-0.7114 |
C18:3n3 |
-0.1101 |
-0.5668 |
-0.8368 |
-0.1179 |
-0.5719 |
-0.8385 |
C20:0 |
0.1513 |
-0.8007 |
-0.9881** |
0.1435 |
-0.8041 |
-0.9882** |
C20:1 |
-0.0781 |
-0.6495 |
-0.9287* |
-0.0872 |
-0.6548 |
-0.9303* |
C20:2 |
-0.1269 |
0.5884 |
0.7162 |
-0.1212 |
0.5907 |
0.7163 |
C21:0 |
-0.0481 |
0.5214 |
0.6755 |
-0.0424 |
0.5243 |
0.6761 |
C20:3n6 |
-0.2078 |
-0.5067 |
-0.8174 |
-0.2166 |
-0.5125 |
-0.8196 |
C20:4n6 |
-0.1308 |
-0.0954 |
-0.2124 |
-0.1338 |
-0.0981 |
0.2131 |
C20:5n3 |
-0.1044 |
-0.6181 |
-0.9028* |
-0.1131 |
-0.6235 |
-0.9045* |
C22:1n9 |
0.4746 |
-0.0721 |
-0.0077 |
0.4782 |
-0.2238 |
-0.0045 |
C22:2n6 |
0.0436 |
-0.3281 |
-0.4161 |
0.0412 |
-0.3297 |
-0.4163 |
C23:0 |
-0.6632 |
0.7783 |
0.6331 |
-0.6631 |
0.7751 |
0.6298 |
C24:0 |
0.0872 |
-0.7372 |
-0.9342* |
0.0801 |
-0.7348 |
-0.9348* |
Total |
-0.1054 |
-0.5232 |
-0.7743 |
-0.1122 |
-0.5278 |
-0.7761 |
Saturated |
-0.0201 |
-0.6779 |
-0.9306* |
-0.0301 |
-0.6826 |
-0.9319* |
Unsaturated |
-0.1136 |
-0.5011 |
-0.7501 |
-0.1212 |
-0.5057 |
-0.7517 |
Mono-unsaturated |
0.1212 |
-0.0901 |
-0.0436 |
0.1217 |
-0.0883 |
-0.0436 |
Polyunsaturated |
-0.1175 |
-0.4746 |
-0.7237 |
-0.1245 |
-0.4792 |
-0.7182 |
Ratio |
-0.1371 |
0.7653 |
0.9488* |
-0.1301 |
0.7686 |
0.9492* |
Notes: Ratio is the ratio of unsaturated to saturated fatty acid content; **very significant, *significant, df=3, P=0.8783 for α=0.05, P=0.9587 for α=0.01.
3.5 Prediction of the Storage Quality of Shelled Corn with Slightly High MC
Table 9 showed the equations relating biochemical parameters to cumulative values of intergranular air properties. Over the 85 storage days, the average dry-bulb temperatures in the surface, middle, and bottom layers of the grain bulk were 10.2℃, 5.1℃, and 5.6℃. The biochemical parameters like FFA content, kernel breakage percentage, and water absorption rate, as well as thermal properties (Tp, ΔH, and peak enthalpy) and fatty acid profiles (C16:0, C18:0, C18:3n3, C20:0, and C20:1) were selected for evaluating the quality of shelled corn with slightly high MC after correlation analysis. These parameters were linearly dependent on the minimum and mean cumulative values of RH (X2), HR (X3), and DPT (X5) in the grain bulk, and the absolute values of X3 and X2 coefficients were greater than those of the X5 coefficient. These results suggest that for shelled corn stored at low temperature with slightly high MC without the occurrence of condensation, the air HR within the grain bulk, which was regulated by the grain MC, was important in maintaining the kernel integrity, water adsorption potential, thermal properties and fatty acid profiles of shelled corn.
Table 9. Prediction Equation of Biochemical Parameters
Bulk Temp. |
Biochemical Parameters |
Equation |
Minimum |
FFA |
y=-105.757+0.764X2-2.951X3+0.441X5 |
Breakage percentage |
y=-219.126+0.762X2-6.413X3+1.319X5 |
|
Water adsorption rate |
y=12.881+0.349X2-4.087X3+0.895X5 |
|
ΔH |
y=2.699-0.022X2-0.011X3+0.007X5 |
|
Tp |
y=91.264-0.013X2+0.645X3-0.161X5 |
|
Peak enthalpy |
y=7.526-0.005X2+0.016X3-0.006 |
|
C16:0 |
y=-267.955+1.379X2-10.613X3+2.135X5 |
|
C18:0 |
y=-54.205+0.284X2-2.268X3+0.461X5 |
|
C18:3n3 |
y=-41.523+0.235X2-2.059X3+0.427X5 |
|
C20:0 |
y=-9.778+0.061X2-0.413X3+0.081X5 |
|
C20:1 |
y=-8.001+0.048X2-0.405X3+0.083X5 |
|
FFA |
y=7.328+0.273X2+0.022X3-0.134X5 |
|
Breakage percentage |
y=12.996-0.218X2-0.128X3+0.061X5 |
|
Water adsorption rate |
y=158.754-0.262X2-0.108X3+0.092X5 |
|
ΔH |
y=1.004+0.002X2-0.081X3+0.026X5 |
|
Tp |
y=67.977+0.092X2-0.015X3-0.022X5 |
|
Peak enthalpy |
y=5.328+0.019X2-0.069X3+0.016X5 |
|
C16:0 |
y=118.059-0.255X2-0.185X3+0.054X5 |
|
C18:0 |
y=28.081-0.063X2-0.044X3+0.016X5 |
|
C18:3n3 |
y=32.824-0.078X2-0.045X3+0.024X5 |
|
C20:0 |
y=5.342-0.003X2-0.006X3-0.001X5 |
|
C20:1 |
y=6.621-0.013X2-0.010X3+0.004X5 |
Notes: FFA, free fatty acid content; ΔH; Tp, peak temperature of gelatinization; C16:0, palmitic acid; C18:0, stearic acid; C18:3n3, α-linolenic acid; C20:0, arachidic acid; C20:1, cis-11-eicosenoic acid; y, certain biochemical paramters; X1, cumulative dry bulb temperature; X2, cumulative RH; X3, cumulative humidity ratio; X4, cumulative wet-bulb temperature; X5, cumulative dew-point temperature.
4 DISCUSSION
The definition of “good-quality grain” varied according to its application. Grain storage facilities prefer kernels which are undamaged, dry, and free of insects. While millers prefer kernels that produce high percentage good-quality flour, and consumers are more concerned with appearance, flavour, and cooking qualities[34,35]. The 15.3% MC shelled corn was stored by taking advantage of the lower temperatures of the winter and spring months considering intact corn starch granules being preferred by starch. The temperatures in surface layer, middle layer, bottom layer and whole bulk during ninety days storage averaged 10.2℃, 5.1℃, 5.6℃, and 6.6℃ with the relative humidities in these grain bulk positions were correspondingly averaged as 72.8%, 71.3%, 70.9%, and 71.6%. The average FFA content and kernel breakage percentage in the four bulk layers were 30.3±1.7mgKOH/100g and 7.4±2.1%. The FFA content was much lower than that of the standard (≤65mgKOH/100g) for preserved shelled corn in the guidelines for evaluation of stored maize quality (China national standard GB/T 20570-2015[20]). The downloaded shelled corn belonged to the second-class corn with a bulk density ≤690g/L and unsound kernels ≤6% (China national standard GB 1353-2018[14]), meaning that the kernel breakage percentage used in the present study was comparable to unsound kernel percentage. The contents of reducing sugars, amylose and soluble protein were kept the similar values among the four bulk layers, suggesting the intact starch granules and protein during storage.
Tao et al.[36] identified 26 species of fatty acids in sea rice flour and the species > 3mg/100g were linoleic acid (C18:2n6c), oleic acid (C18:1n9c), palmitic acid (C16:0), tricosanoic acid (C23:0), stearic acid (C18:0), and α-linolenic acid (C18:3n3). In the present study, 24 species of fatty acids were identified in cornmeal using the same analytical method and the species > 5mg/100g were C18:2n6c, C18:1n9c, C16:0, C18:3n3, C18:0, arachidonic acid (C20:4n6), cis-13,16-docosadienoic acid (C22:2n6), cis-11-eicosenoic acid (C20:1), and arachidic acid (C20:0). The contents of the main fatty acids, such as C16:0, C18:0, C18:3n3, and C20:0, as well as C20:1, C18:1n9c, C18:2n6c, and C22:2n6 in shelled corn, were similar in bulk layers of L2, L3 and L4. The lower average temperatures (5-10℃) of corn bulk layers retard the degradation and oxidation of the main fatty acids. The gelatinization peak temperature (73.66-74.18℃) of cornmeal was higher than that (64.58-65.46℃) of sea rice flour reported by Tao[36], and kept the similar values in four bulk layers.
Grain storage periods vary from a few weeks to a few months and, sometimes, years. Grain can deteriorate throughout any of these periods. Temperature, RH and MC are the main factors affecting grain qualities[37]. The RH and MC of grain bulk are difficult to measure directly using cable sensors. To our knowledge, few studies have carried out on the intergranular air properties in a huge shelled corn mass. In the present study, we noted that the grain moisture changed little during a short period of cooling aeration while the temperature changed quickly; thus, the grain moisture in layers L1, L2, L3 and L4 was assumed to be constant within any sampling period when grain moisture was measured. The intergranular air properties, such as RH, HR, wet-bulb and DPT, were calculated with self-compiled software when the average temperature and MC of each layer were input. This calculation could provide a method for monitoring the quality of stored grain. We further related the cumulative values of the intergranular air properties to grain quality in each bulk layer. The minimum and mean cumulative values of RH, HR and DPT in grain bulk had significant influences on the FFA content, kernel breakage percentage, water adsorption rate, gelatinization enthalpy, peak enthalpy, and fatty acid profiles (C16:0, C18:0, C18:3n3, C20:0, and C20:1). In the large Chinese grain warehouses of the middle and north temperate regions, the basic temperature of shelled corn bulk with slightly high MC is lowered to ≤ 5℃ during winter mechanical aeration, and an inner loop flow technology circulates the cold air from the bulk core to the upper surface during over summering to keep the bulk top layer around 20℃.
The emerging big data technology enables organizations to collect, store, and assess huge information to aid in risk assessment and management, but a challenge of data quality assessment in big data is to require real-time processing techniques such as machine learning and artificial intelligence. In the present study, the correlation relationships between physicochemical properties (biochemical properties, thermal properties, and fatty acid profiles) and the quality (FFA and kernel breakage percentage) of shelled corn with slightly high MC during storage was analysed in Tables 4 and 6, and the effects of cumulative values of intergranular air properties on these physicochemical properties were clarified in Table 9. The Free fatty acid content, kernel breakage percentage, water adsorption rate, gelatinization enthalpy, peak enthalpy, and fatty acid profiles (C16:0, C18:0, C18:3n3, C20:0 and C20:1) were concluded to be significantly related to the cumulative intergranular air properties of grain bulk. The application of big data thinking to explore the intergranular air properties and grain quality in these shelled corn bulk will be investigated.
5 CONCLUSION
The study investigated the storage of intact corn starch granules for use by starch processing enterprises during winter-spring season. The 15.3% MC shelled bulk corn (4,169t) was loaded into a large flat warehouse in late January and then provided with 195h of equalizing-temperature aeration at a low unit volume (5.87m3 h-1t-1). The lower temperatures of corn bulk layers during late January till late April were unfit for the development of stored grain fungi and pests, which kept the grain physio-chemical and quality parameters. The Intergranular air properties of RH, HR and DPTs in grain bulk significantly influenced the FFA content, kernel breakage percentage, water adsorption rate, gelatinization enthalpy, peak enthalpy, and fatty acid profiles (C16:0, C18:0, C18:3n3, C20:0, and C20:1). This study is useful for the storage of large quantities of staple grains, which is useful in ensuring large-scale food security. The implantation of software module of intergranular air parameters into smart grain mass inspection system would benefits the integrated management of stored grain insects / fungi and the smart mechanical aeration operations.
Acknowledgements
The authors would like to acknowledge the Special Fund for Grain Scientific Research in the Public Interest of the State Administration of China (No. JY2102).
Conflicts of Interest
The authors declared no conflict of interest.
Author Contribution
Wei Z was responsible for writing, editing, methodology, and data collection; Jiang Y contributed methodology and data collection; Li X was responsible for writing, reviewing and editing, methodology, investigation, supervision, interpretation of results, and data management; Zhao M was responsible for the methods and data collection; Wu J was responsible for the supervision and review; Yan E contributed to the investigation, grain warehouse management and data collection.
Abbreviation List
ΔH, Enthalpy of gelatinization
DNS, 3,5-dinitro salicylic acid
DON, Deoxynivalenol
DPT, Dew-point temperature
DSC, Differential scanning calorimeter
ERH, Equilibrium relative humidity
FAA, Free amino acid
FAME, Fatty acid methyl esters
FFA, Free fatty acid
HR, Humidity ratio
MC, Moisture content
RH, Relative humidity
WB, Wet basis
References
[1] Kanyamasoro MG, Karungi J, Asea G et al. Determination of the heterotic groups of maize inbred lines and the inheritance of their resistance to the maize weevil. African Crop Sci J, 2012; 20: 99-104.
[2] Chulze SN. Strategies to reduce mycotoxin levels in maize during storage: a review. Food Addit Contam, 2010; 27: 651-657.[DOI]
[3] FAO. Maize: international market profile. Grains team food and agriculture organization of the United Nations economic and social department trade and markets division, 2006. Accessed 2012. Available at:[Web]
[4] Yaouba A, Tatsadjieu NL, Jazet DPM et al. Inhibition of fungal development in maize grains under storage condition by essential oils. Int J Biosci, 2012; 2: 41-48.
[5] Baoua IB, Amadou L, Ousmane B et al. PICS bags for post-harvest storage of maize grain in west Africa. J Stored Prod Res, 2014; 58: 20-28.[DOI]
[6] Bern CJ, Steele JL, Morey RV. Shelled corn CO2 evolution and storage time for 0.5 % dry matter loss. Appl Eng in Agric, 2002; 18: 703-706.[DOI]
[7] Suleiman RA, Rosentrater KA, Bern CJ. Effects of deterioration parameters on storage of maize: A review, J Nat Sci Res, 2013; 3: 147-165.[DOI]
[8] Likhayo P, Bruce AY, Tefera T et al.Maize grain stored in hermetic bags: Effect of moisture and pest infestation on grain quality. J Food Quality, 2018; 2018: 1-9.[DOI]
[9] Aby GR, Maier DE. Distribution of brick versus spherical shaped wireless sensors as a function of gravity-filling a storage silo and their recovery from the grain mass during unloading. Appl Eng Agric, 2023; 39: 63-68.[DOI]
[10] Ullah I, Ali M, Farooqi A. Chemical and nutritional properties of some maize (Zea mays L.) varieties grown in NWFP, Pakistan. Pak J Nutr, 2010; 9: 1113-1117.
[11] Sun D. Selection of EMC/ERH isotherm equations for shelled corn based on fitting to available data. Dry Technol, 1998; 16: 779-798.[DOI].
[12] Wu Z, Li X, Guo D et al. The use of a moisture sorption equation for depot aeration of shelled corn in China. Proceedings of the 2011 CIGR Section VI International Symposium on Towards a Sustainable Food Chain Food Process, Bioprocessing and Food Quality Management, Nantes, France. 2011: 18-20.
[13] Maier DE, Navarro S. Chilling of grain by refrigerated air. In: Navarro S, Noyes R (eds). Mech Phys Mod Grain Aeration Ma. 2002; 489-560.
[14] China National Standard. GB 1353-2018. Maize, 2017; Issued on 13 July 2017.
[15] Thorpe G. Ambient air properties in aeration. In: Navarro S, Noyes R eds. The mechanics and physics of modern grain aeration management. CRC Press: New York, USA. 2002; 79-123.
[16] Wilson SG, Desmarchelier JM. Aeration according to seed wet-bulb temperature. J Stored Prod Res, 1994; 30: 45-60.[DOI]
[17] Li X, Wang S, Zhang Y et al. The hygroscopic properties and sorption isotherm classification of sixteen Chinese shelled corn varieties. J Chin Cereals Oils Assoc, 2012; 27: 80-86.[DOI]
[18] Li X. The theory and practice of grain moisture content. China light industry press: Beijing, China. 2022.
[19] AOAC, Official Methods of Analysis, thirteenth ed. Association of Official Analytical Chemists, Washington DC, 1980.
[20] China National Standard. GB/T 20570-2015. Guideline for evaluation of maize storage character. 2015; Issued on 15 May 2015.
[21] Ren Q, Jiang P, Zhang L et al. Determination of grain kernel damage with FCF dyeing method [In Chinese]. Food Ind Sci Tech, 2016; 37: 49-53.[DOI]
[22] Liu J, Wang R, Chen Z et al. Effect of cold plasma treatment on cooking, thermomechanical and surface structural properties of Chinese milled rice. Food Bioprocess Tech, 2021; 14: 866-886.[DOI]
[23] Li X, Han X, Gao G et al. Rice freshness determination during paddy storage based on solvent retention capacity. Cereal Chem, 2022; 99: 593-602.[DOI]
[24] Xu Y, Wang R, Li X et al. Effect of atmospheric pressure cold plasma on the physiological biochemistry of stale wheat and its dough pasting properties [In Chinese]. Science and Tech Food Ind, 2020; 41: 37-42.[DOI]
[25] Tian Y, Jia Y, Li H et al. Determination of sulfhydryl groups using UV spectrophotometry in wheat flours. J Chin Cereals Oils Assoc, 2005; 20: 125-128.[DOI]
[26] Gao G, Wu J, Wei Z et al. Effects of low-pressure radio-frequency cold plasma on the biochemical parameters and fatty acid profile of wheat flours. Cereal Chem, 2023; 110: 393-413.[DOI]
[27] China National Standard. GBT 15683-2008. Rice-Determination of amylose content. 2008; Issued on 4 Nov. 2008.
[28] Jiang P, Li X. A study on moisture diffusion coefficient and thermal properties of shelled corn during drying. Sci Tech Food Ind, 2016; 37: 53-59.
[29] Concepcion JCT, Ouk S, Riedel A et al. Quality evaluation, fatty acid analysis and untargeted profiling of volatiles in Cambodian rice. Food Chem, 2018; 240: 1014-1021.[DOI]
[30] SPSS Inc. SPSS for Windows, Release 17.0.1. SPSS Inc, Chicago, USA, 2006.
[31] Lacey J, Hill ST, Edwards MA. Microorganisms in stored grains: their enumeration and significance. Trop Stored Prod Inf, 1980; 38: 19-32.
[32] Navarro S, Noyes R, Armitage D et al. Chapter 1: Objectives of aeration. In: The mechanics and physics of modern grain aeration management. CRC Press: New York, USA. 2002; 1-34.
[33] Desmarchelier JM. The relationship between wet-bulb temperature and the intrinsic rate of increase of eight species of stored-product Coleoptera. J Stored Prod Res, 1988; 24: 107-113.[DOI]
[34] Friedmann MA, Maier DE. Advance in bulk storage of cereals and grains. In: Maier DE eds. Advances in postharvest management of cereals and grains. Burleigh Dodds Science Publishing Limited: Cambridge, UK. 2020; 125-170.
[35] Afzal I, Bakhtavar MA, Ishfaq M et al. Maintaining dryness during storage contributes to higher maize seed quality. J Stored Prod Res, 2017; 72: 49-53.[DOI]
[36] Tao L, Qin W, Wei Z et al. Effects of small-scale storage on the cooking property and fatty acid profile of sea rice paddy. Appl Food Res, 2022; 2: 100175.[DOI]
[37] Gonzales HB, Armstrong PR, Maghirang RG. Simultaneous monitoring of storage grain with relative humidity, temperature, and carbon dioxide sensors. Appl Eng Agric, 2009; 25: 595-604.[DOI]
Copyright © 2023 The Author(s). This open-access article is licensed under a Creative Commons Attribution 4.0 International License (https://creativecommons.org/licenses/by/4.0), which permits unrestricted use, sharing, adaptation, distribution, and reproduction in any medium, provided the original work is properly cited.


