A Tamarind Local Variety from Garoua, Cameroon: Physicochemical Characterization, Fruit Pulp Fermentation and Extraction of Tartaric Acid from the Fruit Pulp Winery Waste
Ekane Peter Etape1*, Petronilla Ashihyo Akumbom1, Beckley Victorine Namondo1, Ebong Njume D Ngole1, Josepha Foba-Tendo1, Lena Elango Ekaney1
1Department of Chemistry, University of Buea, Buea, Cameroon
*Correspondence to: Ekane Peter Etape, PhD, Senior Lecturer, Department of Chemistry, University of Buea, P.O. Box 63 Buea, Cameroon; Email: ekane20022001@yahoo.fr
Abstract
Objective: Tamarind is known for the tart taste that is characteristic of Tartaric acid. The fruit pulp is in high demand in both the domestic and industrial settings due to its high food value. It contains fatty acids, vitamins, roughage, phytosterols and many other phytochemicals necessary for good health. To the best of our knowledge, very little has been reported on the processing of this nutritional fruit and the results reported so far show variability as a function of the botanical origin of the plant. No literature exists on the Tamarind variety from Cameroon and no study combining wine production and extraction of Tartaric acid from the waste residue has so far been reported. We are taking this advantage to explore wine fermentation from Tamarind fruit pulp by focusing on the effects of different parameters such as time of treatment for juice extraction, yeast inoculate for wine fermentation and secondary fermentation on wine quality, and to extract Tartaric acid from the winery solid waste residue.
Methods: The main fermentation was done at 2°C in 13d and 1w secondary fermentation was done in 1 week. The wine was characterized for alcoholic content, pH, titratable acidity, soluble dry matter and consumer acceptability. The winery solid waste residue (potassium bitartrate precipitate) was used to extract crystalline L-Tartaric acid which was characterized by Fourier transform infrared spectroscopy, melting point and crystallinity by powder X-ray diffraction.
Results: The Tamarind pulp wine produced was of acceptable quality. It was clear, sweet, sparkling, smooth and well-flavored. The drink had a pH of 3.04 and an alcohol content of 16%. The Tartaric acid was crystalline, and it reflected all characteristic functional groups of Tartaric acid, with a melting point of 189.8-196.4°C (laboratory grade).
Conclusion: It is very possible to couple Tamarind fruit pulp wine production with chemical synthesis of pure crystalline Tartaric acid using solid winery waste from Tamarind fruit pulp. The method used in this study is simple, straightforward, ecofriendly and cost effective.
Keywords: Tamarind pulp, wine, fermentation, waste residue, Tartaric acid
1 INTRODUCTION
Industrial processing of agroforestry products such as fruit pulp in the winery industry is of great empowerment to the agricultural sector. However, such industrial processing generates large quantities of solid waste such as potassium bitartrate, which, if recycled, will be very sustainable. Therefore, coupling food processing units to material synthesis may not only be interesting but also sustainable and friendly to the environment. Fruit wines have been successfully discriminated by their different botanical origins using the natural composition of external Tartaric acid present[1]. Tartaric acid (chemical formula: C4H6O6) is a white crystalline diprotic organic acid[2] present in all fruit wines and juices in varying proportions. The presence of the substance in wine influences the taste and the quality of the wine. The value attached to Tartaric acid is attributed to its broad spectrum of applications. It can be used as an acidification agent, antioxidant, taste enhancer in the drinks and food industry, production of emulsifiers in cement and gypsum as a retardant, as a chelating agent in soil fertilizers, for polishing and cleaning in the metal industry, and in the chemical industry[2,3]. The product has a ready market estimated at about 50,000-70,000 tons per year[4] though the production especially in sub Saharan Africa does match the demand. Tartaric acid can be extracted from various natural sources especially fruits and winery by-product[3]. Generally speaking, Tartaric acid occurs naturally in agroforestry products in tropical Africa such as Tamarind, papaya, peach, pear, pineapple, strawberries, mangoes, grapes, bananas, apples, cherries, avocado and citrus fruits. However, Tamarind has gained greater interest relative to other fruit and tree sources because it holds a relatively high concentration of Tartaric acid (8%-21.96% depending on the soil, country and age of the plant) and the concentration does not vary as the fruit ripens. The winery industry generates a significant amount of waste with polluting effects that raise serious environmental concerns[5]. However, good management principles of such winery residues as major starting materials to produce Tartaric acid will ensure good environment promoting projects. The residues from this sector include wine lees (deposits of dead yeasts), particulates and other precipitates to the bottom of wine vats after fermentation or stabilization, as well as wine tartars (the crystalline deposits on the walls of the wine vats during ageing)[2,3].
Tamarind grows well in so many countries including Sudan, India, Malaysia and Cameroon. Literature reports hold that Tamarind is well adapted to semi-arid tropical conditions, although it does well in many humid tropical areas of the world with high seasonal rainfall[6]. The leading countries in the cultivation of Tamarind are south American and south-east Asian countries, but India is the country with the highest number of commercial plantations with an annual production of 250,000 tons of Tamarind fruit (150-250kg of fruit/tree)[7]. The Tamarind fruit is fleshy, juicy with an acidulous pulp that accounts for the outstanding sweet acidic taste associated with Tartaric acid. They have both nutritional and phytochemical components such as anti-oxidant, anti-inflammatory, anti-microbial and anti-fungal active substances which account for its extensive use in traditional medicine[8]. The Tamarind fruit is sometimes called a pod and has a length of 12cm to 15cm with a hard, brown shell. When flesh, the mature fruit is brown or reddish-brown[9] with brittle and fragile shells, as shown in Figure 1. The fruit pulp represents about 40% of the total Tamarind fruit and it is the richest natural source of Tartaric acid with a variable range between 8% and 18%[7]. Plant species such as grapes and Tamarind constitute local varieties which contain large amounts of the stable isotope of L-Tartaric acid. Multivariate statistical analysis of the data shows great variability among the different botanical and synthetic sources[1]. Extraction of L-Tartaric acid from Tamarind pulp (together with several by-products) has recently been patented in India and the United States, making it a potential source for cheap commercial L-Tartaric acid that can enter the wine production chain. The origin of Tamarind can be traced back to Africa[7]. Determination of fermentation potentials of Tamarindus indica yeast isolates has been carried out using isolation, morphological identification and physiological (fermentation) procedures for botanical species in Nigeria. The fermentation process is characterized by gradual changes in pH (5.5-1.96) and brix (20%-7.40%). The alcohol production potential of some four yeast isolates shows variability[10]. To the best of our knowledge, very little has been reported on processing of this nutritional fruit and the results reported so far show variability as a function of the botanical origin of the plant. Furthermore, no literature exists for the Tamarind variety from Cameroon and no study combining wine production and extraction of Tartaric acid from the waste residue has so far been reported. Therefore, we are taking this advantage to explore wine fermentation from Tamarind fruit pulp by focusing on the effect of different parameters such as time of treatment for juice extraction, yeast inoculate for wine fermentation and secondary fermentation on wine quality, and to extract Tartaric acid from the winery solid waste residue.
|
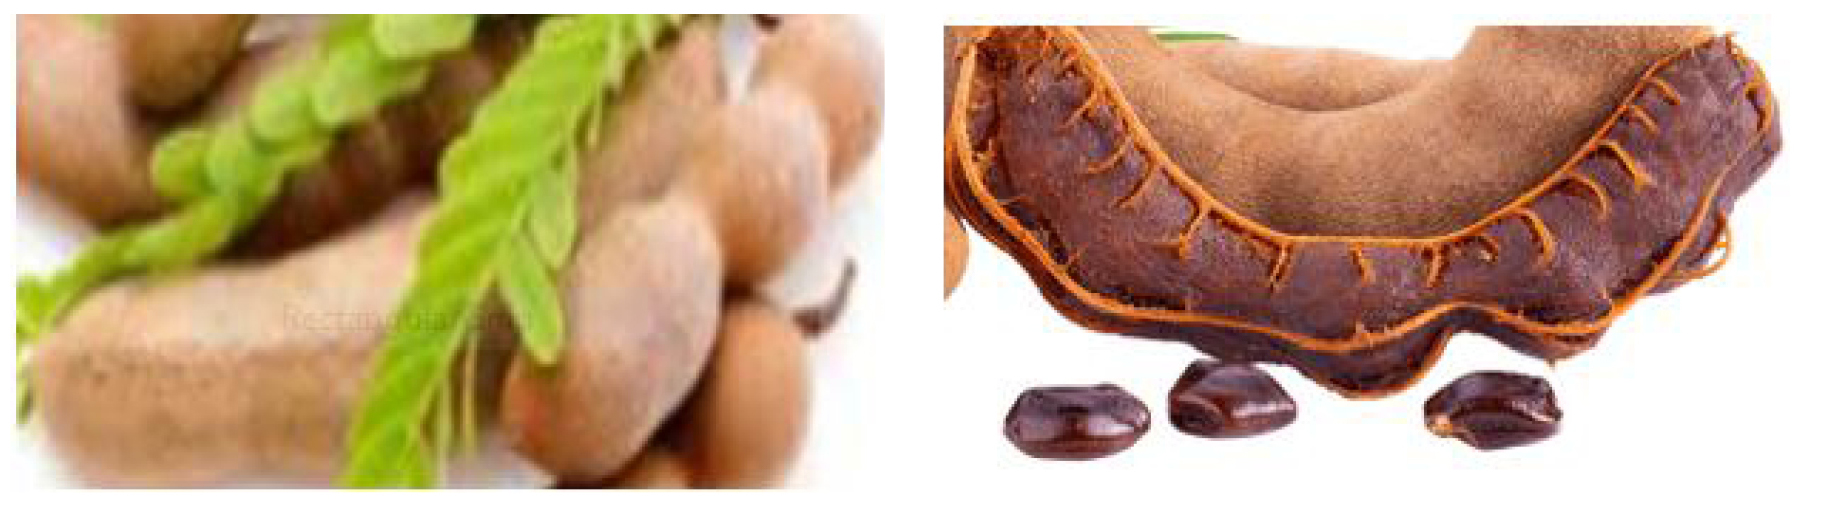
Figure 1. Tamarind fruit, pulp, seed and leaves.
2 MATERIALS AND METHODS
2.1 Materials
Calcium carbonate, calcium chloride, sulfuric acid (all of analytical grade), Tamarind fruits, distilled water, sugar, yeast and other equipment were used in this study. Tamarind fruits bought from the market at Maroua in the far northern region of Cameroon were conveyed to the inorganic chemistry laboratory at the University of Buea in the south western region.
2.2 Physical Characteristics of Tamarind Fruits and Seeds
Physical characteristics of Tamarind fruits and seeds including fruit length, fruit width, seed length and seed width were measured using a Vernier caliper while the fruit weight, pulp weight and seed weight were determined using a chemical balance. All determinations were done in triplicates and the mean values calculated from the recorded results.
2.2.1 Moisture Content Determination
The percentage moisture content was determined by the loss in weight that occurs when the sample is dried in an oven at 105°C until a constancy of weight is observed. 4g of the sample was weighed into a silica dish of known weight and placed in a pre-heated oven at 105°C. The weight of the sample was monitored at 30min intervals until a constancy of weight was observed. The percentage of moisture in the sample was calculated using Equation (1).
|
% Dry moisture=100-% Moisture.
2.2.2 Total Ash Content
Ash content determination is the process of mineralization for pre-concentration of trace substances prior to chemical analysis such as chromatography, optical analysis and spectroscopy. 2g of the sample was weighed in a crucible and placed into a muffle furnace which was pre-heated at 600°C. The sample was subjected to this heat treatment for 4h, The ash was later obtained and the crucible was left in the furnace until room temperature. The crucible was taken out of the furnace, re-weighed and placed in a desiccator for further use. The percentage ash content was calculated using Equation (2)[11].
|
2.2.3 Titratable Acidity of Tamarind Wine
Titratable acidity is useful in determining the acid content for sensory description. This is likened to a natural titration of sorts performed in the mouth of the consumer, where basic saliva comes in contact with the wine and causes increased flow. In this study, titratable acidity was performed by taking samples of the wine (10mL) and titrating with an alkali solution (0.1 normality (N), sodium hydroxide (NaOH)) to an endpoint using phenolphthalein indicator. The percentage acidity was calculated using Equation (3)[12].
|
2.2.4 Effect of Fermentation Time on the Extraction Products
Tamarind extract was treated with yeast while respecting the formulation, and fermented for different durations (7d, 14d and 20d). The wine produced was analyzed for the following parameters: pH, soluble dry matter (brix), ethanol (%v/v), acidity (g/L), and sensory characteristics (score).
2.2.5 Fermentation of Tamarind Juice Extract
Tamarind juice was extracted from the fruit pulp and the extract was used in its natural form (pH=2.92 and soluble dry matter (brix), 12.5%). To standardize the fermentation, the Tamarind juice extract was reconstituted by adjusting the pH and soluble dry matter. The pH was adjusted from 2.92 to 5.5 using 0.1M NaOH solution while the soluble dry matter (brix) was adjusted from 12.5% to 20% using 200g sucrose. 150mL of Tamarind juice extract was placed in the fermentation containers and labelled A (7d), B (14d) and C (19d). The preparations were pasteurized at 71°C for 15sec. These were allowed to cool to 30oC before the starter cultures were added. They were incubated at room temperature (25±2°C) (natural fermentation) and 30°C (standardized fermentation), for 7d, 14d and 19d. Soluble dry matter (brix), pH and alcohol content were measured after fermentation. The process was arrested by pasteurizing the ferments at 70°C for 15min using a water bath. The pasteurized ferments were refrigerated before characterization, and the soluble dry matted (brix), ethanol content (%v/v), acidity (g/L), and sensory characteristics (score) of the wine were evaluated.
2.2.6 Determination of pH
The pH of the fruit pulp extract was determined using a crimson micro pH-meter (Model 2000). 10g of the dried fruit pulp was weighed into a 100mL beaker filled with90mL of distilled water (pH 7.0). The mixture was stirred at 5min intervals for a period of 30min, after which the pH was measured.
2.2.7 Determination of Percentage Alcoholic Content in the Tamarind Ferments
The pasteurized ferments were separately centrifuged using a Hehich 7200 universal centrifuge (England) at 3000rpm for 10min. The supernatants obtained were separated and transferred into 100mL conical flasks. The samples were neutralized with NaOH solution and 100mL of each neutralized sample placed into another volumetric flask. The samples were later transferred into distillation flasks and 50mL of water added was to each sample. These samples were further distilled in the same volumetric flasks at the boiling temperature of alcohol (78-79°C)[13]. The distillates (volume 95mL) were collected and the volumes were upgraded by the addition of water to 100mL. Using a pipette, 50mL of each sample was transferred into a specific gravity bottle and weighed on a chemical balance (B. Bran LA 164, England). The constant weights of the samples were recorded, and their specific gravity calculated. The data obtained on specific gravity was used to estimate the percentage of alcohol from the Hehner’s alcohol table.
2.2.8 Extraction of Crude Wine Tartar Sediments
100g of wine waste (tartar sediment) was taken after complete fermentation and was boiled with 1000mL of water. The hot suspension was filtered and centrifuged. The cycle of boiling, filtration and centrifugation was repeated four times[7]. To enhance the recovery yield of the tartrate salts after the fourth cycle, an additional 500mL of water was added to the sediment. The latter was filtered and the filtrates obtained were mixed, cooled at 30°C for 48h and the potassium bitartrate crystals separated by filtration. Further recovery of potassium bitartrate was carried out by concentrating the liquid to about 250mL and the cooling cycle repeated. The solid waste residue obtained was recrystallized, dissolved in a sufficient amount of water while adding a known amount of calcium carbonate to the solution to obtain calcium tartrates and neutral potassium tartrate with carbon dioxide liberated.
|
A stoichiometric amount of calcium chloride was dissolved into the hot water and added to the reaction mixture to start a double exchange reaction.
|
The precipitate was filtered and treated with 25mL of 96% sulphuric acid. The solution was allowed to stand for 30min during which calcium tartrates decomposed to pure Tartaric acid and calcium sulphate.
|
The resultant solution was filtered while hot, washed many times and allowed to age for 14d, during which Tartaric acid crystalized.
2.2.9 Characterization of the Sampled Tartaric Acid
The melting point of the solid sample was determined using the digital melting point apparatus (Zenthlab Jiangsu Co., Ltd., Model: WRS-2A) in the inorganic chemistry laboratory at the University of Buea, Department of Chemistry. Fourier transform infrared spectroscopy was carried out at the University of Yaoundé, while the crystallinity of the sample was evaluated using powder X-ray diffraction (PXRD).
3 RESULTS
3.1 Physical Characterization
The results for the physical characterization of Tamarind fruits and seeds are presented in Tables 1 and 2.
Table 1. Physical Characteristics of Tamarind Fruit and Seed
Parameters |
Sample A |
Sample B |
Sample C |
Mean |
|
Fruit |
Length/cm |
4.2 |
7.4 |
5.8 |
5.8 |
Width/mm |
1.4 |
1.6 |
1.2 |
1.4 |
|
Weight/g |
2.5901 |
4.3902 |
3.4801 |
3.4923 |
|
Weight of pulp /g of fruit |
0.5324 |
0.5412 |
0.5432 |
0.5389 |
|
Number of seed per pod |
3 |
5 |
4 |
4 |
|
Seed |
Weight/g |
0.3732 |
0.4171 |
0.3950 |
0.3950 |
Density/g/mL |
3.4 |
3.8 |
3.6 |
3.6 |
|
Table 2. Comparative Composition of Tamarind Pulp (Moisture and Ash Content)
Parameter |
Botanical Zone/ (Country) |
||
Gedarif (Sudan) |
Kordofan (Sudan) |
Maroua (Cameroon) |
|
Moisture content/% |
15.47 |
18.00 |
18.18 |
Ash content/% |
3.99 |
3.91 |
5.57 |
3.2 Physicochemical Characterization
3.2.1 pH and Total Acidity
The pH of wine is the major determining factor of the variability in the degree of sourness. At a lower pH, the wine tastes sourer. However, both pH and total acidity influence the sensation of astringency and enhance the fruit character of wine. As a measure to discourage microbial spoilage, the pH of the juice must be adjusted to an optimum range for fermentation. From this initial (adjusted) value, the variation of the pH and titratable acidity observed over various fermentation periods are shown on Table 3 and Figure 2A and B. The results revealed a gradual decrease in the pH of the substrate accompanied by a gentle increase in titratable acidity.
Table 3. Physicochemical Characteristics of the Wine for Various Fermentation Periods
Parameter |
Period of Fermentation |
||||
0 day |
7 days |
14 days |
19 days |
21 days |
|
pH |
5.50 |
3.50 |
3.05 |
3.04 |
3.04 |
Titratable Acidity/g/1000mL |
1.114 |
3.142 |
19.80 |
19.95 |
19.95 |
Alcohol content / % |
0 |
6 |
10 |
16 |
16 |
Brix (% ) |
18.0 |
12.6 |
11.0 |
10.6 |
10.6 |
|
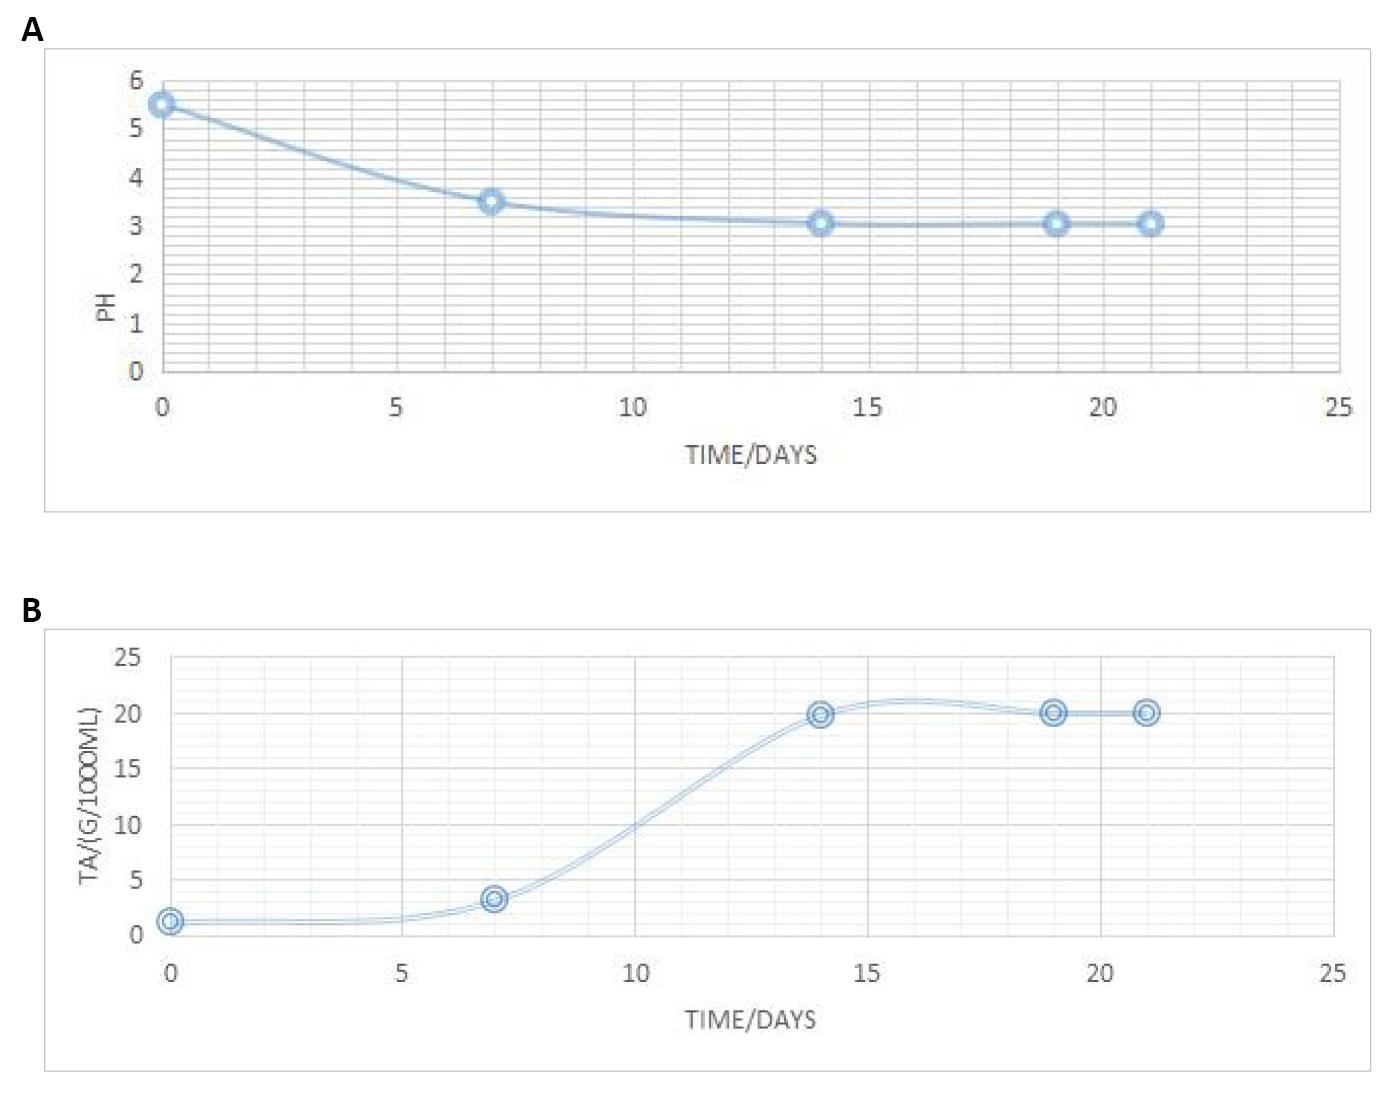
Figure 2. Variation of pH (A) and titratable acidity (B) with fermentation time.
3.2.2 Alcohol Content and Soluble Solid (brix)
The results from the study in alcohol content and soluble brix are presented in Table 4 and Figure 3A and B. The data reveals a steady increase in the percentage alcohol and a steady decrease in soluble solid (brix) from the first to the 13th day of fermentation, which both level up from day 13 to day 19.
Table 4. Physical Characteristics of the Sample
Parameter |
Physical Properties |
Physical state |
Solid |
Appearance |
White |
Odor |
None |
Taste |
Tart |
Solubility |
Soluble in cold water |
|
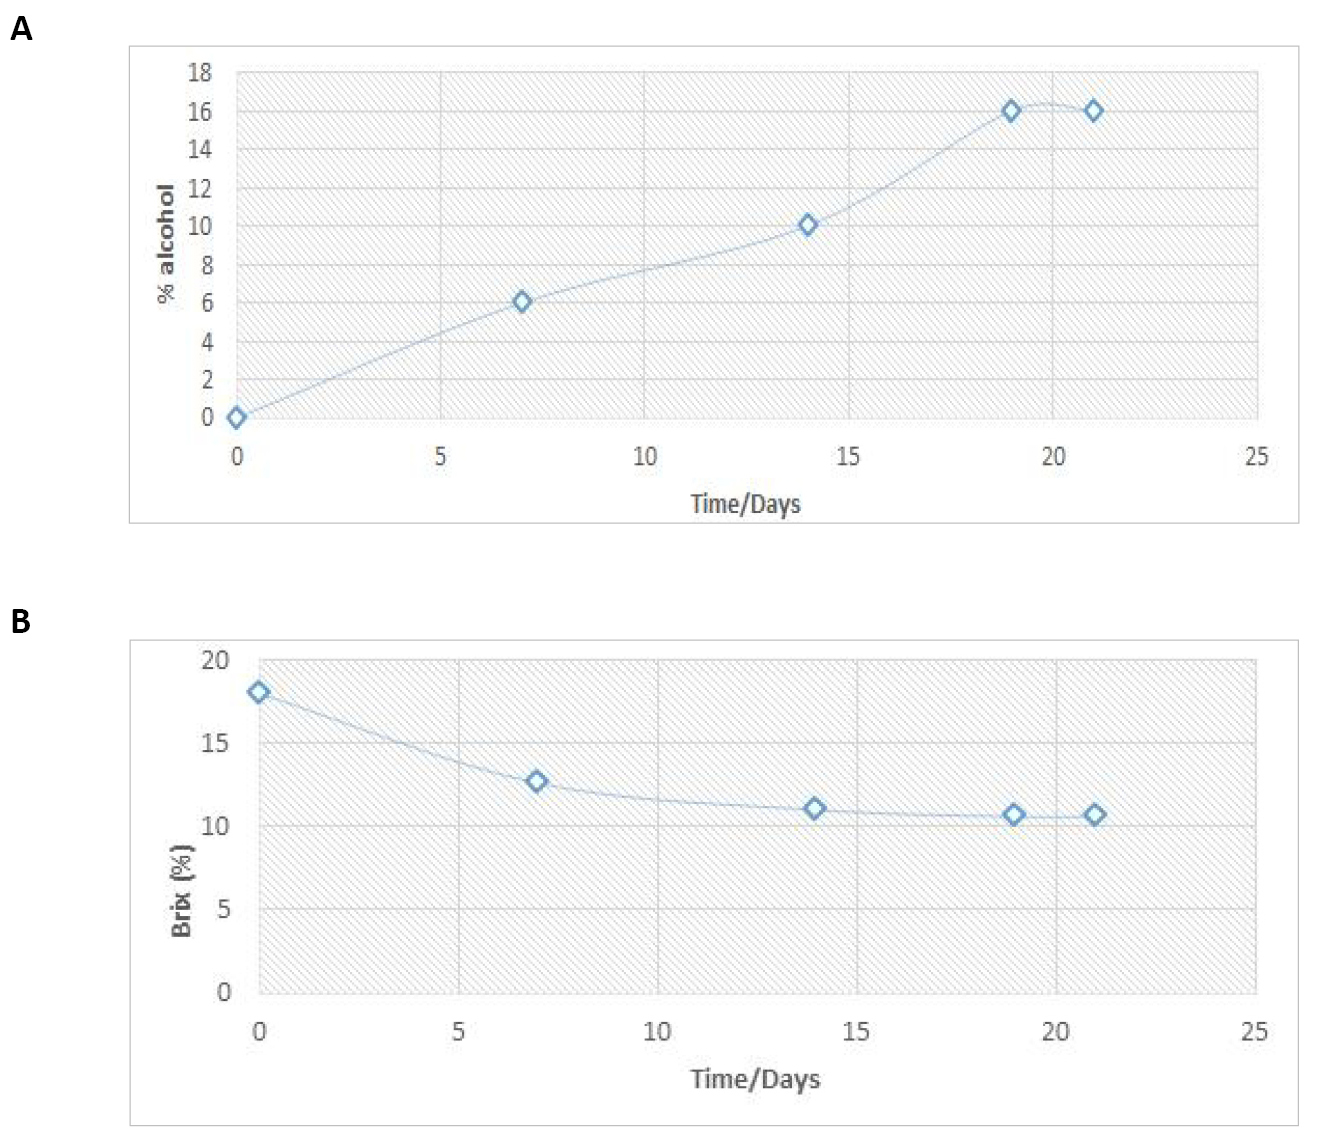
Figure 3. Variation of % alcohol (A) and brix (%) (B) with fermentation time.
3.2.3 Organoleptic Characterization
Acceptability of Tamarind wines by the consumers is a function of its sensory attributes such as color, flavor, sweetness, taste and overall acceptability of wines. A sensory analysis was performed to evaluate the consumers’ responses to different wine samples[14] (sample 3: 19 days, sample 2: 14 days and sample 1: 7 days of fermentation). A radial plot was used to graphically display the scores as shown in Figure 4. The attributes were rated on a 5-point scale using the following ranges: 4.5 to 4.8, which was classified as “fairly acceptable” and “highly acceptable”. The rating was carried out by a team of 8 semi-trained judges’ representative of the consumer sample population. The sensory scores on color, flavor, sweetness, taste and overall acceptability of the wines were similar. At the end of 14d of fermentation, the comparative coefficients among consumer attributes revealed a high correlation of color against flavor.
|
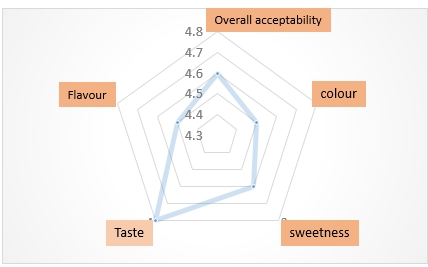
Figure 4. Sensory evaluation of Tamarind pulp wines.
3.3 Characterization of the Sample Obtained from the Waste Treatment
3.3.1 Physical Characteristics
The results of the physical characterization of the Tartaric acid sample recovered from the solid winery waste are presented in Table 4.
The recovered Tartaric acid sample’s melting point was recorded within a range of 189.8°C-196.4°C as shown in Table 5. The melting point of the sample falls out of the range reported in literature, 174°C[15] and 170°C[16]. However, similar values were obtained using a standard sample of Tartaric acid drawn from our laboratory stock (168°C-194.3°C).
Table 5. Melting Point of Sample Compared with Standards
Parameter |
Sample 1 |
Sample 2 |
Sample 3 |
Standard |
Literature Values |
Melting point |
189.8oC |
196.2oC |
196.4oC |
168-194.3oC |
169oC (RR), 172oC (SS) |
Retained |
189.8-196.4oC |
|
206oC (race), 165-166oC (Meso) |
||
3.3.3 Infrared Spectroscopy (IR)
The IR functional group analysis results presented in Figure 5 revealed a complete representation of all the functional group characteristic of Tartaric acid. The IR band for the sample found in the range of 1650 to 1750cm–1 is characteristic of carboxylates. Similar bands characteristic of organic acids especially Tartaric and malic acids in wine have been reported in the range of 1.728 to 1.732cm–1, and have been attributed to the stretching vibrations of the C=O bond found in carboxylic acids[17]. Furthermore, the bands between 1500-850cm-1, 1714.00cm-1, 2966.21 and 2930.80 all fall in ranges that were reported in earlier literature[18], are seen as the three basic representative IR band for the identification of Tartaric acid (1500-850, 1801-1500 and 3000-2800cm-1)[15].
|
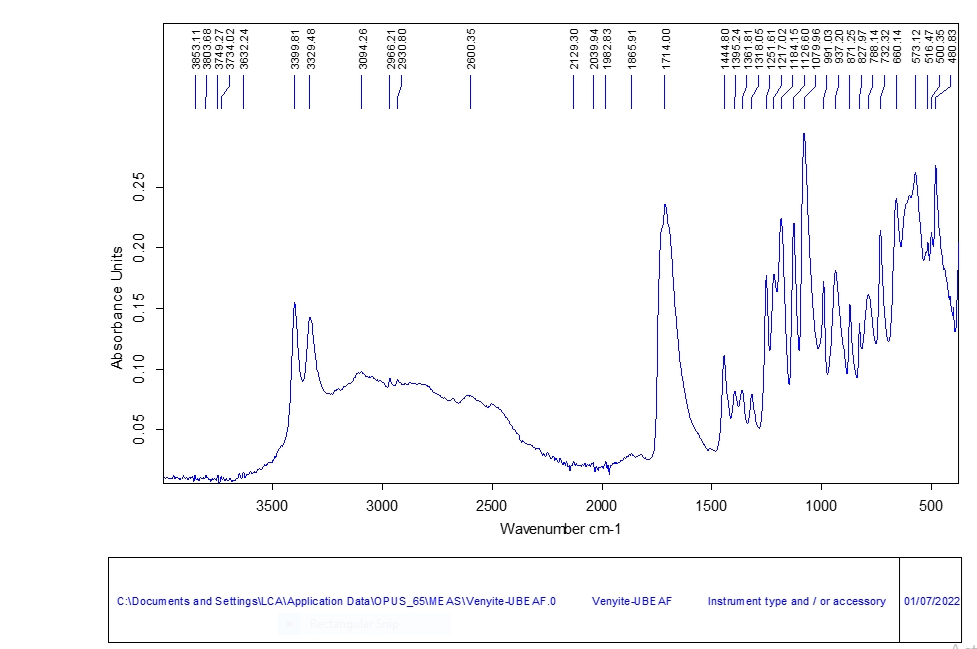
Figure 5. FT-IR bands for the synthesized sample.
3.3.4 X-Ray Diffraction (XRD)
The PXRD analysis was used to evaluate the crystallinity and purity of the samples recovered from winery waste. The Diffraction profile in Figure 6 shows that the PXRD profile of the Tartaric acid sample synthesized from the winery waste was similar to that of the standard Tartaric acid, although the particles of the synthesized sample were more powdered.
|
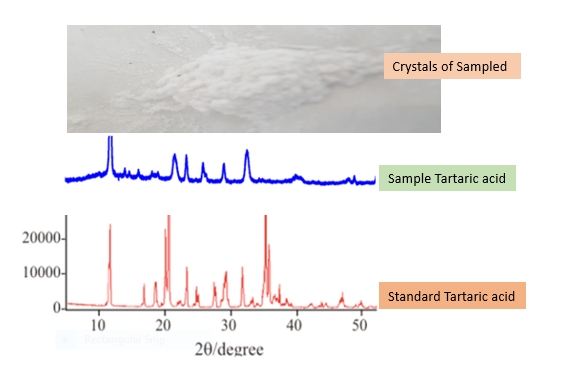
Figure 6. The crystalline sample and the PXRD of the synthesized sample compared to standard Tartaric acid.
4 DISCUSION
On average, the physical parameters of the fruit were a length of 4.2cm, width of 1.4cm, and weight of 3.49g. These physical parameters reflected numerical values different from those reported in literature (1.059cm-1.264cm) for botanical varieties in Nigeria[19], 1.797cm for local Tamarind variety in India[20], and 1.42cm for botanical varieties in Sudan[21] for fruit length; and (0.884cm-1.087cm) for varieties in Nigeria[19] and 1.106cm for varieties in Sudan for fruit width. The average number of seeds per pod was 4, which was relatively smaller compared to 9 seeds per pod for varieties from Sudan. The average weight of the pulp was found to be 0.5389g/g fruit material while the average density of Tamarind seed was 3.6g/mL against 0.60g/mL reported in literature[20]. The moisture content of 18.18% and ash content of 5.57% presented in Table 3 for the samples from Maroua showed higher values relative to those reported in literature (15.54% and 18.00% moisture content and 3.99 and 3.91% ash content)[22] for samples from Gedarif and Kordofan. as well as 5.8%-15.2% moisture content and 3.9%-5.0% ash content reported in literature[21]. However, the results for moisture content fall within the range reported for varieties from Asia (17.8%-35.8%). The trend in pH and titratable acidity are attributed to the fast growth of microorganisms in the fermentation substrate leading to the production of metabolites, especially organic acids, from the aerobic fermentation process[23]. After the 13th day, the trends in both pH and titratable acidity stabilized at 3.04mL and 19.95mL respectively. These results fall within the limits reported in the literature that was cited earlier and can be attributed to the fermentation process, indicating that most of the substrate (shown in Figure 3B) had been used for ethanol production and cellular growth, with little or no formation of acid. The little difference, if any, between literature values and these results may be attributed to the geographical and botanical variability of the plants as the climate and soil may have direct effects on the physical characteristics of the fruits, seeds and pH of the fruit pulp. The trend in alcohol content and soluble brix within the first 12 days of fermentation could be attributed to the efficiency and strong activity of yeast in fermentation with subsequent production of alcohol[24]. Leveling off of titratable acidity by day 15 of fermentation is characterized by low consumption of sugar and little or no ethanol production. At the final level, the percentage of alcohol in the wine becomes constant, indicating that the fermentation process has come to an end. This result confirmed the variability in pH which suggested that fermentation actually takes place only within the first two weeks of fermentation. The alcohol content of 10% v/v and 16% v/v after days 10 and 19 respectively were both quite appreciable relative to 11% v/v after 10d of fermentation reported in literature for varieties from Vietnam[25]. However, the large difference in numerical values may be attributed to the use of yeast to catalyze the fermentation process and sugar to improve the soluble brix. The study also observed the increasing trend in taste scores with the advancement of aging process. Similar results were reported in literature for sapota and mango juice blended wine that was aged for six months in ambient temperatures[26], star fruit (Averrhoa carambola L.)[27] and Tendu fruit wine[28]. Wine properties such as odor, color, taste and chemical composition are dependent on several parameters such as the yeast strain used, fermentation conditions and the type of fruits involved. Different fruits have different components such as sugar, various organic acid, aldehyde and esters concentrations that are converted by yeast at optimal alcohol conversion conditions. Saccharomyces cerevisiae is the most popular yeast used for the production of wine and there is a possibility that it can metabolize other organic acids such as malic acid to produce alcohol instead of lactic acid[29]. This could have reduced the amount of malic acid available for malolactic fermentation and controlled mouth feel improvement.
The broad range of melting points recorded by the synthesized Tartaric acid and shift in IR wave numbers to higher values was attributed to the presence of various isomeric forms of Tartaric acid (L-, RR, SS, Racemate, and Meso) as shown in Table 5. The prevalent form of Tartaric acid naturally occurring in fruits and often produced synthetically for industrial and domestic is the L (+) Tartaric acid isomer. However, there is the possible presence of other isomeric forms which bring about the modification of physical properties such as melting point. The basic representative IR band regions for calibration of Tartaric acid (1500-850, 1801-1500 and 3000-2800cm-1) were used to quantify the Tartaric acid species in the samples and to identify the sample based on the carboxylate functional group (C=O)[15]. The presence of all the IR bands characteristic of Tartaric acid was indicative of the fact that the samples under investigation were actually Tartaric acid. The crystallinity of the sample under investigation was comparable with that of a standard XRD profile, although the sample under investigation was more powdery. Literature reports on the effect of grinding on the crystal structure of natural Tartaric acid concluded that particle size of Tartaric acid does not affect the crystallinity of the sample[30]. The XRD profiles observed in literature for the pattern of Tartaric acid were similar to those in this study.
5 CONCLUSION
We have been able to extract Tartaric acid from a solid waste residue of wine produced using Tamarind fruit pulp harvested from a locality in Cameroon. The fermentation process was carried out while monitoring such parameters as time of treatment, yeast inoculate and secondary fermentation. The Tamarind pulp wine produced was of acceptable quality (clear, sweet, sparkling, smooth and well-flavored) following the olfactory test. The drink had a pH of 3.04 and an alcohol content of 16%. The PXRD results showed that the Tartaric acid produced was more crystalline relative to the sample obtained from the laboratory. The yeast that was used (Saccharomyces cerevisiae) improved both the alcohol level during the fermentation process (which occurred within the first two weeks) and the quality of wine produced by controlling the mouth feel. The variability of physical and physicochemical parameters evaluated were observed to be a function of the botanical origin of the plant. The procedure used during this study was simple, straightforward, ecofriendly and cost effective. Therefore, direct coupling of the synthesis of Tartaric acid to wine production units is a promising venture which will improve output of agroforestry products and ensure environmental sanity.
Acknowledgements
The authors wish to express their sincere gratitude to Mr. Isaiah Anjah Aboh, the laboratory technician at the Chemistry Laboratory and the members of staff at the Department of Biochemistry, Faculty of Science of the University of Buea, Cameroon for their support.
Conflicts of Interest
The authors declared no conflict of interest.
Author Contribution
All authors have read and approved the final manuscript, participated in all stages of the study under the leadership of Etape EP and Namondo BV.
Abbreviation List
IR, Infrared spectroscopy
N, Normality (units of amount of substance)
NaOH, Sodium hydroxide
PXRD, Powder X-ray diffraction
XRD, X-ray diffraction
References
[1] Moreno Rojas JM, Cosofret S, Reniero F et al. Control of oenological products: discrimination between different botanical sources of L-tartaric acid by isotope ratio mass spectrometry. Rapid Commun Mass Spectrom, 2007; 21: 2447-2450. DOI: 10.1002/rcm.3105
[2] Kontogiannopoulos KN, Patsios SI, Karabelas AJ. Tartaric acid recovery from winery lees using cation exchange resin: Optimization by response surface methodology. Sep Purif Technol, 2016; 165: 32-41. DOI: 10.1016/j.seppur.2016.03.040
[3] Jean-Maurice K. Tartaric acid: Ullmann’s encyclopedia of industrial chemistry, 6th ed. Wiley-VCH: Weinheim, Germany, 2003.
[4] Jens S, Sell D, Hilmer JM. Flavours and fragrances: chemistry, bioprocessing and sustainability. Springer: Berlin, Germany, 2007.
[5] Yu J, Ahmed M. Functional components of grape pomace: Their composition, biological properties and potential applications. Int J Food Sci Technol, 2013; 48: 221-237. DOI: 10.1111/j.1365-2621.2012.03197.x
[6] Uzukwu EU, Shori AB, Baba AS. Phytochemistry and medicinal uses of Tamarindus indica and Persea Americana as sources of plant nutrients. Am J Plant Bio, 2016: 1: 30-34.
[7] Rojas JMM, Cosofret S, Reniero F et al. Control of oenological products: 81%, 91%, 101%, 111%, 121%, 131% discrimination between different botanical sources of L-tartaric acid by isotope ratio mass spectrometry. Rapid Commun Mass Sp, 2007.
[8] Caluwé ED, Halamová K, Damme PV. Tamarindus indica L.A review of traditional uses, phytochemistry and pharmacology. Afr Focus, 2010; 23: 53-83. DOI: 10.1163/2031356X-02301006
[9] Sravanthi T, Waghray K, Rao DS. Phytochemical screening and anti-microbial and anti-oxidant studies of dehydrated tender tamarind (Tamarindus indica) leaves. Int J Food Sci Nutr, 2017; 2: 62-64.
[10] Ado A, Ajibade GA, Maikaje D. Determination of fermentation potentials of Tamarindus indica yeast isolates. Curr Res J Biol Sci, 2015; 7: 1-5. DOI: 10.19026/crjbs.7.5199
[11] Ileola AO, Omodara TR, Filua OD. Comparative studies on the effect of boiling and fermentation on calabash gourd melon (Lagenaria siceraria) seeds. Asian Food Sci J, 2019; 8: 1-12. DOI: 10.9734/afsj/2019/v8i429998
[12] Sadler GD, Murphy PA. Chapter 13: pH and titratable acidity. Kluwer Academic: New York, USA, 2003.
[13] Oke AO, Kamolshotiros P, Popoola OY et al. Consumer behavior towards decision making and loyalty to particular brands. Int Rev Manag Mark, 2016; 6: 43-52.
[14] Fomena Temgoua NS, Sun Z, Okoye CO et al. Fatty acid profile, physicochemical composition, and sensory properties of Atlantic salmon fish (Salmo salar) during different culinary treatment. J Food Quality, 2022; 7425142. DOI: 10.1155/2022/7425142
[15] Yalcin D, Ozcalik O, Altiok E et al. Characterization and recovery of tartaric acid from wastes of wine and grape juice industries. J Therm Anal Calorim, 2008; 94: 767-771. DOI: 10.1007/s10973-008-9345-z
[16] Meng FQ, Lu MK, Yang ZH et al. Thermal behavior of urea-(d) tartaric acid and urea-(dl) tartaric acid crystals. Therm Anal Cal, 1998: 52: 609-613. DOI: 10.1023/A:1010184009607
[17] Moreira JL, Santos L. Analysis of organic acids in wines by Fourier-transform infrared spectroscopy. Anal Bioanal Chem, 2005; 382: 421. DOI: 10.1007/s00216-005-3062-2
[18] Variankaval N, Wenslow R, Murry J et al. Preparation and solid-state characterization of nonstoichiometric cocrystals of a phosphodiesterase-iv inhibitor and l-tartaric acid. Cryst Growth Des, 2006; 6: 690-700. DOI: 10.1021/cg050462u
[19] Adeola AA, Olunlade BA, Afolabi MO et al. A Comparative evaluation of the physical and chemical properties of tamarind (Tamarindus indica l.) seeds in Nigeria. J Agr Res Dev, 2012; 11: 2012.
[20] Karpoora N, Sundara P, Dhananchezhiyan P et al. Physical and engineering properties of tamarind fruit. Int J Sci Eng Tech, 2013; 2: 1083-1087.
[21] Alawad SM, Sulieman AME, Osman MA et al. Production and quality evaluation of Vinegar from Tamarind (Tamarindus indica L.) Fruit Pulp. Gezira J Eng Applied Sci, 2015; 10: 35-46.
[22] Taha SAB, Nour AEAM, Elkhalifa AEO. The value of tamarind Nguyen Phuoc Minh. J Pharm Sci Res, 2016; 11: 1388-1392. DOI: 10.20286/jmbs-050306
[23] Kayode RMO, Sani A. Physicochemical and proximate composition of mango (Mangifera indica) kernel cake fermented with monoculture of fungal isolates obtained from naturally decamped mango kernel. Life Sci J, 2008; 5: 55-63.
[24] Yabaya A, Bobai M, Adebayo LR. Production of wine from fermentation of Vitis vinifera (grape) juice using Saccharomyces cerevisiae strain isolated from palm wine. Int J Inform Res Rev, 2016: 3: 2834-2840.
[25] Minh NP, Thuan HQ, Yen TTH et al. Technical variables of wine fermentation from Tamarind (Tamarindus indica). J Pharm Sci Res, 2019; 11: 1388-1392.
[26] Pawar CD. Standardization of wine making technology in sapota [manilkara achras (mill) Forsberg [Doctor’s thesis]. Karnataka, India: University of Agricultural Sciences; 2009.
[27] Adiyaman P, Kanchana S, Hemalatha G et al. Influence of aging on nutrient retention and organoleptic characteristics of wine developed from star fruit (Averrhoa carambola L.). Emer Life Sci Res, 2019; 5: 17-27. DOI: 10.31783/elsr.2019.521727
[28] Sahu UC, Panda SK, Mohapatra UB. Preparation and evaluation of wine from tendu (Diospyros melanoxylon L) fruits with antioxidants. Int J Food Ferment Technol, 2012; 2: 171-178.
[29] Fleet GH. Yeast interaction and wine flavour. Int J Food Microbiol, 2013: 86:11-22. DOI: 10.1016/S0168-1605(03)00245-9
[30] Luner PE, Patel AD. Quantifying crystal form content in physical mixtures of (±)-tartaric acid and (+)-tartaric acid using near infrared reflectance spectroscopy. AAPS Pharm Sci Tech, 2005; 6: 245. DOI: 10.1208/pt060235
Copyright © 2022 The Author(s). This open-access article is licensed under a Creative Commons Attribution 4.0 International License (https://creativecommons.org/licenses/by/4.0), which permits unrestricted use, sharing, adaptation, distribution, and reproduction in any medium, provided the original work is properly cited.


