
DNA Barcoding for Dipterocarpus Species in Vietnam Based on Chloroplast Gene Region matK
Duc M. Nguyen1,2*, Hoang H. Nguyen1,2, Minh N. Nghiem1,2, Duy D. Vu3, Tam M. Nguyen4, Minh N. Truong2,5, Duc H. M. Tran5, Minh Q. Bui5, Khanh H. Nguyen5, Hong P. L. Nguyen6, Huong T. T. Nguyen7
1Institute of Genome Research, Vietnam Academy of Science & Technology, Hanoi, Vietnam
2Graduate University of Sciences and Technology, Vietnam Academy of Science and Technology, Hanoi, Vietnam
3Institute of Tropical Ecology, Russia-Vietnam Tropical Centre, Hanoi, Vietnam
4Vietnam National Museum of Nature, Vietnam Academy of Science & Technology, Hanoi, Vietnam
5The Center for Research and Technology Transfer, Vietnam Academy of Science & Technology, Hanoi, Vietnam
6Institute of Ecology and Biological Resources, Vietnam Academy of Science & Technology, Hanoi, Vietnam
7Institute of Biotechnology, Vietnam Academy of Science & Technology, Hanoi, Vietnam
*Corresponding to: Duc M. Nguyen, PhD, Laboratory Manager, Vietnam National Museum of Nature, Vietnam Academy of Science & Technology, 18 Hoang Quoc Viet, Hanoi 100000, Vietnam; Email: nmduc@igr.ac.vn
Abstract
Objective: Dipterocarp identification is challenging, based on traditional methods of morphological characteristics for species conservation and management. In the present study, the matK region was used as a DNA bar-code to identify the Dipterocarpaceae species in Vietnam.
Methods: All the samples were collected at studied localities and identified by morphological methods by the botanist. DNA samples were extracted using the modified Cetyltrimethylammonium bromide method and amplified the matK gene by PCR. Sequencing was performed on an Avant 3100 Automated DNA sequencer system.
Results: Thirty-three trees were analyzed, representing 11 species (eight in the Dipterocarpus genus, one in Hopea and one in Vativa) and showing low intraspecific divergence and interspecific divergence within and among Dipterocarpus species, with an average of 0.08% and 0.19%, respectively. However, there was zero distance between D. costatus, D. dyeri, D. intricatus and D. obtusifolius. Three Dipterocarpus species (D. alatus, D. condorensis and D. tuberculatus) were discriminated against, while others (D. costatus, D. dyeri and D. intricatus) showed too low divergent intraspecific lineages and suggested hybridization may be affected them. These results also indicated a low barcoding gap for Dipterocarpus species. The highest gene distance was found between Vatica and Dipterocarpus, with an average of 2.12%.
Conclusion: In this study, we used the matK region as a tool to identify some Dipterocarpaceae species in Vietnam. The accurate identification of species may manage and conserve species effectively. Our results showed little sequence differentiation among most Dipterocarpus species. The lack of differentiation may be due to incomplete lineage sort and hybridization between sympatric species. In order to identify species, a combination of two or three chloroplast gene regions should be utilized in further studies. DNA barcoding gap should be analyzed within different genera in Dipterocarpaceae.
Keywords: Dipterocarpus, DNA barcodes, matK sequences, species identification
1 INTRODUCTION
To identify plant taxon, using a DNA bar-code is considered one of the most effective tools available today. Compared to the mitochondrial gene (cytochrome c oxidase I), which has been used effectively to identify many animal groups[1-3], the synonymous substitution rate of this gene is meager in land plants[4]. Moreover, DNA bar-coding identification is more complicated because of hybridization, polyploidy and apomixis in plants. Therefore, Kress et al. reported using the trnH-psbA gene or using a combination of the trnH-psbA and rbcL genes as an appropriate tool for plant taxonomy[5,6] in 2005 and 2007. In addition, in the study of Lahaye et al.[7], the authors analyzed and compared eight gene regions commonly used in plant taxonomy, including trnH-psbA, matK, ycf5, rbcL, rpoB, ndhJ, accD and rpoC1. The results showed that the matK gene was considered a universal DNA barcode for flowering plants. The matK gene can identify cryptic species. However, the application of DNA bar-codes to plants has been impeded due to problems such as low variation between species. In a study by the Consortium for the Barcode of Life Plant Working Group (2009), the results recommended that the 2-locus combination of ribulose-1,5-bisphosphate carboxylase (rbcL) and maturase (matK) as the plant barcode, which can identify and discover overlooked plant species[8].
The Dipterocarpaceae family comprises 17 genera and approximately 680 species and is divided into three families: Dipterocarpoidae containing 13 genera and about 600 species in Asia lowland tropical forests, Pakaraimoidae with a single species in the Guiana Highlands of South America and Monotoideae with 3 genera and 30 species in Africa and South America. According to Nghia[9], dipterocarps found in Vietnam comprise about 42 species and 6 genera, including Anisoptera (1 species), Dipterocarpus (12 species), Hopea (11 species), Parashorea (2 species), Shorea (8 species) and Vatica (8 species). The primary distribution areas of most of these species are recorded in evergreen, deciduous forests at elevations below 500m or on low-sloping alluvial, granite or basalt rocks and areas with low slopes. The water level rises and falls rapidly in the dry and rainy seasons. In Vietnam, these dipterocarps play a vital role in the ecology and economy of lowland forests. Their wood is used as plywood in construction. Their resin is used extensively in waterproofing boats or as a raw material for paints, varnishes and lacquers.
As a consequence of over-exploitation and forest destruction, natural habitats of the dipterocarps are severely degraded or destroyed and thus, they threaten the long-term maintenance of their genetic diversity and survival. The interspecific relationships within and among species need to be studied in detail to establish effective conservation and reforestation, especially dipterocarp identification. Identifying dipterocarps is not an easy task in Vietnam, based on traditional methods of morphological criteria such as the height of the tree, leaf shape and size, and characters of flowers and fruits. However, most of these characters change with the tree’s age and sometimes with the habitats. For these reasons, more accurate identification of dipterocarp species is imperative.
Phylogenetic analysis among Dipterocarpaceae species based on the nucleotide sequences of some chloroplast gene regions was reported by Kajita et al.[10], Kamiya et al.[11] and Yuwa-amornpitak et al[12]. This study, used chloroplast gene matK to identify eight Dipterocarpus species and one Hopea species and provide additional information to stress the value of species conservation, evolution and systematics of dipterocarps in Vietnam.
2. MATERIALS AND METHODS
2.1 Taxon Sampling
Dipterocarp species were listed in Table 1, including collected locations and GenBank code of published Sequences. In the field, the leaves and inner barks were kept in plastic bags with silica gel. They were then transferred to the Laboratory of Molecular Biology and stored at -30oC until ready to be used for DNA extraction. All specimens were also collected at studied localities and identified scientific names by the botanist of the Institute of Ecology and Biological Resources.
Table 1. The List of Study Species, Locations and Genbank Code
|
Species |
Collected Location |
(GenBank Code) |
1 |
Dipterocarpus alatus CT01 |
Dong Nai province, 80-130m, 11o25′N-107o17′E |
KC568463 |
D. Alatus CT02 |
KC568465 |
||
D. Alatus TP01 |
KC568467 |
||
D. Alatus TP02 |
KC568471 |
||
D. Alatus MD01 |
KC568472 |
||
D. Alatus BG01 |
Binh Phuoc province, 467m, 12o13′N-107o10′E |
KC568464 |
|
D. Alatus BC01 |
Ba Ria-Vung Tau province, 110m, 10o28′N–107o35′E |
KC568470 |
|
D. Alatus LG01 |
Tay Ninh province, 10m, 11o21′N-106o02′E |
KC568466 |
|
D. Alatus PQ01 |
Kien Giang province, 257m, 10o17′N-103o59′E |
KC568468 |
|
D. Alatus YD01 |
Dak Lak province, 220m, 12o49′N-107o34′E |
KC568469 |
|
D. Alatus PY01 |
Phu Yen province, 160m, 13o03′N-108o51′E |
KC568473 |
|
2 |
Dipterocarpus costatus BG01 |
Binh Phuoc province, 450m, 12o15′N-108o08′E |
KC708341 |
D. Costatus LG01 |
Tay Ninh province, 15m, 11o21′N- 106o02′E |
KC708338 |
|
D. Costatus TP01 |
Dong Nai province, 80m, 11o05′N- 107o24′E |
KC708340 |
|
3 |
Dipterocarpus condorensis BC01 |
Ba Ria-Vung Tau province, 110m, 10o28′N-107o35′E |
KC765142 |
D. Condorensis BC02 |
KC765143 |
||
D. Condorensis BC03 |
KC765144 |
||
D. Condorensis TK01 |
Binh Thuan province, 87m, 10o43′N-107o57′E |
KC765151 |
|
D. Condorensis TK02 |
KC765152 |
||
4 |
Dipterocarpus dyeri MD01 |
Dong Nai province, 120m, 11º12′N-107º09′E |
KC765145 |
D. Dyeri BC01 |
Ba Ria-Vung Tau province, 105m, 10o28′N-107o35′E |
KC765146 |
|
5 |
Dipterocarpus tuberculatus YD01 |
Dak Lak province, 180m, 12o49′N-107o32′E |
KC848888 |
D. Tuberculatus YD02 |
KC848889 |
||
D. Tuberculatus IM01 |
Gia Lai province, 210m, 13o21′N-107o37′E |
KC848887 |
|
6 |
Dipterocarpus retusus PT01 |
Phu Tho province, 110 m, 21o23′N-104o79′E |
|
7 |
Dipterocarpus baudii CT01 |
Dong Nai province, 125m, 11o25′N-107o17′E |
|
8 |
Dipterocarpus intricatus MD01 |
Dong Nai province, 125m, 11º12′N-107º09′E |
KC765148 |
D. Intricatus BC01 |
Ba Ria-Vung Tau province, 105m, 10o28′N-107o35′E |
KC765149 |
|
9 |
Dipterocarpus obtusifolius YD01 |
Dak Lak province, 180m, 12o44′N-107o36′E |
KC765153 |
Dipterocarpus obtusifolius YD02 |
KC765154 |
||
Dipterocarpus obtusifolius IM01 |
Gia Lai province, 210m, 13o21′N-107o37′E |
KC765155 |
|
10 |
Hopearecopei MD01 |
Dong Nai province, 130m, 11º12′N-107º09′E |
KC765150 |
11 |
Vatica odorata CT01 |
Dong Nai province, 125m, 11o25′N-107o17′E |
|
2.2 DNA Extraction and Sequencing
Total DNA was extracted using the modified Cetyltrimethylammonium bromide method of Doyle and Doyle[13]. The total DNA amount was checked using the fluorimetry method and diluted to a final concentration of 10ng/µL. The chloroplast gene matK was amplified by the PCR. process: 95oC for 3min; 95oC for 30s, 56oC for 1min and 72oC for 1min with 35 cycles; and completed by incubating at 72oC for 10min; in 25µL final volumes using GeneAmp PCR Systems 9700. Two pairs of primers for the matK region were designed based on the sequence of Dipterocarpus palembanicus (GenBank AB295903): matK3F: 5’-GGG AAA TTC CAT TTT CCC TAC-3’ (forward) and matK3R: 5’-GGA TGC CCT ACT GCG TTA CA-3’ (reverse), matK5F: 5’-TTA TAG GGA AAC AAA AAG CAA CGA G-3’ and matK5R: 5’-CAG ATG GAT GGG ATG AGG TAT TAG-3’ were used for this study (800 nucleotides for per primer). Sequencing was performed on an Avant 3100 Automated DNA sequencer system with the Dye Terminator Cycle sequencing kit.
2.3 Phylogenetic Analyses
Sequence alignments were made with ClustalW[14] and GenDoc[15], and adjusted manually. We used Molecular Evolutionary Genetics Analysis (MEGA) 5 and MEGA3[16,17] to analyze our data. Nucleotide sequence divergences were calculated using a Kimura two-parameter (K2P) model[18]. A neighbour-joining (NJ) tree of interspecific divergence including bootstrap analysis was performed using MEGA3.
3 RESULTS
All the studied samples (Table 1) were successfully amplified for matK, with high sequencing rates of 100%. The sequences have been deposited in GenBank under accession numbers KC568463-72, KC708338-41, KC765143-55 and KC84887-89. The resulting alignments of the matK region included 1191bp in length, of which 63 nucleotide sites were variable, and 22 were parsimony informative for all the studied species, 1062bp of which two sites were variable, and two were parsimony informative for Dipterocarpus alatus, 1109bp of which four nucleotide positions were variable (D. costatus), 1147bp of which one was variable (D. intricatus), 1085 (D. dyeri), 1136bp of which two were variable (D. condorensis), 1103-1105bp of which two were variable (D. tuberculatus). There were no variables, and parsimony was informative for both D. dyeri (1085bp) and D. obtusifolius (1130-1132bp).
The data showed that the genus Dipterocarpus had GC contents ranging from 32.7% (Dipterocarpus baudii) to 32.94% (D. condorensis), with an average of 32.8%. The mean base compositions were 37.7, 18.0, 29.5 and 14.8% for T, C, A and G, respectively. Compared to all sequence pairs within the genus Dipterocarpus, the average rate of transition to transversion was 0.751. The rates of different transitional substitutions were found to vary from 7.26 (C to T) to 16.66 (A to G), with an average of 11.36. In contrast, the rates of transversional substitutions were lower, an average of 6.82 (4.06 in G to C or G to T to 9.72 in T to A or T to G). Among the three codon positions, the base compositions were 29.6, 34.1 and 34.7 in CG at the first, second and third positions, respectively. For all nucleotide pair comparisons within the genus Dipterocarpus, the average transition/transversion rate at the third position was 9.13 times higher than those at the two remaining codon positions; 1.26 and 0.20 for the first and second position, respectively.
Parsimony analysis, based on 33 nucleotide sequences of 11 dipterocarp species, generated 512 most parsimonious trees with a tree length of 47, a consistency index of 0.957, a retention index of 0.923 and a composite index of 0.884 for all sites; and that of 0.895, 0.923 and 0.826 for parsimony informative sites, respectively.
Concerning the divergence, based on K2P sequence distance, genetic divergence values were found for the matK region both within and between studied dipterocarp species (Tables 2 and 3). The matK region showed a maximum intraspecific divergence of 0.2%. Among 11 individuals of D. alatus, a mean intraspecific divergence of 0.072% was found with a range of 0 to 0.2%, while 5 individuals of D. condorensis had 0.075% intraspecific divergence with a range of 0-0.2%. D. tuberculatus had 0.126% mean intraspecific divergence with a range of 0-0.2%. The mean intraspecific divergence value within the Dipterocarpus species was 0.08% (ranging from 0 to 0.126%), while the mean interspecific divergence between the Dipterocarpus species was 0.19% (ranging from 0 to 0.5%). Zero distances were found within four species; D. costatus, D. dyeri, D. intricatus and D. obtusifolius. The maximum interspecific divergence was found in matK, i.e., 0.5%. The species pairs, D. alatus/D. retusus, D. dyeri/D. retusus and D. alatus/D. retusus showed the highest interspecific divergence, i.e. 0.5%, whereas zero distances were observed between three species pairs; D. obtusifolius/D. costatus, D. obtusifolius/D. intricatus and D. intricatus/D. costatus. Our results showed that the highest interspecific divergence among genera was obtained between Dipterocarpus and Vatica (2.13%), and the lowest divergence was obtained between Dipterocarpus and Hopea (1.5%).
Table 2. Intraspecific Divergence within Seven Dipterocarpus Species
Species |
No. of Specimens |
No. of Nucleotide Positions |
Similarity (%) |
Intra-species Divergence |
Dipterocarpus alatus |
11 |
1062 |
99.18 (99-100) |
0.000721 (0-0.002) |
D. costatus |
3 |
1062 |
100.00 |
0 |
D. dyeri |
2 |
1056 |
100.00 |
0 |
D. intricatus |
2 |
1062 |
100.00 |
0 |
D. condorensis |
5 |
1062 |
99.2 (99-100) |
0.00075 (0-0.002) |
D. obtusifolius |
3 |
1062-1064 |
99.3 (99-100) |
0 |
D. tuberculatus |
3 |
1062-1064 |
99.3 (99-100) |
0.00126 (0-0.002) |
Table 3. Interspecific Divergence among 11 Dipterocarp Species
Species |
1 |
2 |
3 |
4 |
5 |
6 |
7 |
8 |
9 |
10 |
1. D. baudii |
|
|
|
|
|
|
|
|
|
|
2. D. obtusifolius |
0.001 |
|
|
|
|
|
|
|
|
|
3. D. dyeri |
0.002 |
0.002 |
|
|
|
|
|
|
|
|
4. D. retusus |
0.005 |
0.004 |
0.005 |
|
|
|
|
|
|
|
5. D. costatus |
0.001 |
0.000 |
0.002 |
0.004 |
|
|
|
|
|
|
6. D. alatus |
0.001 |
0.001 |
0.002 |
0.005 |
0.001 |
|
|
|
|
|
7. D. tuberculatus |
0.001 |
0.001 |
0.002 |
0.004 |
0.001 |
0.001 |
|
|
|
|
8. D. intricatus |
0.001 |
0.000 |
0.002 |
0.004 |
0.000 |
0.001 |
0.001 |
|
|
|
9. D. condorensis |
0.002 |
0.001 |
0.002 |
0.004 |
0.001 |
0.001 |
0.001 |
0.001 |
|
|
10. Hopearecopei |
0.015 |
0.014 |
0.016 |
0.018 |
0.014 |
0.015 |
0.015 |
0.014 |
0.015 |
|
11. Vatica odorata |
0.021 |
0.021 |
0.022 |
0.023 |
0.021 |
0.021 |
0.021 |
0.021 |
0.021 |
0.019 |
An NJ tree of sequence divergences (K2P) at the matK region reflected the above findings. It indicated that all the Dipterocarpus species formed a monophyletic clade characterized by a high bootstrap value (100%), with a branch length of 0.0331 (Figure 1). Samples of the same species were grouped and samples of D. retusus were separated from other Dipterocarpus species. This suggests that D. retususis distributed in North Vietnam and other species in South Vietnam.
|
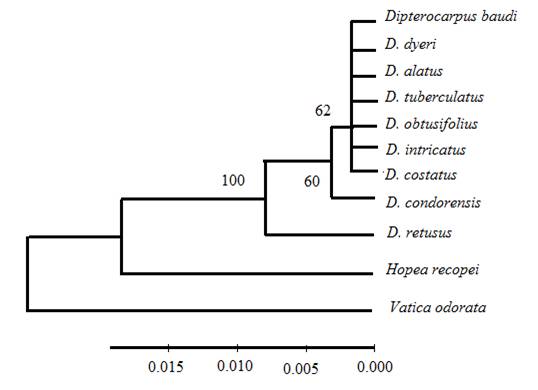
Figure 1. An NJ tree of matK sequence divergences (K2P) in 11 dipterocarp species.
4 DISCUSSION
Dipterocarp species in Vietnam are recognized by morphological characteristics and their geographic distributions[9,19]. When considering species identification, we used the K2P genetic distance at the matK region to distinguish between and among dipterocarp species and showed high interspecific values between D. retusus with the remaining Dipterocarpus species including D. costatus, D. alatus, D. tuberculatus, D. condorensis, D. intricatus, D. baudii, D. obtusifolius and D. dyeri. Therefore, there exists some barcoding gaps (i.e. genetic variation within species is lower than the variation among species in a species group[20]). However, the mean value of intraspecific divergence was meager (0.0721% for D. alatus, 0.075% for D. condorensis and 0.126% for D. tuberculatus) and the mean value of interspecific divergence was higher (0.19%) for Dipterocarpus species. Previous studies also showed similar results when using the matK bar-code for flowering plants in Sumatra[21]. D. retusus is clearly separated as the monophyletic lineage from the remaining Dipterocarpus species and identified as a sister clade (bootstrap value of 100%). D. retusus is distributed in northern Vietnam and the remaining Dipterocarpus species in southern Vietnam. Similarly, D. condorensis is separated from seven Dipterocarpus species, including D. baudii, D. dyeri, D. alatus, D. tuberculatus, D. obtusifolius, D. intricatus and D. costatus (60% bootstrap value), too. These seven species are clustered together with a bootstrap value of 62%.
Dipterocarpus alatus was represented by 11 specimens and formed three groups based on Automatic Barcode Gap Discovery software[22]; one group included 8 specimens, one included 2 specimens, and one of 1 specimen. The genetic variation between the first two groups was found at 0.2%. A third group consisted of only one specimen from Phu Quoc islands, which was separated from the first two groups in relation to a bit of variation of 0.1%.
Dipterocarpus condorensis was represented by 5 specimens and formed two groups. One group included 4 specimens (TK01, TK02, BC01 and BC03), and one group was separated by one specimen, BC02, in Binh Chau Phuoc Buu (Ba Ria Vung Tau province). The genetic variation between the two groups was found at 0.2%.
Except for two D. dyeri specimens (MD01 and BC01) which were clustered together with a high bootstrap value (85%), two D. tuberculatus specimens of YD01 and IM01 were grouped with the weakly supported value. The genetic variation between two of these specimens was found at 0.2%.
Identifying distinct evolutionary lineages is utilized to delimit the described species[23,24]. Moreover, accurate identification of species may effectively manage and conserve species. Based on data from matK, our results showed little sequence differentiation among most Dipterocarpus species. The lack of differentiation may be due to incomplete lineage sort and hybridization between sympatric species. Most Dipterocarpus species were collected in Southeastern Vietnam, except for D. retusus in North Vietnam. The lack of resolution may be caused by the insufficient time for divergence between lineages. Hybridization may play a vital role in the divergence of Dipterocarpus species in this region. Incompatibility may be a cause of the breakdown of species boundaries.
5 CONCLUSION
DNA barcoding approach, development of molecular systematics is used to identify diverse species groups with a high level of accuracy where morphological characteristics are challenging to detect species. Thus, its knowledge will improve species conservation and natural resource management. In the present study, we investigated Dipterocarpus species based on the data set from matK and indicated the meager difference between species. Very high similarity was also found in several species. The results suggest that specimens collected from the same geographical region (southeastern Vietnam) reduced genetic divergence within species.
Acknowledgements
This research was supported by a grant, # THTETN.03/21-23, from the Vietnam Academy of Science and Technology, Vietnam.
Conflicts of Interest
All authors declared no conflict of interest.
Author Contribution
All authors participated in conception and design, analysis and interpretation of the data, drafting the article or revising it critically for important intellectual content, and approval of the final version.
Abbreviation List
K2P, Kimura two-parameter
MEGA, Molecular Evolutionary Genetics Analysis
NJ, Neighbour-joining
References
[1] Hebert PD, Stoeckle MY, Zemlak TS et al. Identification of birds through DNA barcodes. PLoS Biol, 2004; 2: e312. DOI: 10.1371/journal.pbio.0020312
[2] Clare EL, Lim BK, Engstrom MD et al. DNA barcoding of neotropical bats: Species identification and discovery within Guyana. Mol Ecol Notes, 2007; 7: 184-90. DOI: 10.1111/j.1471-8286.2006.01657.x
[3] Ivanova NV, Zemlak TS, Hanner RH et al. Universal primer cocktails for fish DNA barcoding. Mol Ecol Notes, 2007; 7: 544-8. DOI: 10.1111/j.1471-8286.2007.01748.x
[4] Cho Y, Mower JP, Qiu YL et al. Mitochodrial substitution rates are extraordinarily evevated and variable in a genus of flowering plants. P Natl Acad Sci, 2004; 101: 17741-17746. DOI: 10.1073/pnas.0408302101
[5] Kress WJ, Wurdack KJ, Zimmer EA et al. Use of DNA barcodes to identify flowering plants. P Natl Acad Sci, 2005; 102: 8369-8374. DOI: 10.1073/pnas.0503123102
[6] Kress WJ, Erickson DL. A two-locus global DNA barcode for land plants: The coding rbcL gene complements the non-coding trnH-psbA spacer region. PLoS One, 2007; 2: e508. DOI: 10.1371/journal.pone.0000508
[7] Lahaye R, Van der Bank M, Bogarin D et al. DNA barcoding the floras of biodiversity hotspots. P Natl Acad Sci, 2008; 105: 2923-8. DOI: 10.1073/pnas.0709936105
[8] Group CPW, Hollingsworth PM, Forrest LL et al. A DNA barcode for land plants. P Natl Acad Sci, 2009; 106: 12794-12797. DOI: 10.1073/pnas.0905845106
[9] Nghia NH. Dipterocarps in Vietnam. Agricultural Publishing House: Hanoi, Vietnam, 2005.
[10] Kajita T, Kamiya K, Nakamura K et al. Molecular phylogeny of dipetrocarpaceae in Southeast Asia based on nucleotide sequences of matK, trnL Intron, and trnL-trnF intergenic spacer region in chloroplast DNA. Mol Phylogenet Evol, 1998; 10: 202-9. DOI: 10.1006/mpev.1998.0516
[11] Kamiya K, Harada K, Tachida H et al. Phylogeny of PgiC gene in Shorea and its closely related genera (Dipterocarpaceae), the dominant trees in Southeast Asian tropical rain forests. Am J Bot, 2005; 92: 775-88. DOI: 10.3732/ajb.92.5.775
[12] Yuwa-Amornpitak T, Vichitsoonthonkul T, Tanticharoen M. Molecular phylogeny of diptercarpaceae in Thailand using trnL-trnF and atpB-rbcL intergenicspacer region in chloroplast DNA. Pak J BiolSci, 2006; 9: 649-653. DOI: 10.3923/pjbs.2006.649.653
[13] Doyle JJ, Doyle JL. A rapid DNA isolation procedure for small quantities of fresh leaf tissue. Phytochem Bull, 1987; 19: 11-15.
[14] Thompson JD, Gibson TJ, Plewniak F et al. The CLUSTAL_X windows interface: Flexible strategies for multiple sequence alignment aided by quality analysis tools. Nucleic Acids Res, 1997; 25: 4876-4882. DOI: 10.1093/nar/25.24.4876
[15] Nicholas KB, Nicholas HBJr. GenDoc: A tool for editing and annotating multiple sequence alignments. 1997.
[16] Kumar S, Tamura K, Nei M. MEGA3: Integrated software for molecular evolutionary genetics analysis and sequence alignment. Brief Bioinform, 2004; 5: 150-163. DOI: 10.1093/bib/5.2.150
[17] Tamura K, Peterson D, Peterson N et al. MEGA5: Molecular evolutionary genetics analysis using maximum likelihood, evolutionary distance, and maximum parsimony methods. Mol Biol Evol. 2011; 28: 2731-2739. DOI: 10.1093/molbev/msr121
[18] Kimura M. A simple method for estimating evolutionary rates of base substitutions through comparative studies of nucleotide sequences. J Mol Evol, 1980; 16: 111-120. DOI: 10.1007/BF01731581
[19] Ho PD. Flora of Vietnam. Young Pub. Hou. Vietnam, 1999.
[20] Mayer CP, Paulay G. DNA barcoding: Error rates based on comprehensive sampling. PLoS Biol, 2005; 3: e422. DOI: 10.1371/journal.pbio.0030422
[21] Amandita FY, Rembold K, Vornam B et al. DNA barcoding of flowering plants in Sumatra, Indonesia. Ecol Evol, 2019; 9: 1858-1868. DOI: 10.1002/ece3.4875
[22] Puillandre N, Lambert A, Brouillet S et al. ABGD, automatic barcode gap discovery for primary species delimitation. Mol Ecol, 2012; 21: 1864-1877. DOI: 10.1111/j.1365-294X.2011.05239.x
[23] De Queiroz K. Species concepts and species delimitation. Syst Biol, 2007; 56: 879-886. DOI: 10.1080/10635150701701083
[24] Goldstein PZ, DeSalle R. Integrating DNA barcode data and taxonomic practice: Determination, discovery, and description. Bioessays, 2011; 33: 135-147. DOI: 10.1002/bies.201000036
Copyright © 2022 The Author(s). This open-access article is licensed under a Creative Commons Attribution 4.0 International License (https://creativecommons.org/licenses/by/4.0), which permits unrestricted use, sharing, adaptation, distribution, and reproduction in any medium, provided the original work is properly cited.



 Copyright ©