Research on Spatial Siting of Transmission and Substation
Hanwen Zhou1, Xingdong Wang1*
1School of Information Science and Engineering, Henan University of Technology, Zhengzhou, Henan Province, China
*Correspondence to: Xingdong Wang, PhD, Professor, School of Information Science and Engineering, Henan University of Technology, 100 Lianhua Street, High tech Zone, Zhengzhou, 450000, Henan Province, China; E-mail: zkywxd@163.com
DOI: 10.53964/jia.2024006
Abstract
Objective: Based on borehole survey data from 13 designated research areas in Muyang County, Suqian City, Jiangsu Province, and considering various influencing factors such as climate conditions, topography, geological characteristics, hydrogeology, and seismic activity, a study is conducted using the analytic hierarchy process (AHP) to determine the optimal location for the construction of a substation.
Methods: Initially, a hierarchical structural model is established. Subsequently, experts rate various influencing factors using a 9-level scale and create judgment matrices. Finally, the weights of these influencing factors are calculated using the arithmetic mean method.
Results: Combining the weights obtained through AHP with the scoring table for each location results in the final ranking of site scores. The location with the lowest score indicates that it is minimally affected by all influencing factors and is therefore considered the best site for selection.
Conclusion: Expert ratings inherently involve subjectivity. To address this, a consistency check is conducted, and upon calculation, the consistency check passes, affirming the accuracy of the metric weights and rankings. This approach exhibits a certain degree of correctness and scientific rigor.
Keywords: analytic hierarchy, consistency check, optimal siting selection, transmission substations
1 INTRODUCTION
The strategic planning of substations holds a pivotal role within the framework of urban electrical grid planning, directly influencing the economic efficiency and reliability of the network's structure, investment, and operational performance within the designated area[1]. As urbanization and industrialization continue to surge, the matter of substation site selection[2] has gained increasing prominence. Traditional substation planning not only entails a substantial workload and extended project timelines but is also susceptible to a multitude of subjective influences. This complexity makes it challenging to comprehensively account for the diverse factors impacting substation site selection, resulting in significant difficulties during the selection process[3].
Xu and Zhang[4] have pioneered models for substation site selection across different time periods. They leverage a wealth of electrical big data, encompassing fundamental geographic information, imagery, data on natural conservation areas, and other foundational electrical planning data. These datasets, coupled with advanced GIS spatial analysis technology, facilitate intelligent and data-driven substation site selection. Wang et al.[5] employed a spatial multi-scale evaluation model to conduct statistical analyses of potential sites, taking into consideration factors such as topographical variations, land usage constraints, and river dynamics through a comprehensive and intelligent assessment. This approach contributes to addressing the challenges of site selection, even though it may not encompass all potential influencing factors.
The selection of substation sites involves a highly complex set of factors, including climate conditions, topography, and geological characteristics such as soil and rock properties[6], hydrogeology, seismic activity, and fault zones, among other essential elements. These factors are interrelated and influenced by various variables. Therefore, establishing a rational evaluation criteria system that scientifically reflects the interplay among these factors is a critical issue. Additionally, there is a lack of uniform standards and regulations in this field. This paper proposes to address the site selection problem in multi-region studies using the analytic hierarchy process (AHP). This method allows for the comprehensive consideration of multiple factors and variables, swiftly identifying optimal solutions when dealing with numerous alternative sites. It aims to provide scientific decision support for the site selection process.
2 METHODS
2.1 Analyze the Situation in the Study Area
The following is the point distribution map (Figure 1) and measurement and control point information (Table 1).
|
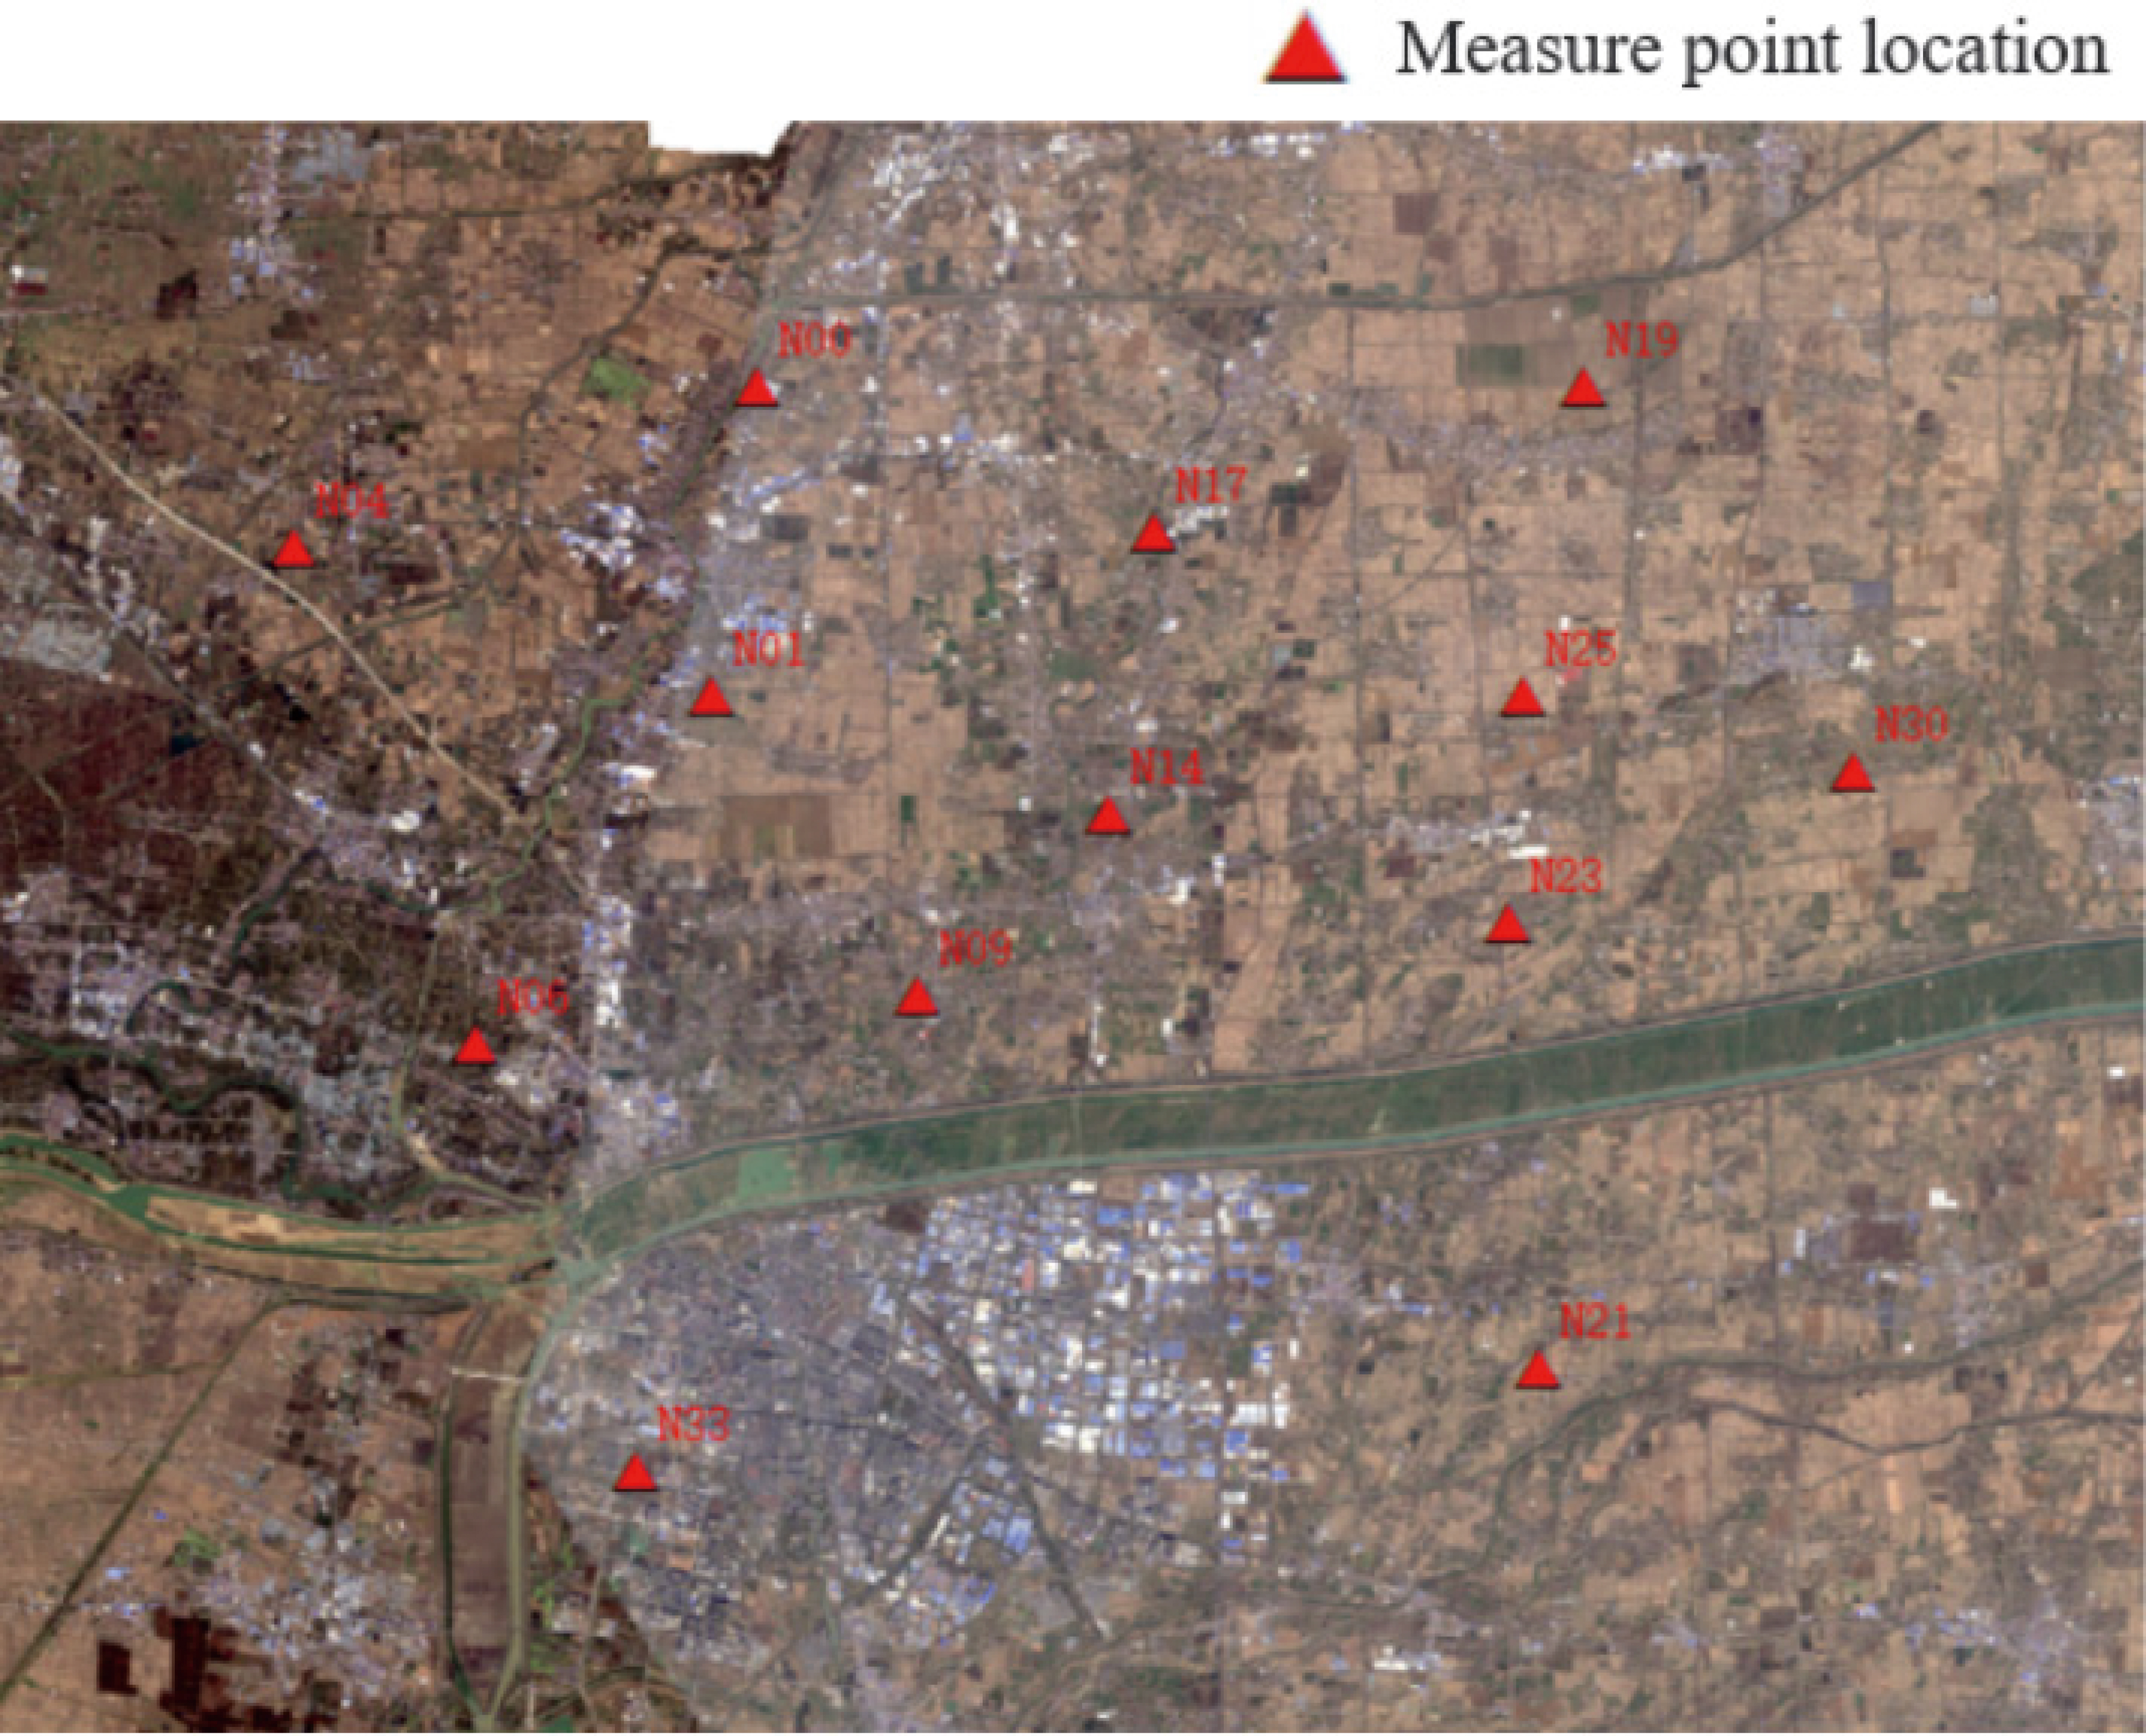
Figure 1. Study the distribution of regional maps and measurement and control points.
Table 1. Drill Point Table
Number |
Coordinate Location (m) |
Elevation |
Depth |
Groundwater (m) |
||
X |
Y |
Depth |
Elevation |
|||
N00 |
538,417.216 |
3,777,878.189 |
5.11 |
21.80 |
0.00 |
5.11 |
N01 |
538,705.162 |
3,783,107.997 |
4.56 |
25.70 |
1.70 |
2.86 |
N04 |
539,098.440 |
3,783,850.307 |
4.34 |
22.80 |
1.70 |
2.64 |
N06 |
539,423.382 |
3,784,472.679 |
4.32 |
25.60 |
1.80 |
2.52 |
N09 |
540,105.049 |
3,785,209.982 |
4.34 |
22.40 |
1.80 |
2.54 |
N14 |
541,433.975 |
3,785,057.363 |
4.30 |
22.00 |
1.70 |
2.60 |
N17 |
542,339.859 |
3,785,123.245 |
3.98 |
20.30 |
1.80 |
2.18 |
N19 |
543,143.045 |
3,785,181.622 |
4.06 |
23.70 |
1.70 |
2.36 |
N21 |
543,916.058 |
3,785,238.046 |
3.88 |
22.50 |
1.80 |
2.08 |
N23 |
544,673.782 |
3,785,293.037 |
3.77 |
25.90 |
1.80 |
1.97 |
N25 |
545,471.662 |
3,785,351.239 |
4.05 |
22.70 |
1.60 |
2.45 |
N30 |
546,280.997 |
3,785,646.138 |
4.19 |
23.60 |
1.70 |
2.49 |
N33 |
547,564.891 |
3,786,113.886 |
5.07 |
21.10 |
1.80 |
3.27 |
2.1.1 Geographical Overview
According to Figure 2A. In Muyang County, two major topographical landscapes are distributed—remnant hill land and plains—characterized as a transitional zone between the Lunan Hills and the Jianghuai Plain. The terrain slopes from west to east, forming a distinctive pattern of 'one hill abrupt plain.' The highest point in the county is Han Mountain, standing at an elevation of 65.9 meters, prominently situated in the western region. The western hilly areas have ground elevations ranging from 20 to 10m, while the central and eastern regions consist of vast plains, with elevations mostly between 7 to 4.5m. The lowest point in the county is near Xile in the northeast, with an elevation of only 3.4m. The region is crisscrossed with a dense network of rivers, where natural water flows from west to east or northeast, while human-made channels run north to south. The intertwining of natural and artificial waterways creates a grid-like network of rivers across the plains.
|
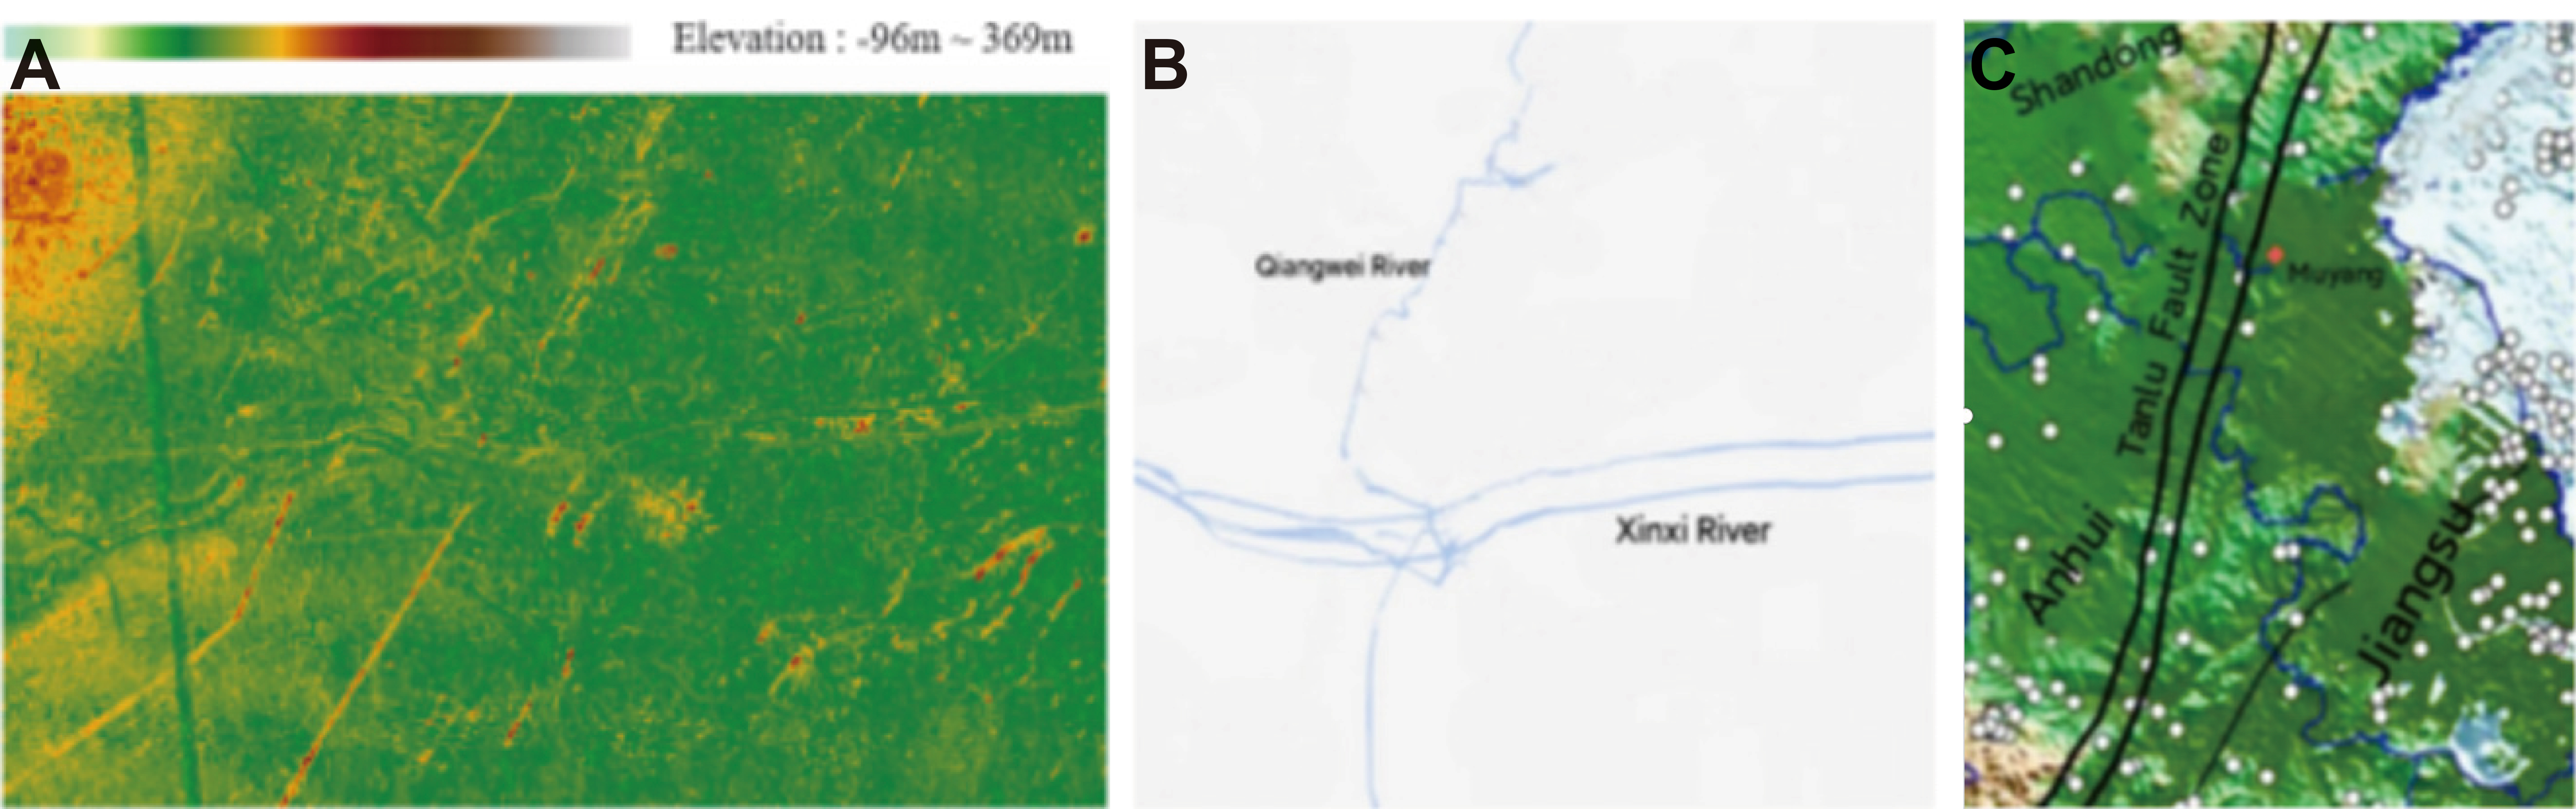
Figure 2. Topographic map of Muyang County. A: Elevation map of Muyang County; B: Muyang County water system map; C: Tanlu fault zone.
Mountainous Areas: The mountainous terrain in Muyang primarily consists of residual hills and hillocks. Han Mountain, for instance, stretches approximately 400m from east to west and about 250m from north to south. The surrounding area is characterized by a relative elevation of around 60m, enclosed by Quaternary alluvial deposits. Wan Mountain is relatively low and covers a smaller area, with an elevation of 15.9m and a relative elevation of 11.5m. The region from Da Guan Zhuang to Yin Ping Long Gang extends in a north-northeast to south-southwest direction, with ground elevations ranging from 10 to 20.4m. The area from Yue Lai to Liu Ji Long Gang has ground elevations ranging from 10 to 20.6m.
Plains: There are three major plains within the boundaries of Muyang County. The coastal plain is located in the northeastern part of the county, with ground elevations ranging from 4.5 to 3.2m. The Yellow River floodplain is distributed in the southeastern part of the county, south of the Yi River, with ground elevations ranging from 11 to 4.5m, with most areas falling between 9 and 5m. The floodplains of the Yi and Mu Rivers are situated north of the Yi River, with ground elevations ranging from 6.5 to 4.5m.
The primary landform unit in the region is the floodplain of the Yellow River. Within the range of exploration depth, the soil layers consist mainly of cohesive soil, sandy cohesive soil, and fine sandy soil.
2.1.2 Overview of the Water System
According to Figure 2B. The water system in Muyang County is divided by the New Yi River into two regions: Yinan and Yibei.
Yinan Region: Located in the eastern part of Suqian City, it borders Suqian District to the west and connects with Guannan and Lianshui counties to the east. To the south, it shares a boundary with Huai'an, and to the north, it is bounded by the New Yi River. In this area, the Huai River western branch includes the Chaoyi River and the Lubei River, draining into the New Yi River. The rainfall-induced floodwaters in the Da Jian River basin pass through the Chai Mi River reservoir and then into the Chai Mi River. Along the way, there are drainage rivers such as Nan Chong River, Bei Chong River, Liu Chai River, and Jun Chai River. Similarly, the drainage rivers in the Huai Dong region, including Chai Nan River, Yi Nan River, and Bei Liu Tang River, all flow into the Guan River and eventually into the sea.
Yibei Region: The Yibei area is situated north of the New Yi River, bordered by Xinxi City to the west, Donghai County to the north, and Guanyun County to the east. This region’s main drainage rivers include the Chalu Xin Kai River, the Muxin River, and the Gubo Shanhou River. The Chalu Xin Kai River collects water from tributaries along the route, including Yuji Gou, Da Sha River within New Yi territory, and Lin Tou River. These waters flow into the New Yi River. The Muxin River collects water from tributaries like Lu Nan River, Xin Wu Huangni River, and Youyi River, and eventually enters the Huangni Qiangwei River, which flows into the Linhong River and into the sea. The Gubo Shanhou River primarily collects water from tributaries that flow east and enter the Leizi Kou and reach the sea.
In the project area, to the north, there is the Qian Qiangwei River, to the west, the Muxin River, to the south, the New Yi River, and the Gubo Shanhou River. The route lies between the Qian Qiangwei River and the Gubo River, belonging to the Gubo River water system.
2.1.3 Climate Profile
Muyang County falls within the warm temperate zone on the southern edge of a humid monsoon climate. The climate across the region is generally mild, but it experiences distinct seasons. Spring can be quite variable, alternating between dry and wet, and warm and cool conditions. Summers are hot with concentrated rainfall, while autumn is characterized by mild, clear skies. Winters are cold with infrequent rain and snow. The area enjoys ample sunshine and abundant rainfall.
The annual average temperature is 13.8℃, with extreme highs reaching 40℃ and extreme lows dropping to -23.4℃. The annual average high temperature is 14.3℃, and the low averages around 13.3℃. Over the years, the highest temperatures have typically ranged between 35℃ and 38℃, with the lowest temperatures around -4℃ to -5℃. Since the 1980s, there has been a warming trend during the winter months.
Annual average precipitation amounts to 937.6mm, with the highest recorded rainfall of 1,445.3mm occurring in 1974, and the lowest of 552.0mm in 1966. On average, there are 96.1 days of rainfall per year, with the highest number of rainy days being 120 in 1964 and the fewest at 69 in 1978. The rainy season usually begins in late June and extends to the latter part of July, lasting approximately 20 days. Summer rainfall accounts for about 60% of the annual total, with the maximum daily rainfall reaching 284.7mm on June 7, 1989.
The average annual wind speed is 2.8m/s, with an average of 27.9 days of strong winds per year. During spring, the prevailing winds are from the east and east-northeast. In summer, the dominant winds come from the east-southeast. Autumn is characterized by winds from the east-northeast, and in winter, the primary wind direction is east-northeast to north. Throughout the year, the predominant wind directions are from the east-southeast and east-northeast.
The annual average sunshine hours amount to 2,363.7h, with two peak periods of sunshine during the year. The first peak occurs in May and June, while the second peak is in August.
The average relative humidity throughout the year is 75%, with the highest relative humidity levels typically observed during the summer. The annual average absolute humidity is 14.2hPa.
2.1.4 Geotechnical Properties of the Foundation
The geological units in this construction site are primarily located in the floodplain of the Yellow River. Within the range of exploration depth, the soil layers consist mainly of cohesive soil, sandy cohesive soil, and fine sandy soil. Based on the geological composition and characteristics of the subsoil, the upper and middle layer soils at various points in this area are described in Table 2.
Table 2. The Upper and Middle Layer Soils at Various Points
Number |
Soil |
Features |
Bearing Capacity |
N00 |
Mixed Fill Soil |
Ingredients is more miscellaneous, local containing more stones and broken bricks |
Average |
N01 |
silt |
Gray-yellow, brown, smooth surface, rapid response to shaking, moderately compact |
difference |
N04 |
Silty Clay |
Gray-yellow, brown, smooth surface, moderate dry strength, moderate toughness, moderate compressibility, hard plastic to firm |
relatively good |
N06 |
Clay |
Greyish yellow, brown, shiny, medium dry strength, medium toughness, medium compressibility, soft plastic |
Average |
N09 |
Clay |
Greyish yellow, brown, shiny, medium dry strength, medium toughness, medium compressibility, hard plastic |
relatively good |
N14 |
Sandy Cohesive Clay |
rown, brown-yellow, glossy, high dry strength, high toughness, moderate compressibility, contains iron manganese nodules, hard plastic to firm |
relatively good |
N17 |
Clay |
Greyish yellow, brown, shiny, medium dry strength, medium toughness, medium compressibility, hard plastic |
relatively good |
N19 |
Clay |
Greyish yellow, brown, shiny, medium dry strength, medium toughness, medium compressibility, hard plastic |
relatively good |
N21 |
Clay |
Greyish yellow, brown, shiny, medium dry strength, medium toughness, medium compressibility, plasticity |
very good |
N23 |
Fine Sandy Soil |
Yellow, low compressibility, very wet, dense. The main components include feldspar, quartz, mica, etc., with good abrasion resistance and selectivity |
very good |
N25 |
Clay |
Greyish yellow, brown, shiny, medium dry strength, medium toughness, medium compressibility, hard |
very good |
N30 |
Clay |
Greyish yellow, brown, shiny, medium dry strength, medium toughness, medium compressibility, hard |
very good |
N33 |
Medium-Fine Sand |
Yellow, low compressibility, very wet, dense. The main components include feldspar, quartz, mica, etc. with good abrasion resistance and selectivity |
very good |
Please note that some of the terms used may have specific geological meanings and might not require grammatical correction. However, the translation and descriptions have been provided in a more coherent and grammatically corrected manner.
2.1.5 Earthquakes and Fault Zones
The Tan-Lu Fault Zone[7], stretching from northeast to southwest, traverses Anhui Province. The study area lies north of the Yangtze River, spanning both sides of the Huai River. It is situated in the transitional zone between the southern edge of the Huang-Huai-Hai Plain, the eastern extension of the Qinling Mountains, the middle and lower reaches of the Yangtze River, and the northern hills of Jiangnan. The active faults are mainly distributed in the northern and eastern parts of the region. The seismic intensity belongs to the sixth degree or lower, indicating relatively moderate seismic activity. The recent tectonic movement is characterized by overall uplift[8,9], as shown in Figure 2C.
The geological structure in Muyang County is located in the transitional zone between the North China uplift area and the Subei Basin of the Yangtze region. There are two main types of geological structures in the county: uplifts and depressions, and fault structures (specifically, the Tan-Lu Fault Zone passes through this county).
Table 3 is peak acceleration of ground motion and characteristic period values of response spectrum.
Table 3. Peak Acceleration of Ground Motion and Characteristic Period Values of Response Spectrum
Number |
Class II Venues |
Class III Venues |
||
Ground Motion Peak Acceleration |
The Characteristic Period Value of the Response Spectrum |
Ground Motion Peak Acceleration |
The Characteristic Period Value of the Response Spectrum |
|
N00 |
0.10g |
0.45 |
1.25 |
0.60 |
N01 |
0.10g |
0.45 |
1.25 |
0.60 |
N04 |
0.10g |
0.45 |
1.25 |
0.60 |
N06 |
0.10g |
0.45 |
1.25 |
0.60 |
N09 |
0.l0g |
0.45 |
1.25 |
0.60 |
N14 |
0.l0g |
0.45 |
1.25 |
0.60 |
N17 |
0.20g |
0.54 |
1.30 |
0.65 |
N19 |
0.20g |
0.54 |
1.30 |
0.65 |
N21 |
0.20g |
0.54 |
1.31 |
0.65 |
N23 |
0.20g |
0.54 |
1.31 |
0.65 |
N25 |
0.20g |
0.54 |
1.31 |
0.65 |
N30 |
0.30g |
0.67 |
1.36 |
0.66 |
N33 |
0.30g |
0.68 |
1.36 |
0.67 |
Table 4 is the expert-scored drill control point score.
Table 4. Thirteen Drill Hole Measurement and Control Point Score Table
Number |
Climate |
Topography |
Soil Characteristics |
Hydrogeology |
Earthquake and Fault Zones
|
N00 |
3 |
3 |
5 |
6 |
1 |
N01 |
3 |
3 |
1 |
6 |
1 |
N04 |
3 |
6 |
3 |
5 |
1 |
N06 |
3 |
1 |
3 |
5 |
1 |
N09 |
3 |
6 |
3 |
5 |
1 |
N14 |
3 |
2 |
1 |
5 |
1 |
N17 |
3 |
2 |
1 |
5 |
2 |
N19 |
3 |
5 |
6 |
5 |
2 |
N21 |
3 |
5 |
4 |
5 |
2 |
N23 |
3 |
4 |
2 |
4 |
2 |
N25 |
3 |
6 |
6 |
4 |
2 |
N30 |
3 |
3 |
6 |
4 |
3 |
N33 |
3 |
7 |
2 |
4 |
3 |
2.2 AHP
AHP[10,11] was developed in the early 1970s by Thomas L. Saaty, an operations researcher at the University of Pittsburgh. He was working for the US. Department of Defense at the time, using AHP to allocate resources based on the contributions of various industrial sectors to national welfare. AHP is a method for systematically addressing complex decision-making problems by progressively eliminating unnecessary factors and determining the optimal solution. It is a multi-criteria decision-making approach used to evaluate decision alternatives by constructing a hierarchical structure model.
AHP breaks down a problem into multiple levels. At each level, it decomposes the original problem into a series of smaller sub-problems, creating a hierarchical model. This simplifies complex problems, making them more manageable. Each problem at each level can be represented using matrices, where the values in the matrix reflect the importance of each factor in relation to each sub-problem, i.e., their weightings. In AHP, each decision element is compared and evaluated against other elements through pairwise comparisons to determine their relative importance. Pairwise comparisons help establish the impact and priority of each factor by constructing pairwise comparison matrices. Each element in the matrix represents the weight ratio between a pair of factors. By calculating these ratios, the global weights can be determined, leading to the identification of the best solution. AHP offers several advantages compared to traditional methods. For instance, it breaks down complex problems into multiple levels, making decision-making more specific and manageable. It also allows for the consideration of multiple influencing factors, and the assignment of optimal decision solutions based on the importance of different factors.
In summary, AHP is a valuable method for understanding and solving complex problems, assisting in making the best decisions in multi-factor, multi-objective complex decision scenarios. It involves breaking down specific problems into different constituent factors and establishing a multi-level analytical structure model. This model comprises the goal level, factor level, and alternative level, and it aids in ranking the relative merits of alternatives based on the determined relative importance weights at the factor level. The specific implementation steps are as follows:
2.2.1 Build a Hierarchical Model
Certainly, here is the refined version of your text. Title: Hierarchical Structure for Decision-Making. Goal Level: The objective of the decision, i.e., to determine the optimal location for the substation. Criteria Level: Factors under consideration as decision criteria. climate, topography, soil characteristics, hydrogeological conditions, earthquake and fault zones. Alternatives Level: Potential decision alternatives:13 monitoring control points.
This hierarchical structure illustrates the decision-making process. The Goal Level represents the ultimate objective of selecting the best substation location. The Criteria Level outlines the factors or criteria influencing the decision, which include climate conditions, topography, geology, hydrogeology, and seismic considerations. The Alternatives Level lists the 13 monitoring control points, which are the potential decision alternatives. AHP can be applied to analyze and compare these alternatives, taking into account the relative importance of each criterion.
2.2.2 Construction of Judgment Matrices (Pairwise Comparison Matrices)
Construct judgment matrices for each factor within a layer of the hierarchical structure model. A judgment matrix represents the relative importance of all factors at this layer with respect to a factor from the layer above. The elements of the judgment matrix are assigned using a 1-9 scale method[12]. This scale method is used to evaluate the relative importance of the factors. The scale method for determining matrix elements is shown in Table 5.
Table 5. Nine-Level Scaling Method
Scale |
The Meaning of the Scale |
Indicates that two factors are equally important compared to each other |
|
Indicates that one factor is slightly more important than the other compared to two factors |
|
Indicates that one factor is significantly more important than the other compared to two factors |
|
Indicates that one factor is strongly more important than the other compared to two factors |
|
Indicates that one factor is extremely important compared to the other |
|
The median of the above two adjacent judgments |
|
reciprocal |
The judgment of factor I and J compared to A/J is the judgment of factor J compared with I |
Using the scale method described above, experts have scored the research area based on five aspects: climate conditions, topography, geological characteristics, hydrogeology, and seismicity and fault zones. The constructed judgment matrix is shown in Table 6.
Table 6. Judgment Matrix
|
Topography |
Soil Characteristics |
Hydrogeology |
Climate |
Earthquake and Fault Zones |
topography |
|||||
soil characteristics |
|||||
hydrogeology |
|||||
climate |
|||||
earthquake and fault zones |
2.2.3 Calculate and Sort the Weight Vector
Arithmetic averaging finds weight. First, normalize the judgment matrix, divide each element by the sum of the columns it is in.
|
Then sum the normalized columns.
|
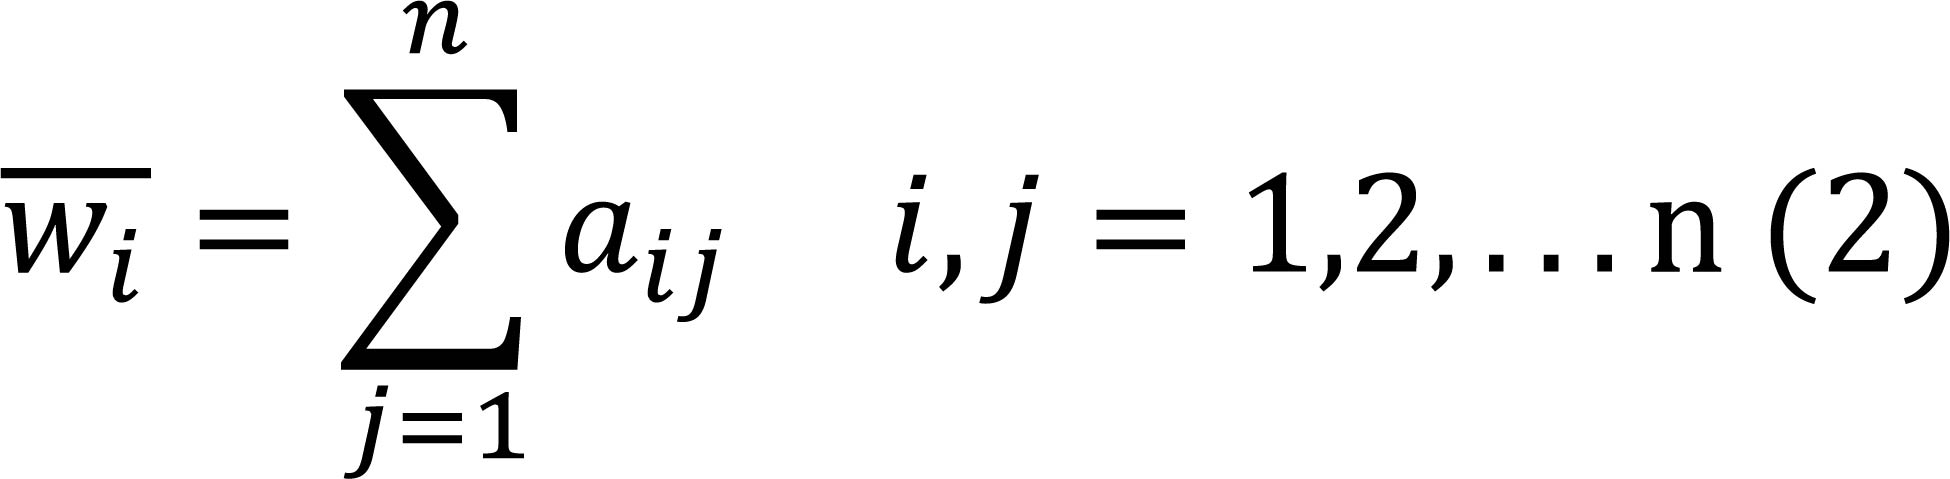
Finally, divide each element obtained by adding it by the sum of n to get the weight vector.
Suppose the judgment matrix is the following matrix A:
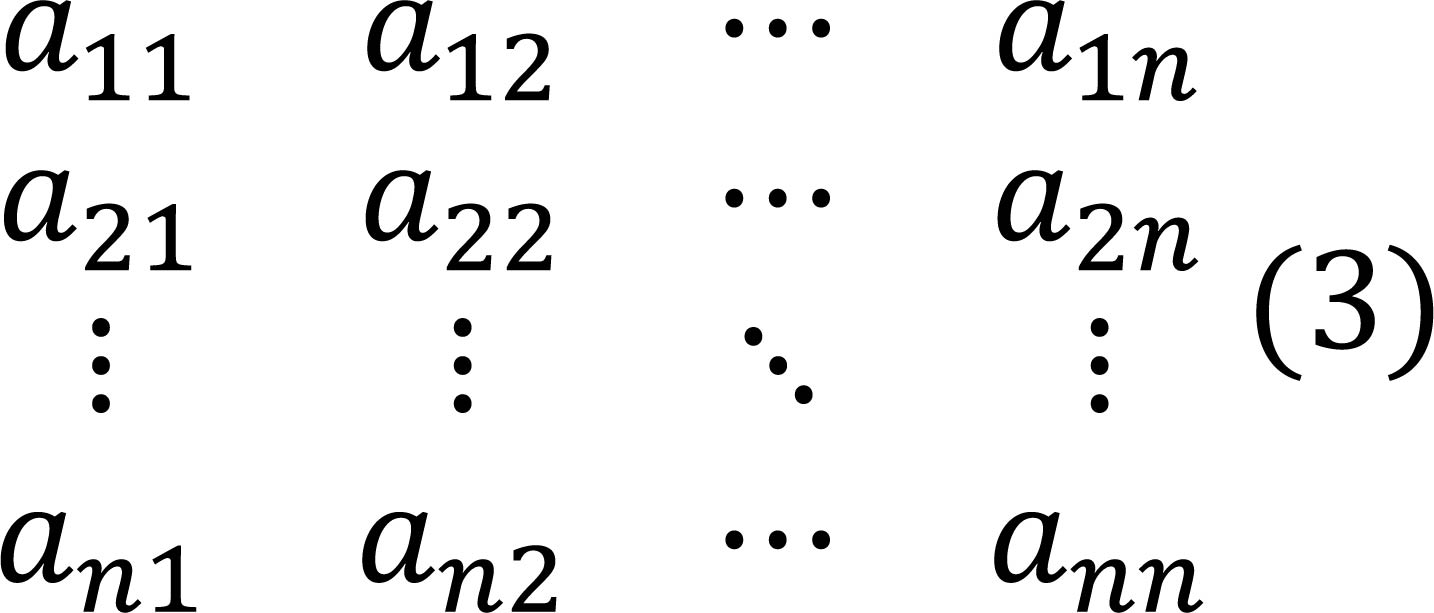
Then the weight vector obtained by arithmetic averaging is wi
|
The weight vector of each influencing factor on the transmission substation can be obtained from the judgment matrix, and the influence of each factor on site selection can be quantitatively understood. The results are shown in Table 7.
Table 7. The Weight Value of Each Attribute
Influencing Factors |
Topography |
Soil Characteristics |
Hydrogeology |
Climate |
Earthquake and Fault Zones |
weight |
0.1855 |
0.2108 |
0.0412 |
0.1101 |
0.4523 |
3 RESLUTS AND DISCUSSION
The weight values obtained by the analytic hierarchy method are multiplied to the original hole data values of each point for final scoring sorting to obtain the pros and cons of the measurement and control point area, and the results are shown in Table 8.
Table 8. Overall Ranking of Control Points
Number |
Climate (0.1101) |
Topography (0.1855) |
Soil Character-Istics (0.2108) |
Hydro-Geology (0.0412) |
Earthquake and Fault Zones (0.4523) |
Score |
Rank |
N00 |
3 |
3 |
5 |
6 |
1 |
2.6403 |
6 |
N01 |
3 |
3 |
1 |
6 |
1 |
1.7971 |
2 |
N04 |
3 |
6 |
3 |
5 |
1 |
2.734 |
7 |
N06 |
3 |
1 |
3 |
5 |
1 |
1.8065 |
3 |
N09 |
3 |
6 |
3 |
5 |
1 |
2.734 |
7 |
N14 |
3 |
2 |
1 |
5 |
1 |
1.5704 |
1 |
N17 |
3 |
2 |
1 |
5 |
2 |
2.0227 |
4 |
N19 |
3 |
5 |
6 |
5 |
2 |
3.6332 |
10 |
N21 |
3 |
5 |
4 |
5 |
2 |
3.2116 |
8 |
N23 |
3 |
4 |
2 |
4 |
2 |
2.5633 |
5 |
N25 |
3 |
6 |
6 |
4 |
2 |
3.7775 |
12 |
N30 |
3 |
3 |
6 |
4 |
3 |
3.6733 |
11 |
N33 |
3 |
7 |
2 |
4 |
3 |
3.5721 |
9 |
The scoring ranking results obtained by the weight values of each condition factor obtained by the analytic hierarchy method are shown in Table 8, and it can be intuitively seen that the best site selection result is the N14 region, and the influence value of all factors in this area is the smallest, followed by N01, N06, etc. The best site location is shown in Figure 3.
|
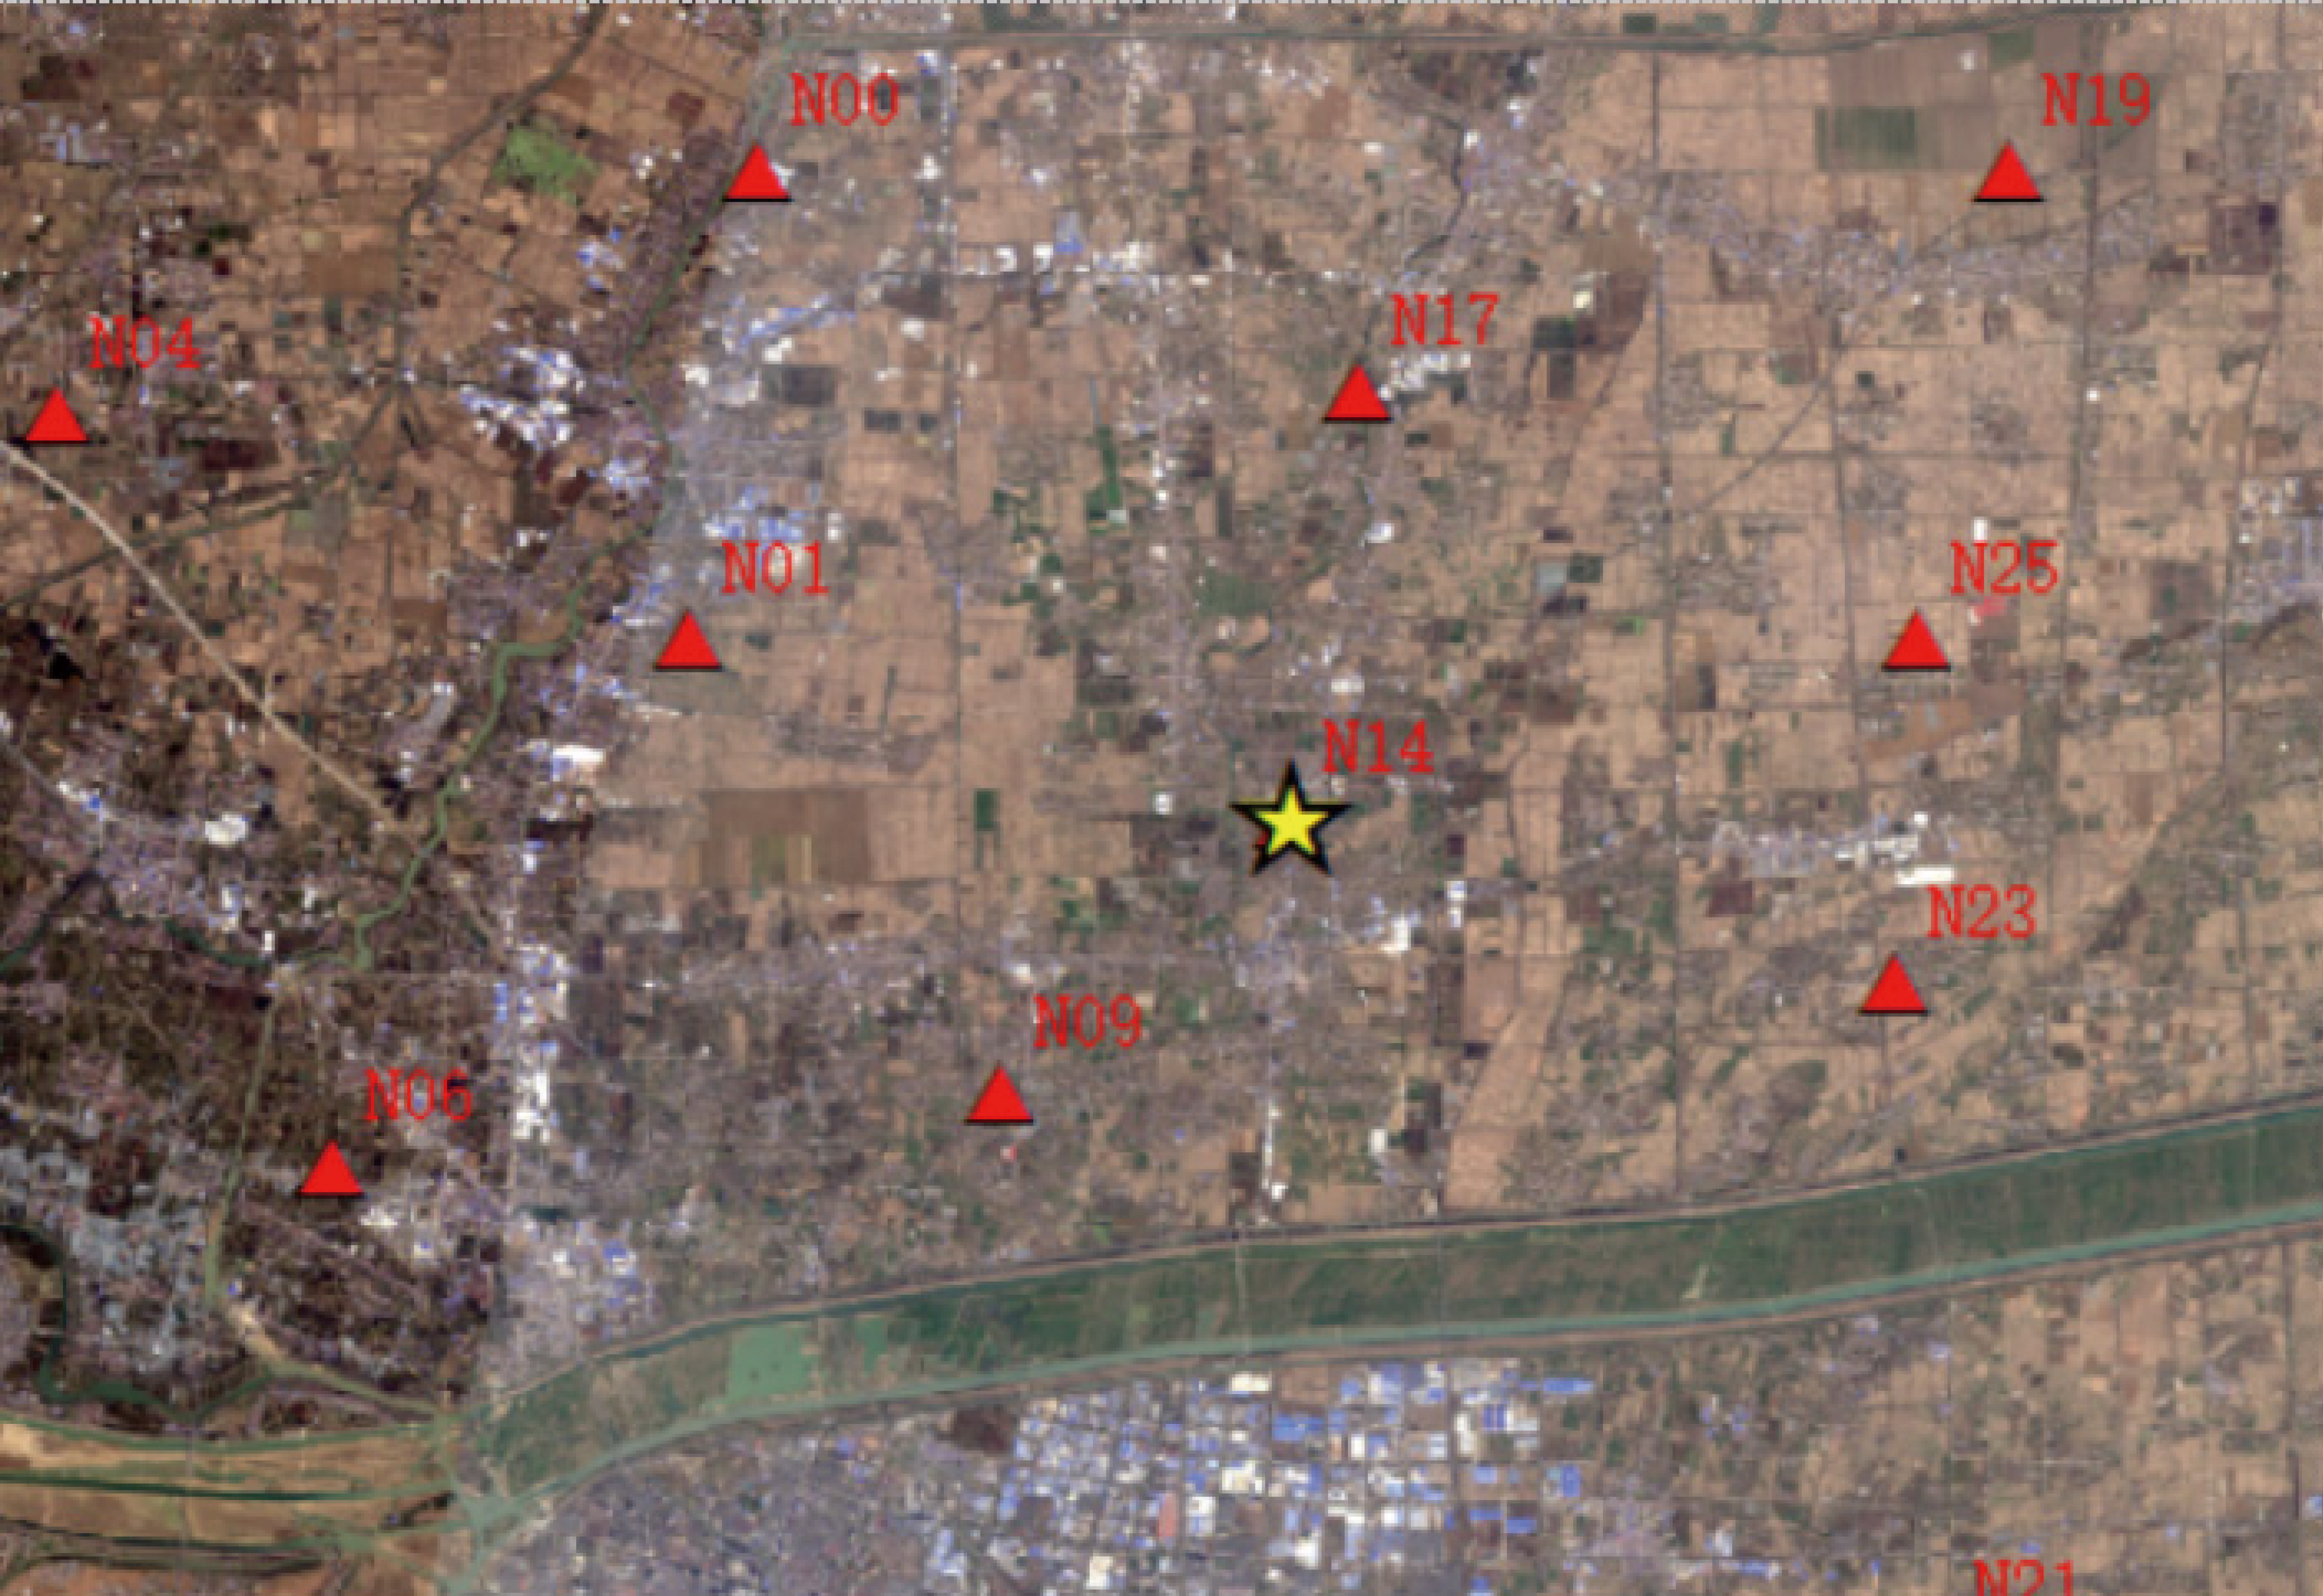
Figure 3. The best location—N14.
The scoring and ranking results, determined using the weight values for each condition factor obtained through AHP, are presented in Table 8. It is evident that the N14 region emerges as the best site selection, with the lowest overall influence value among all factors. This is followed by N01, N06, and so on. However, since the judgment matrix is subjectively assigned based on theoretical analysis, field investigation, and expert evaluation, some inconsistencies may be inevitable. Therefore, consistency testing is required.
Firstly, the approximate feature vector is multiplied by power to obtain the maximum feature root approximation λmax:
|
Second, calculate the consistency metric CI:
|
Then, since CI is not only related to the maximum feature root approximation, but also greatly affected by n, in order to avoid the situation that the greater the n, the worse the consistency, the average random consistency index RI and the random consistency ratio CR are introduced for correction.
|
In general, for a judgment matrix less than order 15, the average random consistency index RI can be found in Table 9[13].
Table 9. Average Stochastic Consistency Indicator RI Value of the 1~10th Order Matrix
N |
1 |
2 |
3 |
4 |
5 |
6 |
7 |
8 |
9 |
10 |
RI |
0 |
0 |
0.52 |
0.89 |
1.12 |
1.24 |
1.32 |
1.41 |
1.46 |
1.49 |
This study is a 5th-order judgment matrix, and the random consistency ratio CR≤0.1 is calculated, so the judgment matrix is constructed reasonably, the consistency passes, and the results are shown as correct index weighting and sorting[14].
4 CONCLUSION
The purpose of this study is to quickly and accurately select the best location for a transformer substation under the influence of multiple factors from various regions. The analysis involves examining the borehole data histograms and surrounding environmental data of 13 research areas in Suqian City, as well as the score table data of monitoring points within each research area. Taking into full consideration factors such as climate conditions, topography, geological characteristics, hydrogeology, seismicity, and fault zones, a specific hierarchical structure model was successfully constructed using an improved APH. This model allows for the creation of judgment matrices for all influencing factors and the calculation of reasonable weight values for each factor. Ultimately, it provides a ranking based on scores and identifies the optimal site, N14. A consistency test was conducted, confirming the accuracy of the results. This study holds significant practical and societal importance. Further research in this area will undoubtedly contribute even more to society.
Acknowledgements
The study was supported by Henan University of Technology for providing a good research platform.
Conflicts of Interest
The authors declared there is no conflict.
Author Contribution
Zhou H conducted data analysis and drafted the article, while Wang X provided research insights and supervised the work. The authors contributed to the writing of the article, and they all read and reviewed the manuscript for submission.
Abbreviation List
AHP, Analytic hierarchy process
References
[1] Yang L, Wang J, Duan J. Geometric method of substation positioning and power supply area division. J Zhengzhou Univ(Eng Sci), 2003; 4: 16-18.
[2] Wu L. Application of GIS in substation site planning. Hous Real Estate, 2019; 24: 254.
[3] Li X. Application of GIS technology in space site selection. Chang'an Univ, 2010.
[5] Wang X, Liu H, Wang R et al. Identification and prediction method of collapse (rolling stone) disaster of power transmission and transformation project in mountainous area. J Eng Geol, 2018; 26: 172-178.[DOI]
[6] Li C. Research on solar power station site selection based on multi-criteria decision-making. Guangxi Univ, 2023.
[7] Gu N, Gao J, Wang B et al. Ambient noise tomography of local shallow structure of the southern segment of Tanlu fault zone at Suqian, eastern China. Tectonophysics, 2022; 825.[DOI]
[8] Ye G, Liu C, Luo X et al. Dynamical significance of the Tanlu Fault Zone in the destruction of the North China Craton: The evidence provided by the three-dimensional Magnetotelluric array study. Tectonophysics, 2021; 813.[DOI]
[9] Peng P, Mitchell RN, Chen Y. Earth's one‐of‐a‐kind fault: The Tanlu fault. Terra Nova, 2022; 34.[DOI]
[11] Guo J, Wang Z, Qiao X et al. Research on automatic site selection method of substation based on multi-condition constraints. Geospatial Inf, 2020; 18: 37-40.
[12] Bai Y, Wang C, Du Q et al. Research on comprehensive evaluation system of substation site selection based on AHP-SVM. Jilin Elec Power, 2013; 41: 4-7.
[13] Hong Z, Li Y, Fan Z et al. Calculation of high-order average stochastic consistency index (RI) in analytic hierarchy method. Comput Eng Appl, 2002; 12: 45-47.
Copyright © 2024 The Author(s). This open-access article is licensed under a Creative Commons Attribution 4.0 International License (https://creativecommons.org/licenses/by/4.0), which permits unrestricted use, sharing, adaptation, distribution, and reproduction in any medium, provided the original work is properly cited.


