Remote Sensing Controlled System for the Aerobic Treatment of Home-produced Graywater
Kian Hariri Asli1*, Kaveh Hariri Asli2
1Department of Electronic Engineering, University of Rome “Tor Vergata”, Via Cracovia, Roma, Italy
2Department of Mechanical Engineering, Islamic Azad University Rasht Branch, Rasht, Gilan Province, Iran
*Corresponding to: Kian Hariri Asli, Department of Electronic Engineering, University of Rome “Tor Vergata”, Via Cracovia n.50–00133, Roma, Italy; E-mail: kian.haririasli@students.uniroma2.eu
DOI: 10.53964/jia.2024010
Abstract
Objective: The Remote Sensing (RS) technology has a significant impact on overcoming challenges of water and wastewater systems nowadays. This study aimed to introduce a new way for greywater treatment by air injection into a tank containing organic agents.
Methods: In the current study, home-produced wastewater from the kitchen, bathroom, and washing machine except from the toilet, was considered as graywater. Graywater (300mg/L of oxygen demand for 5 days, BOD5) was treated in an aerobic system controlled by RS, which consisted of sequencing batch reactors (SBR).
Results: The increased air volume injection into the SBR-containing graywater led to a decrease in influent pollution and an increase in treatment efficiency. The pollution decreasing percent was 0.12 and the treatment efficiency was increased to 95%.
Conclusion: The greywater irrigation is done underground and drip. As a result, with the increase in irrigation efficiency, the system becomes more economical. The advantages of the system are more apparent to consumers. In this context, it is better to conduct future research carried out by smart control systems, RS, networked sensors, modems, data loggers, IoT, and geodatabase intercommunication processes based on the GIS. The GIS can investigate the low water resources regions and dense population villages.
Keywords: graywater treatment, biological oxygen demand, remote sensing, closed loop control system (CLCS), geographic information system (GIS)
1 INTRODUCTION
Graywater is used for reuse in garden irrigation. Reusing graywater reduces the consumption of surface and groundwater. In the distant future, graywater will be a serious source of water. There are many advantages of using graywater. The use of graywater reduces drinking water consumption for non-drinking purposes, reduces costs, and increases water resources for agricultural purposes. Sewage treatment effluent depends on the degree of purification and national and international standards.
Graywater reuse systems includes low-cost manual methods and secondary treatment methods that can remove oil, fats, and solids. The simplest method of irrigation is manual irrigation, using graywater from the reservoir, with a bucket, trees, and plants in compliance with health and hygiene indicators are irrigated manually. This system includes one or more sedimentation tanks, which remove solid and oily substances and prepare graywater for irrigation. These systems are completely economical. They are easy to maintain and require little electricity and chemical agents to perform operations. The system uses a subsurface irrigation system due to light filtration. Secondary filtration systems remove more oil, grease, and solid particles than the primary filtration system. In this method, an underground irrigation system and a surface irrigation system can be used. This system is very expensive due to advanced filtration and at the same time, it has higher maintenance costs than the primary filtration system. However, the advantages of this system are easy surface irrigation and reduction of environmental risks.
A research[1] showed graywater can be used for various purposes such as irrigation of crops and greenhouses, underground water recharge, and industrial uses for cooling water. it can be used for steam boilers and industrial process water, in pool for sailing and swimming, breeding aquatic animals, drinking domestic and wild animals, urban fountain, firefighting, toilet siphon, air conditioning, and direct drinking use. The lack of conventional water resources, including underground sources has threatened sustainable development in the world. The goal of experts is to develop and manage water resources sustainably, providing reliable and provide water needs for current and future socities. A group of researchers[2] investigated the type of water consumption in developed countries. They showed that water consumption is proportional to the quality of water. For this purpose, drinking water requires high quality sources. These researchers also emphasized on the other uses including agriculture, industrial and urban uses, and lower-quality sources. The field investigations of other researchers[3] refered to the cultural use of wastewater. They showed that although the water crisis is understood by people, they are reluctant to use wastewater. These researchers consider factors such as danger, sense of unsafty. They announced the use of wastewater is a serious subject. For the use of wastewater in the agricultural sector, the important question is the quality of the wastewater and the type of use. The wastewater can be used with treatment standards and criteria for irrigation.
A group of researchers, through submerged porous diffusers and nozzles air was entered the aeration tank. Microorganisms by receiving air grow quickly. These researchers used the computational performance of numerical methods and Remote Sensing (RS) for modeling air diffusion in wastewater transient flow. The Oxygen diffusion in wastewater first was conducted by Union Carbide Corporation[4,5].
The first Remote Sensing (RS) and radio transmission in water treatment systems known as the “wireless telegraph” was produced on June 3, 1900, providing the necessary components for the development of the Internet of Things (IoT).
Kevin Ashton was the first to introduce the term IoT. Throughout the history of the IoT, the smart cities can be considered one of the biggest demands in the world of IoT. It was in 2012 that the Swiss Federal Energy Administration started a pilot program called Smart City, which attempted to use IoT technologies to control a city. Traffic monitoring, weather monitoring, smart transportation, and smart parking were among the important features of this city[6,7].
IoT and RS technology are continually evolving and is a hot research topic where opportunities are infinite. The number of devices availing internet services is increasing every day and having all of them connected by wire or wireless[8]. IoT, as you can guess by its name, is the approach of converging data obtained from different kinds of things to any virtual platform on existing Internet infrastructure[9]. The concept of IoT dates back to 1982[10]. Later, in 1991, a contemporary vision of IoT in the form of ubiquitous computing was first given by Weiser[11]. Kevin Ashton proposed the term “Internet of Things” to describe a system of interconnected devices[12]. The basic idea of IoT is to allow autonomous exchange of useful information between invisibly embedded different uniquely identifiable real world devices around us, fueled by the leading technologies like radio-frequency identification (RFID), wireless sensor networks (WSNs) and RS which are sensed by the sensor devices and further processed for decision making, on the basis of which an automated action is performed[13].
Wireless Sensors Network technology and RFID technology when combined together opens up possibilities for even more smart devices, for which a number of solutions have been proposed. An example solution is provided by the Intel Research Labs in the form of Wireless Identification Sensing Platform (WISP)[14]. WISP is a passive wireless sensor network with built-in light, temperature and many other sensors[15]. most of the WSNs specifies the Physical and MAC layer of Low Rate Wireless Personal Area Networks (LR-WPANs)[16,17]. The sensors will be able to measure the light, humidity, temperature, moisture, and as well as it will irrigate the plants with graywater according to their needs[18].
The design of weak and underdeveloped graywater systems causes soil to stick together and produce odors, and at the same time increases financial and time maintenance costs. To use graywater and preserve underground and surface water sources better and safer, reliable. It means to reuse graywater in rural and urban areas should be applied[19,20]. It includes setting minimum standards to design, install, and obtain legal permits. It provides protecting communities from the risk of disease transmission from the graywater reuse system and ensuring the correct installation of the system. The reuse of graywater helps the environment by reducing water demand. However, the reuse of graywater is only one part of the approach to adopting a rational approach to protect water resources. Also, before using the use of graywater water-saving methods should be considered. To preserve drinking water, and ensure the produced graywater does not exceed the capacity of the installed system[21-24].
In this work, the design of the smart reuse graywater system for the irrigation system was evaluated. This work presented a new way for graywater treatment by air injection into a tank containing organic agents. This system was controlled by RS.
2 METHODS
In this work, the graywater was poured into the collection tank after leaving the building through the collection network. The tank was installed near the building or the irrigation area. The tank was durable, rustproof, corrosion-resistant, made of solid material. It was equipped with ventilation system. It was placed in a dry and flat area on a 3-inch-thick cement layer with compacted soil in the base. In addition, on the tank was printed its capacity and a warning label indicating “graywater irrigation system, danger, and non-drinkable”. The excess of poured graywater from the collection tank returned to the system through pipes. The air volume (m³) and efficiency (%) of graywater treatment were measured[25-28].
The air with 2 bar pressure was introduced into the 50L sequencing batch reactors (SBR) containing the greywater. The average amount of influent. The research focused on the pollution decreasing to 20mg/L for biochemical oxygen demand for 5 days (BOD5).
A collection tank temporarily holded a large amount of graywater. The filter was used to remove the particles that cause clogging in the irrigation system. The pump was used to transfer water from the collection tank to the irrigation system. The irrigation system was made for irrigating plants with graywater. The easy installation of collection system equipment depended on the foundation of the building. Generaly, If the foundation of the building is a slab type, it is very difficult and expensive to pass the pipes through it.
In the case of the present work, the more graywater was collected. It should be noted that a warning label should be installed on all graywater collection devices the system was separated from the water supply system with a certain color. The time to install the graywater collection system was during the construction of the building[29,30].
The plants and trees were at a lower height than the building in the present work. The graywater irrigation system distributed the water to the plants by gravity. Otherwise, a low capacity pump was installed for the graywater irrigation system.
2.1 Graywater Aerobic Treatment
A Sequencing Batch Reactors (SBR) aerobic system was assessed for graywater reuse through RS; the SBR contained microorganisms and their action to produce reuse water was investigated (Figure 1).
|
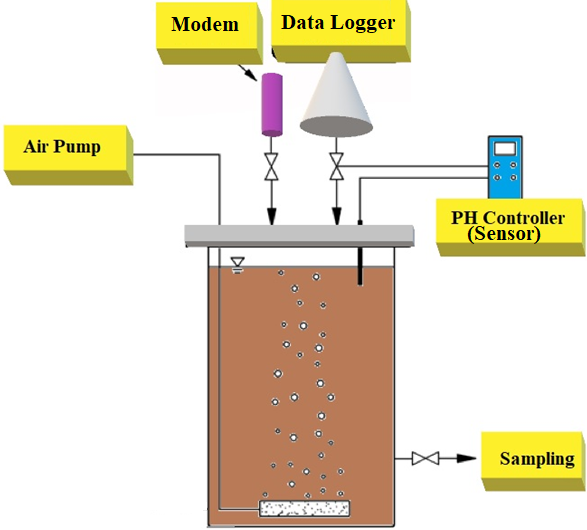
Figure 1. Aerobic reactor for the treatment of graywater containing microorganisms.
2.2 Sequencing Batch Reactor (SBR)
The aeration process provided a water and air mixture to remove dissolved gases and oxidize dissolved metals such as iron, hydrogen sulphur, and organic compounds. In this work, the aeration process was investigated for the treatment of graywater. In the aeration process, an appropriately distributed air pump was used for graywater treatment and microbiological development. The air and water contacted together and the condition of interaction between them determines the efficacy of aeration. Bubble sizing or air bubble sizing was assumed the main factor in the efficacy of aeration. During the aeration procedure through the relief nozzles, the dissolved gases were released from the SBR tank.
2.3 SBR Research Tools and Softwares
The SBR of the smart graywater reuse system was connected by an outlet pipe to the main reservoir, which was equipped with RS, sensors, a modem, a data logger, and a geodatabase intercommunication process. The specialist “Pressure View” analysis software (SewerCAD 8.11, 2023, Bentley) used for the SBR can window down to one sample. The analogue sensor input was coupled with a quick fit connector (0-35 bar and ±0.25% accuracy) that recorded up to 8,000,000 readings. The logging memory was programmed to read continuously (cyclic mode), and for some features, at a specific time (block). The frequency of the samples per second was 1, 5, 10, 20, and 25. Logger ID had up to 8 alphanumeric characters.
2.4 Formulation
The enrichment of microorganisms from graywater was carried out. After the mentioned systems were set up and adapted to desired conditions, the effect on the amount of biochemical oxygen demand for 5 days (BOD5) was investigated after adjusting different parameters in the system. Microorganisms’ activity results in O2 consumption and CO2 release in an SBR system. The Equations (1-7) correspond to an anaerobic-aerobic activated sludge system and aeration tank.
|
where: V, Aeration Tank volume (m3); LO, Total influent pollution (kg – BOD5); BV, Tank volume rate (kg – BOD5/m3·day)
|
where: BV, Volume rate (kg – BOD5/m3.day); MLSS, Mixed liquor suspended solids (kg); MLVSS, Mixed liquor volatile suspended solids (kg – BOD5/day)
|
where: V, Aeration Tank volume (m3); Rt, Detention time (h); Q, Influent flow rate (m3/h)
The microorganisms feed either by organic material in wastewater or other microorganisms. In balancing conditions, the high return sludge and high MLSS are derived. The ratio of RS per max influent becomes 100% and can be achieved from Equation (4):
|
When the Sludge volume index (S.V.I.) becomes more than 200, there appears a problem in the treatment process because fails the sedimentation. Decreasing the S.V.I. decreases the aeration time. The amount of surplus sludge that must be removed from the settling tank is related to BOD5 of the influent to the aeration tank and settling tank outputs.
|
A portion of absorbed pure oxygen spent informs of energy consumption and multiplying of bacteria. The other part of O2 is spent for the oxidation of organic carbonate and organic nitrogenous material.
|
2.5. Statistical Analyses
The regression analysis was included the scatter diagram and curve fitting for the air volume (m³) injection to the SBR tank. The efficiency (%) of pollution (g BOD/day) decreasing in tapered aeration of graywater treatment showed a good correlation between the data of the dependent variables and the independent variable.
Y=f(y)
In the first case:
Dependent variable (y): Efficiency (%)
Independent variable (x): Air volume (m3)
In the second case:
Dependent variable (y): Efficiency (%)
Independent variable (x): pollution (gBOD/day)
3 RESULTS AND DISCUSSION
3.1 The Pollution Decreasing Calculation
In this work, 2 bar pressure air was introduced into the 50L SBR tank of graywater. By submerged porous diffusers and by nozzles, air was entered into the aeration tank. Then microorganisms by receiving air grew quickly. Max influent factor was 1.71 (per 14 hours); BOD5 was 60 g/person-day; Wastewater temperature was 20◦C; Influent production per person=150L/d.
The research approach focused on the pollution decreasing to 20 mg/L for BOD5.
The Max influent Qdm =20mg/L×40=8m3/d =0.16L/sec
The total amount of Influent pollution=2.4kg/p-day
Average amount of influent pollution= 2.4 /8=0.3kg/m3=300mg/L
Rt= V/Q = Tank Volume / influent flow rate, Rt=50/2.4=20.83h
Pollution decreasing percent =2.4/20=0.12
Average amount of influent pollution: (Per24 hours) =0.264×8=4.22kg BOD/d
The miscible wastewater interpenetration with air happens when they move themselves in the SBR aeration tank. In this work, fluid parameters including velocity, pressure, temperature, and the other properties in the SBR aeration tank were homogeneous. The changes in the behavior of the wastewater fluids flow and its effect on pure Oxygen penetration in wastewater flow were investigated.
Aeration Tank Volume=50m3
Detention time: Rt =V/Q=50/12=17h
Theoretical required volume: V=Lo/BV =2.4/0.5=4.8m3
Theoretical detention time: Rt =V/Q=4.8/12=0.4h
The curves of pollution, air volume and air volume efficiency (Figures 2-4) that in the graywater treatment process, the increase in air volume led to a decrease in influent pollution and an increase in treatment efficiency (Tables 1-3).
|
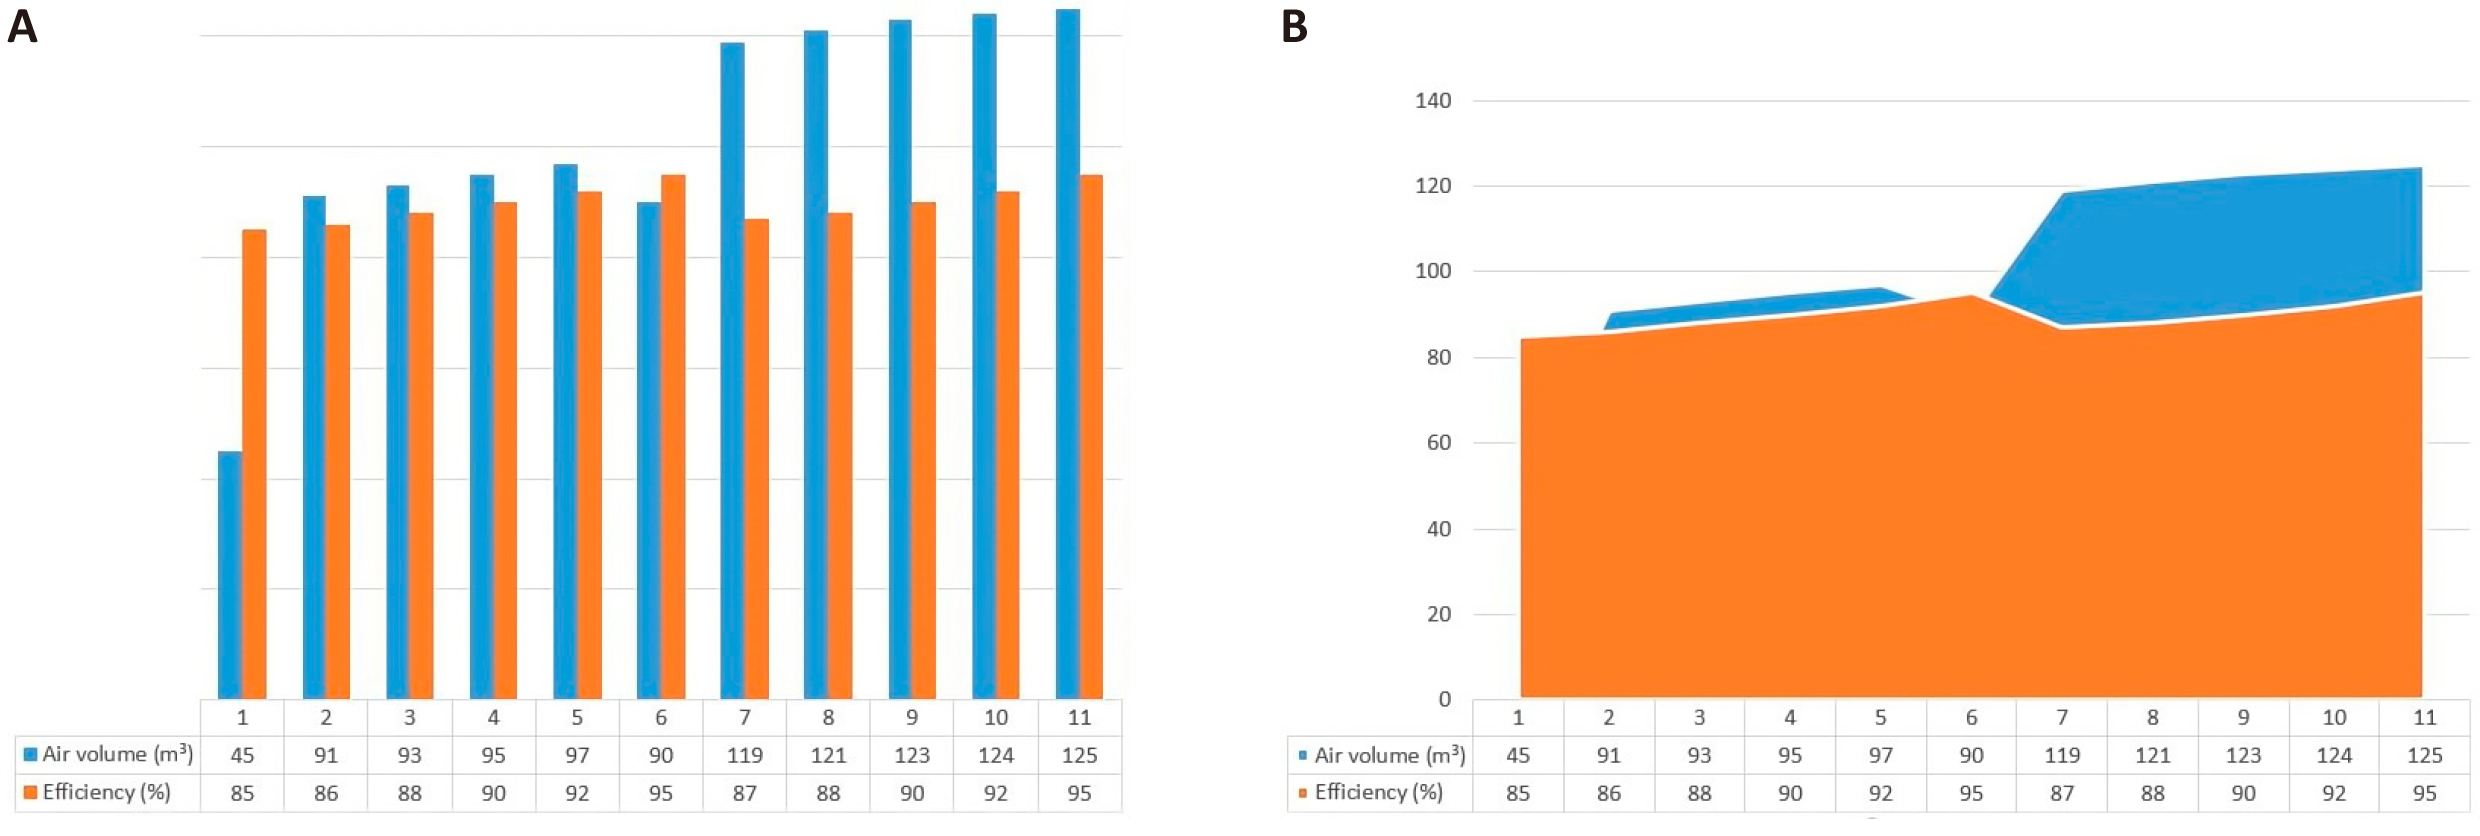
Figure 2. Variatoin of air volume (m³) and efficiency (%)/Pollution (gBOD/day) in greywater treatment. A: Scatter diagram for air volume (m³) and efficiency (%) of graywater treatment; B: Scatter diagram for air volume (m³) and Pollution (gBOD/day) of graywater treatment.
|
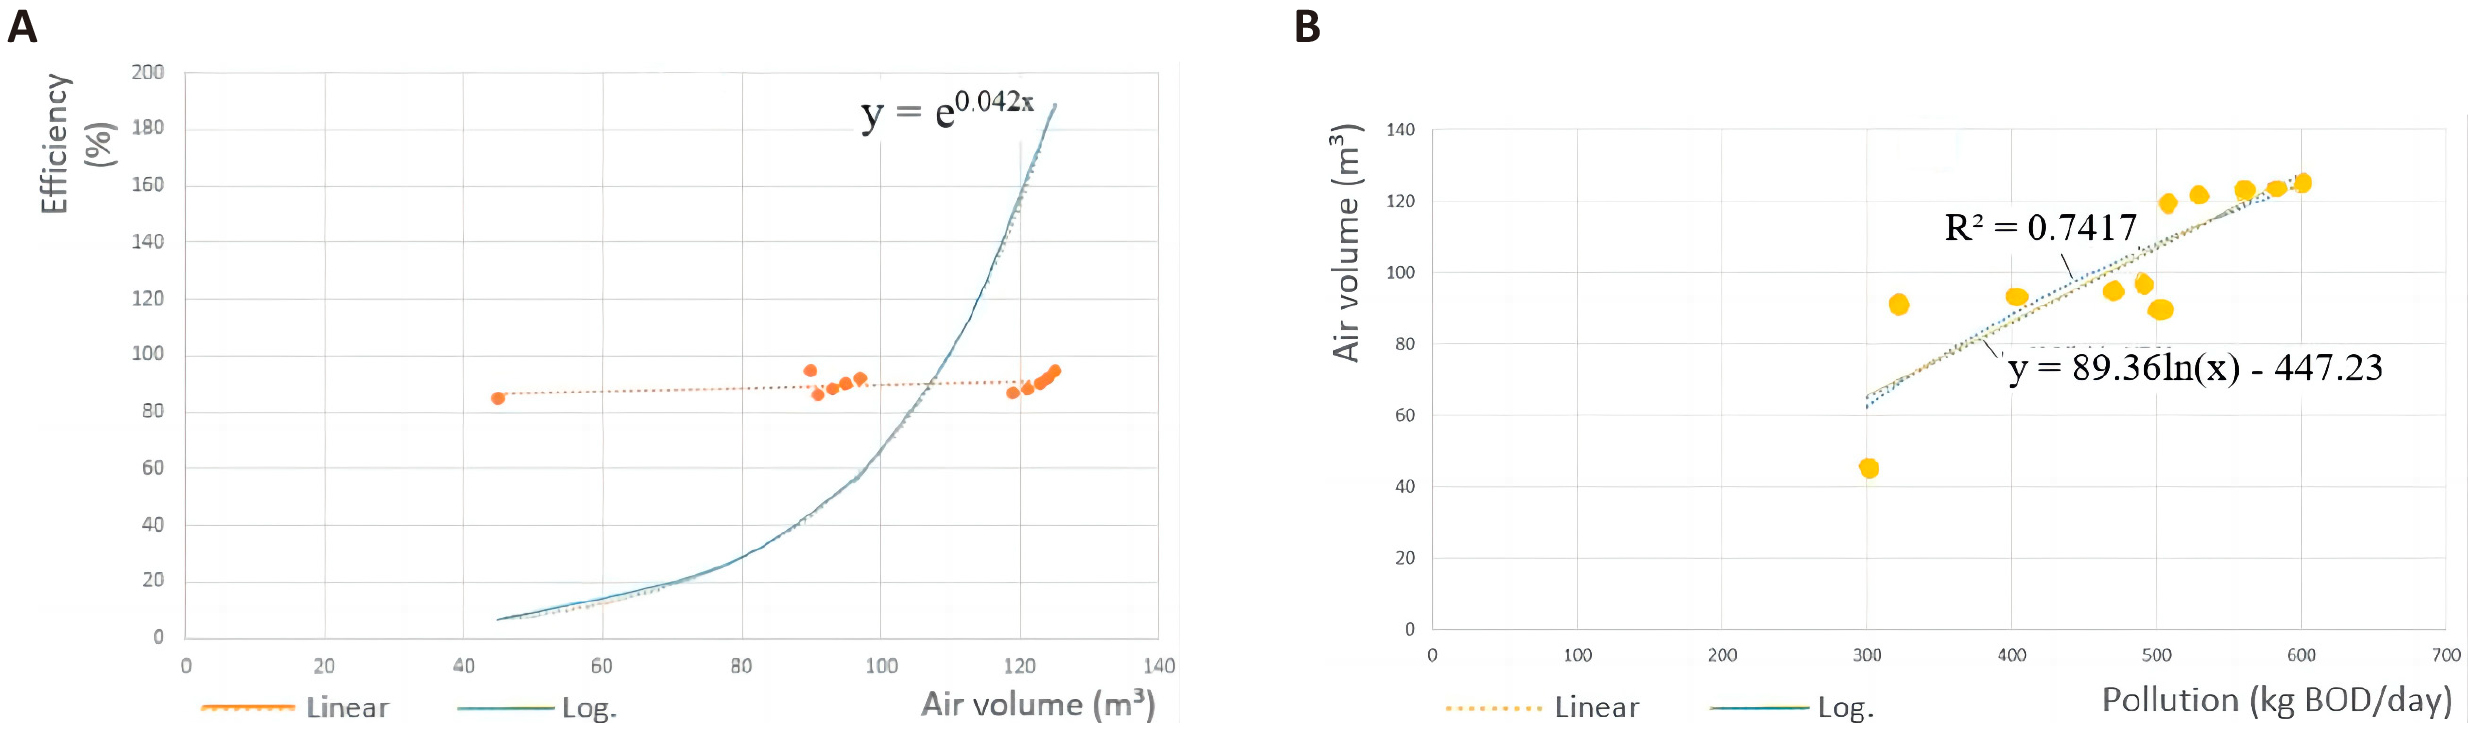
Figure 3. Charts for air volume (m³) and efficiency (%) of graywater treatment. A: Bar chart; B: 3D chart.
|
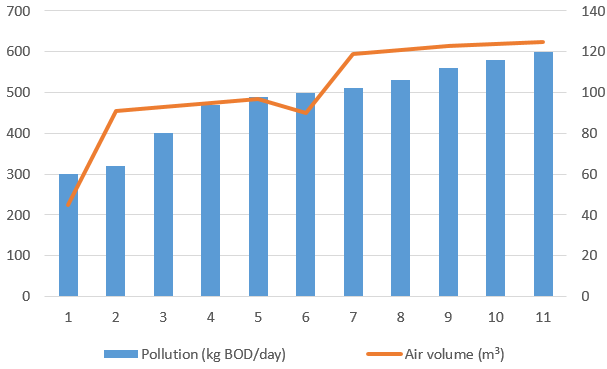
Figure 4. The graywater irrigation system distribution.
Table 1. The List of Calculation Results
Parameters |
Calculation Value |
The Max influent |
0.16L/sec |
Total (average) amount of influent pollution |
2.4kg/p-d |
Pollution decreasing per cent (amount) |
0.12 |
Detention time |
17h |
Theoretical required volume |
4.8m3 |
Theoretical detention time |
0.4h |
Table 2. Comparison of Different Methods for Wastewater Treatment
Method |
Pollution (kg BOD/day) |
Sludge |
Solid Weight |
Return Sludge |
Air Volume (m³) |
Efficiency (%) |
Extended Aeration |
0.1-0.4 |
0.5-0.15 |
3-6 |
50-150 |
90-125 |
75 -95 |
Conventional |
0.3-0.6 |
0.2-0.4 |
1.5-3 |
15-50 |
45-90 |
85 -95 |
Tapered Aeration |
0.3-0.6 |
0.2-0.4 |
1.5-3 |
15-50 |
45-90 |
85 -95 |
Step Aeration |
0.6-1 |
0.2-0.4 |
2-3.5 |
20–75 |
45-90 |
85 -95 |
Contact Stabilization A.S. |
0-0.2 |
0.2-0.4 |
2-5 |
25-100 |
45-90 |
80 -90 |
Two stages |
1.6-6 |
0.4-1.5 |
3-6 |
100-500 |
25-90 |
75 -90 |
Table 3. Tapered Aeration of Greywater Treatment
Pollution (gBOD/day) |
Air volume (m³) |
Efficiency (%) |
300 |
45 |
85 |
320 |
91 |
86 |
400 |
93 |
88 |
470 |
95 |
90 |
490 |
97 |
92 |
500 |
90 |
95 |
510 |
119 |
87 |
530 |
121 |
88 |
560 |
123 |
90 |
580 |
124 |
92 |
600 |
125 |
95 |
Air was diffused in the activated sludge wastewater treatment process into the aeration tank. This method needed low detention time and low structural space for wastewater treatment plants. In model studies of prototype problems, the similarity law for flow in pumping is generally valid for one-phase flow.
3.2. The Greywater Pollution Decreased in the Aerobic SBR Tank
In the first case, the dependent variable was efficiency, and the independent variable was air volume (Figure 2A). The exponential Equation (8) adequately correlated because the efficiency (%) of pollution (gBOD/day) and the air volume (m³) injection into the aerobic SBR tank decreased in the greywater tapered aeration method applied in the current study (Figure 2A, Table 2).
|
Similarly, the logarithmic Equation (9) adequately correlated because the air volume (m³) injection into the aerobic SBR tank and the pollution (gBOD/day) decreased in the graywater tapered aeration treatment (Figure 2B, Table 3).
|
To test the pressure control system, a pressure relief valve was installed in the area, and consumption was regulated using pressure control. Tables 1 and 2 show the changes in the flow rate entering the network before and after the operation of the pressure control project, as measured by the remote reading flowmeters, in terms of volume and percentage of water saved.
3.3. The Pollution Was Decreased by the Increase in Graywater Treatment Efficiency
In the current study, the high-speed treatment of the wastewater fluids was achieved as a combination of the diffusing process and the remixing process. As the injection of air volume increased into the SBR system, the efficiency (%) of graywater treatment was differently affected (Figure 3), and the pollution decreased (represented as BOD5) and the pollution decreasing to 20 mg/L for BOD5 (Figure 4).
3.4 Pump and Greywater
The suitable pump was chosen based on the required head, distance of the farthest point from the tank to be irrigated, and maximum production of greywater discharge, according to Asli et al. (2021)[31].
4 DISCUSSION
The present work, was carried out using remote sensing as a smart control system, together with networked sensors, modem, and data logger based on the geographic information system (GIS). The GIS can detect regions with low water resources, villages with dense populations. The GIS find the regions with both dense populations and low water resources, which makes possible the reuse of wastewater by remote sensing. The implementation of remote sensing and GIS together allows for querying and intercommunicating big data. The GIS can deliver results of overlapping big data up to seconds for analysis and make decisions to investigate the low water resources regions[31].
Graywater underground irrigation was used to prevent water loss through wind, evaporation, and runoff. This strategy was designed to reduce human contact and associated risks to public health. In this work, the soil structure was strengthened by adding suitable soils, allowing graywater to remain in the plant roots with the concrete base. Underground drip irrigation and tiny filters were considered while watering plants with graywater[32].
4.1 Graywater Reuse Control System
In the present work for the wastewater reuse system control, the data collected by the sensors coincided with the set control parameters. The air pump was turned on and off at the appropriate times. The influent flow rate of wastewater and air injection flow rate was regulated by the operation of the actuator and solenoid valve on pumps. The irrigation rate through graywater was controlled by a BOD meter and PH controller both installed on the discharge line of SBR (Figure 5).
|
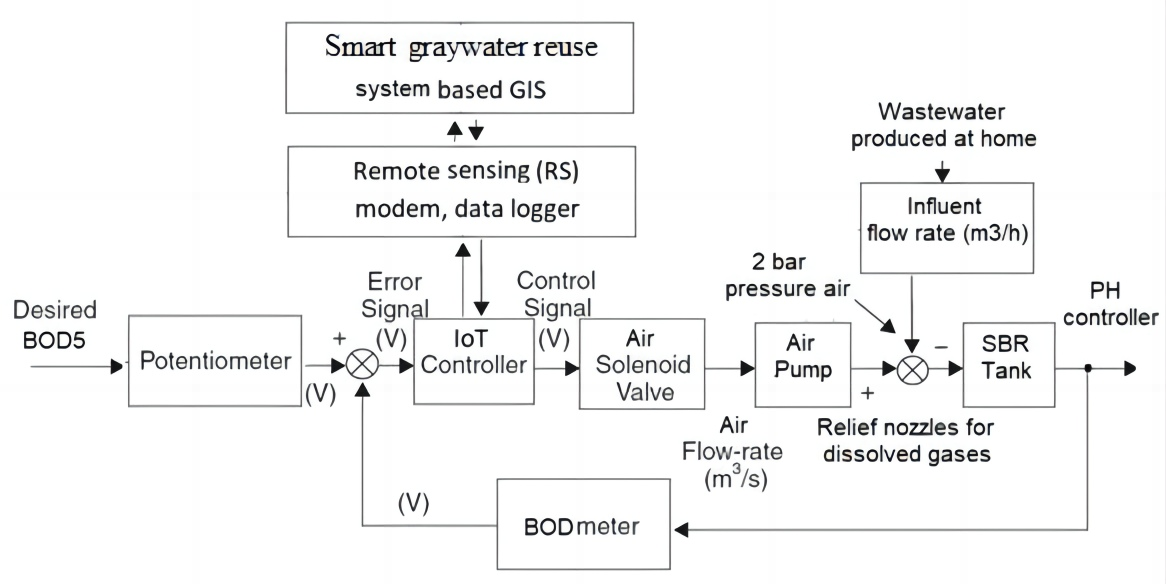
Figure 5. Closed loop control system (CLCS) for graywater reuse through remote sensing.
The GIS-compliant work that Akbari et al.[33] carried out revealed that providing decision-makers with a wealth of information allows them to make more effective decisions in any situation, such as traffic restrictions, warning vulnerable people about hazardous times and locations, and protecting public health. Based on the recommended system’s framework[34].
Honarbakhsh et al.[34] used a GIS-based approach with the GWQI to analyze groundwater quality in Marvdasht, a city located in the semi-arid region of Iran during 2010–2015. The results of the present work showed that despite the high concentration of indicator microorganisms in the wastewater, a low concentration of pathogens was found in the wastewater. This may be due to the removal of this microorganism during the wastewater treatment process. There are several cases where pathogens have been present in reclaimed water distribution systems in the absence of indicator organisms[35]. Jjemba et al.[36] investigated the effect of residence time of reclaimed water in distribution systems on water microbial quality over a 15-month period at two wastewater reclamation facilities in southern Arizona. The results of their study showed that pathogens existed alternately in both systems[35]. The results of Jjemba et al.’s study[36] on the regrowth of pathogens in reclaimed water distribution systems were also similar to the results of Ajibode et al.’s study[35]. They suggested the need to develop better management operations of reclaimed water to control bacterial regrowth and reduce water quality before consumption and develop new indicators of water-based pathogens[36].
The results of Blanky et al.’s study[37] showed that the concentration of pathogens in graywater samples decreased in summer. They attributed the seasonal changes in concentration to increased competition between bacteria during hot seasons. The results showed that reducing the frequency of detection of pathogens in sewage in the summer, a period when irrigation is widely carried out, makes the reuse of treated sewage relatively safe for irrigation.
5 CONCLUSION
The reuse of graywater helps the environment's sustainable development. However, the reuse of graywater is only one part of the approach to adopting a rational approach to protect water resources. The important aim of this work was to decrease pollution due to wastewater by RS, sensors, modem, data logger, and geodatabase intercommunication for reuse of the graywater process. The results showed the pollution decreasing to 20mg/L for BOD5. More air volume (m³) injection into the SBR system led to more reduction of pollution (g BOD/day) through the graywater reuse process. More air volume (m³) injection into the SBR system also led to more efficiency in the graywater reuse process. The outputs, applications, and main topics in the findings of this work were as follows:
(1) the graywater reuse is the cheapest method, and was recommended in low-water areas.
(2) According to the type of village, graywater can be used. In sparsely populated villages, graywater can be easily purified in each house using a plastic barrel. Filtered graywater is used to irrigate the garden of that house. In densely populated villages, by collecting graywater from houses and purifying it, it can be used to irrigate gardens.
(3) There is no need for complex and expensive systems to treat greywater. SH2 gas is produced very little in the graywater collection pipes, as a result of the use of graywater. When using graywater, due to the low concentration of organic substances, the pipes do not get clogged. The graywater reuse system can be smartly corroded by RS, sensors, modem, and data logger.
The practical implications of wastewater interpenetration with air may be a problems. When pump stations operate in the zone of cavitation, air bubbles or oxygen will flow through the pump resulting in a two-phase flow downstream of the fluid system. Though aeration devices may be used to minimize the air content, some air will remain in the fluid system. Since it is almost impossible to predict the quantity of air getting through the pump and remaining downstream of the system, systematic analysis has to be carried out. Due to study limitations and environmental considerations, graywater irrigation is done underground and drip. As a result, with the increase in irrigation efficiency, the system becomes more economical. The advantages of the system are more apparent to consumers. In this context, it is better to conduct future research carried out by smart control systems, RS, networked sensors, modems, data loggers, IoT, and geodatabase intercommunication processes based on the GIS. The GIS can investigate the low water resources regions and dense population villages. It needs a special hardware infrastructure to work perpetually online, which for the entire villages, has been proposed to be established in future.
Acknowledgements
The authors thank all specialists for their valuable observations and advice, and the referees for recommendations that improved the quality of this paper.
Conflicts of Interest
The authors declared there is no conflict.
Author Contribution
The authors were involved in conceiving the presented idea, developing the theory, performing the computations, verifying the analytical methods, discussing the results, and contributing to the final manuscript.
Abbreviation List
BOD5, Biochemical oxygen demand for 5 days
RFID, Radio-frequency identification
RS, Remote sensing
SBR, Sequencing batch reactor
WISP, Wireless identification sensing platform
WSN, Wireless sensor networks
References
[1] Asano T. Water from Wastewater, The Dependable Water Resource (The 2001 Stockholm Water Prize Laureate Lecture). Water Sci Technol, 2002; 45: 23-33.[DOI]
[2] Asli KH, Asli KH. Smart Water System and Internet of Things. J Mod Ind Manuf, 2023; 2: 5.[DOI]
[3] Salehi S, Talebi Somehsaraee M. Qualitative Analysis of Social-Cultural Barriers of Using Recycled Water. Water Reuse, 2015; 1: 67-77.
[4] Magnuson M, Ernst H, Griggs J et al. Analysis of environmental contamination resulting from catastrophic incidents: Part 1. Building and sustaining capacity in laboratory networks. Environ Int, 2014; 72: 83-89.[DOI]
[5] Molinos-Senante M, Gómez T, Garrido-Baserba M et al. Assessing the sustainability of small wastewater treatment systems: A composite indicator approach. Sci Total Environ, 2014; 497: 607-617.[DOI]
[6] Asli KH et al. eds. Advances in control and automation of water systems. CRC Press, 2012.[DOI]
[7] Khan R, Khan SU, Zaheer R et al. Future internet: the internet of things architecture, possible applications and key challenges//2012 10th international conference on frontiers of information technology. IEEE, 2012: 257-260.[DOI]
[8] Shen G, Liu B. The visions, technologies, applications and security issues of Internet of Things//2011 International conference on E-Business and E-Government (ICEE). IEEE, 2011: 1-4.[DOI]
[9] Zeng L. A security framework for internet of things based on 4G communication//Proceedings of 2012 2nd International Conference on Computer Science and Network Technology. IEEE, 2012: 1715-1718.[DOI]
[10] Zhou W et al. The effect of IoT new features on security and privacy: New threats, existing solutions, and challenges yet to be solved. IEEE Internet Things, 2019; 6: 1606-1616.[DOI]
[11] Weiser M. The Computer for the 21st Century. Scientific american, 1991; 265: 94-105.
[12] Zhang ZK, Cho MCY, Wang CW et al. IoT Security: Ongoing Challenges and Research Opportunities. 2014 IEEE 7th International Conference on Service-Oriented Computing and Applications.
[13] Alfandi O, Hasan M, Balbahaith Z. Assessment and Hardening of IoT Development Boards. In Wired/Wireless Internet Communications: 17th IFIP WG 6.2 International Conference, WWIC 2019, Bologna, Italy, June 17–18, 2019.
[14] Asli HH, Pourhashemi A, Abraham AR et al. New Advances in Materials Technologies: Experimental Characterizations, Theoretical Modeling, and Field Practices. Apple Academic Press: New Jersey, USA, 2023. Available at:[Web]
[15] Munguia Tapia E, Intille SS, Larson K. Portable wireless sensors for object usage sensing in the home: Challenges and practicalities//Ambient Intelligence: European Conference, AmI 2007, Darmstadt, Germany, November 7-10, 2007. Proceedings. Springer Berlin Heidelberg, 2007: 19-37.[DOI]
[16] IEEE 802.15 WPAN Task Group 4. Accessed at:[DOI]
[17] Montenegro G, Kushalnagar N, Hui J et al. Transmission of IPv6 packets over IEEE 802.15. 4 networks. 2007.
[18] Roman R, Alcaraz C, Lopez J et al. Key management systems for sensor networks in the context of the Internet of Things.Comput Electr Eng, 2011; 37: 147-159.[DOI]
[19] Offermans A, Haasnoot M, Valkering P. A method to explore social response for sustainable water management strategies under changing conditions. Sustain Dev, 2011; 19: 312-324.[DOI]
[20] Ann Rose Abraham, Heru Susanto AK, Haghi et al. Sustainability in Energy and Environment Engineered Materials and Smart Computational Techniques, 2024. Hard ISBN: 9781774916209 , Apple Academic Press.
[21] Olyaei MA, Karamouz M, Farmani R. Framework for assessing flood reliability and resilience of wastewater treatment plants. J Environ Eng, 2018; 144: 04018081.[DOI]
[22] Rehan R, Knight MA, Unger AJA et al. Financially sustainable management strategies for urban wastewater collection infrastructure–development of a system dynamics model. Tunn Undergr Sp Tech, 2014; 39: 116-129.[DOI]
[23] Feizbahr M, Tonekaboni N, Jiang GJ et al. Optimized vegetation density to dissipate energy of flood flow in open canals. Math Probl Eng, 2021; 2021: 1-18.[DOI]
[24] Sadr SMK, Casal-Campos A, Fu G et al. Strategic planning of the integrated urban wastewater system using adaptation pathways. Water Res, 2020; 182: 116013.[DOI]
[25] Schoen M, Hawkins T, Xue X et al. Technologic resilience assessment of coastal community water and wastewater service options. Sustain Water Qual Ecol, 2015; 6: 75-87.[DOI]
[26] Asli KH, Haghi AK, Asli HH et al. Water hammer modelling and simulation by GIS. Mod Simul Eng, 2012: 15.[DOI]
[27] Asli HH, Arabani M. Analysis of Strain and Failure of Asphalt Pavement. Comput Res Prog Appl Sci Eng, 2022; 8(01).[DOI]
[28] Sun Y, Garrido-Baserba M, Molinos-Senante M et al. A composite indicator approach to assess the sustainability and resilience of wastewater management alternatives. Sci Total Environ, 2020; 725: 138286.[DOI]
[29] Asli HH, Hozouri A. Non-Revenue Water (NRW) and 3d hierarchical model for landslide. LARHYSS J, 2021; 48: 189-210.
[30] Turková J, Korytárová J. Methods for evaluation of WWTPs environmental impacts: a review//IOP Conference Series: Earth and Environmental Science. IOP Publishing, 2019; 222: 012004.[DOI]
[31] Asli HH, Nazari S. Water Age and Leakage In Reservoirs; Some Computational Aspects And Practical Hints. Larhyss J, 2021; 48: 151-167.
[32] Nikookar M, Brake NA, Asli HH et al. Durability, workability, and setting time of cementitious systems containing chloride-rich oil and gas production wastewater. Constr Build Mater, 2023; 403: 132862.[DOI]
[33] Akbari M, Zahmatkesh H, Eftekhari M. A GIS-Based System for Real-Time Air Pollution Monitoring and Alerting Based on OGC Sensors Web Enablement Standards. Pollut, 2021; 7: 25-41.[DOI]
[34] Honarbakhsh A, Azma A, Nikseresht F et al. Hydro-chemical assessment and GIS-mapping of groundwater quality parameters in semi-arid regions. J Water Supply Res T, 2019; 68: 509-522.[DOI]
[35] Ajibode OM, Rock C, Bright K et al. Influence of residence time of reclaimed water within distribution systems on water quality. J Water Reuse Desal, 2013; 3: 185-196.
[36] Jjemba PK, Johnson W, Bukhari Z et al. Occurrence and control of legionella in recycled water systems. Pathogens, 2015; 4: 470-502.
[37] Blanky M, Rodríguez-martínez S, Halpern M et al. Legionella pneumophila: from potable water to treated greywater; quantification and removal during treatment. Sci Total Environ, 2015; 533: 557-565.
Copyright © 2024 The Author(s). This open-access article is licensed under a Creative Commons Attribution 4.0 International License (https://creativecommons.org/licenses/by/4.0), which permits unrestricted use, sharing, adaptation, distribution, and reproduction in any medium, provided the original work is properly cited.


