Reverse Versus Inverse Optimum Safety Factor Approaches for Reliability-based Topology Optimization
Ghais Kharmanda1, Hasan Mulki2*
1Mechanics Laboratory of Normandy, Institut National des Sciences Appliquées de Rouen, St Etienne du Rouvray, France
2College of Engineering and Technology, American University of the Middle East, Egaila, Kuwait
*Correspondence to: Hasan Mulki, PhD, Associate Professor, College of Engineering and Technology, American University of the Middle East, 250 Steet, Egaila 15453, Kuwait; Email: hasan.mulki@aum.edu.kw
Abstract
Objective: The purpose of this study is to develop new reliability-based topology optimization (RBTO) approaches in order to develop new topology layouts, which will improve the structure rigidity and improve reliability levels as compared to previous RBTO layouts (or approaches).
Methods: There are two ways in which deterministic topology optimization problems can be categorized: objective-based approach (OBA) and performance-based approach (PBA). The RBTO problems consist of performing the OBA and PBA under reliability constraints. In addition, the different developments of RBTO in literature can be divided into two groups. Developments from a topology optimization standpoint are considered to be the first group, while developments from a reliability analysis standpoint are considered to be the second group. Considering these two topology optimization methods (OBA and PBA) and both RBTO perspectives, reverse optimal safety factor (ROSF) approaches are established in this study with the objective of producing several layouts with increasing rigidity levels. Additionally, these developed approaches combine the advantages of both perspectives. As part of the development of ROSF approaches, optimality conditions are used to demonstrate the robustness of expanded formulations in obtaining local optima.
Results: In this paper, the proposed RBTO approaches are applied to a 2D bicycle frame structure. Despite both ROSF and inverse optimum safety factor (IOSF) methodologies leading to several layouts, ROSF approaches always yield layouts with higher rigidity (or lower compliance) levels. In other words, the proposed approaches result in more rigid structures than previous approaches. A sensitivity study demonstrates that geometrical parameters have a significant impact on structural compliance (rigidity). Lastly, it should be noted that ignoring the geometry variability has no significant effect on the layouts.
Conclusion: With the proposed methods, the designer is able to produce more layouts with increasing rigidity levels as the reliability level increases. By doing so, it is possible to collect the advantages of the different existing methods described in the literature.
Keywords: deterministic topology optimization, reliability-based topology optimization, optimum safety factor, inverse optimum safety factor
1 INTRODUCTION
The topology optimization is an important topic in the optimum design field where its objective is to provide the best material distribution in the studied structures. Several concepts can be integrated into the topology optimization with the goal of improving its role during the design process. One of these concepts is the structural reliability. This integration leads to a new model, so-called reliability-based topology optimization (RBTO) model where several solutions with special advantages can be produced[1-3]. The RBTO model was used to solve various and wide range of problems, which required different developments of the model, which can be grouped in two main standpoints.
From a topology optimization standpoint, Kharmanda and Olhoff[1] have developed an RBTO model with an aim of supplying the designer with several reliability-based structures, while the classical topology optimization gives only a single deterministic topology. It has been demonstrated that the importance of the RBTO model generates structures being more reliable than those generated by deterministic topology optimization (DTO, Refer to the following references for similar literature[2-3]). In the RBTO strategy, reliability constraints have been added into initial problems of DTO. The initial step is to use the sensitivity analysis to show the impact of random variables on the compliance. The goal here is to pick the random variables which have a big influence on the objective function. A gradient-based method (GBM) was first utilized where the limit state function is supposed to be a linear combination of the random variables[1]. Using this approach, two separate steps are considered. The first step is represented by a sensitivity study to pick the effective random parameters, whereas the second step is to execute the optimization process which itself utilizes a sensitivity study wich respect the optimization parameters represented by the material densities. Several developments have been carried out considering the same standpoint[4-8]. Among these researches are, Patel and Choi[4] they dealt with this sort of problems implementing neural networks which have been effectively applied on various truss structures. Recently, Meng et al.[9] introduced a hybrid method of RBTO to deal with epistemic and aleatory uncertainties. It was a cost-effective single optimization loop method established on Karush-Kuhn-Tucker optimality condition. In addition, Pérez-Rúa et al.[10] performed a simultaneous optimization framework for an offshore wind arm collection system.
From a reliability analysis standpoint, the classical procedure of topology optimization is formulated as getting the stiffest structural layout considering a volume restriction. It was believed here that the feasibility of volume restriction is not essential in structural design challenges. It is more valuable to consider the stiffness variations under uncertainties. Bae and Wang[11] were the first who began the developments from a reliability analysis standpoint by expressing the topology optimization as volume minimization with a displacement limitation and applied the reliability-based design optimization (RBDO) procedure to keep the stiffness robustness in the topology design. Later, Jung et al.[12] extended the work of Bae and Wang[11] to geometrically nonlinear cases. Next, Agarwal[13] utilized a decoupled RBDO method where the topology optimization is isolated from the reliability analysis. After that, Patel et al.[14] suggested the gradient free hybrid cellular automata technique to include uncertainty with respect to material property. Eom et al.[15] employed bi-directional evolutionary structural optimization technique and the standard response surface approach to execute the RBTO model. Next, a computationally RBTO procedure was established by Jalalpour and Tootkaboni[16] for continuum domains considering material properties uncertainty. Recently, Yin et al.[17] developed an efficient approach for the structural lightweight design of planar continuum structures. In addition, Tauzowski et al.[18] developed a first order approach for elasto-plastic structures under reliability constraints.
When evaluating both different standpoints, the RBTO techniques from a reliability analysis standpoint require a large amount of computing time since the design variables, which are represented by the material densities, are considered as random variables. Consequently, a supplementary required system analysis is performed at every iteration (double nested loops), which conducts a large-scale problem analysis[19]. Hence, the topology optimization standpoint seems to be attractive for topology designers since it provides many reliability-based configurations relative to the reliability index alterations. It conducts different layouts whilst the development from a reliability analysis standpoint leads to almost similar layout structures with different densities that have no meaning for the following optimization phases (detailed design stage). The different findings from a reliability analysis standpoint can be feasible when performing additive manufacturing technique[8]. However, a significant drawback can be found when considering the topology optimization standpoint. Here, all resulting reliability-based topologies possess decreasing rigidity levels when increasing the reliability index values[1-3]. Therefore, there is a strong need to overcome this disadvantage. In other words, it is very important to offer different layouts with higher rigidity levels when increasing the reliability index rates. Therefore, the reverse optimum safety factor (ROSF) approaches are established in this paper to overcome this drawback. The integration of reliability analysis into topology optimization is carried out in a different way than the sizing and shape optimization[19]. In this approach, several considerations are for simplicity taken into account. First, the procedure of the proposed approaches is to assume the starting point as the failure point and then to find the optimum solution which should be more rigid than the failure point. Second, in order to establish the optimum safety factor formulations, the sensitivity magnitudes are calculated for the failure criterion whatever it was an objective function or a constraint one. The third point is to consider the effect of the derivative signs. Taking these considerations, the rigidity should be improved in function of the reliability index rise and as a result numerous reliability-based topologies can be achieved. Hence, it can be considered as a combination tool for developing the RBTO from two standpoints. The different advantages of the proposed strategy are shown by applying it on a bicycle frame structure. When increasing the reliability index values, the proposed strategy always leads to an increase of rigidity. In addition, the effect of the geometrical variables largely affects the resulting layouts and their rigidity.
The originality of this study is to overcome the research gaps of the previous RBTO developments, which are classified from two standpoints: topology optimization and reliability analysis. It was needed to develop effective/efficient strategies with the aim of providing several topology layouts in function of reliability levels. These layouts should possess a higher rigidity when increasing reliability levels. Two alternative approaches are developed in this study to meet these different needs.
2 METHODS
2.1 DTO
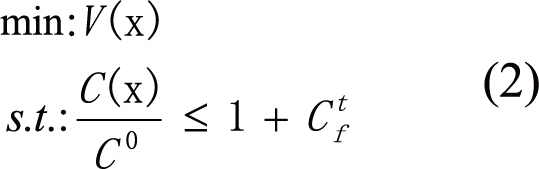
The classical topology optimization problems can be sorted here in two ways. The first one is called here, objective-based approach (OBA) where the objective is to minimize the structural compliance subject to a target ratio decrease of volume Vtf[20]. The compliance minimization is considered as a typical way utilized in topology optimization[21] which is here called OBA. The OBA formulation is mathematically written as follows:
|
where C(x) represents the structural compliance and x is the vector of the optimization variables characterized by the density of material in each element. These density values should belong to the interval [0, 1]. V0and V(x) are the initial- and current values of the structural volume. However, the second one is called performance-based approach (PBA) where the optimization problem is to minimize the structural volume subject to a target ratio increase of the structural compliance Ctf. The PBA formulation is mathematically expressed as follows:
|
Where C0 is the initial value of the structural compliance.
Several topology optimization schemes can generally be employed such as solid isotropic microstructure with penalty (SIMP)[20]. The first RBTO works had been carried out using SIMP approach[1-3] where a checkerboard problem may appear. However, effective procedures such as optimality criteria (OC) and the sequential convex programming (SCP) are respectively utilized for Equation (1) and Equation (2) to avoid any checkerboard problems which may appear when using the SIMP approach. The OC is performed by solving the optimality conditions directly[22]. The SCP is considered as an extension of the method of moving asymptotes which was established by[23,24]. An additional search procedure is added, and it is known as the SCP technique. For large-scale problems, both techniques have been demonstrated to be effective[25].
2.2 Reliability Analysis
A reliability index β has been introduced to produce numerous topologies considering the transformation of the physical space to the normalized one (Figure 1). This transformation correlates the random parameter with its statistical measurements (centrality (mean) and variation (standard-deviation). The problem of determining the failure probability in a normalized (standard) space is equivalent to the problem in the original (physical) space[19]. This way it is possible to control the different parameters representing the uncertainty. The assessment of the reliability index is performed by using first order reliability method where the limit state function is approximated in the normalized space as shown in Figure 1. The reliability index evaluation is to reach the most probable failure point by the following, a particular optimization procedure:
|
Where u is the normalized vector represented by the image of the random parameter in the normalized space and H(u)=0 is called the limit state function. The normalized variable ui relates to the random variable yi with its probabilistic model (mean ui and standard-deviation σi). The reliability index iso-values in the normalized space are presented in circles, while in the physical space, they are presented in ellipses as shown in Figure 1. d(u) is the distance between the limit state surface (or curve) and the origin point in the normalized space. It is expressed by:
|
|
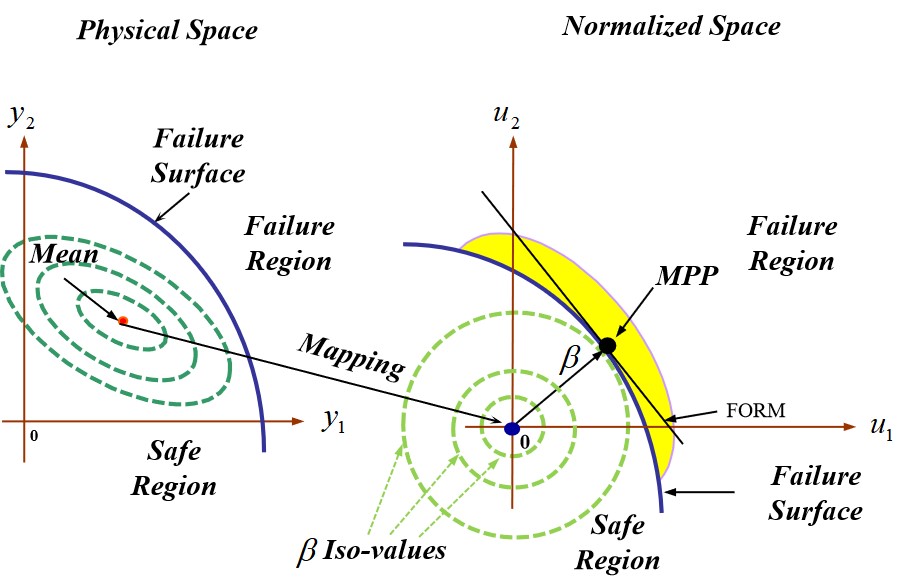
Figure 1. The transformation configuration between the physical and the normalized spaces.
In general, the reliability analysis is performed by using a particular optimization procedure to solve problem (3) as in GBM[1-3]. Nevertheless, when considering the optimality conditions, this problem can be resolved analytically using the basic principle of the inverse optimum safety factor (IOSF) approaches[7]. This principle is utilized in this study in the following sections to distribute the target reliability index value βt in a proportional manner taking the sensitivity with respect and the random parameters into account. Here, the random parameters can be handled in macro-structural levels (ex. dimension), while the design parameters are handled in micro-structural levels (material densities). Problem (3) is considered in this work for a single failure scenario. But, when considering several failure scenarios, a system reliability assessment should be established (the concerned reader can refer to reference[22]).
2.3 RBTO
A literature review of the previous RBTO advances can be found in reference[7]. Among these approaches, IOSF approaches are chosen as valuable tools for further developments. According to ISOF methods, the structural compliance values rise when the reliability index values increase. Rationally, when improving the reliability levels, the structural rigidity should increase (the structural compliance should decrease). When applying these approaches, the main outcomes are represented by providing several layouts. But when it results in increasing of compliance, it means a decrease of rigidity, which represents the disadvantage of these approaches. However, the objective of the current developments is to reduce the structural compliance values when raising the reliability index values. This fits with the goal of different developments from a reliability analysis standpoint. Furthermore, it should give numerous reliability-based topologies. This fits with the goal of different developments from a topology optimization standpoint. In other word, the developed approaches should lead to several topology configurations with reducing structural compliance values in function of the reliability index value increase. This way it combines the different developments from both standpoints. In addition, when performing the reliability analysis, the limit state function must be determined. The main difference between the reliability (R)&IOSF approaches and the previous works is that the limit state is related here only to the compliance. In this way, the sensitivity analysis is only carried out for the compliance since the limit state must be related to the failure criteria[26]. So, there is no meaning to perform the sensitivity analysis for the volume from reliability analysis standpoint.
2.3.1 Objective-based R&IOSF (OR&OI) Approaches
For the OBA, the problem of the RBTO model is to minimize the structural compliance subject to a target ratio decrease of volume Vtf and the reliability limitation. In literature, the procedure of topology optimization consists of minimizing the structural compliance subject to a prescribed volume fraction is most established[27]. The RBTO problem is then mathematically expressed as follows:
|
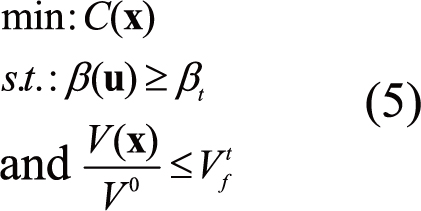
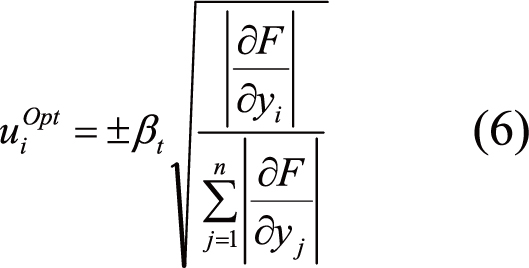
Where βt is the required reliability index to be fulfilled. u is the normalized vector grouping the random variable with its statistical model (mean and standard-deviation). In general, the failure is associated to the compliance. But in this method, the structural compliance is treated as an objective function. The initial principle of coupling between reliability analysis and topology optimization is performed by considering several simplifications[19]. For example, the reliability concept is a quantitative of nature and can be employed easily to shape and sizing optimization, while due to the qualitative nature of the topology optimization procedure, some simplifications are assumed. One of them is to use the basic idea of optimum safety factor (OSF) which is characterized by distributing of the sum of the absolute values of the derivatives of the failure criterion with respect to the random variables y (a full derivation of OSFs can be found in Kharmanda et al.[19]). In addition, the OSF equations are formulated considering both reliability index approach and performance measurement approach[28]. The resulting partial values represent the impact of each random parameter on the failure criterion function. For this approach, this function is handled as objective function and the same distribution idea is used. Hence, the sensitivity assessment is performed for the objective function which is treated as a failure criterion. The optimum value of the normalized vector can then be written as follows:
|
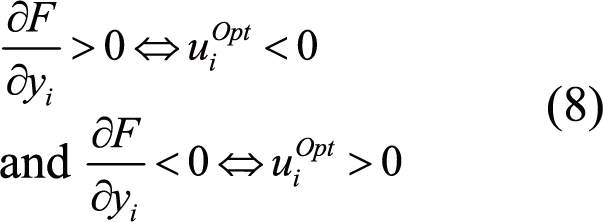
When taking the sign of the objective function derivative with respect to random variables yi into account, it can be written for the objective-based IOSF (OI) approach[7]:
|

and for the objective-based ROSF (OR) approach:
|
2.3.2 Performance-based R&IOSF (PR&PI) Approaches
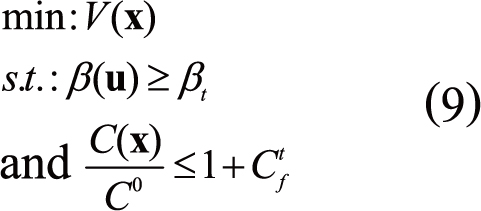
When considering the PBA, the problem of the RBTO model is to minimize the structural volume subject to a target ratio increase of compliance Cif and the reliability constraint. This problem is then mathematically expressed as follows:
|
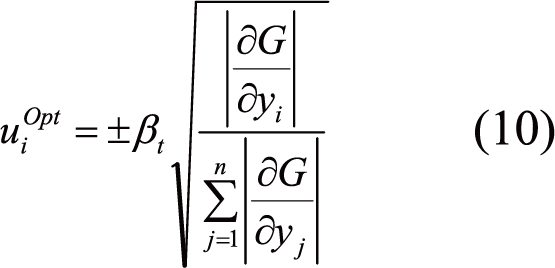
The optimum value of the normalized vector can be stated by:
|
According to the sign of the limit state function derivative with respect to random variables yi, it can be written for the performance-based IOSF approach[7]:
|
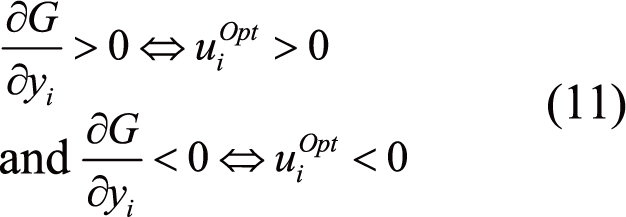
and for the performance-based ROSF (PR) approach:
|

2.4 Probabilistic Distribution Laws
To use the developed approaches, distribution laws should be chosen and applied. In this work, the normal distribution is utilized for the random variable. This way the safety factor can be written as follows:
|
Where λi signifies the correlation between the mean value ui of the random variable yi and its corresponding standard-deviation δi as follows:
|
Here, the starting point is assumed to be the failure point P*y and an RBTO layout P*x is then achieved. This point P*x must satisfy a target reliability index βi. The DTO model is employed to get the failure point P*y.
2.5 Implementation Steps of R&IOSF Approaches
The R&IOSF approaches can be simply implemented in five main steps:
1) Determine the starting point by a DTO procedure: Two configurations can be found when using Equation (1) and Equation (2). The interested reader can find in some basic ANSYS parametric design language (APDL) commands to perform the DTO procedure[19].
2) Compute the sensitivities: The sensitivity magnitudes are evaluated for the structural compliance since it is considered as a failure criterion. The calculation technique is called central finite difference technique considering that the increment is 1% for all selected random variables[19].
3) Compute the optimum values of the normalized vector: The analytical solution of Problem 3 considering the optimality conditions and Equation (4) leads to the optimum values of the normalized vector[28]. Here, Equation (6) and Equation (10) are used for both R&IOSF approaches.
4) Determine the optimum safety factors: According to the distribution laws[19], the optimum safety factors can be determined. In our studied case (normal distribution law), Equation (13) represents the relationship between safety factor values and the optimum value of the normalized variables.
5) Determine the reliability-based topology layouts: The RBTO can be determined according to the sign of the derivatives (Inequalities 7, 8, 11, 12), the used DTO problem (1 & 2) and the target reliability index values.
2.6 Studied Bike Frame Model
A simplified 2D model of a bike frame is considered here to perform the different RBTO developments. The parametrization is applied to several kinds of variables (geometry, material properties, forces...). Figure 2 shows the geometrical parameters of the initial optimization domain and boundary conditions of the 2D studied bike frame structure. The given geometrical parameters are: L1, L2, L3 and H and the applied forces are: Fy1, Fy2 and Fx2, The importance of the frame structure is to be considered as a holder securing the relationship between the different assemblies (driving system, steering system, front wheel, rear wheel, and brake system) of the bicycle unit. In general, it is represented by a connection of several tubes where several topologies (designs) can be found. The initial optimization domain presented in Figure 2 is suitable for classical man’s frame designs (main frame structure) where at least one horizontal top tube is needed to connect the seat stay and the handlebar. While for woman’s frame design, the initial optimization domain must be different to meet the needed performance. In Lin et al.[29], numerical analysis was carried out to compare the maximum stress and displacement of three types of frame designs. The main frame structure is found to be the most rigid type. So, the RBTO approaches are applied in this paper to the man’s frame configuration to study the effect of the reliability changes on the frame rigidity.
|
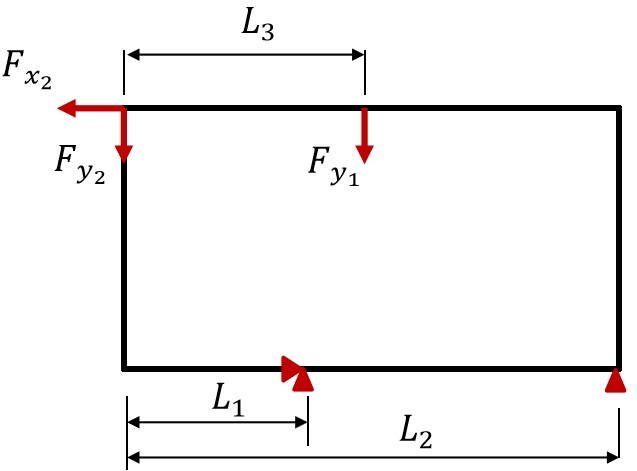
Figure 2. Initial configuration of the studied 2D bike frame structure.
As shown in Table 1, the given geometrical dimensions (L1, L2, L3 and H), material properties (E and ν), the forces (Fy1 , Fy2 and Fx2) and limitations (Vtf=50% and Ctf=50%) are considered as data for the starting point. The random vector is represented by the following probabilistic data:
1) The mean values are the given values in Table 1 and the standard-deviations are proportional to these mean values by 10%.
2) For simplicity, all studied random distributions are considered to be normal distributions.
Table 1. Given Data
Parameters |
Given Values |
L1 |
0.3m |
L2 |
1m |
L3 |
0.5m |
H |
0.5m |
Fy1 |
100N |
Fy2 |
100N |
Fx2 |
100N |
E |
200000MPa |
ν |
0.3 |
Vtf / Ctf |
50 |
Notes: L1, L2, L3 and H: geometrical parameters; Fy1, Fy2 and Fx2,: applied forces; E and ν: material properties.
DTO and RBTO models are considered here to compare the developed approaches for three studies the first study (S1), the second study (S2) and the third study (S3). In S1, all variables are considered random (L1, L2, L3, H, Fy1, Fy2, Fx2, E, ν and Vtf / Ctf. In S2, only the geometrical variables are considered to be random (L1, L2, L3 and H). However, in S3, we ignore the geometrical variables to show their absence effect on the resulting topologies. So, the random variables are: (Fy1, Fy2, Fx2, E, ν and Vtf / Ctf ). In structural engineering applications[19], the values of the reliability index belong to the interval β=∈[3-4.25]. To identify the effect of the layout changes, three values are selected: β=3, β=3.8 and β=4.25.
3 RESULTS
The different developments are implemented considering the APDL where several commends can be used to deal with the new developments. The applied meshing technique to the initial optimization domain (Figure 2) is called smart size, which is implemented in ANSYS software and can be adopted according to the geometry complexity. The utilized element is called PLANE82 (nonlinear element, 8 nodes) where the topology optimization procedure in ANSYS software can be performed only by using nonlinear elements. OC and the SCP are two techniques available in ANSYS software and used to solve Problems 1 and 2 respectively. For static loading cases, the OC is used by default for performing compliance minimization problems, while the SCP is used for the volume minimization ones[30,31]. Recently, other methods can be found in literature considering different objective and constraint functions such as stress functions[32,33] and others dealing with microstructural levels[34,35]. However, in this work, we focus on the most used strategies (Problems 1 and 2).
3.1 Results of DTO
The different layouts are represented by a color scale where the colors represent the densities of materials. The red color means an element with full material which can be represented by a solid element. Following the density, the colors change to become blue which can be represented by a void element. The maximum density area is mentioned by MX, while the minimum density area is mentioned by MN on the following figures. All figures are modelled in the 2D Cartesian space (x, y) where the origin is located at the lower left corner. Figure 3A and B show the resulting topologies when using OBA and PBA, respectively. When modelling the resulting layouts by truss structures, the OBA leads to a truss with a bigger number of rods than the PBA as shown in Figure 3. This is compatible with existing results in literature where it has been shown that the OBA is the most used strategy[29].
|
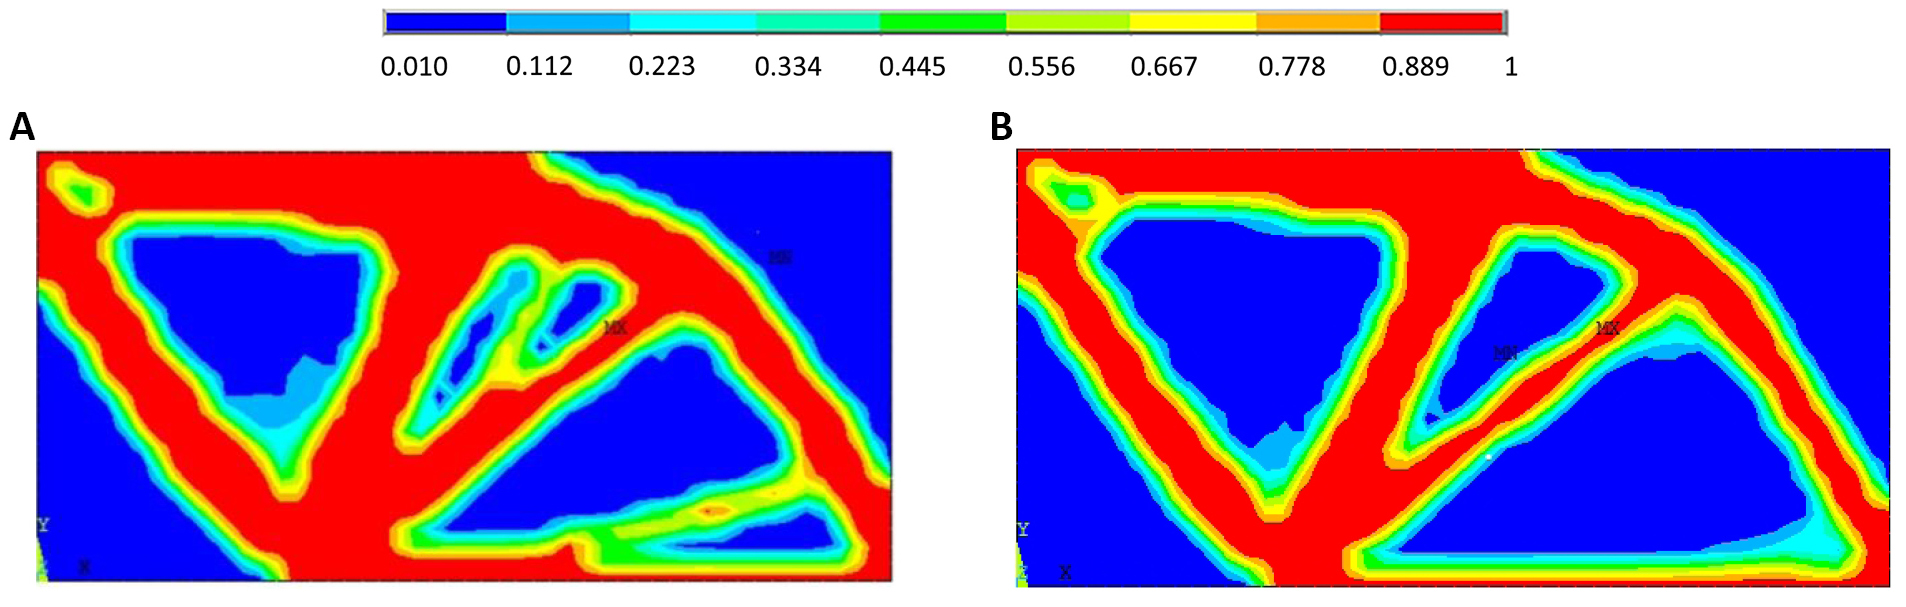
Figure 3. Resulting deterministic topology optimization layouts when using (A) OBA and (B) PBA.
3.2 Results for RBTO
The sensitivity analysis is needed as a first step to perform the present RBTO approaches. It is initially carried out on the resulting DTO configurations (Figure 3A and B) considering all random variables. In this way, the obtained results can be next used in the different RBTO studies. The corresponding results for the OBA and the PBA considering the three studies (S1, S2 and S3) are represented in Table 2.
Table 2. Compliance Sensitivity Magnitude Results
Parameters |
OBA |
PBA |
L1 |
11.90 |
11.60 |
L2 |
-1.78 |
-2.56 |
L3 |
-3.34 |
-2.85 |
H |
1.74×10⁻¹ |
-1.59 |
Fy1 |
-8.26×10⁻³ |
-5.62×10⁻³ |
Fy2 |
4.48×10⁻² |
-4.23×10⁻² |
Fx2 |
4.83×10⁻² |
4.52×10⁻² |
E |
-2.02×10⁻⁵ |
-2.32×10⁻⁵ |
ν |
5.00×10⁻³ |
0 |
Vtf / Ctf |
5.4810-2 |
3.11×10⁻² |
Notes: L1, L2, L3 and H: geometrical parameters; Fy1 , Fy2 and Fx2,: applied forces; E and ν: material properties; OBA: Objective-based approach; PBA: Performance-based approach.
The selected sensitivity method is the central finite difference method, which is considered to be an accurate method[19]. The positive value means that when increasing the random variables such as (L1, H, Fy2, Fx2, ν and Vtf) for OBA and as (L1, Fx2 and Ctf ) for PBA, the structural compliance value increases. While the negative value means that when increasing the random variables such as (L2, L3, Fy1, and E) for OBA and as (L2, L3, H, Fy1, Fy2, and E) for PBA, the structural compliance value decreases. However, the sensitivity magnitude of the structural compliance with respect to the Poisson’s ratio is nil for PBA, which means that it has no influence on the structural compliance.
Figure 4A and B show the compliance sensitivity magnitudes with respect to the different parameters. The geometrical variables have the biggest influence on the compliance. The most influent parameter is the position of the front gear in the driving system (L1).
|
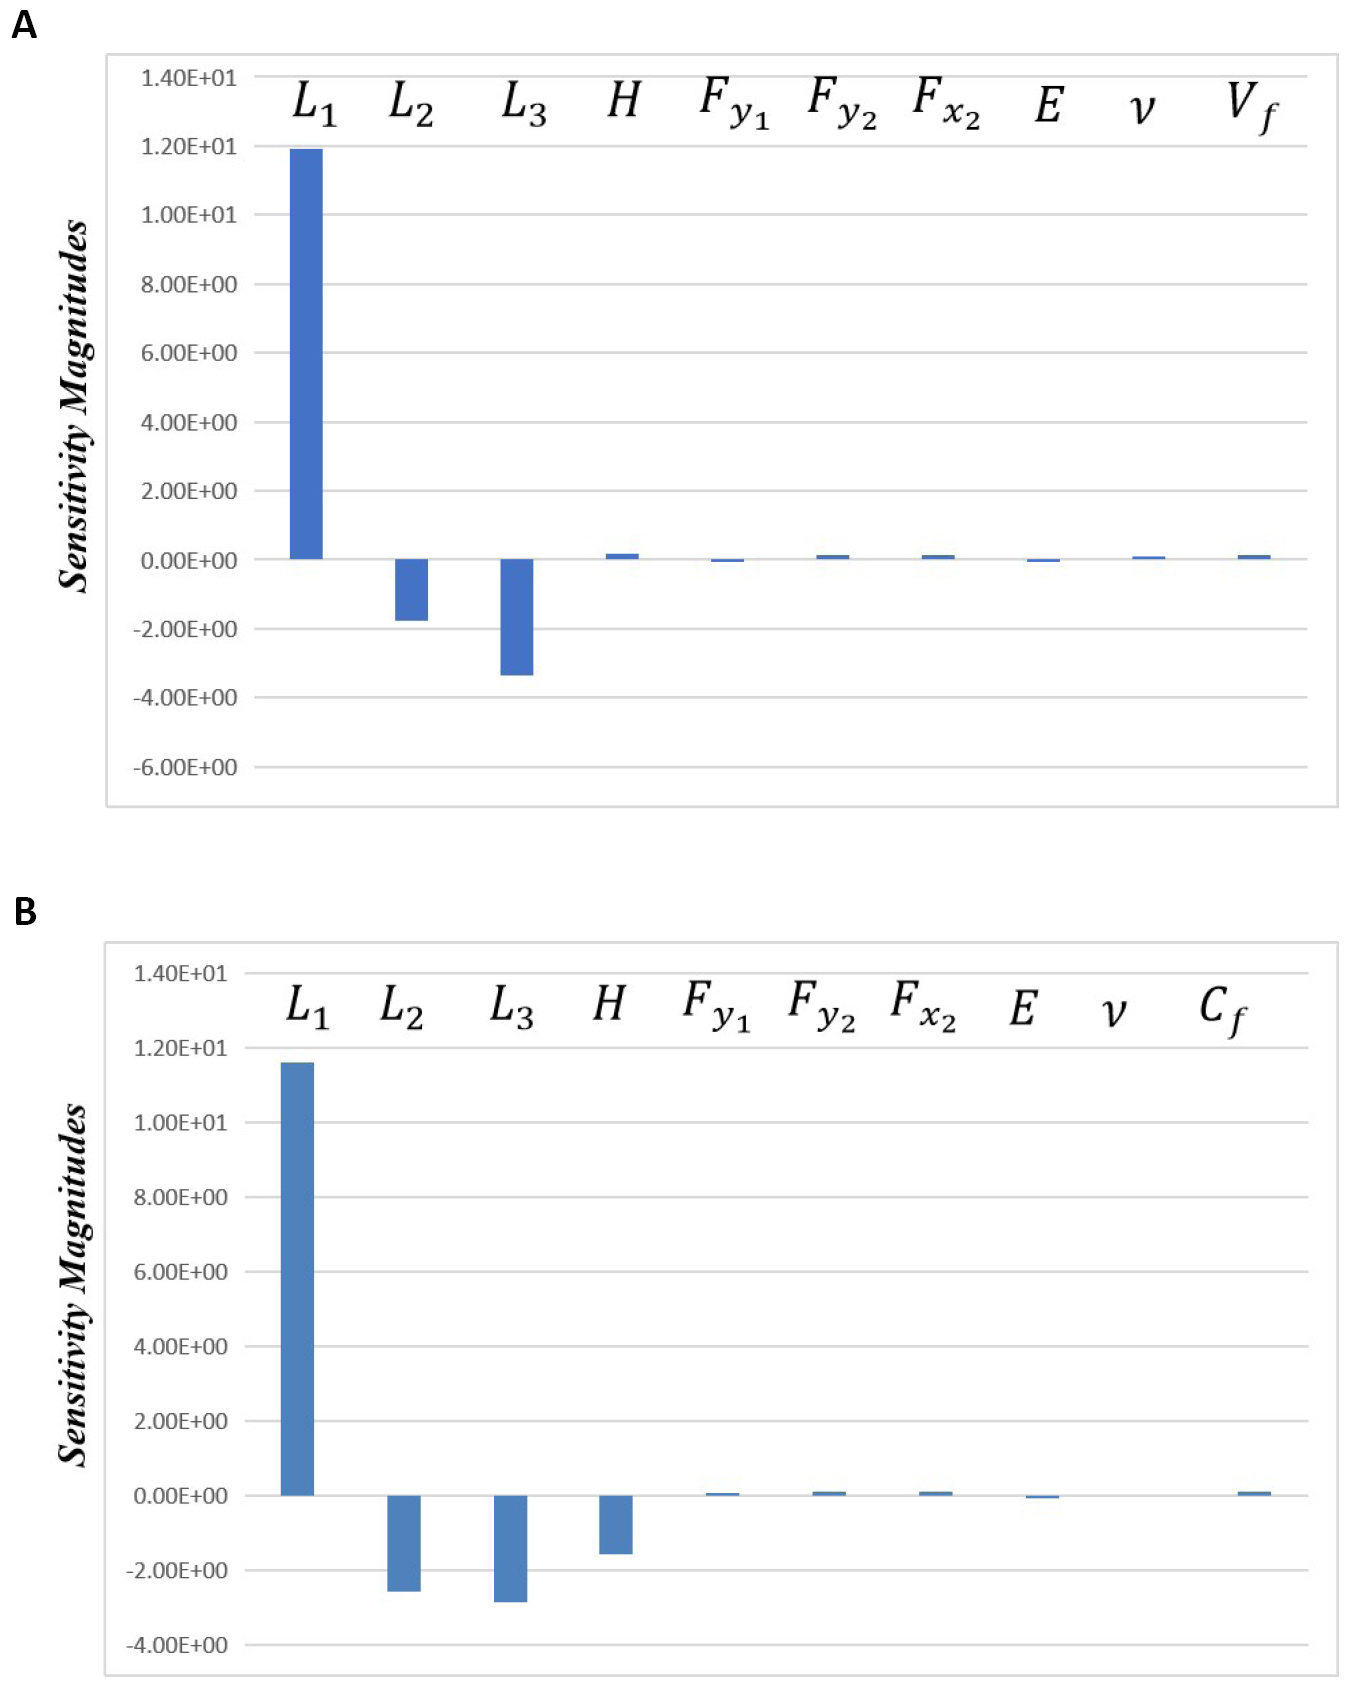
Figure 4. Sensitivity magnitude with respect to the different selected variables for (A) OBA and (B) PBA.
The standard-deviation is considered proportional to the mean values (starting point) to be 10% (λi=0.1 see Equation (13)). Two topology optimization methods are utilized in ANSYS software: OC and SCP. The different numerical results for the DTO and the RBTO using OR&OI approaches for the three studies (S1, S2 and S3) are represented in Table 3. The different numerical results for the DTO and the RBTO using PR&PI approaches for the three studies (S1, S2 and S3) are shown in Table 4.
Table 3. Numerical DTO and RBTO Results Using OBA
Studies & Outputs |
DTO |
RBTO |
||||||
OI |
OR |
|||||||
β=3 |
β=3.8 |
β=4.25 |
β=3 |
β=3.8 |
β=4.25 |
|||
S1 |
Com |
4.04056 |
6.19271 |
7.11404 |
7.75178 |
2.85322 |
2.61045 |
2.49288 |
Vol |
0.25 |
0.228880 |
0.223108 |
0.219836 |
0.270235 |
0.275472 |
0.278388 |
|
S2 |
Com |
4.04056 |
5.96247 |
6.79154 |
7.35347 |
2.98307 |
2.75599 |
2.63229 |
Vol |
0.25 |
0.232717 |
0.227862 |
0.225086 |
0.265830 |
0.269806 |
0.271997 |
|
S3 |
Com |
4.04056 |
6.22859 |
7.05444 |
7.55650 |
2.62319 |
2.33366 |
2.19057 |
Vol |
0.25 |
0.206280 |
0.194622 |
0.188064 |
0.293720 |
0.305378 |
0.311936 |
|
Notes: S1: The first study; S2: The second study; S3: The third study; DTO: deterministic topology optimization; OI: Objective-based IOSF; OR: Objective-based ROSF; Com: The structural compliance; Vol: The structural volume.
Table 4. Numerical DTO and RBTO Results Using PBA
Studies & Outputs |
DTO |
RBTO |
||||||
PI |
PR |
|||||||
β=3 |
β=3.8 |
β=4.25 |
β=3 |
β=3.8 |
β=4.25 |
|||
S1 |
Com |
4.64568 |
6.84557 |
7.83602 |
8.51470 |
3.53692 |
3.33581 |
3.22038 |
Vol |
0.204854 |
0.178932 |
0.169334 |
0.165583 |
0.223557 |
0.226166 |
0.226929 |
|
S2 |
Com |
4.64568 |
6.64197 |
7.54364 |
8.16463 |
3.64415 |
3.47231 |
3.38175 |
Vol |
0.204854 |
0.180137 |
0.170647 |
0.165709 |
0.220707 |
0.226491 |
0.226534 |
|
S3 |
Com |
4.64568 |
6.72723 |
7.36570 |
7.74071 |
3.02171 |
2.65930 |
2.46783 |
Vol |
0.204854 |
0.194696 |
0.192018 |
0.190376 |
0.215548 |
0.218326 |
0.220099 |
|
Notes: S1: The first study; S2: The second study; S3: The third study; DTO: deterministic topology optimization; PI: Performance-based IOSF; PR: Performance-based ROSF; Com: The structural compliance; Vol: The structural volume.
3.2.1 S1
3.2.1.1 S1 Using OR&OI Approaches
For S1, when using RBTO-OBAs, Figure 5A, C and E show the RBTO layouts when using OI approach for β=3, β=3.8, and β=4.25, respectively. Figure 5B, D and F show the RBTO layouts when using OR approach for β=3, β=3.8, and β=4.25, respectively.
|
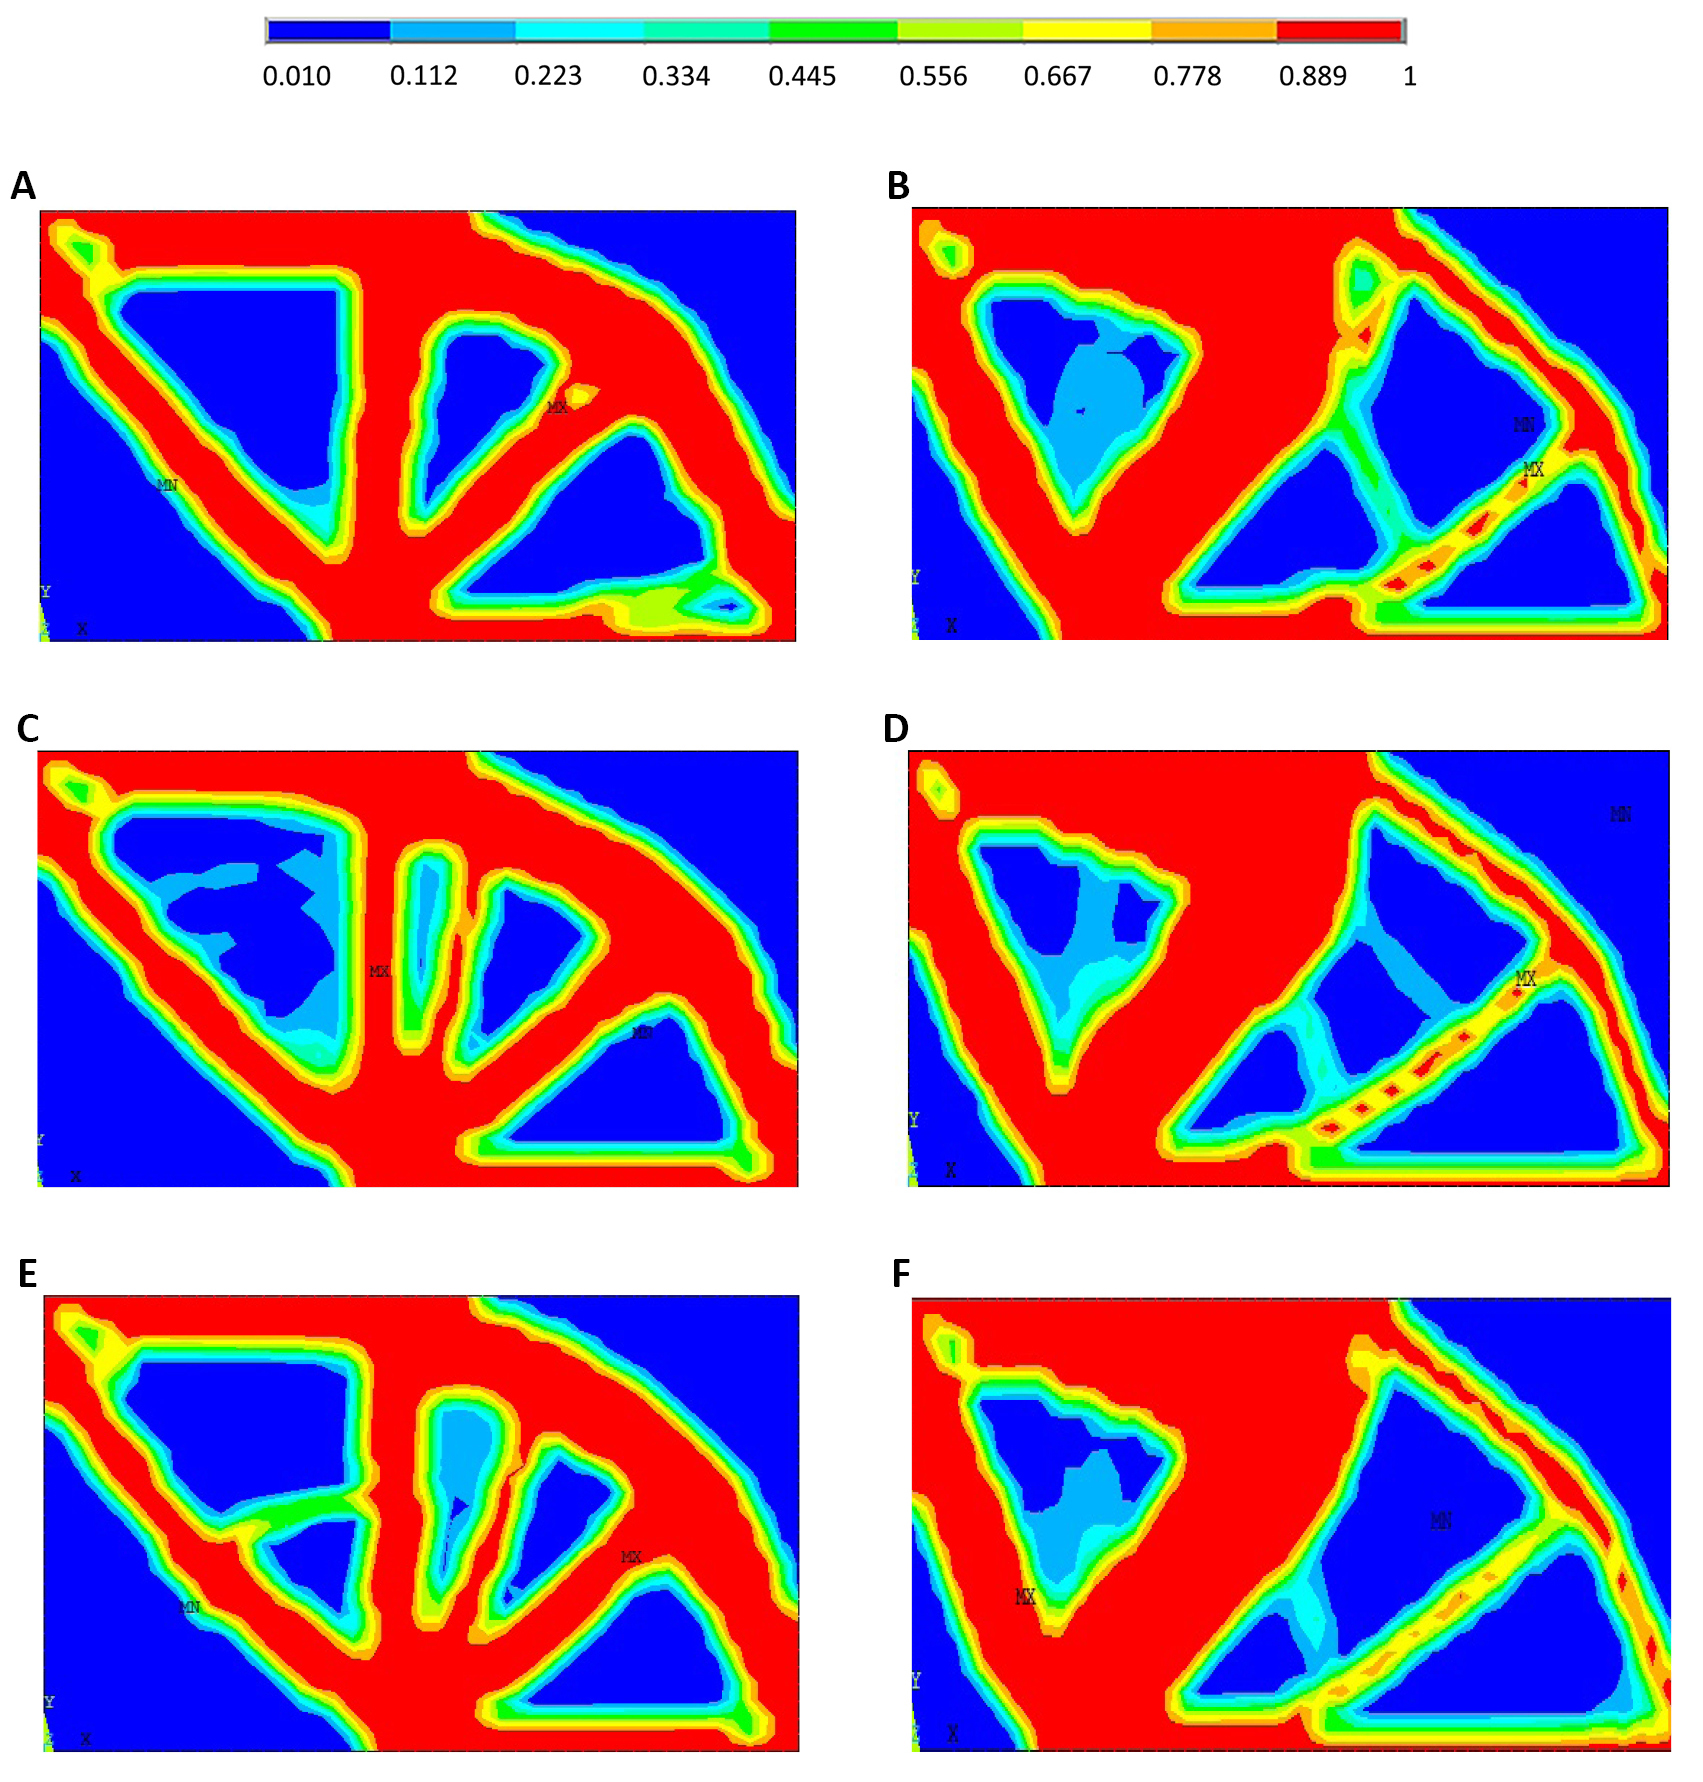
Figure 5. RBTO layouts for OI approach (A, C and E) and OR approach (B, D and F) when considering the first study (S1).
Figure 5 shows for (S1) that both approaches (OR&OI approaches) lead to a significant layout change when varying the reliability index values. The RBTO solutions are also different than those provided by DTO for both OBA and PBA (see Figure 3A and B).
3.2.1.2 S1 Using PR&PI Approaches
For S1 when using RBTO-PBAs, Figure 6A, C and E show the RBTO layouts when using performance-based IOSF approach for β=3, β=3.8, and β=4.25, respectively. Figure 6B, D and F show the RBTO layouts when using PR approach for β=3, β=3.8, and β=4.25, respectively.
|
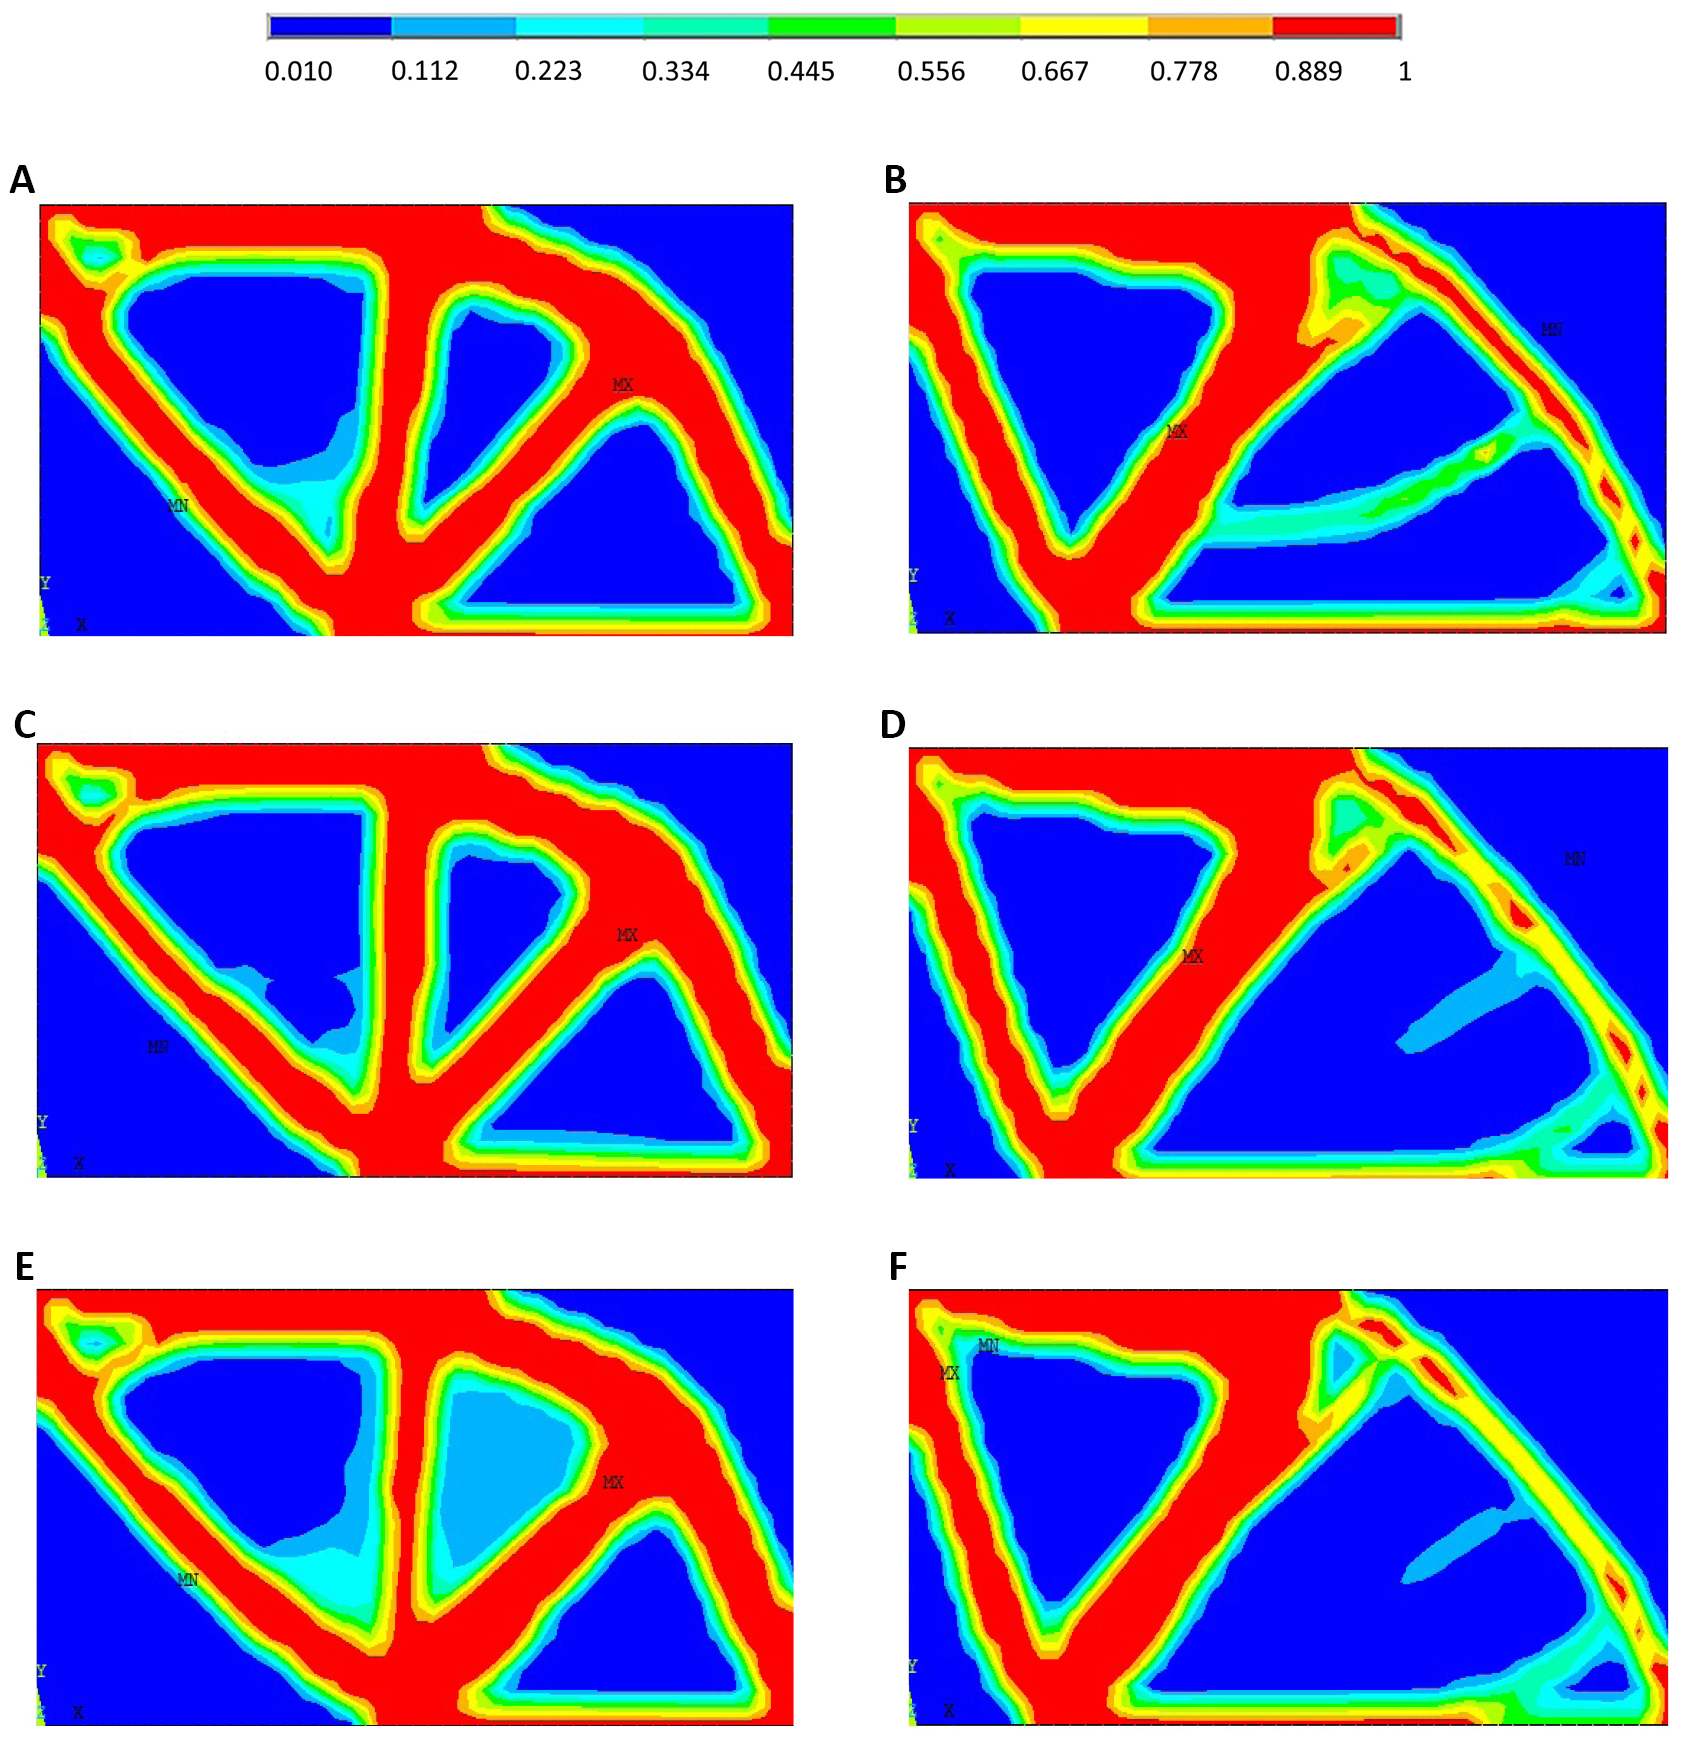
Figure 6. RBTO layouts for performance-based IOSF approach (A, C and E) and performance-based ROSF approach (B, D and F) when considering the first study (S1).
Figure 6 shows that for (S1) the performance-based IOSF approach doesn’t lead to a significant change, while ROSF one leads to a significant change when varying the reliability index values. The RBTO solutions are also different than those provided by DTO for both OBA and PBA (see Figure 3A and B).
Figure 7 shows the structural compliance and volume changes as function of reliability index for the different approaches, considering S1. Concerning the IOSF approach, both the objective-based and performance-based strategies show the same tendency. For both OI & PI, as the reliability index values increases, the structural compliance remarkably increases too, while the structural volume slightly decreases. On the other hand, a tendency opposite to that of IOSF can be observed with respect to the ROSF approach. Although the decrease in the compliance for both OR and PR are good, a slight increase in volume can be observed, which is better for design purposes as the increase in stiffness is highly recommended in structures.
|
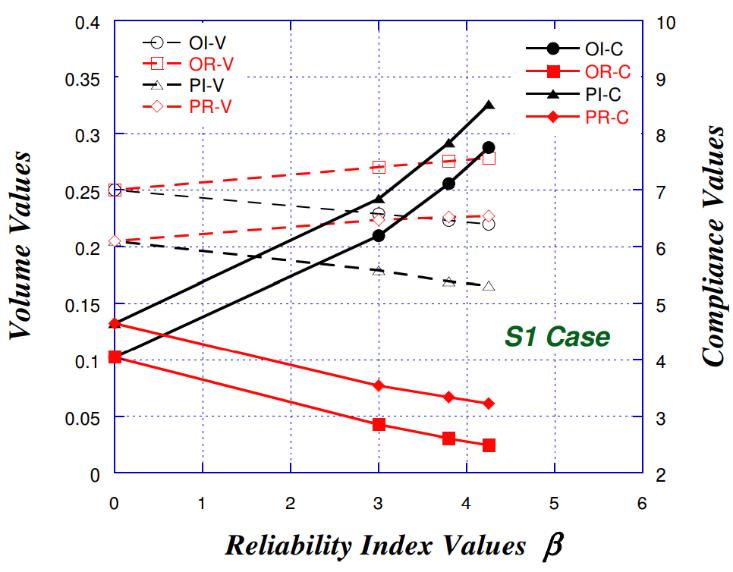
Figure 7. Structural compliance and volume change in function of reliability index for the first study (S1).
3.2.2 S2
3.2.2.1 S2 Using OR&OI Approaches
For the second study (S2) when using OR&OI approaches, Figure 8A, C and E show the RBTO layouts when using OI approach for β=3, β=3.8, and β=4.25, respectively. Figure 8B, D and F show the RBTO layouts when using OR approach for β=3, β=3.8, and β=4.25, respectively.
As shown in Figure 8 for (S2) when using RBTO-OBAs, both approaches lead to a significant layout change when varying the reliability index values. The RBTO solutions are also different than those provided by DTO for both OBA and PBA (see Figure 3A and B).
|
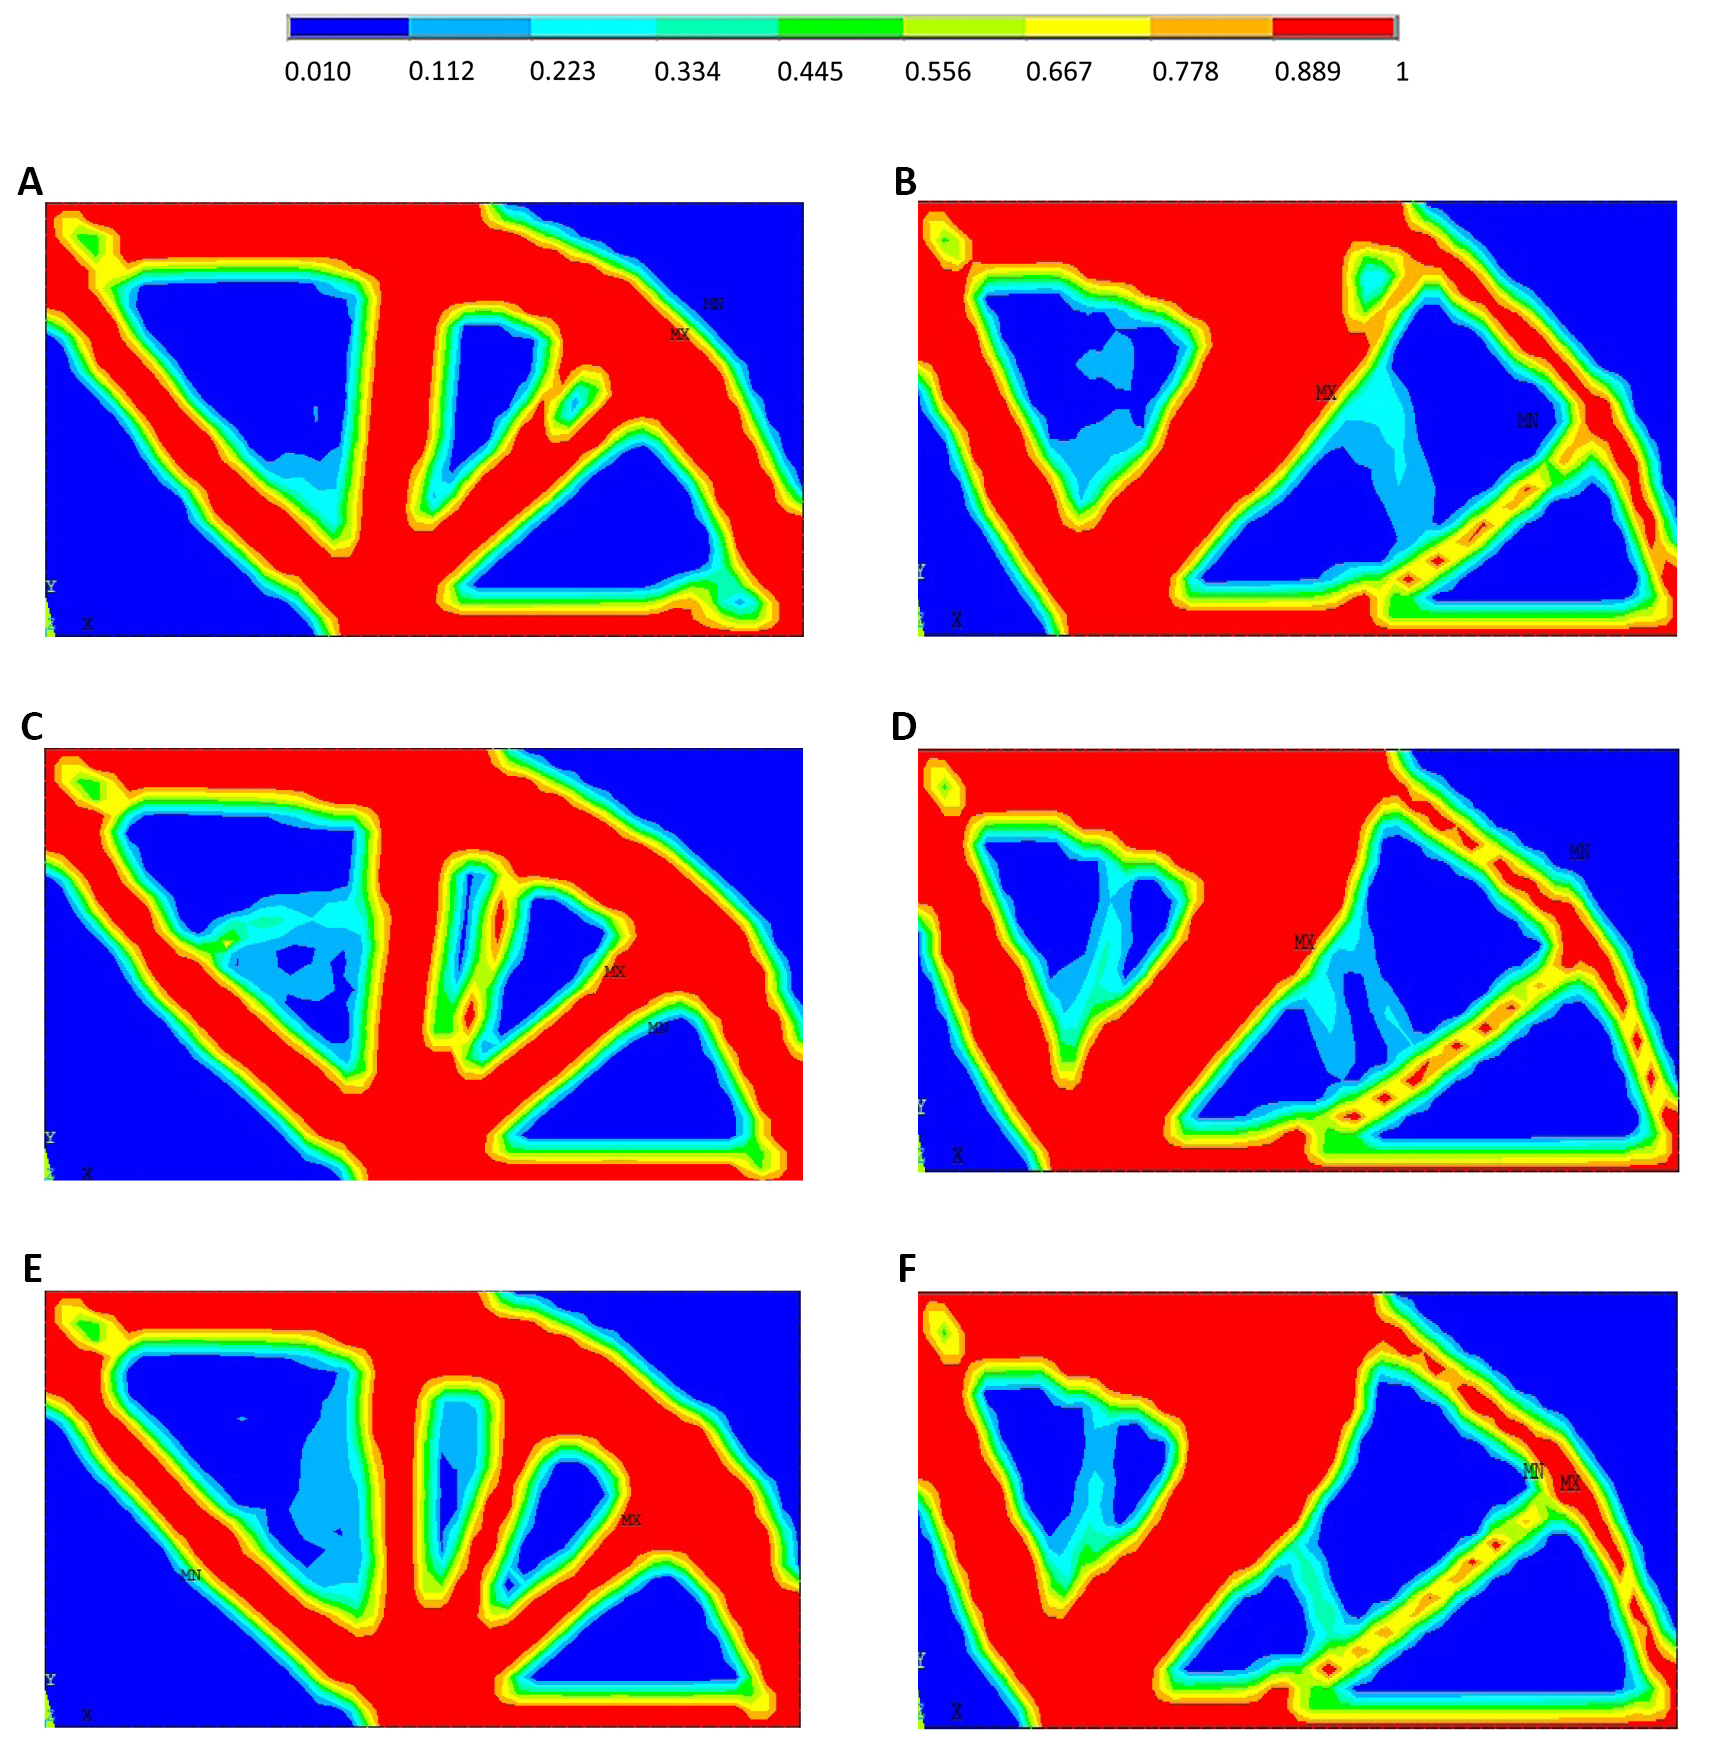
Figure 8. RBTO layouts for OI approach (A, C and E) and OR approach (B, D and F) when considering the second study (S2).
3.2.2.2 S2 Using PR&PI Approaches
For S2 when using RBTO-PBAs, Figure 9A, C and E show the RBTO layouts when using performance-based IOSF approach for β=3, β=3.8, and β=4.25, respectively. Figure 9B, D and F show the RBTO layouts when using PR approach for β=3, β=3.8, and β=4.25, respectively.
|
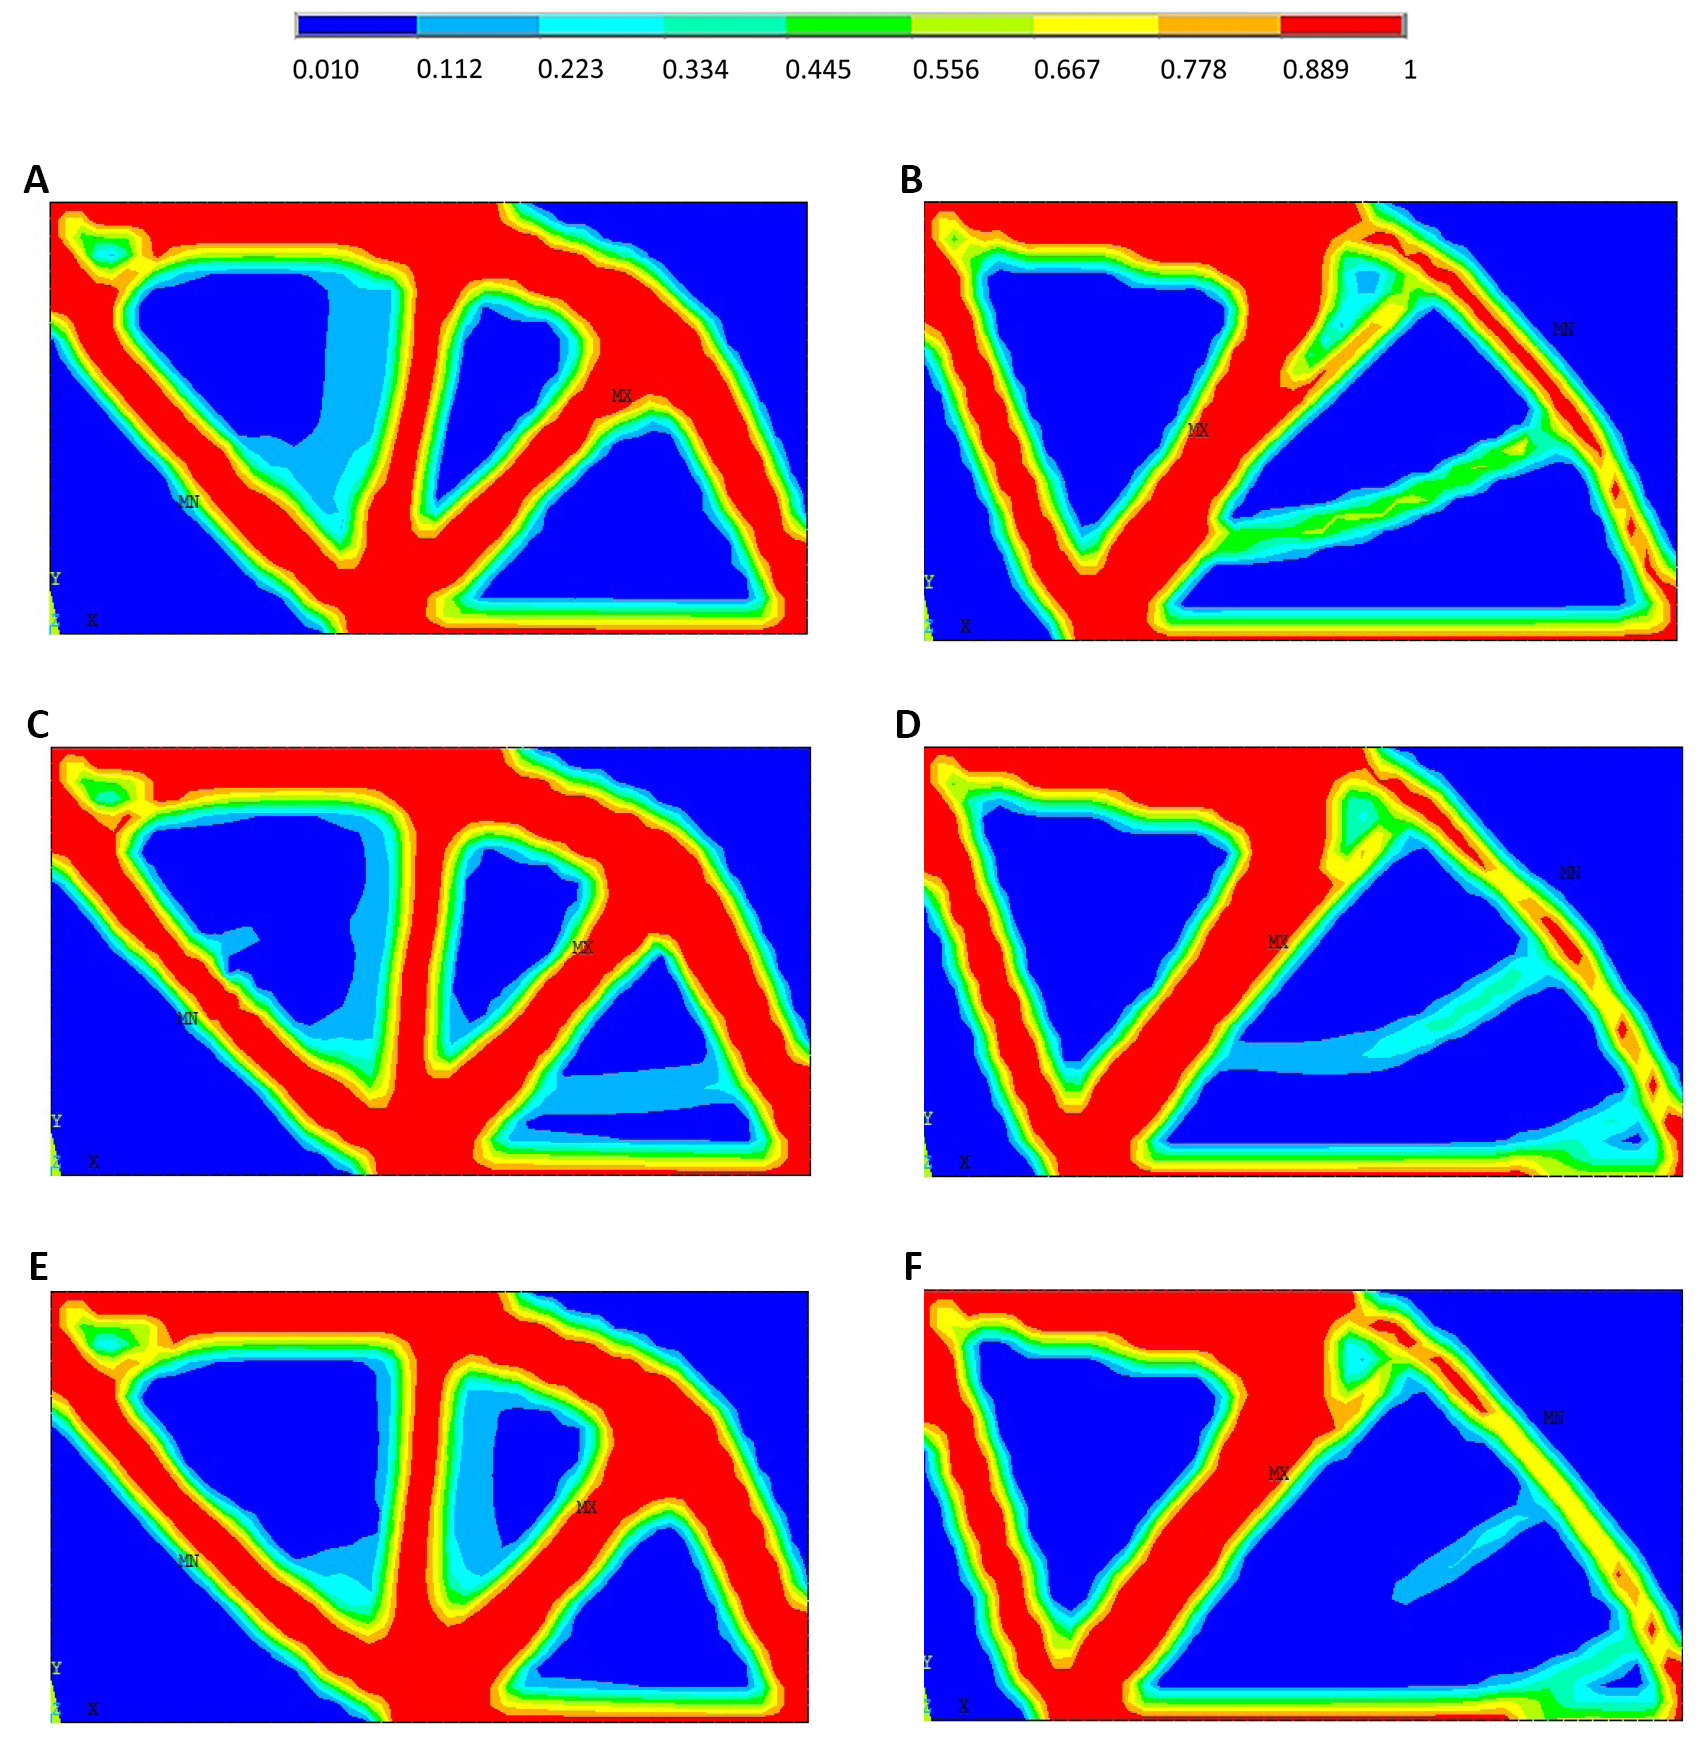
Figure 9. RBTO layouts for performance-based IOSF approach (A, C and E) and RBTO layouts for performance-based ROSF approach (B, D and F) when considering the second study (S2).
Figure 9 shows that for (S2), the performance-based IOSF approaches do not lead to a significant layout change when varying the reliability index values, while the PR approach leads to a small layout change.
In Figure 10, the structural compliance and volume changes are shown as a function of reliability index for the different approaches when considering case S2. A similar tendency and results are shown in case (S1). For the OI and PI strategies, when increasing the reliability index values, there is a remarkable increase of the structural compliance, while the structural volume slightly decreases. However, when increasing the reliability index values, the structural compliance decreases for OR and PR strategies, while the structural volume slightly increases.
|
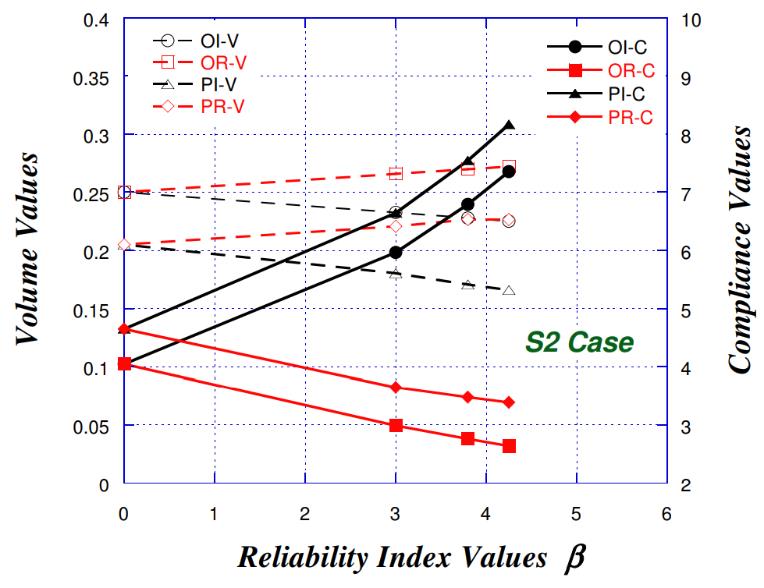
Figure 10. Structural compliance and volume change in function of reliability index for the second study (S2).
3.2.3 S3
3.2.3.1 S3 Using OR&OI Approaches
For S3 when using RBTO-OBAs, Figure 11A, C and E show the RBTO layouts when using OI approach for β=3, β=3.8, and β=4.25, respectively. Figure 11B, D and F show the RBTO layouts when using OR approach for β=3, β=3.8, and β=4.25, respectively.
|
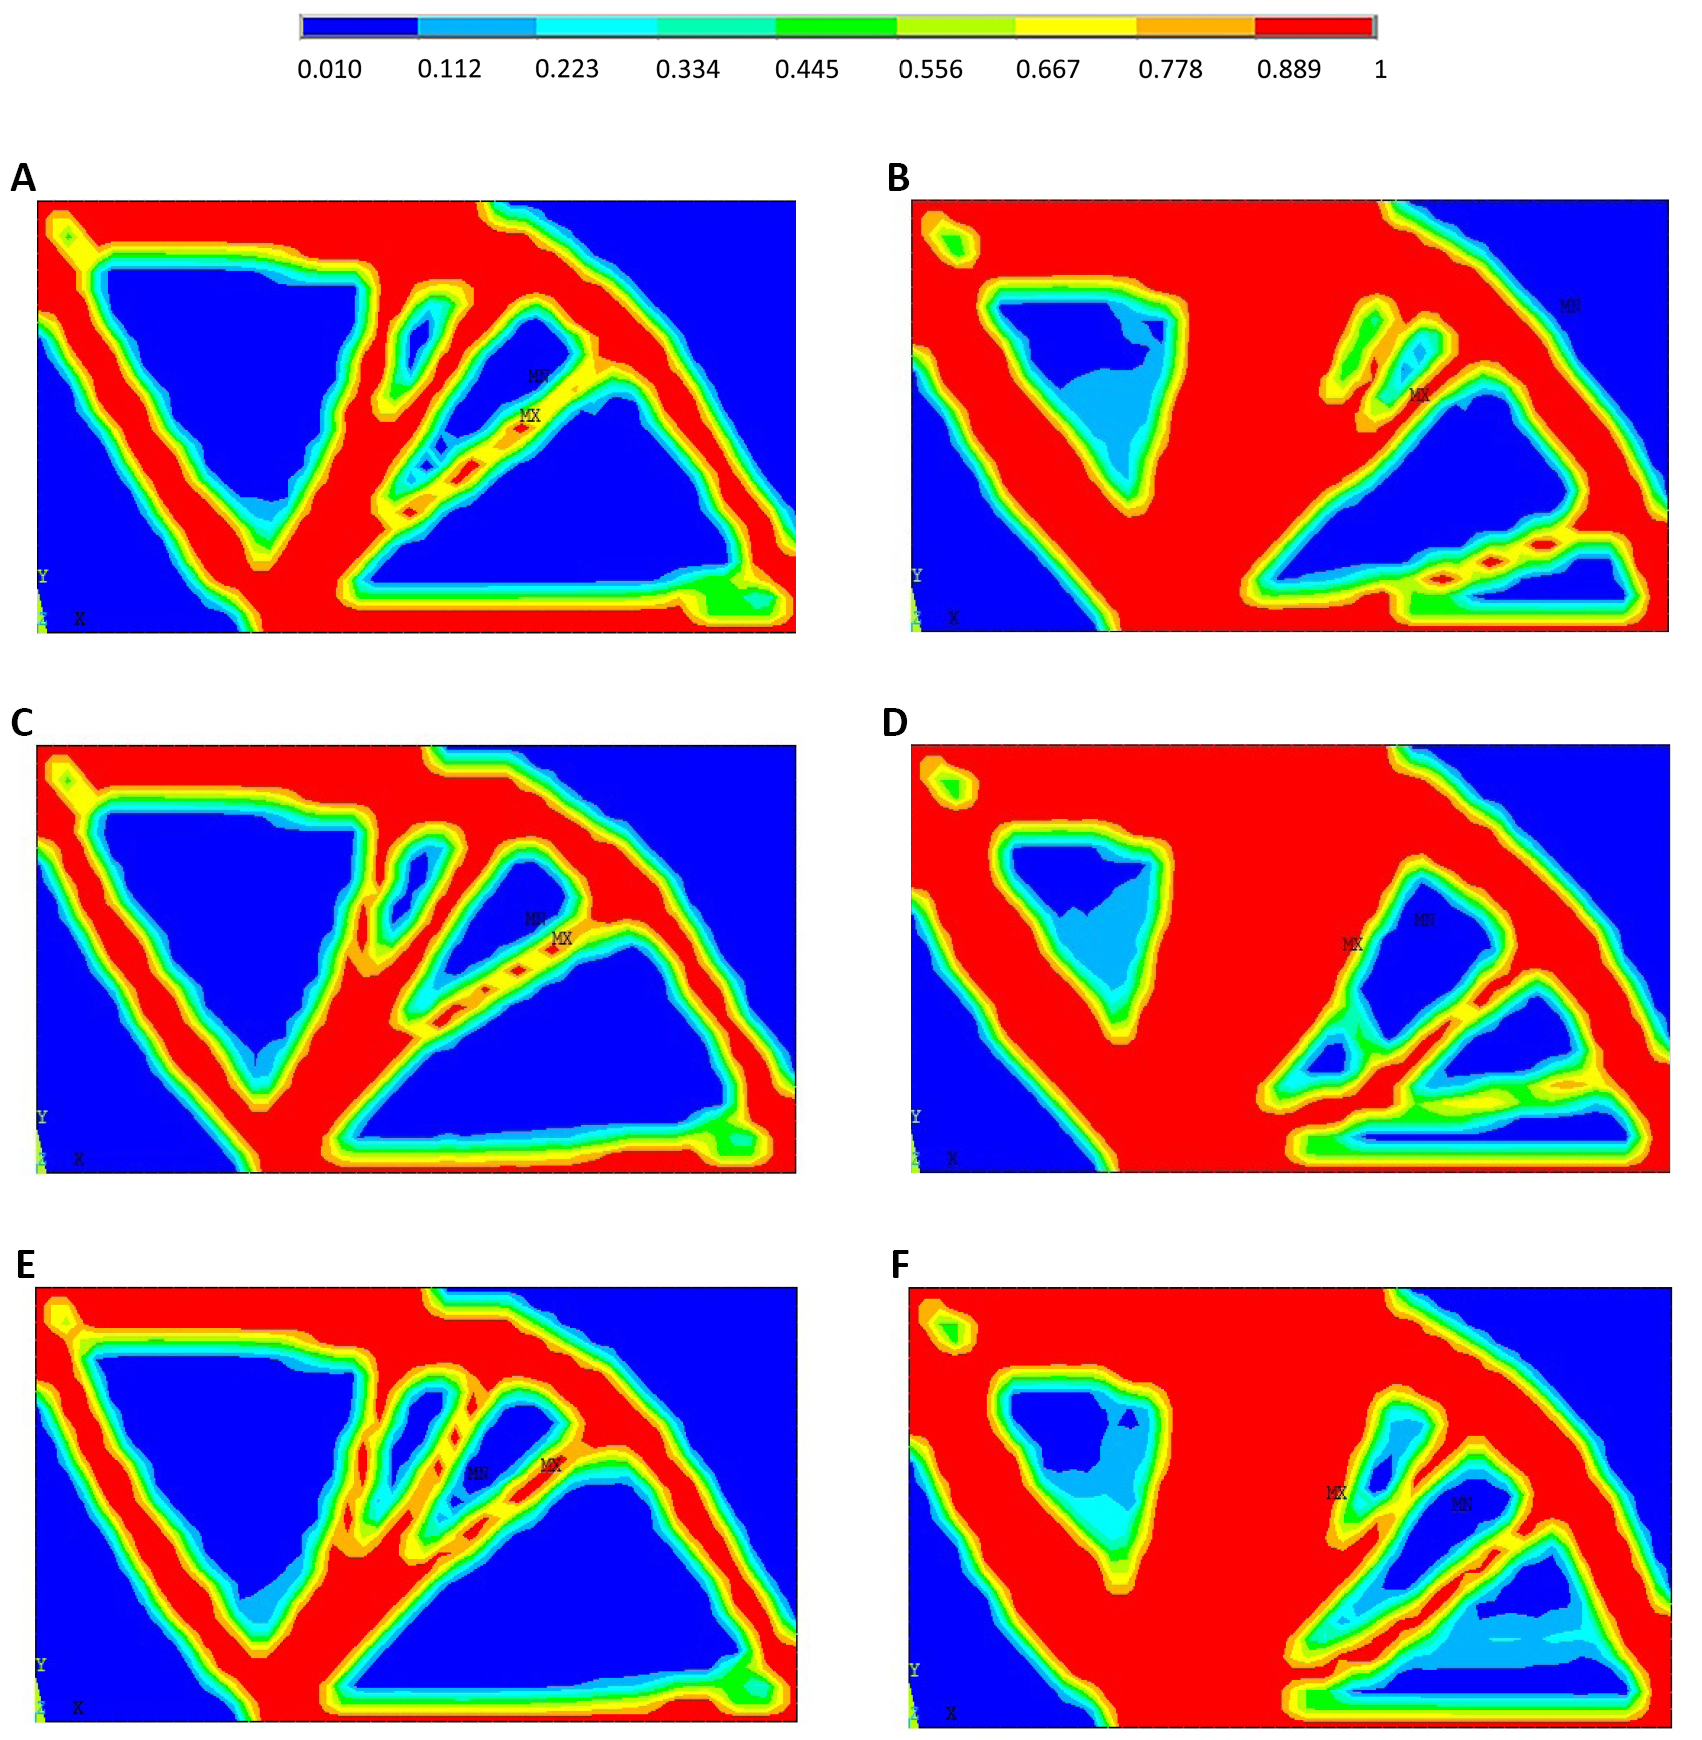
Figure 11. RBTO layouts for OI approach (A, C, and E) and OR approach (B, D and F) when considering the third study (S3).
As shown in Figure 11 for (S3), the OR approaches largely lead to different layouts when varying the reliability index values, while the OI approaches do not lead to any changes. The RBTO solutions are also different than those provided by DTO for both OBA and PBA (see Figure 3A and B).
3.2.3.2 S3 Using PR&PI Approaches
For S3 when using RBTO-PBAs, Figure 12A, C and E show the RBTO layouts when using performance-based IOSF approach for β=3, β=3.8, and β=4.25, respectively. Figure 12B, D and F show the RBTO layouts when using PR approach for β=3, β=3.8, and β=4.25, respectively.
|
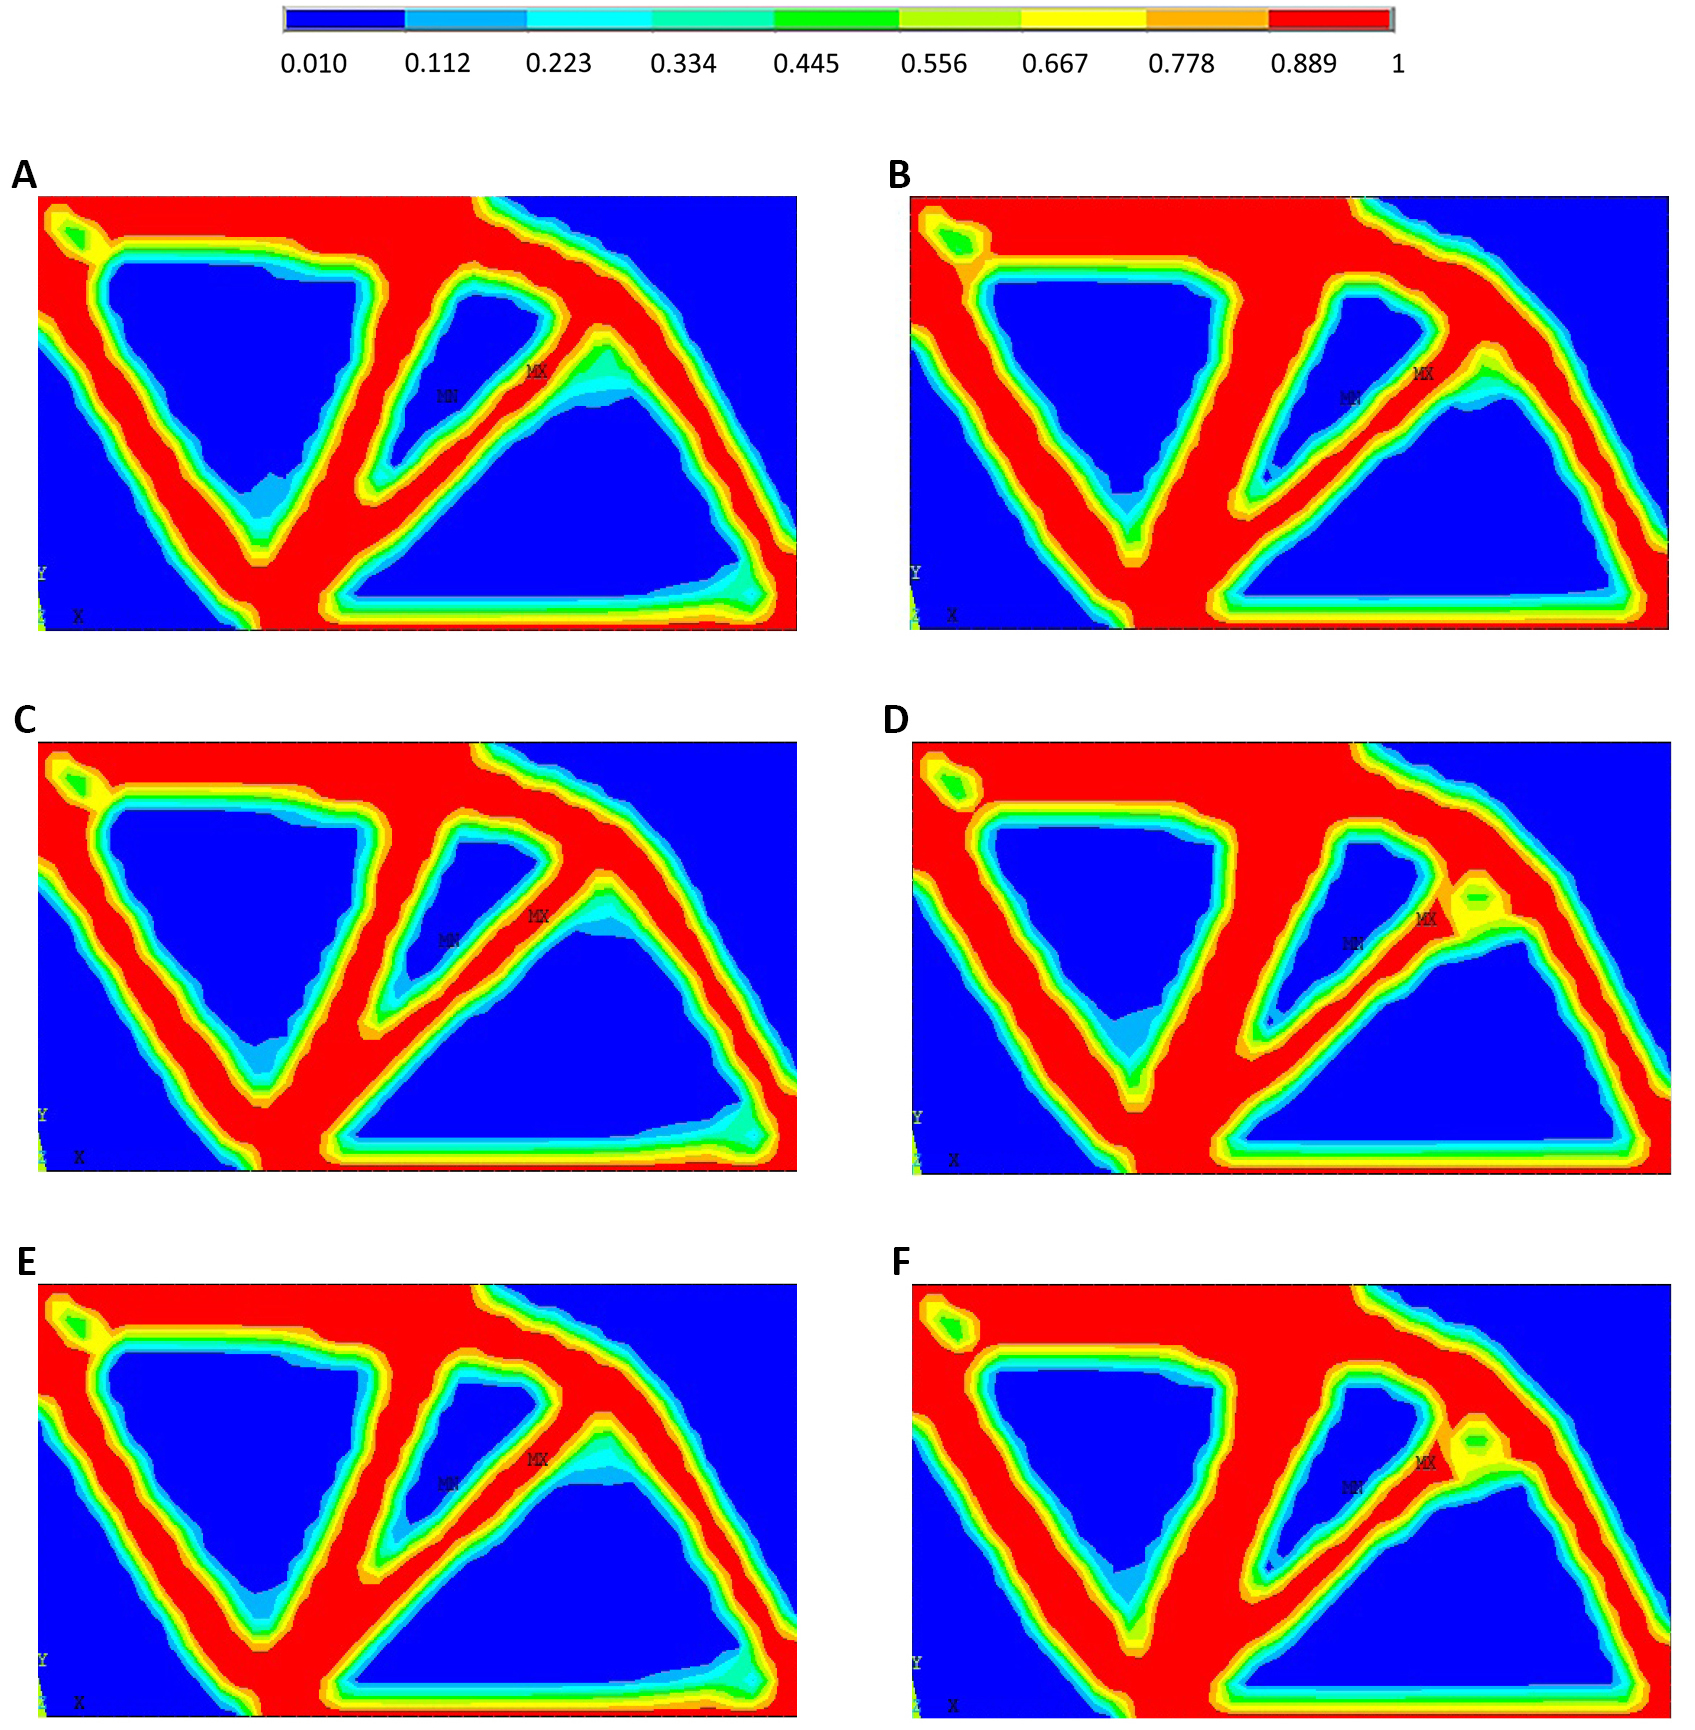
Figure 12. RBTO layouts for performance-based IOSF approach (A, C and E) and performance-based ROSF approach (B, D and F) when considering the third study (S3).
As shown in Figure 12 for (S3), the PR approach leads to a very small difference in the resulting layouts when varying the reliability index values, while there is no difference when using the performance-based IOSF approach. The RBTO solutions are also different than those provided by DTO for both OBA and PBA (see Figure 3A and B).
Figure 13 shows the structural compliance and volume changes in function of reliability index for the different approaches when considering the third case (S3). A similar tendency and results to cases (S1) and (S2) can be observed, except the intensity of increase or decrease in the compliance and volume is a bit different. When the reliability index values are increased for the OI and PI strategies, structural compliance increases less intensively than cases (S1 and S2), while structural volume decreases more sharply for OI. In contrast, when reliability index values are increased, structural compliance decreases a bit more for OR and PR strategies, while structural volume increases more, especially for OR strategies.
|
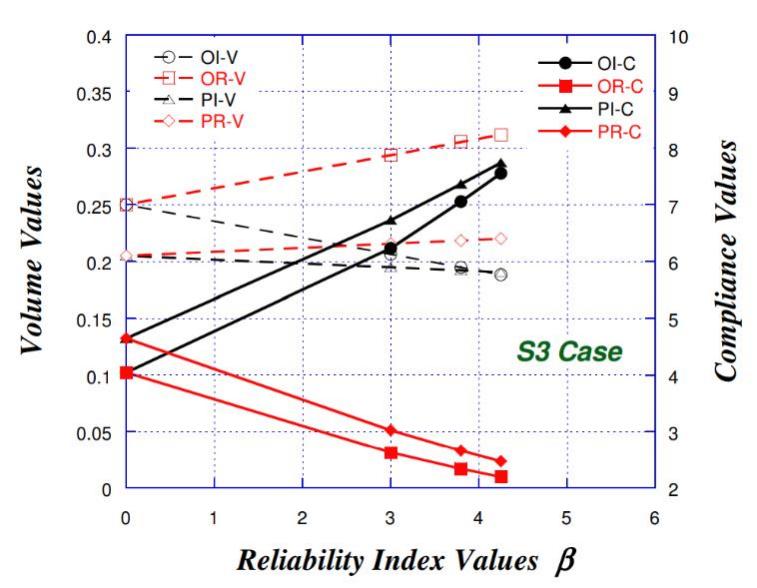
Figure 13. Structural compliance and volume change in function of reliability index for the third study (S3).
Comparing the three cases almost same tendency can be observed with slight differences in the values and intensity of changes. Overall, the PR strategy provides a better decrease in compliance and minimum change in volume.
4 DISCUSION
As shown in Tables 3 and 4, the proposed approaches (OR approach and PR approach) reduce the structural compliance when increasing the reliability index values. An increase in reliability levels results in an increase in rigidity. However, an increase in rigidity will result in an increase in volume.
For a simple topology optimization problem, when considering the OBA (Problem 1) and PBA (Problem 2) for the same given design space, two solutions can be obtained. The OBA problem represented by the minimization of compliance for a prescribed volume fraction, is the most established way in reference[26]. In this regard, the first RBTO model by GBM was associated with OBA[1], and it resulted in several solutions (only one category of solutions), not only two. The reliability is next integrated into both approaches (OBA/PBA) using IOSF and led to two categories of solutions[7]. However, in this work, two directions of categories are generated: OBA/PBA using IOSF and ROSF. In each direction, there are two categories of solutions regarding the resulting layouts and the output parameters changes (compliance and volume) in relation to the reliability index. As shown in Tables 3 and 4, for the first direction of categories (OBA/PBA using IOSF), the compliance values increase when increasing the reliability index values, while it is not the same for the second direction of categories (OBA/PBA using ROSF).
The developed ROSF approaches lead to totally different layouts when introducing the reliability index concept, except for the PR approach (Figure 12B, D and F), and for the thirst study (S3). All these resulting topologies (layouts) can be modelled as truss structures to show their advantages and disadvantages in detailed the design stage with the object of verifying the effectiveness of the proposed approaches. The interested reader can find a similar validation (benchmark) example on truss structures in reference[1]. According to the IOSF approaches, there is also no significant difference between the resulting layouts and their deterministic counterparts (Figure 3A and B). When modelling these layouts by truss structures, the sizing (or shape) optimization process may lead to very small sections for certain bars. In this way, they can be ignored, and the resulting configurations can be similar.
In addition, it was observed in our previous developments from topology optimization standpoint[1-3,6-8] that when increasing the reliability index values, the structural compliance values increase (it means the rigidity decreases). However, when considering the current developments, the rigidity increases which is suitable for the reliability analysis standpoint. To increase structural reliability levels[19], several criteria can be improved such performance, strength, rigidity, etc. In this work, a reasonable relationship between the reliability and the rigidity is provided as a predictive analysis to argue the different findings instead of performing a detailed design stage which necessitates a high time consumption. The originality of this work is to combine the advantages of the different RBTO developments in literature from two points of view. In this case, we provide the designer with several layouts with higher rigidity levels. Further work will be conducted to integrate an extension of other nonlinear distribution laws in order to compare the effects of the resulting layouts and output parameters in both directions.
5 CONCLUSION
Two new RBTO approaches, called OR approach and PR approach, are developed in this work. They combine the objective of the different RBTO developments during two decades from two standpoints in generating several layouts with an increasing rigidity level in function of reliability index increase. The robustness of these methods can be represented using the optimality conditions during the OSF formulation developments. The application of these methods is carried out to a 2D bike frame structure to provide two categories of layouts. The proposed approaches provide the most rigid frame structures. Due to the randomness of the geometrical variables, this rigidity is largely increased. The main advantage of the suggested methods is to combine the different advantages of the other existing methods by providing several layouts with high rigidity levels.
Acknowledgements
Not applicable.
Conflicts of Interest
There was no conflict of interest between the authors.
Author Contribution
Both Kharmanda G and Mulki H contributed to the manuscript and approved the final version.
Abbreviation List
APDL, ANSYS parametric design language
DTO, Deterministic topology optimization
GBM, Gradient-based method
IOSF, Inverse optimum safety factor
OBA, Objective-based approach
OC, Optimality criteria
OI, Objective-based IOSF
OR&OI, Objective-based R&IOSF
OR, Objective-based ROSF
OSF, Optimum safety factor
PBA, Performance-based approach
PR&PI, Performance-based R&IOSF
PR, Performance-based ROSF
RBDO, Reliability-based design optimization
RBTO, Reliability-based topology optimization
ROSF, Reverse optimum safety factor
S1, The first study
S2, The second study
S3, The third study
SCP, Sequential convex programming
SIMP, Solid isotropic microstructure with penalty
References
[1] Kharmanda G, Olhoff N, Mohamed A et al. Reliability-based topology optimization. Struct Multidiscip O, 2004; 26: 295-307. DOI: 10.1007/s00158-003-0322-7
[2] Kharmanda G, Olhoff N. Reliability-based topology optimization as a new strategy to generate different topologies: Proceedings of the 15th Nordic seminar on computational mechanics, Aalborg, Denmark, 11-14 October 2002. Aalborg: Aalborg University; 2002.
[3] Kharmanda G, Lambert S, Kourdi N et al. Reliability-based topology optimization for different engineering applications. Int J CAD/CAM, 2007; 7: 61-69.
[4] Patel J, Choi SK. Classification approach for reliability-based topology optimization using probabilistic neural networks. Struct Multidiscip O, 2012; 45: 529-543. DOI: 10.2514/6.2010-2596
[5] Wang L, Liu D, Yang Y et al. A novel method of non-probabilistic reliability-based topology optimization corresponding to continuum structures with unknown but bounded uncertainties. Comput Method Appl M, 2017; 326: 573-595. DOI: 10.1016/j.cma.2017.08.023
[6] Kharmanda G, Antypas I, Dyachenko A. Inverse optimum safety factor method for reliability-based topology optimization applied to free vibrated structures. J Eng Techno Syst, 2019; 29: 8-19. DOI: 10.15507/2658-4123.029.201901.008-019
[7] Kharmanda G, Antypas I, Dyachenko A. The effect of reliability index values on resulting reliability-based topology optimization configurations: Numerical validation by shape optimization. J Eng Techno Syst, 2019; 29: 322-344. DOI: 10.15507/2658-4123.029.201903.332-344
[8] Kharmanda G, Antypas I, Dyachenko A. Reliability-based topology optimization as effective strategy for additive manufacturing: Influence study of geometry uncertainty on resulting layouts. J Phys Conference S, 2020; 1679: 1-12. DOI: 10.1088/1742-6596/1679/4/042052
[9] Meng Z, Pang Y, Pu Y et al. New hybrid reliability-based topology optimization method combining fuzzy and probabilistic models for handling epistemic and aleatory uncertainties. Comput Method Appl M, 2020; 363: 112886. DOI: 10.1016/j.cma.2020.112886
[10] Pérez-Rúa JA, Lumbreras S, Ramos A et al. Reliability-based topology optimization for offshore wind farm collection system. Wind Energy, 2021; 225: 1-19. DOI: 10.1002/we.2660
[11] Bae K, Wang S. Reliability-based topology optimization. Proceedings of 9th AIAA/ISSMO Symposium on Multidisciplinary Analysis and Optimization, Athens, Greece. 4-6 September 2002. DOI: 10.2514/6.2002-5542
[12] Jung HS, Cho S, Yang YS. Reliability-based robust topology design optimization of nonlinear structures: World Congress of Structural and Multidisciplinary Optimisation, Lido di Jesolo, Italy. 19-23 May 2003. Pavia: University of Pavia; 2003.
[13] Agarwal H. Reliability based design optimization: formulations and methodologies. [PhD thesis], Indiana, USA: University of Notre Dame; 2004.
[14] Patel NM, Agarwal H, Tovar A et al. Reliability based topology optimization using the hybrid cellular automaton method. Proceedings of the 1st AIAA Multidisciplinary Design Optimization Specialist Conference, Austin, Texas. 18-21 April 2005. DOI: 10.2514/6.2005-2134
[15] Eom YS, Yoo KS, Park JY et al. Reliability-based topology optimization using a standard response surface method for three-dimensional structures. Struct Multidiscip O, 2011; 43: 287-295. DOI: 10.1007/s00158-010-0569-8
[16] Jalalpour M, Tootkaboni. M. An efficient approach to reliability-based topology optimization for continua under material uncertainty. Journal of Struct Multidiscip O, 2016; 53: 759-772. DOI: 10.1007/s00158-015-1360-7
[17] Yin F, Dang K, Yang W et al. An efficient approach to reliability-based topology optimization for the structural lightweight design of planar continuum structures. J Mech, 2021; 37: 270-281. DOI: 10.1093/jom/ufaa019
[18] Tauzowski P, Błachowski B, Lógó J. Topology optimization of elasto-plastic structures under reliability constraints: A first order approach. Comput Struct, 2021; 243: 106406. DOI: 10.1016/j.compstruc.2020.106406
[19] Kharmanda G, El-Hami A. Biomechanics: Optimization, Uncertainties and Reliability. John Wiley & Sons: State of New Jersey, USA, 2017.
[20] Sigmund O, Maute K. Topology optimization approaches. Struct Multidisc Optim, 2013; 48: 1031-1055. DOI: 10.1007/s00158-013-0978-6
[21] Zhang W, Zhu J, Gao T. Topology optimization in engineering structure design. Elsevier: Amsterdam, Netherlands, 2016.
[22] Jain N, Bankoti S, Saxena R. Topological optimization of isotropic material using optimal criteria method. Int J Res Emerg Sci Techno, 2015; 2: 41-47.
[23] Svanberg K. The method of moving asymptotes - a new method for structural optimization. Int J Numer Meth Eng, 1987; 24: 359-373. DOI: 10.1002/nme.1620240207
[24] Zillober C. A globally convergent version of the method of moving asymptotes. Struct O, 1993; 6: 166-174. DOI: 10.1007/BF01743509
[25] Ni Q, Zillober Ch, Schittkowski K. Sequential convex programming methods for solving large topology optimization problems: Implementation and computational results. J Comput Math, 2005; 23: 491-502.
[26] Mozumder C, Renaud JE. An investigation of reliability-based topology optimization: 11th AIAA/ISSMO Multidisciplinary Analysis and Optimization Conference, Virginia, USA, 6-8 September 2006. DOI: 10.2514/6.2006-7058
[27] Strömberg N. Efficient detailed design optimization of topology optimization concepts by using support vector machines and metamodels. Eng Optimiz, 2020; 52: 1136-1148. DOI: 10.1080/0305215X.2019.1646258
[28] Kharmanda G, Antypas I. Efficient optimum safety factor approach for system reliability-based design optimization with application to composite yarns. Adv Eng Res, 2019; 19: 221-230. DOI: 10.23947/1992-5980-2019-19-3-221-230
[29] Lin CC, Huang SJ, Liu CC. Structural analysis and optimization of bicycle frame designs. Adv Mech Eng, 2017; 9: 1-10. DOI: 10.1177/1687814017739513
[30] Ni Q, Zillober Ch, Schittkowski K. Sequential convex programming methods for solving large topology optimization problems: Implementation and computational results, J Comput Math, 2005; 23: 491-502.
[31] Mallika A. Ramana Rao NV. Topology optimization of structures for minimum structural compliance. IUP J Struct Eng, 2012; 5: 4.
[32] Da Silva GA, Beck AT. Reliability-based topology optimization of continuum structures subject to local stress constraints. Struct Multidiscip O, 2018; 57: 2339-2355. DOI: 10.1007/s00158-017-1865-3
[33] dos Santos RB, Torii AJ, Novotny AA. Reliability-based topology optimization of structures under stress constraints. Numer Meth Eng, 2018; 114: 660-674. DOI: 10.1002/nme.5760
[34] Wang L, Cai Y, Liu D. Multiscale reliability-based topology optimization methodology for truss-like microstructures with unknown-but-bounded uncertainties, Comput Method Appl M, 2018; 339: 358-388. DOI: 10.1016/j.cma.2018.05.003
[35] Gao Y, Liu Y. Reliability-based topology optimization with stochastic heterogeneous microstructure properties. Mater Design, 2021; 205: 109713. DOI: 10.1016/j.matdes.2021.109713
Copyright ©2022 The Author(s). This open-access article is licensed under a Creative Commons Attribution 4.0 International License (https://creativecommons.org/licenses/by/4.0), which permits unrestricted use, sharing, adaptation, distribution, and reproduction in any medium, provided the original work is properly cited.


