
Perfect-absorption, High-sensitivity, and Low-thickness THz Gas Sensor Based on Tamm Plasmon Polaritons
Mir Hamid Rezaei1*
1Department of Communications and Electronics, School of Electrical and Computer Engineering, Shiraz University, Shiraz, Iran
*Correspondence to: Mir Hamid Rezaei, PhD, Researcher, Department of Communications and Electronics, School of Electrical and Computer Engineering, Shiraz University, Jomhoori Eslami Blvd, Shiraz, 71946-84471, Iran; Email: m.h.rezaei@shirazu.ac.ir
DOI: 10.53964/id.2024024
Abstract
In this paper, an ultra-high sensitivity and low-thickness gas sensor based on the excitation of Tamm plasmon polaritons (TPPs) and Fabry-Perot resonances in the frequency range of 0.1 to 1THz is presented. The sensor consists of a graphene sheet, a spacer layer, a gas tank, and a one-dimensional dielectric-metallic photonic crystal (DM-PhC). The transfer matrix method is used to evaluate the effects of various parameters, including the presence of the graphene sheet, the number of periods, the chemical potential of graphene, and the thickness of the layers, on the absorption spectrum of the sensor. The simulation results reveal that the presence of the graphene sheet is mandatory for exciting TPPs. Additionally, the use of a DM-PhC enhances the absorption and reduces the thickness of the sensor. The absorption and sensitivity of the sensor can reach high values of 99.98% and 0.887THz/RIU for adjusting the geometrical parameters. The sensor benefits from high absorption and sensitivity, fabrication-friendly structure, tunability by the chemical potential of graphene, and low thickness. The proposed sensor can find many applications in industrial fields.
Keywords: DM-PhC, sensitivity, graphene, Tamm plasmon polariton, transfer matrix method
1 INTRODUCTION
Electromagnetic surface waves (ESWs) are electromagnetic waves that propagate along the interface of two materials. However, they are severely attenuated inside the materials[1,2]. The strong confinement of light and the narrow spectrum pave the way for the development of photonic integrated circuits. ESWs, known as surface plasmon polaritons (SPPs), are excited at the interface between a metal and a dielectric[3]. SPPs are very sensitive to changes in the refractive index of the materials. Therefore, SPPs are a good candidate for sensing applications. SPP-based sensors can be used to detect biomolecules[4,5], chemical substances[6,7], temperature[8,9] and pressure[10]. However, SPP-based devices face several drawbacks. For the excitation of SPPs, the wave vector of the incident light must match that of the surface plasmon wave. Therefore, the excitation of SPPs is not straightforward, and phase-matching mechanisms like diffraction grating or prism must be employed. Additionally, SPPs are polarization-dependent waves and are stimulated by incident light with transverse-magnetic (TM) polarization[11,12]. These obstacles prevent the design of integrated SPP-based sensors.
Another ESW is Tamm plasmon polaritons excited at the interface between a metal film and a distributed bragg reflector (DBR)[13,14]. Initially, Kaliteevski et al. 2007 theoretically proposed the existence of TPPs[15]. Since the dispersion curve of the Tamm state lies within the light cone, no optical component is required for excitation, unlike SPPs. Moreover, TPPs are excited by any incident polarization and at any angle of incidence. The spectral response of both SPPs and TPPs depends on the geometrical parameters and materials of the structure, as well as the operating frequency[13-16]. It has been reported that a one-dimensional photonic crystal (PhC) can be used instead of a DBR. In addition, a graphene sheet can replace the metal film to excite TPPs in the terahertz (THz) range[17]. THz waves with frequencies of about 0.1 to 10THz have many applications in information and communication technology, imaging, security, medicine, and industry. The bandwidth of TPPs is narrower than that of SPPs. Therefore, TPPs show a larger resonant mode when the local field increases[18]. The first TPP-based refractive index sensor was proposed by Zhang et al[19]. After that, various TPP-based refractive index sensors were presented for the detection of fluids[20], gases[21], and blood components[22], as well as for temperature[23] sensing. Das et al.[16] described a refractive index sensor based on a Tamm Fabry-Perot hybrid resonance. It has a sensitivity of 87nm/RIU, and a figure of merit (FOM) of 7.5RIU-1 for refractive index ranges from 1.25 to 1.38. The sensor consists of a Bragg mirror and a silver (Ag) grating, and the hybrid resonance occurs at the interface between the Bragg mirror and the metal grating. Hu et al. reported a multi-channel refractive index sensor using graphene and a hybrid Tamm plasmonic structure[18]. It consists of two identical Ag-DBR structural units joined together to form a symmetric structure. The highest values for sensitivity and FOM were 950nm/RIU and 161RIU-1, respectively. A THz gas sensor based on TPPs was presented by Zaky et al[24]. The sensor consists of a gas cavity located between a one-dimensional porous silicon PhC and an Ag layer deposited on a prism. The sensitivity of the sensor is 1.9×10nm/RIU.
All of the above sensors are composed of all-dielectric PhCs (AD-PhC) and are very thick. It is worth mentioning that PhCs can be divided into all-dielectric and dielectric-metallic PhCs (DM-PhC), depending on the materials forming them. AD-PhCs consist of two dielectric materials arranged alternately next to each other. DM-PhCs, on the other hand, are formed by stacking dielectric and metallic layers[25,26]. To date, much research has been done in the field of AD-PhCs, while DM-PhCs have received much less attention. In this paper, we will show that DM-PhC-based structures benefit from the advantages of stronger resonances and thinner thickness compared to AD-PhC-based structures. In this context, the performance of a high-sensitivity gas sensor based on the excitation of TPPs in the THz range from 0.1 to 1THz is evaluated using the modified transfer matrix method (TMM).
2 MATERIALS AND METHODS
2.1 Proposed Sensor
The proposed sensor is schematically shown in Figure 1. It consists of a graphene sheet, a thin dielectric spacer layer, a gas tank, and a DM-PhC, all placed on a dielectric substrate. The PhC consists of N periods of alternating dielectric (D) and metallic (M) layers. The period of the PhC is a=TD+TM, where TD and TM represent the thickness of the dielectric and metallic layers, respectively. The total thickness of the PhC is equal to N×a. The thickness of the graphene sheet is 0.34nm. Additionally, the thickness of the spacer and the gas tank is denoted by TS and TG, respectively. The refractive indices of the gas tank, the spacer layer, and the dielectric layers are specified by nGas, nS, and nD, respectively. The dielectric constant of the metallic layers is shown by εM. The incident light with a wavenumber of k0 and an incident angle of θ0 irradiates the surface of the sensor. The gas entry vent is seen in the figure. The PhC part of the sensor can be easily fabricated using traditional deposition approaches, such as chemical vapor deposition (CVD), atomic layer deposition (ALD), and sputtering methods[27-29]. Also, it is possible to grow CVD graphene on copper and then transfer it on the spacer layer by utilizing the wet transfer method[30,31].
|
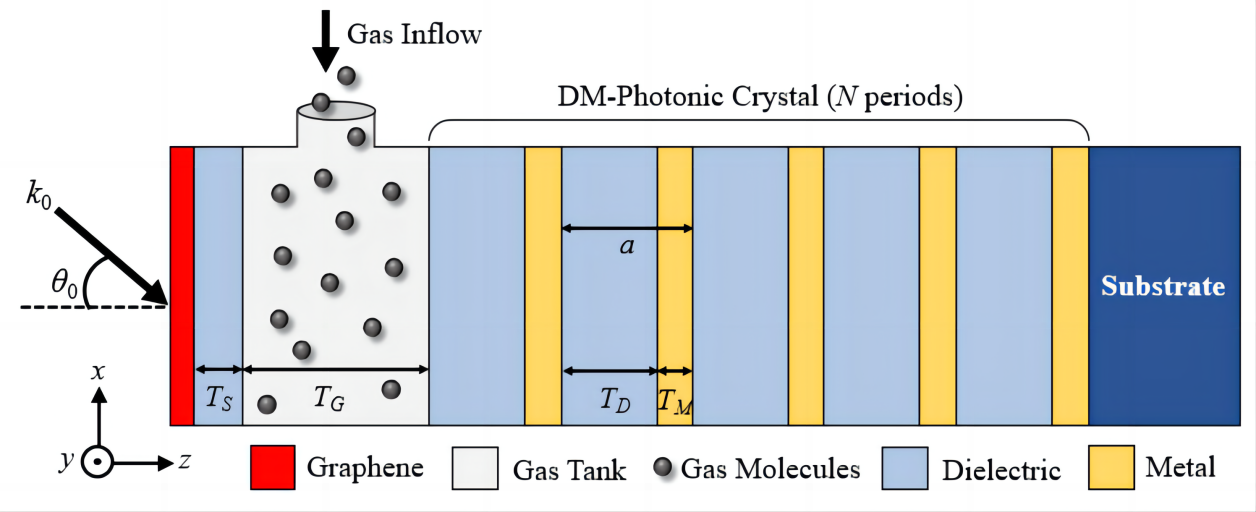
Figure 1. Schematic of the Proposed Gas Sensor.
2.2 Modified TMM
The modified TMM is used to achieve the spectra response of the proposed sensor. The proposed sensor’s structure can be considered as a system with a graphene sheet on the left side and a DM-PhC on the other side. For TG>TS and nGas≈nS, two amplitude reflection coefficients (rGraphene and rPhC) arise when light hits the graphene sheet, as shown in Figure 2. The reflection coefficient for light propagating in the -z direction is represented by the parameter rGraphene and the reflection coefficient for light propagating in the +z direction is represented by the parameter rPhC. The amplitude matching requirement must be met to stimulate TPPs. The transfer matrix approach yields the following formula for light propagation in the top layer cavity[32].
$$ {A}\left(\genfrac{}{}{0pt}{}{1}{{{r}}_{{G}{r}{a}{p}{h}{e}{n}{e}}}\right)=\left(\genfrac{}{}{0pt}{}{{e}{x}{p}\left({i}\varnothing \right)}{0}\right.\left.\genfrac{}{}{0pt}{}{0}{{e}{x}{p}\left(-{i}\varnothing \right)}\right)\left(\genfrac{}{}{0pt}{}{{{r}}_{PℎC}}{1}\right)\left(1\right)$$
where ϕ is the phase change caused by light traveling through the gas tank, and A is a constant. Following a series of mathematical simplifications and after eliminating the coefficient A, the excitation condition of Tamm plasmons can be obtained as follows[32]:
$$ {r}_{Grap{h}{e}{n}{e}}{r}_{P{h}{C}}exp\left(2i\varnothing \right)\approx 1\left(2\right)$$
Equation (2) can be further simplified in the form of
$$ \left|{r}_{Grap{h}{e}{n}{e}}{r}_{P{h}{C}}\right|\approx 1\left(3\right)$$
And
$$ {A}{r}{g}\left({r}_{Grap{h}{e}{n}{e}}{r}_{P{h}{C}} exp\left(2i\varnothing \right)\right)\approx 0\left(4\right)$$
|
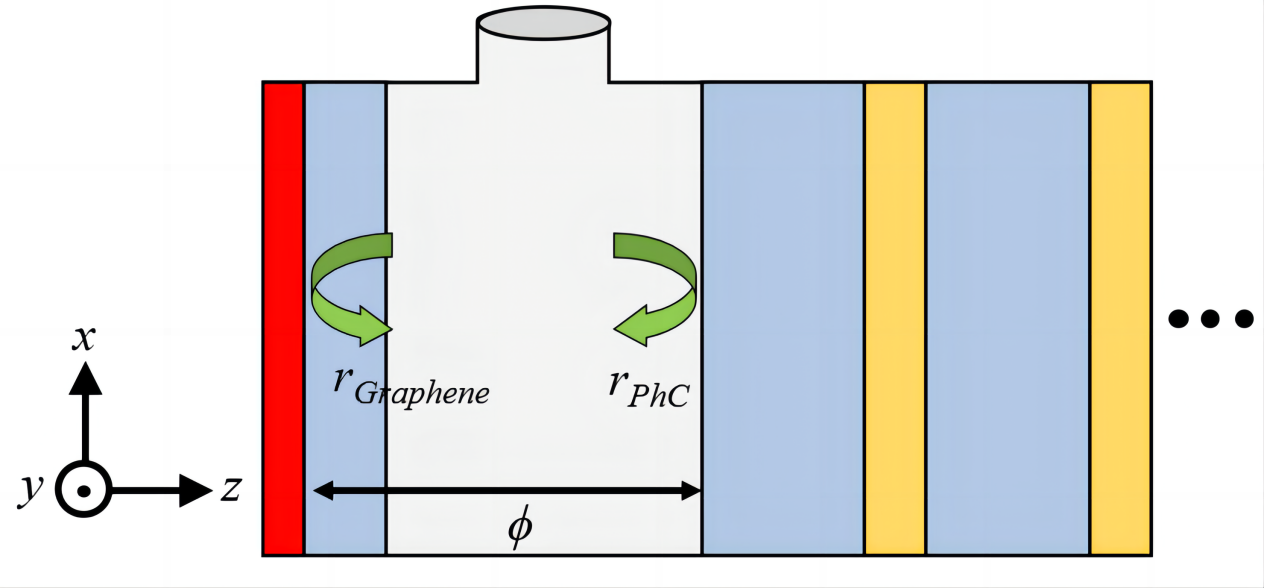
Figure 2. Reflection Waves in the Sensing Region.
For a P-polarized incident wave, the transmission characteristics of light through the interface between the mth layer and the nth layer in the existence of the graphene sheet is calculated by the Dmn matrix as follows[32]:
$$ {D}_{mn=}\frac{1}{2}\left[\begin{array}{cc}1+{ŋ}_{p}+{\xi }_{p}& 1-{ŋ}_{p}-{\xi }_{p}\\ 1-{ŋ}_{p}+{\xi }_{p}& 1+{ŋ}_{p}-{\xi }_{p}\end{array}\right]\left(5\right)$$
where
$$ {ŋ}_{p}=\frac{{\epsilon }_{m}{k}_{nz}}{{\epsilon }_{n}{k}_{mz}}\left(6\right)$$
$$ {\xi }_{p}=\frac{\sigma {k}_{nz}}{{\omega \epsilon }_{0}{\epsilon }_{n}}\left(7\right)$$
$$ {k}_{mz}={k}_{0}\sqrt{{\epsilon }_{m}-{\epsilon }_{0}{\mathit{sin}}^{2}{\theta }_{0}}\left(8\right)$$
$$ {k}_{nz}={k}_{0}\sqrt{{\epsilon }_{n}-{\epsilon }_{0}{\mathit{sin}}^{2}{\theta }_{0}}\left(9\right)$$
Here, ε0 and σ are the dielectric constant of free space and the surface conductivity of graphene, respectively. In addition, εm and εn are the permittivity of the mth and nth layers, respectively. It is important to note that a P-polarized light, also known as a TM mode, is a light wave with an electric field vector in the plane of incidence. In contrast, an S-polarized light, also known as a transverse electric (TE) mode, has an electric field vector that is perpendicular to the plane of incidence[26]. For an S-polarized wave, the Dmn matrix is as follows[32]:
$$ {D}_{mn=}\frac{1}{2}\left[\begin{array}{cc}1+{ŋ}_{s}+{\xi }_{s}& 1-{ŋ}_{s}-{\xi }_{s}\\ 1-{ŋ}_{s}+{\xi }_{s}& 1+{ŋ}_{s}-{\xi }_{s}\end{array}\right]\left(10\right)$$
where
$$ {ŋ}_{S}=\frac{{{k}}_{{n}{z}}}{{{k}}_{{m}{z}}}\left(11\right)$$
$$ {\xi }_{s}=\frac{{\omega }{\sigma }{{\mu }}_{0}}{{{k}}_{{m}{z}}}\left(12\right)$$
Here, µ0 is the permeability of the free space. With the application of the Dmn matrices, the transmission and reflection spectra for P and S polarizations are obtained. Therefore, the absorption spectrum A(f) is obtained as follows[33]:
$$ {A}\left(f\right)=1-R\left(f\right)-T\left(f\right)\left(13\right)$$
where R(f) and T(f) denote the reflection and transmission spectra, respectively.
2.3 Modeling the Structure
The performance of the proposed sensor is evaluated using the analytical TMM approach. We employed the commercial Ansys Lumerical software[34] to simulate the suggested structure. The graphene sheet can be modeled by its surface conductivity (σ) using the Kubo formula as follows[35]:
$$ {\sigma }\left({\omega },{{\mu }}_{{c}},{\Gamma },T\right)=\frac{{i}{{e}}^{2}{{k}}_{{B}}T}{{\pi }{ħ}^{2}\left(\omega +i2{\Gamma }\right)}\left[\frac{{{\mu }}_{{c}}}{{{k}}_{{B}}{T}}+2{ln}\left(1+{{e}}^{-\frac{{{\mu }}_{{c}}}{{{k}}_{{B}}T}}\right)\right]$$
$$ +\frac{{i}{{e}}^{2}}{4{\pi }ħ}{ln}\frac{2\left|{{\mu }}_{{c}}\right|-\left(\omega +i2{\Gamma }\right)ħ}{2\left|{{\mu }}_{{c}}\right|+\left(\omega +i2{\Gamma }\right)ħ}\left(14\right)$$
The graphene surface conductivity depends on several variables, including angular frequency (ω), chemical potential (μc), scattering rate (Γ), and temperature (T). The parameters e, ħ, and kB are constant coefficients, including the electron charge, reduced Planck’s constant, and Boltzmann's constant, respectively. The charge carrier density of graphene is controlled by applying chemical doping or an external voltage[36]. A change in charge carrier density affects the chemical potential and, consequently, the surface conductivity of graphene. Assuming T=300°K and Γ=0.11meV, the real and imaginary parts of the surface conductivity of graphene in the frequency range of 0.1 to 1THz are plotted in Figure 3, where μc values vary from 0.1 to 0.9eV in steps of 0.2eV.
It is assumed that the gas, spacer layer, and dielectric layers are of non-dispersive materials and can be described by a simple refractive index. The dielectric constant of the metallic layers is modeled using the Drude-Lorentz model as follows[37]:
$$ {\epsilon }\left({\omega }\right)={{\epsilon }}_{r,{\infty }}+\sum _{{k}=0}^{{K}}\frac{{{f}}_{{k}}{\omega }_{{p}}^{2}}{{\omega }_{{k}}^{2}-{\omega }^{2}+{{j}\omega {\Gamma }}_{k}}\left(15\right)$$
where εr,∞ is the dielectric constant at infinite frequencies and ωp is the plasma frequency. In addition, the parameters fk, ωk, and Γk are the strength, resonant frequency, and damping frequency of the kth oscillator, respectively. The Drude-Lorentz model incorporates the effects of bound electrons into the original Drude model. The validity range of the Drude model can be extended by including the Lorentz term. The Lorentz-Drude model uses K-damped harmonic oscillators to characterize small resonances in the spectral response of metals[37]. As a high-loss metal, tungsten (W) is selected for metallic parts of the PhC. In addition to high losses of W metal, this metal shows a better performance at high operating temperatures than other metals, such as gold (Au), Ag, chromium (Cr), copper (Cu), and Titanium Nitride (TiN), due to its high melting point of 3,422℃ [38,39]. The coefficients of the Drude-Lorentz model for W metal are taken from Ref[40]. Figure 4 shows the real and imaginary parts of the dielectric constant of W in the frequency range of 0.1-1THz.
|
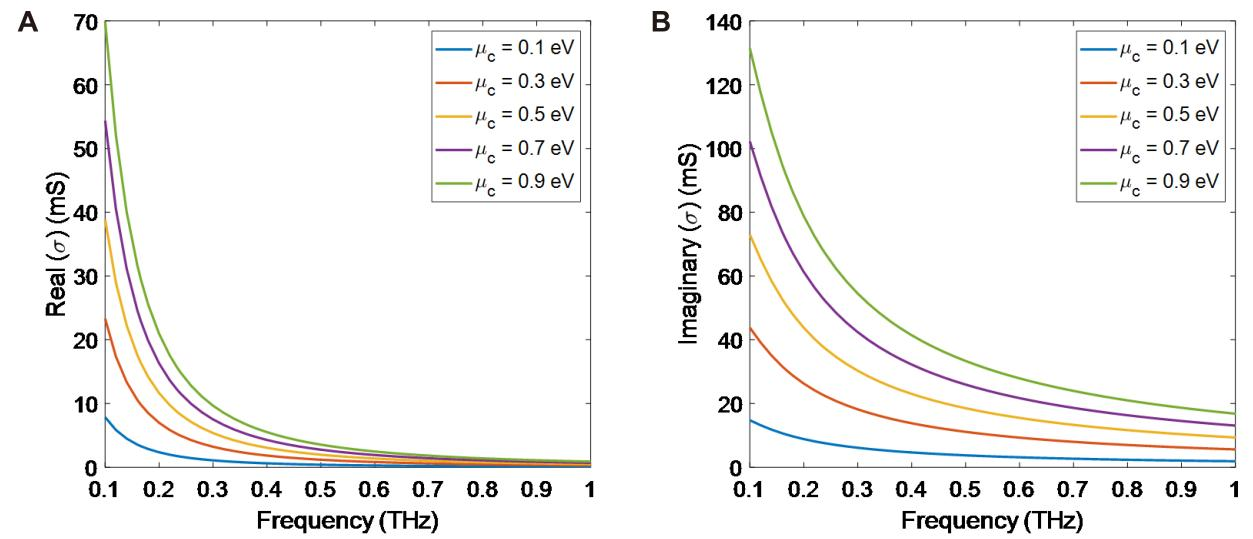
Figure 3. The Graphene Surface Conductivity for Different Values of Chemical Potentials. A: Real parts; B: Imaginary parts.
|
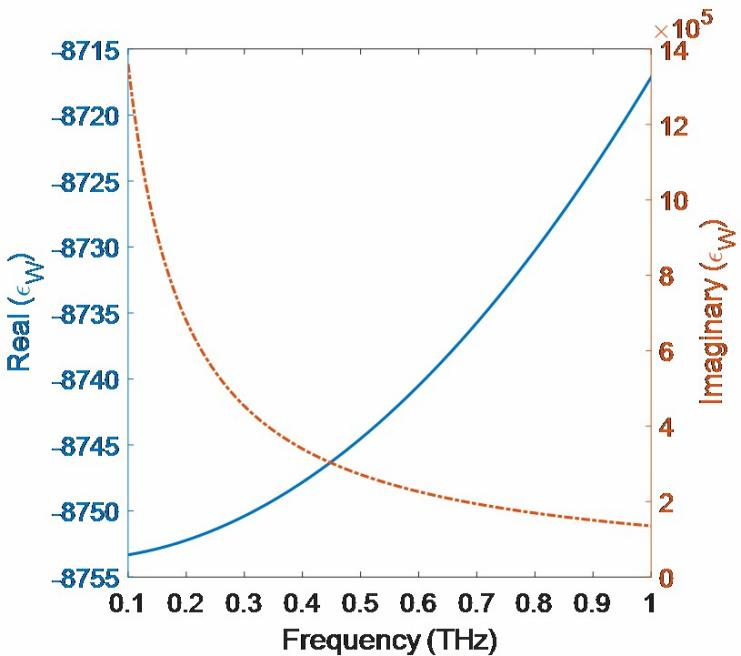
Figure 4. Real and Imaginary Parts of the Dielectric Constant of Tungsten (W) Metal in the Frequency Range of 0.1-1THz.
3 RESULTS AND DISCUSSION
It is assumed that the initial values of the sensor’s parameters are TS=0.5µm, TG=1mm, TD=1µm, TM=10nm, nGas=1, nS=nD=3.53, M=W, µc=0.5eV, θ0=0°, and N=4. Figure 5 demonstrates the sensor's reflection, transmission, and absorption spectra in the presence and absence of the graphene sheet. In the presence of the graphene sheet, six resonances are seen in the reflection spectrum in the frequency range of 0.1-1THz (Figure 5A). The transmission is zero due to the use of DM-PhC. In other words, the ultra-thin metal layers of the PhC prevent light propagation toward the outside of the sensor. As a result, six absorption peaks are observed exactly at the reflection resonance frequencies. As seen in Figure 5B, there is no resonance in the reflection spectrum when the graphene sheet is removed. Almost all the incident light is reflected, and a negligible amount (less than 10%) is absorbed. In this case, TPPs are not stimulated; therefore, no resonance occurs, and the small amount of absorption is due to materials’ losses.
|
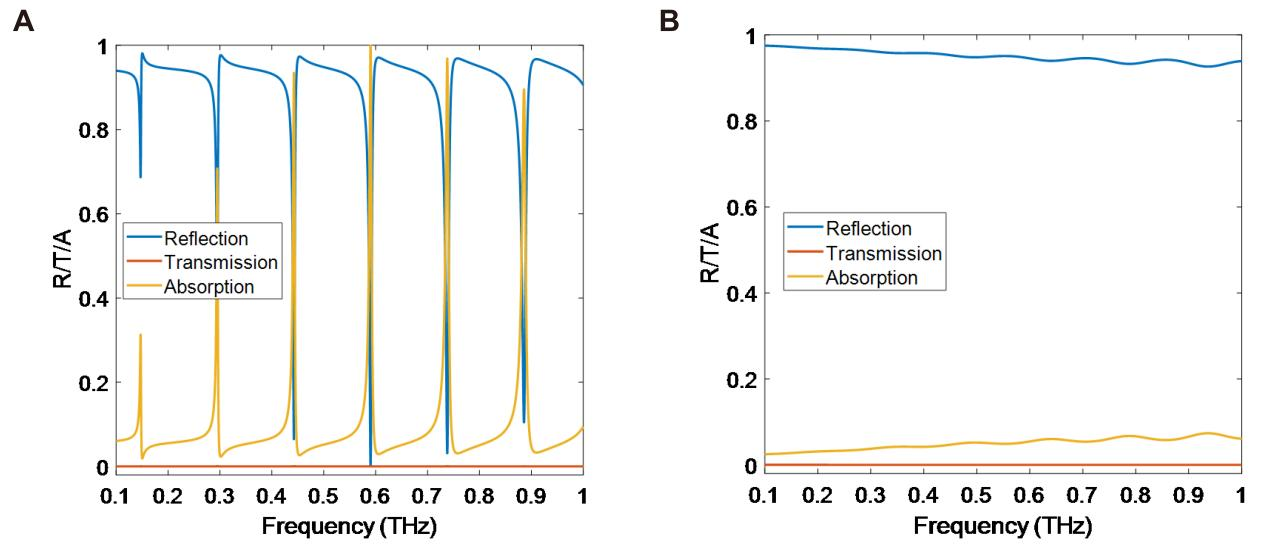
Figure 5. Spectral Response of the Proposed Sensor in the (A) Presence and (B) Absence of the Graphene Sheet.
It was expressed that the thin metallic layers in the PhC make the transmission equal to zero and cause strong resonances in the reflection spectrum. For this purpose, dielectric layers with a refractive index of nD2=1.9 replace the metallic layers of the PhC, and the spectral response of the sensor is plotted. The thickness of both dielectric layers (TD1 and TD2) is equal to 1µm. The refractive index of the first dielectric layer (nD1) is 3.53. It should be noted that changing the order of the dielectric layers (with a thickness of 1µm) does not affect the absorption spectrum of the sensor. In this case, several resonances are observed in the reflection and transmission spectra, especially at the higher frequencies (Figure 6). Unlike the DM-PhC-based structure, the transmission is not zero and has a significant value at resonance frequencies in the AD-PhC-based structure. In this structure, a small amount of incident light is absorbed, and the rest is either reflected or passes through the structure. This structure has a thicker thickness compared to the DM-PhC-based structure, and its spectral response is not appropriate for sensing applications.
|
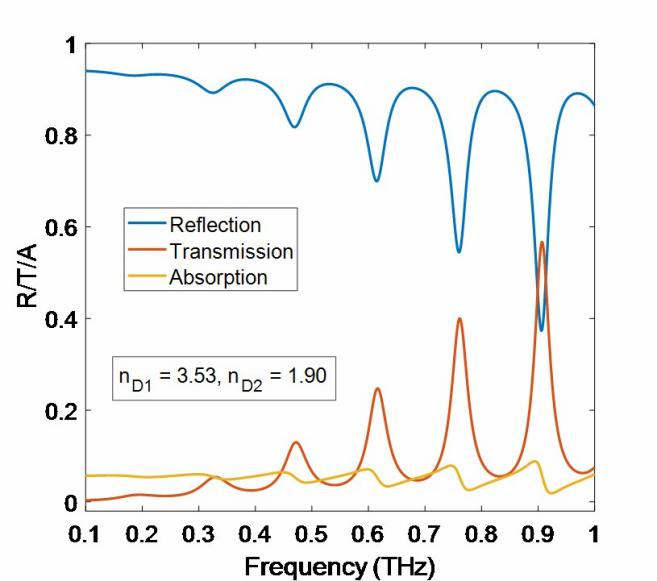
Figure 6. Spectral Response of the Sensor with an AD-PhC.
Now, we find that utilizing DM-PhC instead of AD-PhC reduces the thickness of the sensor and causes higher absorption peaks. Knowing this, the effect of the number of periods of the DM-PhC is discussed. Figure 7 shows the absorption spectrum of the sensor for different number of periods. When N=0, there is no PhC, and the gas tank is connected to the substrate. Therefore, no absorption occurs within the sensor’s structure. When N=1, strong resonance peaks appear in the absorption spectrum. Increasing the number of periods leads to a slight change in the absorption of the structure. The two zoomed-in figures show this matter.
|
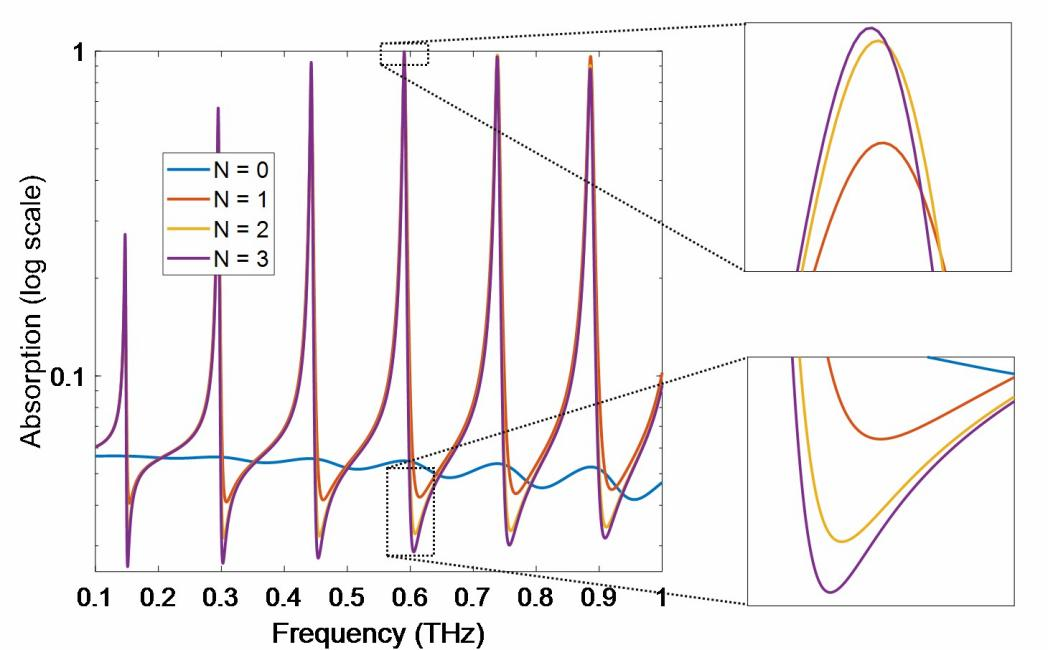
Figure 7. Effect of the Number of Periods on Absorption Spectrum of the Sensor.
As a gas sensor, the proposed sensor must recognize small changes in the refractive index in the gas tank. The absorption spectrum of the sensor in the frequency range of 0.5-0.6THz (the fourth resonance in the frequency range of 0.1-1THz) for nGas changes is illustrated in Figure 8, where nGas changes from 1 to 1.1 with steps 0.02. The resonant frequencies and the corresponding absorption values are summarized in Table 1.
|
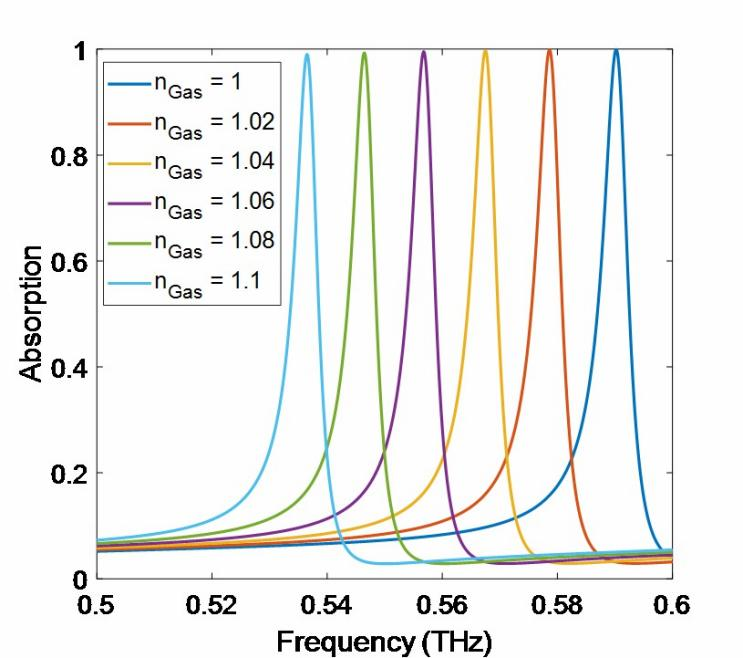
Figure 8. Absorption Spectrum of the Suggested Sensor for Different Gas Refractive.
Table 1. Resonant Frequency and Absorption Value of the Sensor for Different Values of nGas
Gas Refractive Index (nGas) |
1 |
1.02 |
1.04 |
1.06 |
1.08 |
1.1 |
Resonant frequency (THz) |
0.5902 |
0.5787 |
0.5675 |
0.5568 |
0.5464 |
0.5365 |
Absorption (%) |
99.95 |
99.88 |
99.74 |
99.55 |
99.32 |
99.05 |
The sensitivity (S) of the sensor is evaluated using the following equation[41]:
$$ {S}=\left|\frac{∆{f}}{{∆{n}}_{{G}{a}{s}}}\right|\left(\frac{{T}{H}{z}}{{R}{I}{U}}\right)\left(16\right)$$
where Δf=f2–f1 is the resonant frequency displacement due to the refractive index change of ΔnGas=nGas,2–nGas,1. The more the resonant frequency displacement, the more the sensor sensitivity. Considering nGas,1=1 and nGas,2=1.1, the resonant frequency displacement of 0.0537THz is achieved, which results in the sensitivity of S=0.537THz/RIU.
The effect of the graphene sheet on the excitation of TPPs was investigated earlier. Actually, the graphene sheet acts as a metal in the proposed structure. Additionally, it was shown that the surface conductivity and, consequently, the refractive index of graphene depends on the chemical potential. Hence, the absorption spectrum of the sensor for different values of µc in the frequency range of 0.1 to 1THz is plotted in Figure 9A. The change of the absorption peak of the resonances can be determined by a Gaussian-like distribution function so that its average shifts towards higher frequencies with the increase of the chemical potential of graphene. For µc=0.5eV, the average of the Gaussian distribution coincides with the fourth resonance. So, the maximum absorption in the fourth resonance corresponds to the chemical potential equal to 0.5eV. A zoomed-in figure of the fourth resonance in the range of 0.52-0.62THz is given in Figure 9B. Figure 9C shows the absorption and sensitivity of the sensor for the fourth resonance as a function of µc. The maximum absorption and sensitivity values are 99.95% and 0.5406THz/RIU, which are obtained for chemical potentials of 0.5eV and 0.9eV, respectively. Figure 9D indicates the resonant frequency displacement of the six resonances as a function of µc. It is seen that the resonant frequency shift is more for the higher-order resonances. Furthermore, the resonant frequency displacement rate decreases as the chemical potential increases.
|
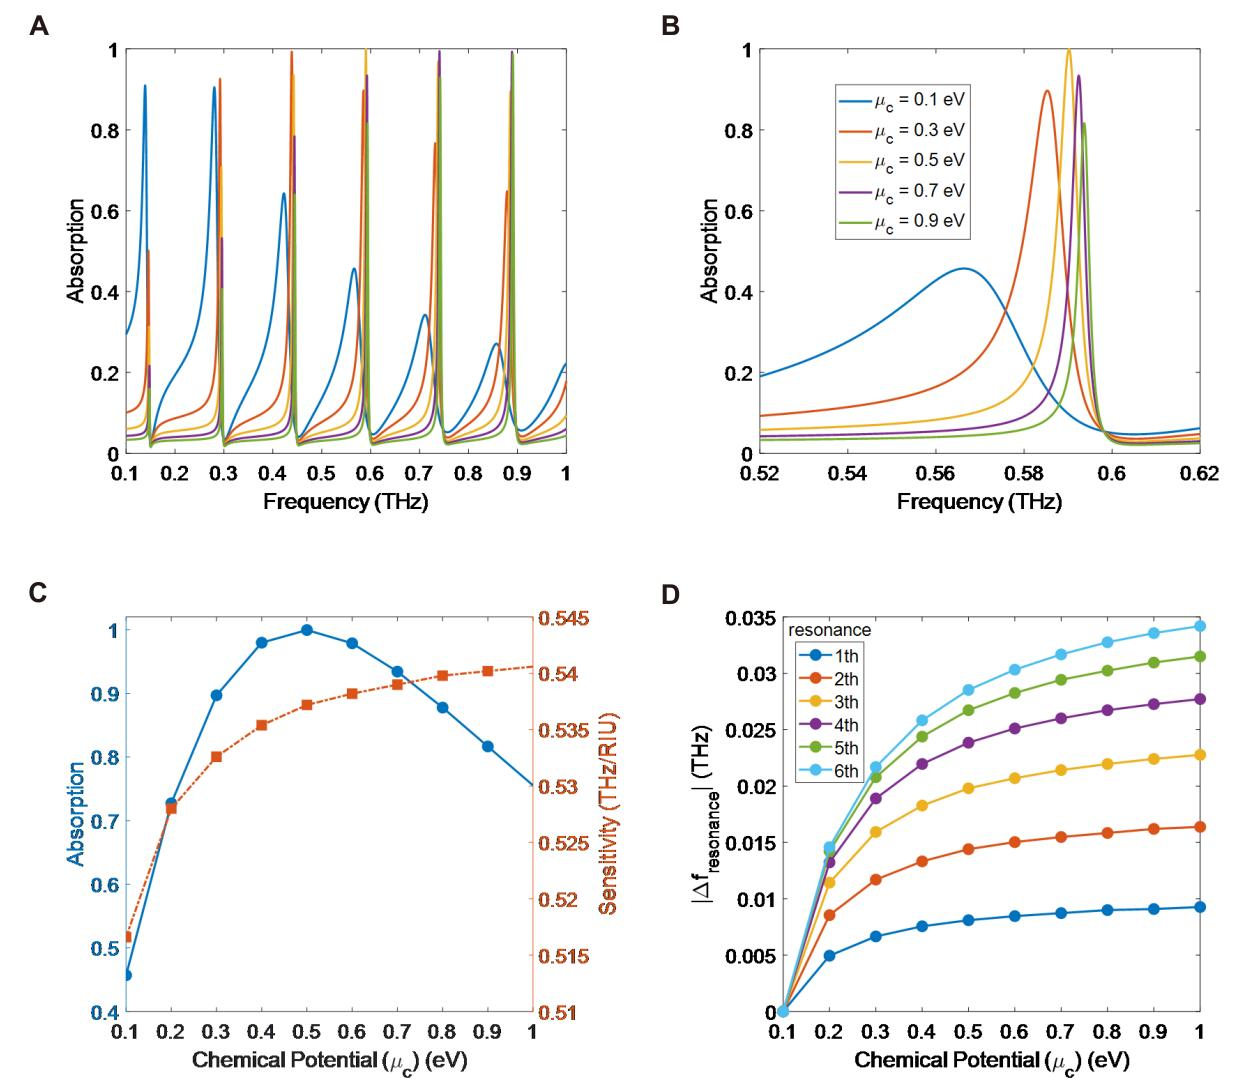
Figure 9. Absorption Spectra of the Sensor for Different Values of µc. A: In the frequency range of 0.1-1THz; B: for the fourth resonance in the frequency range of 0.52-0.62THz; C: Absorption and sensitivity; D: Resonant frequency displacement of the sensor as a function of µc.
Figure 10 reveals the absorption spectrum and sensor sensitivity dependency on the geometrical parameters of the structure. First of all, the effect of the dielectric thickness changes is investigated so that TD changes from 1 to 30µm, and the absorption spectrum is calculated for each thickness, as seen in Figure 10A. For TD>20µm, another resonance (seventh resonance) is apparent in the absorption spectrum. Figure 10B shows the absorption and sensitivity for the fourth resonance as a function of TD changes in the frequency range of 0.45 to 0.65THz, indicating that TD=1µm gives the best result. As much as TD increases, both absorption and sensor sensitivity decrease. Figure 10C shows the absorption spectrum for changes in the thickness of the spacer layer from 0.1 to 30µm. The seventh resonance is seen for TS values higher than 10µm. According to Figure 10D, the absorption of the fourth resonance has a negligible dependency on TS changes. On the other hand, the sensor sensitivity decreases as the spacer layer gets thicker. The absorption spectrum of the sensor as a function of the metal thickness, varying from 5 to 100nm, is observed in Figure 10E. The number of resonances appears to be almost independent of TM changes. Additionally, no extra resonance is excited by changing the thickness of the metallic layers. Figure 10F gives a better view of this issue. The absorption has a nonlinear relationship with TM for the fourth resonance (in the frequency range of 0.45-0.65THz), and the highest absorption of 99.98% is achieved for TM=12nm. However, TM variation has the least effect on the sensor sensitivity among other geometrical parameters, among other geometrical parameter (Figure 10F). For this case, the sensor sensitivity is equal to a fixed value of 0.537THz/RIU. The thickness of the gas tank layer significantly affects the number of resonances in the absorption spectrum (Figure 10G). For example, for TG=100µm, no resonance is observed, while for TG=500µm, there are three resonances in the absorption spectrum, and the fourth resonance is seen for about TG>600µm. Figure 10H demonstrates the absorption and sensitivity of the fourth resonance for 600µm<TG<1000µm. For the lower values of TG, the fourth resonance is not excited. The absorption and sensitivity have different behaviors when TG increases. The higher the TG value, the higher the absorption. At the same time, the sensor sensitivity decreases as TG increases. It is clear that in exchange for reducing the absorption peak to 84.44%, it is possible to reach a sensitivity of 0.887THz/RIU for TG=600µm. Furthermore, the two absorption and sensitivity curves intersect for TG=710µm. Therefore, values of 92.74% and 0.752THz/RIU (equivalent to 36.32µm/RIU) can be achieved simultaneously for absorption and sensitivity, respectively.
|
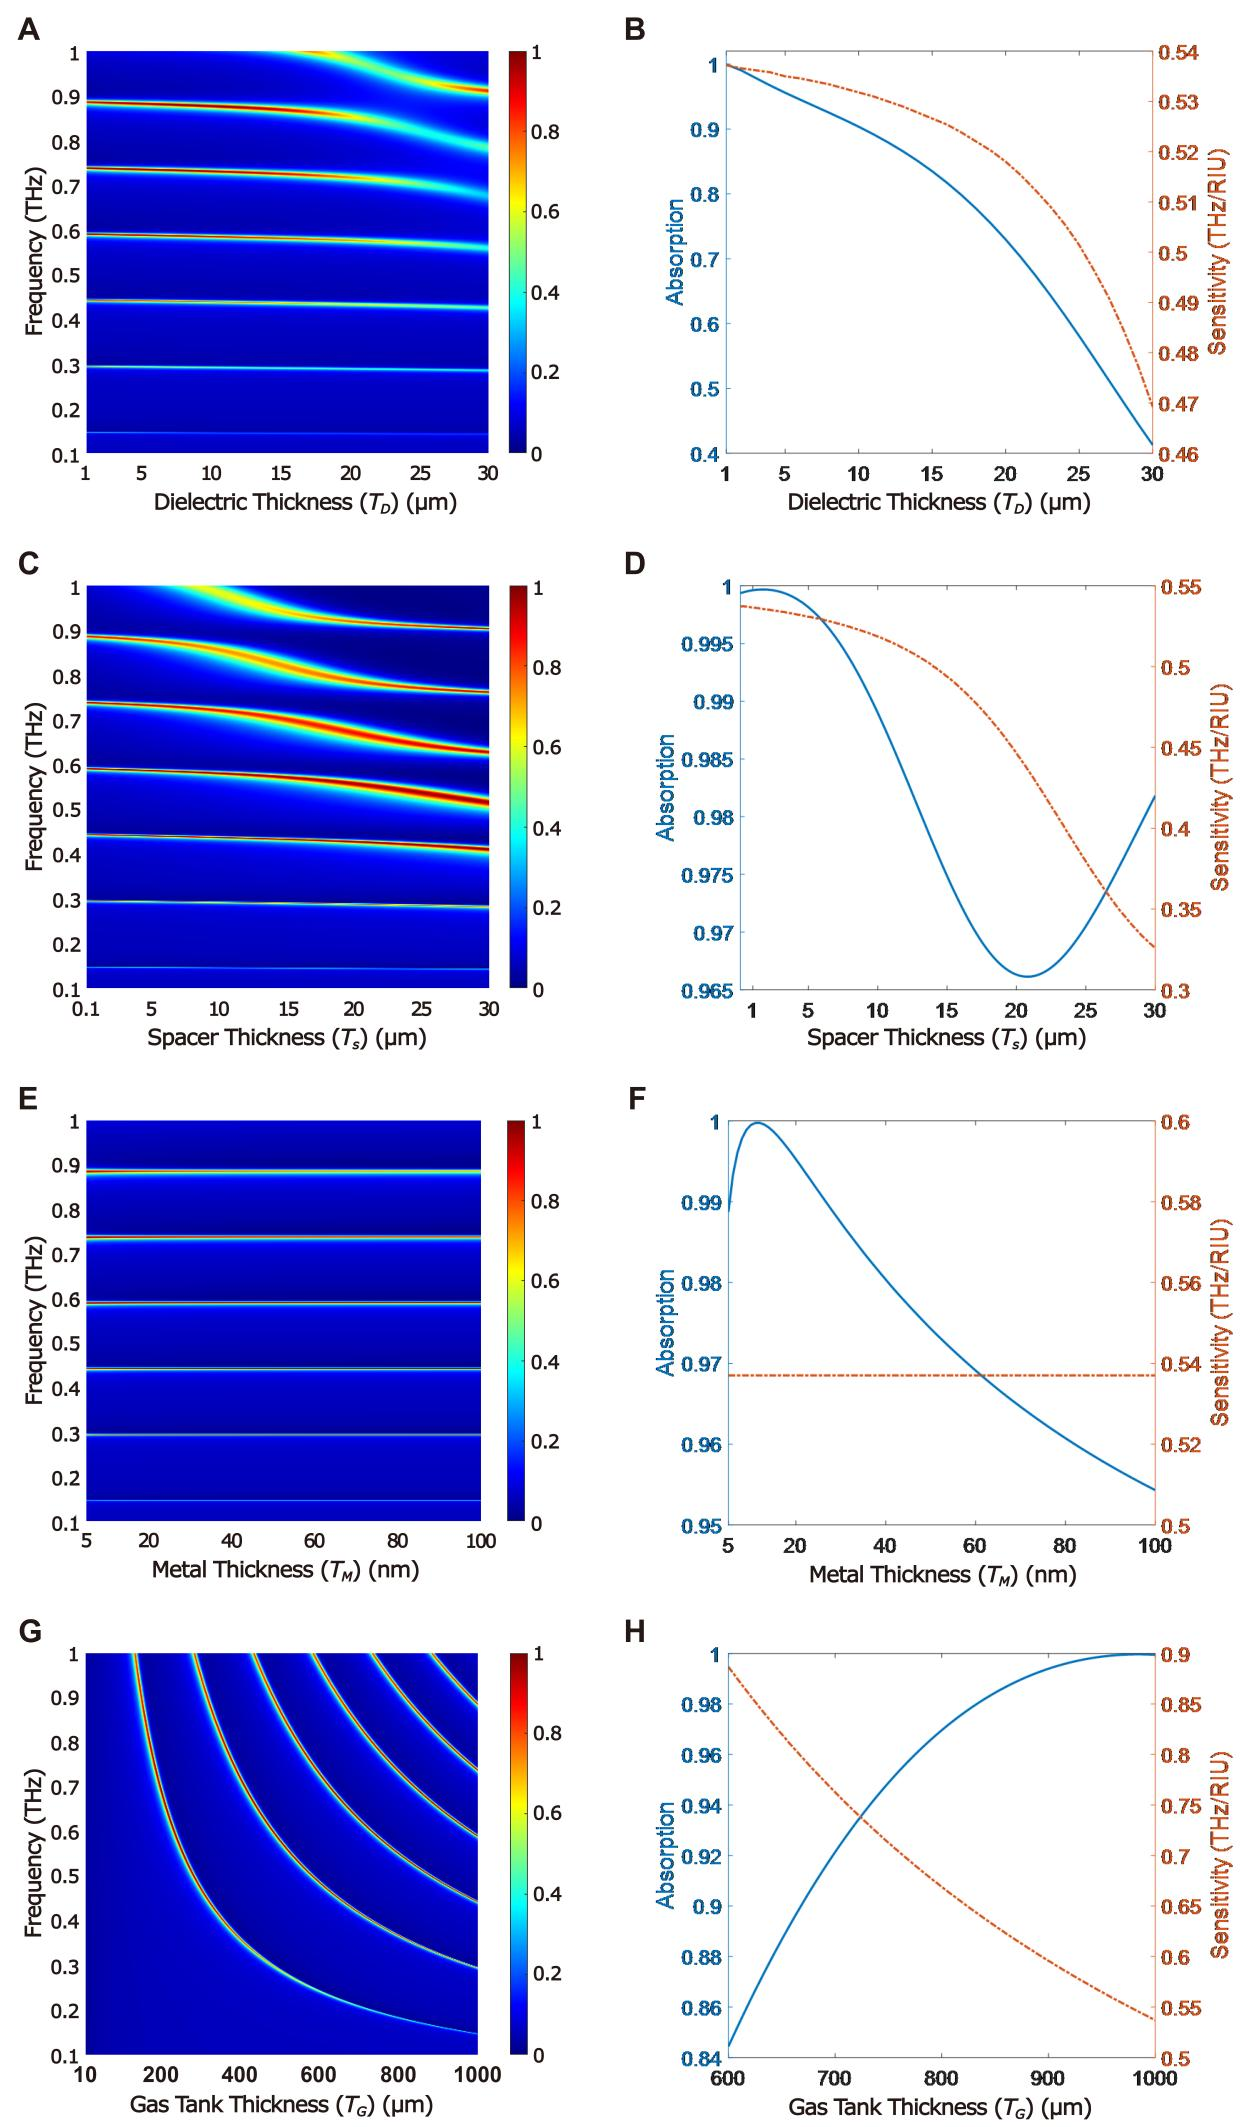
Figure 10. Function of a Sensor. Absorption spectrum of the sensor in the frequency range of 0.1-1THz as a function of (A) TD, (C) TS, (E) TM, and (G) TG; Absorption and sensitivity of the sensor for the fourth resonance as a function of (B) TD, (D) TS, (F) TM, and (H) TG.
4 CONCLUSION
In this paper, a highly efficient optical gas sensor based on the excitation of TPPs and utilizing a DM-PhC was presented. The sensor indicates several narrow-band high absorption peaks in the frequency range of 0.1-1THz. The number and frequency of resonances depend on the geometrical parameters of the structure and the chemical potential of the graphene sheet. The use of a DM-PhC enhances the absorption properties and reduces the thickness of the whole structure compared to sensors employing AD-PhCs. Adjusting the structure parameters makes it possible to achieve absorption of 92.74% and a sensitivity of 0.752THz/RIU (36.32µm/RIU) at a frequency of 0.620THz. Due to the remarkable characteristics of the suggested sensor, it can be used in different parts of industrial applications.
Acknowledgements
Not applicable.
Conflicts of Interest
The author declared no conflict of interest.
Data Availability
All data generated or analyzed during this study are included in this published article.
Copyright Permissions
Copyright © 2024 The Author(s). Published by Innovation Forever Publishing Group Limited. This open-access article is licensed under a Creative Commons Attribution 4.0 International License (https://creativecommons.org/licenses/by/4.0), which permits unrestricted use, sharing, adaptation, distribution, and reproduction in any medium, provided the original work is properly cited.
Author Contribution
Rezaei MH was involved in all steps including software development, data curation, methodology, investigation, writing, review, and editing.
Abbreviation List
AD-PhC, All-dielectric photonic crystal
DBR, Distributed bragg reflector
DM-PhC, Dielectric-metallic photonic crystal
ESW, Electromagnetic surface wave
FOM, Figure of merit
PhC, Photonic crystal
SPP, Surface plasmon polariton
TE, Transverse electric
THz, Terahertz
TM, Transverse magnetic
TMM, Transfer matrix method
TPPs, Tamm plasmon polaritons
References
[1] Polo J, Mackay T, Lakhtakia A. Electromagnetic surface waves: a modern perspective. In: Newnes, Elsevier Science Press: Amsterdam, Netherlands, 2013.
[2] Polo J, Lakhtakia A. Surface electromagnetic waves: a review. Laser Photonics Rev, 2011; 5: 234-246.[DOI]
[3] Rezaei M, Zarifkar A, Miri M. Ultra-compact electro-optical graphene-based plasmonic multi-logic gate with high extinction ratio. Opt Mater, 2018; 84: 572-578.[DOI]
[4] Sepúlveda B, Calle A, Lechuga L et al. Highly sensitive detection of biomolecules with the magneto-optic surface-plasmon-resonance sensor. Opt Lett, 2006; 31: 1085-1087.[DOI]
[5] Wang Q, Wang X, Song H et al. A dual channel self-compensation optical fiber biosensor based on coupling of surface plasmon polariton. Opt Laser Technol, 2020; 124: 106002.[DOI]
[6] Sharar S, Rahad R, Haque M et al. A numerical investigation of the opposing-face semi circular refractive index sensor for detection of chemical pollutants and heavy metals in water. S, 2023; 549: 129887.[DOI]
[7] Matsubara K, Kawata S, Minami S. Optical chemical sensor based on surface plasmon measurement. Appl Optics, 1988; 27: 1160-1163.[DOI]
[8] Zong Y, Lang P, Yu L et al. A novel optical temperature sensor based on surface plasmon polariton resonator. IEEE Photonic Tech Lett, 2017; 29: 466-469.[DOI]
[9] Mei C, Wu Y, Qiu S et al. Design of dual-core photonic crystal fiber for temperature sensor based on surface plasmon resonance effect. Opt Commun, 2022; 508: 127838.[DOI]
[10] Chou Chao C, Chou Chao Y, Chen S et al. Ultrahigh sensitivity of a plasmonic pressure sensor with a compact size. Nanomaterials, 2021; 11: 3147.[DOI]
[11] Homola J, Koudela I, Yee S. Surface plasmon resonance sensors based on diffraction gratings and prism couplers: sensitivity comparison. Sensor Actuat B-Chem, 1999; 54: 16-24.[DOI]
[12] Barnes W, Dereux A, Ebbesen T. Surface plasmon subwavelength optics. Nature, 2003; 424: 824-830.[DOI]
[13] Kumari A, Kumar S, Kumar G et al. Coupling to Tamm-plasmon-polaritons: dependence on structural parameters. J Phys D Appl Phys, 2018; 51: 255103.[DOI]
[14] Sasin M, Seisyan R, Abram R et al. Tamm plasmon polaritons: Slow and spatially compact light. Appl Phys Lett, 2008; 92: 255103.[DOI]
[15] Kaliteevski M, Iorsh I, Abram R et al. Tamm plasmon-polaritons: Possible electromagnetic states at the interface of a metal and a dielectric Bragg mirror. Phys Rev B, 2007; 76: 165415.[DOI]
[16] Das D, Boyer P, Salvi J. Refractive index sensor based on a Tamm Fabry–Perot hybrid resonance. Appl Optics, 2021; 60: 4738-4745.[DOI]
[17] Keshavarz M, Alighanbari A. Terahertz refractive index sensor based on Tamm plasmon-polaritons with graphene. Appl Optics, 2019; 58: 3604-3612.[DOI]
[18] Hu J, Huang Y, Chen Y et al. High-sensitivity multi-channel refractive-index sensor based on a graphene-based hybrid Tamm plasmonic structure. Opt Mater Express, 2021; 11: 3833-3843.[DOI]
[19] Zhang W, Wang F, Rao Y et al. Novel sensing concept based on optical Tamm plasmon. Opt Express, 2014; 22: 14524-14529.[DOI]
[20] Li N, Tang T, Li J et al. Highly sensitive sensors of fluid detection based on magneto-optical optical Tamm state. Sensor Actuat B-Chem, 2018; 265: 644-651.[DOI]
[21] Li L, Hao H. Simulated study of high-sensitivity gas sensor with a metal-PhC nanocavity via Tamm plasmon polaritons. Photonics, 2021; 8: 506.[DOI]
[22] Maji P, Shukla M, Das R. Blood component detection based on miniaturized self-referenced hybrid Tamm-plasmon-polariton sensor. Sensor Actuat B-Chem, 2018; 255: 729-734.[DOI]
[23] Kumar S, Maji P, Das R. Tamm-plasmon resonance based temperature sensor in a Ta2O5/SiO2 based distributed Bragg reflector. Sensor Actuat A-Phys, 2017; 260: 10-15.[DOI]
[24] Zaky Z, Ahmed A, Shalaby A et al. Refractive index gas sensor based on the Tamm state in a one-dimensional photonic crystal: Theoretical optimisation. Sci Rep, 2020; 10: 9736.[DOI]
[25] Wu C, Yang T, Li C et al. Investigation of effective plasma frequencies in one-dimensional plasma photonic crystals. Prog Electromagn Res, 2012; 126: 521-538.[DOI]
[26] Mokhtari A, Rezaei M, Zarifkar A. Near-perfect wide-band absorbers based on one-dimensional photonic crystal structures in 1–20 THz frequencies. Appl Optics, 2023; 62: 3660-3671.[DOI]
[27] Duan Y, Rani S, Zhang Y et al. Silver deposition onto modified silicon substrates. J Phy Chem, 2017; 121: 7240-7247.[DOI]
[28] Reck K, Bulut Y, Xu Z et al. Early-stage silver growth during sputter deposition on SiO2 and polystyrene–Comparison of biased DC magnetron sputtering, high-power impulse magnetron sputtering (HiPIMS) and bipolar HiPIMS. Appl Surf Sci, 2024; 666: 160392.[DOI]
[29] Rumiyanti L, Ginting E, Aziz I et al.The Deposition of Silver (Ag) on a Glass Substrate (SiO2) using Direct Current Sputtering Method. J Phy: Conf Ser, 2019; 1338: 012016.[DOI]
[30] Li P, Chen C, Zhang J et al. Graphene-based transparent electrodes for hybrid solar cells. Front Mater, 2014; 1: 26.[DOI]
[31] Bahadori-Haghighi S, Ghayour R, Sheikhi M. Design and analysis of low loss plasmonic waveguide and directional coupler based on pattern-free suspended graphene sheets. Carbon, 2018; 129: 653-660.[DOI]
[32] Wu Y, Wu W, Hu J. Tunable perfect dual-narrowband absorber based on graphene-photonic crystal heterostructure. Results Phys, 2022; 34: 105234.[DOI]
[33] Ehsanikachosang M, Karimi K, Rezaei M et al. Metamaterial solar absorber based on titanium resonators for operation in the ultraviolet to near-infrared region. J Opt Soc Am B, 2022; 39: 3178-3186.[DOI]
[34] Ansys Lumerical FDTD: Simulation of photonic components. Accessed 16 June 2024. Available at:[Web]
[35] Rezaei M, Zarifkar A, Miri M et al. Design of a high-efficient and ultra-compact full-adder based on graphene-plasmonic structure. Superlattice Microst, 2019; 129: 139-145.[DOI]
[36] Rezaei M, Zarifkar A. Graphene-based plasmonic electro-optical SR flip-flop with an ultra-compact footprint. Opt Express, 2020; 28: 25167-25179.[DOI]
[37] Ung B Sheng Y. Interference of surface waves in a metallic nanoslit. Opt Express, 2007; 15: 1182-1190.[DOI]
[38] Lin Y, Cui Y, Ding F et al. Tungsten based anisotropic metamaterial as an ultra-broadband absorber. Opt Mater Express, 2017; 7: 606-617.[DOI]
[39] Kim I, So S, Rana A et al. Thermally robust ring-shaped chromium perfect absorber of visible light. Nanophotonics-Berlin, 2018; 7: 1827-1833.[DOI]
[40] Rakić A, Djurišić A, Elazar J et al. Optical properties of metallic films for vertical-cavity optoelectronic devices. Appl Optics, 1998; 37: 5271-5283.[DOI]
[41] Shangguan Q, Chen Z, Yang H et al. Design of ultra-narrow band graphene refractive index sensor. Sensors, 2022; 22: 6483.[DOI]



 Copyright ©