
Optical Investigations of MgO Quantum Dots under Pressure Effect at Near-infrared Region
Yarub Al-Douri1,2*, Mohammed Ameri3, Abdelmajid Bouhemadou4
1Department of Mechanical Engineering, Faculty of Engineering, Piri Reis University, Istanbul, Turkey
2Nanotechnology and Catalysis Research Center (NANOCAT), University of Malaya, Kuala Lumpur, Malaysia
3Laboratory of Physical Chemistry of Advanced Materials (LPCMA), University of Djillali Liabes, Sidi-Bel-Abbes, Algeria
4Laboratory for Developing New Materials and their Characterizations, Ferhat Abbas University, Setif, Algeria
*Correspondence to: Yarub Al-Douri, PhD, Professor, Nanotechnology and Catalysis Research Center, University of Malaya, Kuala Lumpur, 50603, Malaysia; Email: yaldouri@yahoo.com
DOI: 10.53964/id.2024018
Abstract
MgO quantum dots (MgO QDs) are prepared using chemical bath deposition technique. The prepared MgO QDs are characterized by UV-visible (UV-vis) spectrophotometry, Fourier Transformation-Infrared (FTIR) and X-ray diffraction (XRD). The crystallite size goes up as pressure increases and corresponding to transmittance. The structural properties of XRD are elaborated in terms of different pressures, these properties of MgO QDs at different pressures from 50 to 300mbar have been investigated. The crystallite size is varied from 4.3nm to 7.2nm to 12.5nm for 200mbar, 250mbar and 300mbar, respectively. The XRD peaks are displayed at 2θ=38.1º, 42.8º, 31.3º and 34.5º that correspond to (111), (002), (100) and (002) planes, respectively. Also, the optical investigations of UV-vis and FTIR are detailed to understand the behavior of MgO QDs for different pressures. The transmittance, 200-1,200nm is in terms of wavelength at different pressures; 50mbar, 100mbar, 150mbar, 200mbar, 250mbar and 300mbar, while the high transmittance for more than 80% is exhibited at 200-300mbar. To investigate bandgap, it depends on the transmittance. At 200mbar and 423K, the bandgap’s nature has direct inter-band transition. The estimated bandgap is 5.01eV. The bandgap variation is attributed to non-stoichiometry of deposited layer. The FTIR spectra for MgO QDs at different pressures; 50-300mbar are researched to recognize many absorption peaks at different lengths indicating to varied phenomena of un-oxide sized, C-O stretching mode or chemical bonding of Mg-O production.
Keywords: MgO, quantum dots, X-ray diffraction, UV
1 INTRODUCTION
The exploration of nanoscale materials has become a focal point of scientific inquiry, driven by the desire to understand their unique properties and potential applications. Among these nanostructures, quantum dots (QDs) have garnered significant attention for their distinct quantum confinement effects, which give rise to size-dependent electronic and optical properties[1-3]. In this context, magnesium oxide quantum dots (MgO QDs) stand out as a promising subject for investigation due to their wide bandgap and remarkable stability. The optical properties of MgO QDs have been extensively studied, revealing intriguing phenomena such as quantum confinement effects, size-dependent energy bandgaps and enhanced photoluminescence. These characteristics make MgO QDs highly attractive for various technological applications, including sensors, light-emitting devices and solar cells[4]. However, despite the considerable advancements in understanding their behavior under ambient conditions, the response of MgO QDs to external stimuli remains a relatively unexplored frontier. One crucial external factor is pressure that can significantly influence the properties of nanomaterials[5,6]. The application of pressure induces a change in the interatomic distances, alters the electronic structure, which can lead to modifications in the optical response of materials. Investigated MgO QDs under pressure is particularly relevant for expanding our comprehension of their fundamental behavior and unlocking potential applications in high-pressure environments[7].
Recently, Krishna et al.[8] have investigated the electronic and transport characteristics of selective edge hydrogenated MgO nanoribbons. The transport calculations have revealed that the bare Mg-edge (B-MgO-H) nanoribbon exhibits ohmic current behavior, while the other nanoribbons exhibit negative differential resistance (NDR) behavior. The heterostructure-magnesium oxide-boron (H-MgO-B) device exhibits a significant NDR behavior with a significantly high peak-to-valley current ratio (PVCR) of about 3.07×10⁶. They have suggested that magnesium oxide nanorods (MgONRs) can be used to design nano-interconnects and NDR based nano-electronic device design by tailoring the edge hydrogenation. While, Hazarika and Kalita[9] have researched the effects of homo- and hetero-type co-doping of B, C and N on the structural and electronic properties of MgO monolayers (MLs). Most of co-doping combinations introduce magnetism to the pristine MgO ML. Hetero-type monolayers prefer to be in magnetic states than homo-type MLs to exhibit higher magnetic moments, with a maximum value of 4μB for B-N co-doping. The overall tuning of the electronic properties renders the co-doped MgO monolayers effective for applications in spintronics and optoelectronics. And, Al-Douri et al.[10] have used the full potential-linearized augmented plane wave (FP-LAPW) method to calculate the indirect energy gap (Γ-X) using density functional theory (DFT). The Engel-Vosko generalized gradient approximation (EV-GGA) and modified Becke Johnson (mBJ) formalisms are utilized to optimize the corresponding potential for energetic transition and optical properties calculations of chalcogenides alloys as a function of quantum dot diameter, it has been used to test the validity of quantum dot potential model. They have investigated the refractive index and optical dielectric constant to explore best applications for solar cells.
Near-infrared (NIR) spectroscopy emerges as a powerful tool for probing the electronic and vibrational transitions of materials in the infrared range. The utilization of NIR spectroscopy in studying MgO QDs under pressure provides a unique opportunity to gain insights into their response to external stimuli at the molecular and electronic levels. By focusing on the near-infrared region, the researchers can explore subtle changes in the electronic structure and vibrational modes of MgO QDs, offering a comprehensive understanding of their behavior under pressure. The study of MgO QDs under pressure is not only significant from a fundamental perspective but also holds practical implications. Many applications in the field of nanoelectronics and optoelectronics, involve materials subjected to varying pressure conditions. Understanding how MgO QDs respond to pressure can contribute to the design and optimization of devices that operate in high-pressure environments. In this context, this research aims to systematically investigate the optical properties of MgO QDs under the pressure effect of using near-infrared spectroscopy. By applying pressure as a controlled parameter, we seek to unravel the intricate interplay between quantum confinement effects and external pressure, shedding light on the underlying mechanisms governing the behavior of MgO QDs. The outcomes of this work have the potential to extend the current understanding of nanoscale materials and pave the way for the development of advanced technologies that leverage the unique properties of MgO QDs under diverse environmental conditions. In summary, the exploration of MgO QDs under pressure effect using near-infrared spectroscopy represents a compelling avenue for advancing our understanding of nanomaterials and harnessing their potential in real-world applications. The intricate interplay between quantum confinement effects and external pressure offers a rich scientific landscape to explore, with implications ranging from fundamental condensed matter physics to applied nanotechnology.
2 EXPERIMENTAL
The synthesis of MgO QDs can be achieved through chemical bath deposition technique, offering different control over crystallite size and properties. For a simple chemical precipitation method for synthesizing MgO QDs, it is necessary to bring magnesium chloride, magnesium nitrate, NaOH, deionized water and ethanol. The followed experimental procedure is:
(1) Preparation of Magnesium Precursor Solution: Dissolve the magnesium precursor in deionized water to create a clear solution. Stir the solution thoroughly to ensure complete dissolution.
(2) Addition of Sodium Hydroxide: Slowly add a NaOH solution to the magnesium precursor solution, while stirring continuously. This will result in the formation of a white precipitate of Mg(OH)₂.
(3) Formation of MgO Nanoparticles: Continue stirring the mixture for a specified period to allow the magnesium hydroxide to form. Adjust the reaction time based on the desired size of MgO nanoparticles.
(4) Washing and Drying: (i) Collect the formed Mg(OH)₂ precipitate through filtration or centrifugation. (ii) Wash the precipitate with deionized water to remove impurities and excess reactants. (ii) Optionally, repeat the washing step with ethanol to enhance purity. (iv) Dry the resulting Mg(OH)₂ material, typically using an oven or other appropriate drying techniques.
(5) Thermal Decomposition: (i) Heat the dried Mg(OH)₂ precursor at an elevated temperature (e.g., in a furnace) to thermally decompose it into MgO nanoparticles. (ii) The decomposition temperature can influence the final properties of the MgO nanomaterial.
(6) Characterization: Characterize the synthesized MgO nanomaterial using UV-visible (Jobin Yvon model HR 800 UV system, Kyoto, Japan), Fourier transformation-infrared (FTIR) (SHIMADZU (Shimadzu Corporation), China) and X-ray diffraction (XRD) (Philips PW 1710 X-ray diffractometer, USA) techniques.
In the realm of nanotechnology, the synthesis of MgO QDs under the influence of pressure represents an intriguing avenue for exploration, particularly in the context of NIR spectroscopy. Applying pressure during synthesis introduces a dynamic dimension to the process, altering the material’s structural and optical properties. The experiment involves subjecting magnesium precursors to varying pressure conditions, thereby manipulating the quantum dot formation. Under high pressure, the size of MgO QDs is expected to undergo notable changes, influencing their optical characteristics. The near-infrared spectral region is particularly relevant due to its significance in biomedical and telecommunications applications. The pressure-induced alterations in quantum dot size and structure may lead to tunable NIR absorption and emission properties, essential for optimizing their performance in these applications. This experimental synthesis under pressure effect not only expands our understanding of QDs formation but also holds promise for tailoring MgO QDs with enhanced NIR features, paving the way for innovative technological applications.
3 RESULTS AND DISCUSSION
3.1 Structural Properties
The crystallinity of MgO QDs is analyzed using XRD. This technique is employed to give an indication about the grain size of the prepared material. Figure 1A illustrates the XRD results for MgO QDs at 50mbar and 423K. In this diffraction pattern, the peaks at 2θ=37.4º and 42.9º are corresponding to (111) and (002) planes. This indicates the formation of oxide molecules for used material in their corresponding films. Also, there are a small amount of unoxidized atoms mixed with oxide result in the formation of Mg for (100) and (002)[11-15].
The XRD patterns at oxidation pressures, 100mbar to 150mbar are shown in Figure 1B and C at 423K. From the first growth conditions, it is recognized that the peaks are appeared at 2θ=38.1º, 42.8º, 31.3º and 34.5º that correspond to (111), (002), (100) and (002) planes, respectively. Figure 1D shows the diffraction pattern at 200mbar, where the structure has clearly improved a significant increasing in peak intensity at (111) plane and reduction in peak intensity at other planes. This indicates the formation of nearly stoichiometry MgO. The intensities of these peaks are reduced as pressure increases to 250mbar as shown in Figure 1E and 1F.
|
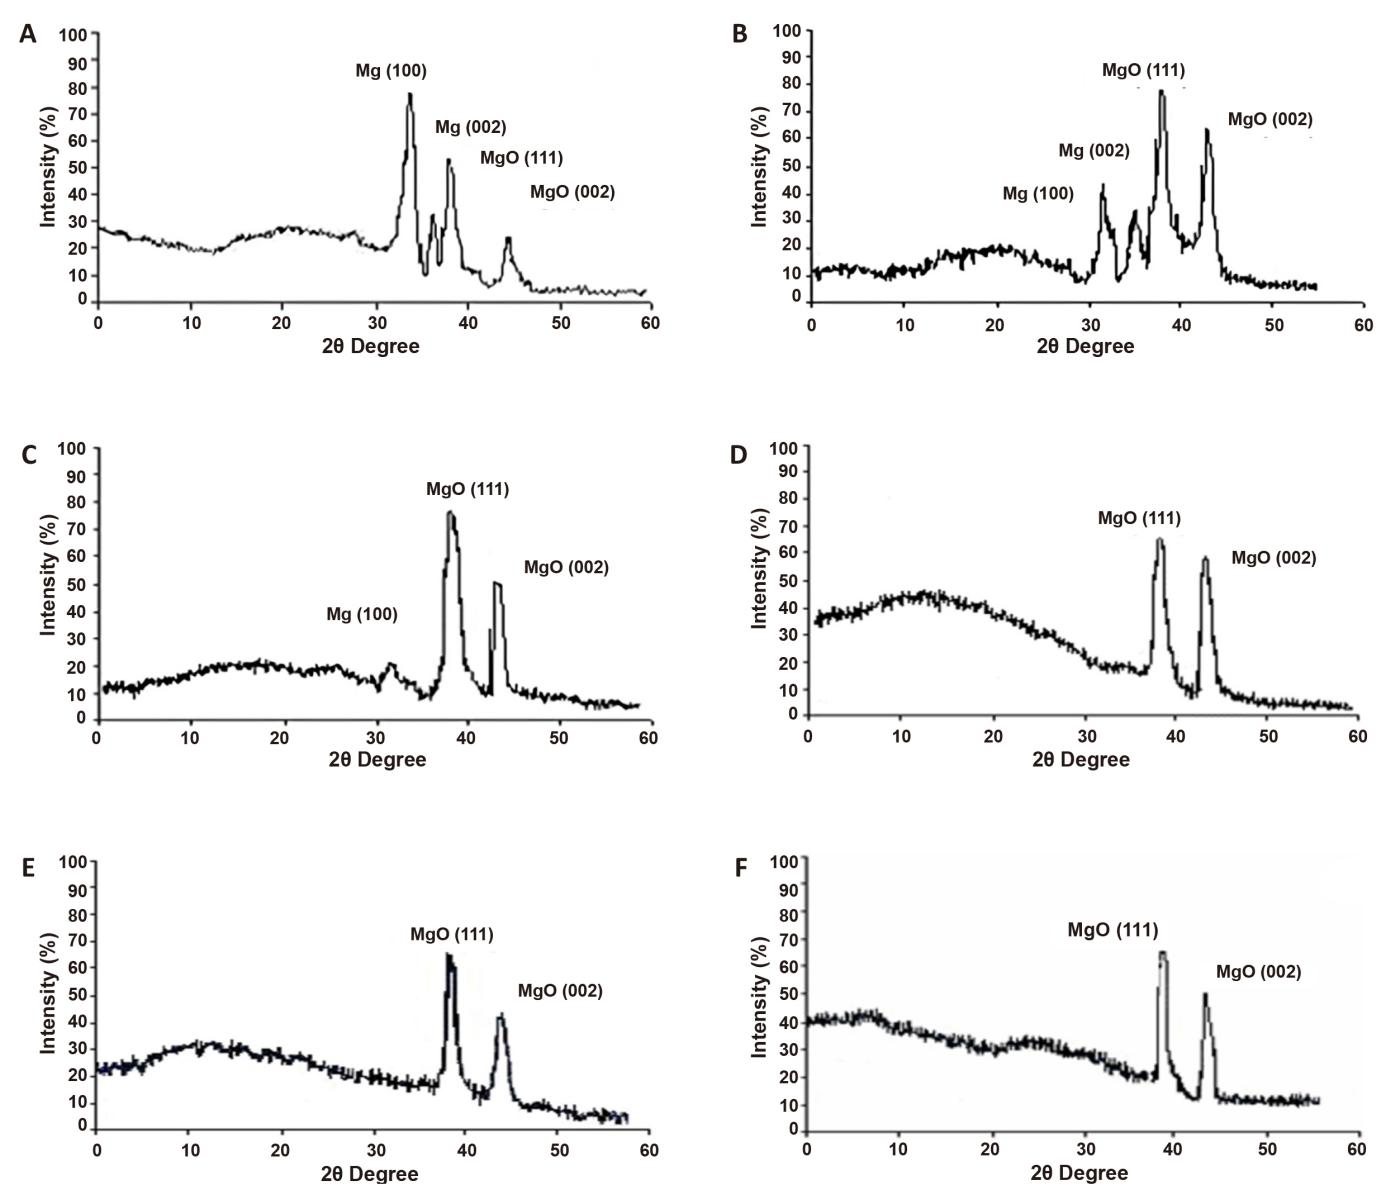
Figure 1. XRD Pattern of MgO QDs at Different Pressures. A: XRD pattern of MgO QDs at 50mbar; B: XRD pattern of MgO QDs at 100mbar; C: XRD pattern of MgO QDs at 150mbar; D: XRD pattern of MgO QDs at 200mbar; E: XRD pattern of MgO QDs at 250mbar; F: XRD pattern of MgO QDs at 300mbar.
The results below ensure that the optimum value of pressure is 200mbar. The deviation of XRD peak with respect to standard American Society for Testing and Materials (ASTM) data is attributed to mechanical micro stress produced by different recourses like impurities, defects and vacancies reside in the structure. The data at higher pressure, 300mbar and 423K are presented in Table 1. So, the peaks are appeared at 2θ are 38.02º and 41.9º, which correspond to (111) and (002) planes. The MgO (002) is a weak, while (111) reflection is a stronger[16,17].
We can deduce that the increasing of pressure improves the crystal quality and can introduce two completely processes; improving stoichiometry and decreasing of kinetic energy for the reactive particles in the catholic plasma due to high pressure. The structural properties for each diffraction peak are given in Table 1. This gives different relative intensities, Bragg’s angle and miller indices. While, Table 2 presents full width at half maximum (FWHM) of XRD that corresponding to crystallite size at different pressures. It appears an enhancement with increasing pressure up to 200mbar. Here, we can recognize that the reduction in FWHM will reflect the increasing in crystallite size using Scherrer’s formula[11].
$$ D=K\lambda /\beta cos\theta \left(1\right)$$
where K is geometric factor (0.9), λ is XRD wavelength (1.54056Å for Cu-Ka), ß is FWHM of diffraction peak and θ is Bragg’s diffraction angle.
Table 1. Structural Properties of Mg and MgO QDs
Pressure (mbar) |
2 |
I/I0 (%) |
d (Å) |
hkl |
Type |
1 |
31.8 |
99 |
2.775 |
100 |
Mg |
34.4 |
39 |
2.632 |
002 |
Mg |
|
36.5 |
14 |
2.470 |
101 |
Mg |
|
56.6 |
9 |
1.695 |
110 |
Mg |
|
50 |
32.1 |
99 |
2. 775 |
100 |
Mg |
34.4 |
34 |
2.589 |
002 |
Mg |
|
37.8 |
57.4 |
2.439 |
111 |
MgO |
|
42.8 |
25.6 |
2.104 |
002 |
MgO |
|
100 |
31.2 |
53.7 |
2.780 |
100 |
Mg |
34.4 |
42.2 |
2.589 |
002 |
Mg |
|
38.0 |
99 |
2.360 |
111 |
MgO |
|
42.7 |
83.2 |
2.121 |
002 |
MgO |
|
150 |
31.2 |
26.8 |
2.780 |
100 |
Mg |
38.0 |
99 |
2.361 |
111 |
MgO |
|
42.7 |
64.0 |
2.106 |
002 |
MgO |
|
200 |
37.7 |
99 |
2.438 |
111 |
MgO |
42.7 |
86.6 |
2.109 |
002 |
MgO |
|
250 |
37.8 |
99 |
2.432 |
111 |
MgO |
42.7 |
69.1 |
2.106 |
002 |
MgO |
|
300 |
38.01 |
99 |
2.360 |
111 |
MgO |
41.8 |
74 |
2.106 |
002 |
MgO |
Table 2. FWHM and Crystallite Size for MgO QDs at Different Pressures
|
hkl |
200mbar |
250mbar |
300mbar |
FWHM (MgO) |
(111) |
1.9 |
1.1 |
0.6 |
Crystallite size (nm) |
(111) |
4.2 |
7.1 |
12.4 |
3.2 Optical Properties
The pressure effect on optical properties of MgO QDs is investigated extensively. The transmittance and bandgap are measured as plotted in Figure 2. The transmittance spectra are recorded in the ultraviolet, visible and NIR ranges at different pressures. In general, it has been found that the transmittance is improved when pressure increases. From Figure 2A, the optical transmittance, 200-1,200nm as a function of wavelength at different pressures is shown, the high transmittance, >80%, is exhibited at 200-300mbar, however, the reduction in transmittance at NIR wavelengths is related to reflection of their photons due to interaction with plasma in conduction band[18].
|
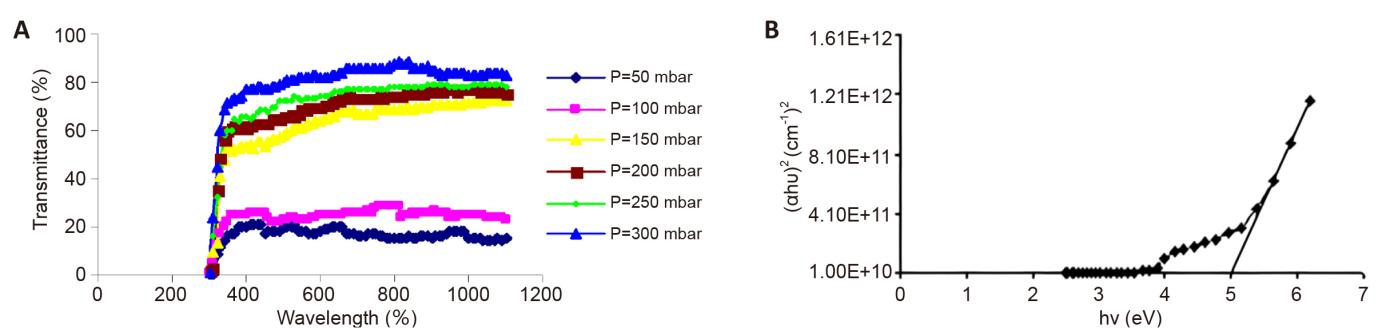
Figure 2. Transmittance and Bandgap Measured. A: Transmittance as a function of wavelength for MgO QDs for different pressures; B: Energy bandgap of MgO QDs at 200mbar.
The bandgap depends on the transmittance. The plots of (αhυ)2 against hυ at 200mbar and 423K is illustrated in Figure 2B. The nature of plots suggests a direct inter-band transition. The estimated bandgap is 5.01eV. It can state that a reduced bandgap is attributed to varied extent of non-stoichiometry of the deposited layer[19].
The transmittance as a function of deposition position upon the substrate surface is illustrated in Figure 3. It is known that that the transmittance of incident 632.8nm wavelength decreases to its minimum value whenever approaching to the center, where the lowest transmittance can be achieved. This relates to the thickness, which is higher at the center and reduces as we depart from the radial direction. This coincides with the theoretical concept that imposes the deposition or evaporating an atom from the target with a solid angle. This result ensures the difference in the transmitted power that can be neglected for a limited area, 1cm2, which found to have a uniform transmittance that attributed to the crystalline nature throughout the coated area, which is obtained a lattice arrangement for resulting in the better optical properties[20].
|
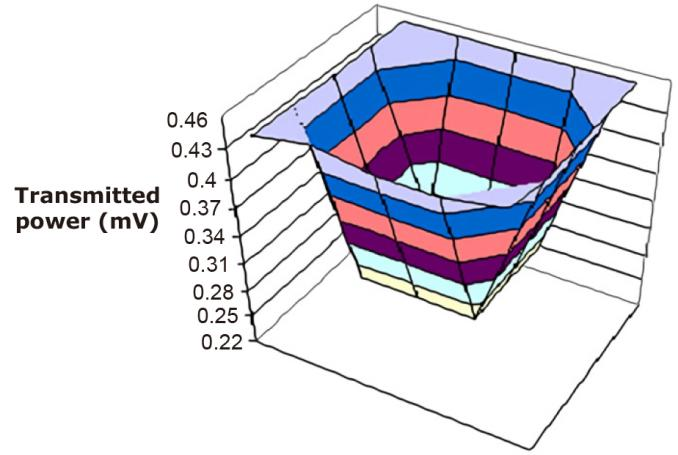
Figure 3. Transmitted Power as a Function of Position at 200mbar for MgO QDs.
The Fourier Transformation-Infrared spectroscopic results give information about phase composition and the way in which oxygen is bound to metal ions. The following show FTIR spectra for MgO QDs at different pressures. At different pressures; 50-300mbar, we can see the change in the composition. Figure 4A gives FTIR result at 50mbar, we can recognize the absorption peak at 1,620.9, 786.9, 725.18cm-1 that is related to Mg atoms, beside 694.33, 648.04cm-1 absorption spectra are connected to MgO QDs. An increasing in MgO QDs formation could be recognize by increasing of pressure to 100mbar as shown in Figure 4B where 694.33, 609.46, 408.88cm-1 absorption peak could be found. In addition, the presence of 987.49, 918.05, 817.7cm-1 peak indicates to un-oxide sized. The peak at 1,465.8, 1,049.2 and 871.76cm-1 at low pressure in 50-100mbar is related to C-O stretching mode, which may be attributed to the fact that Mg is fired rather than react with O2 atoms. At high pressure, 150mbar (Figure 4C), it is recognized that the peak is eliminated to one peak at 918.05cm-1, while higher number of MgO QDs is formed, this could be obtained at 648.04, 466.03, 408.88cm-1 at 200mbar (Figure 4D), the absorption spectra is clearly disappeared while it is found at 655.75, 570.89, 455.17, 408.88cm-1. For MgO QDs, the kinetic energy of Mg atoms decreases through collision with oxygen, so the chemical bonding like (Mg-O) is produced. By increasing the pressure to 250 and 300mbar, Figure 4E and 4F shows that the peaks at 655.75, 586.32, 501.46, 408.88cm-1 are related to MgO QDs. In all above result, it is recognized that the peaks at 599.03, 617.18, 879.48, 840.91, 1,396.37, 1,342.36, 1,072.19, 1,612.38, 1,550.66, 1,296.08, 1,041.49, 1,303.7, 1,180.35, and 1,064.63cm-1 are related to glass substrate[21-31].
|
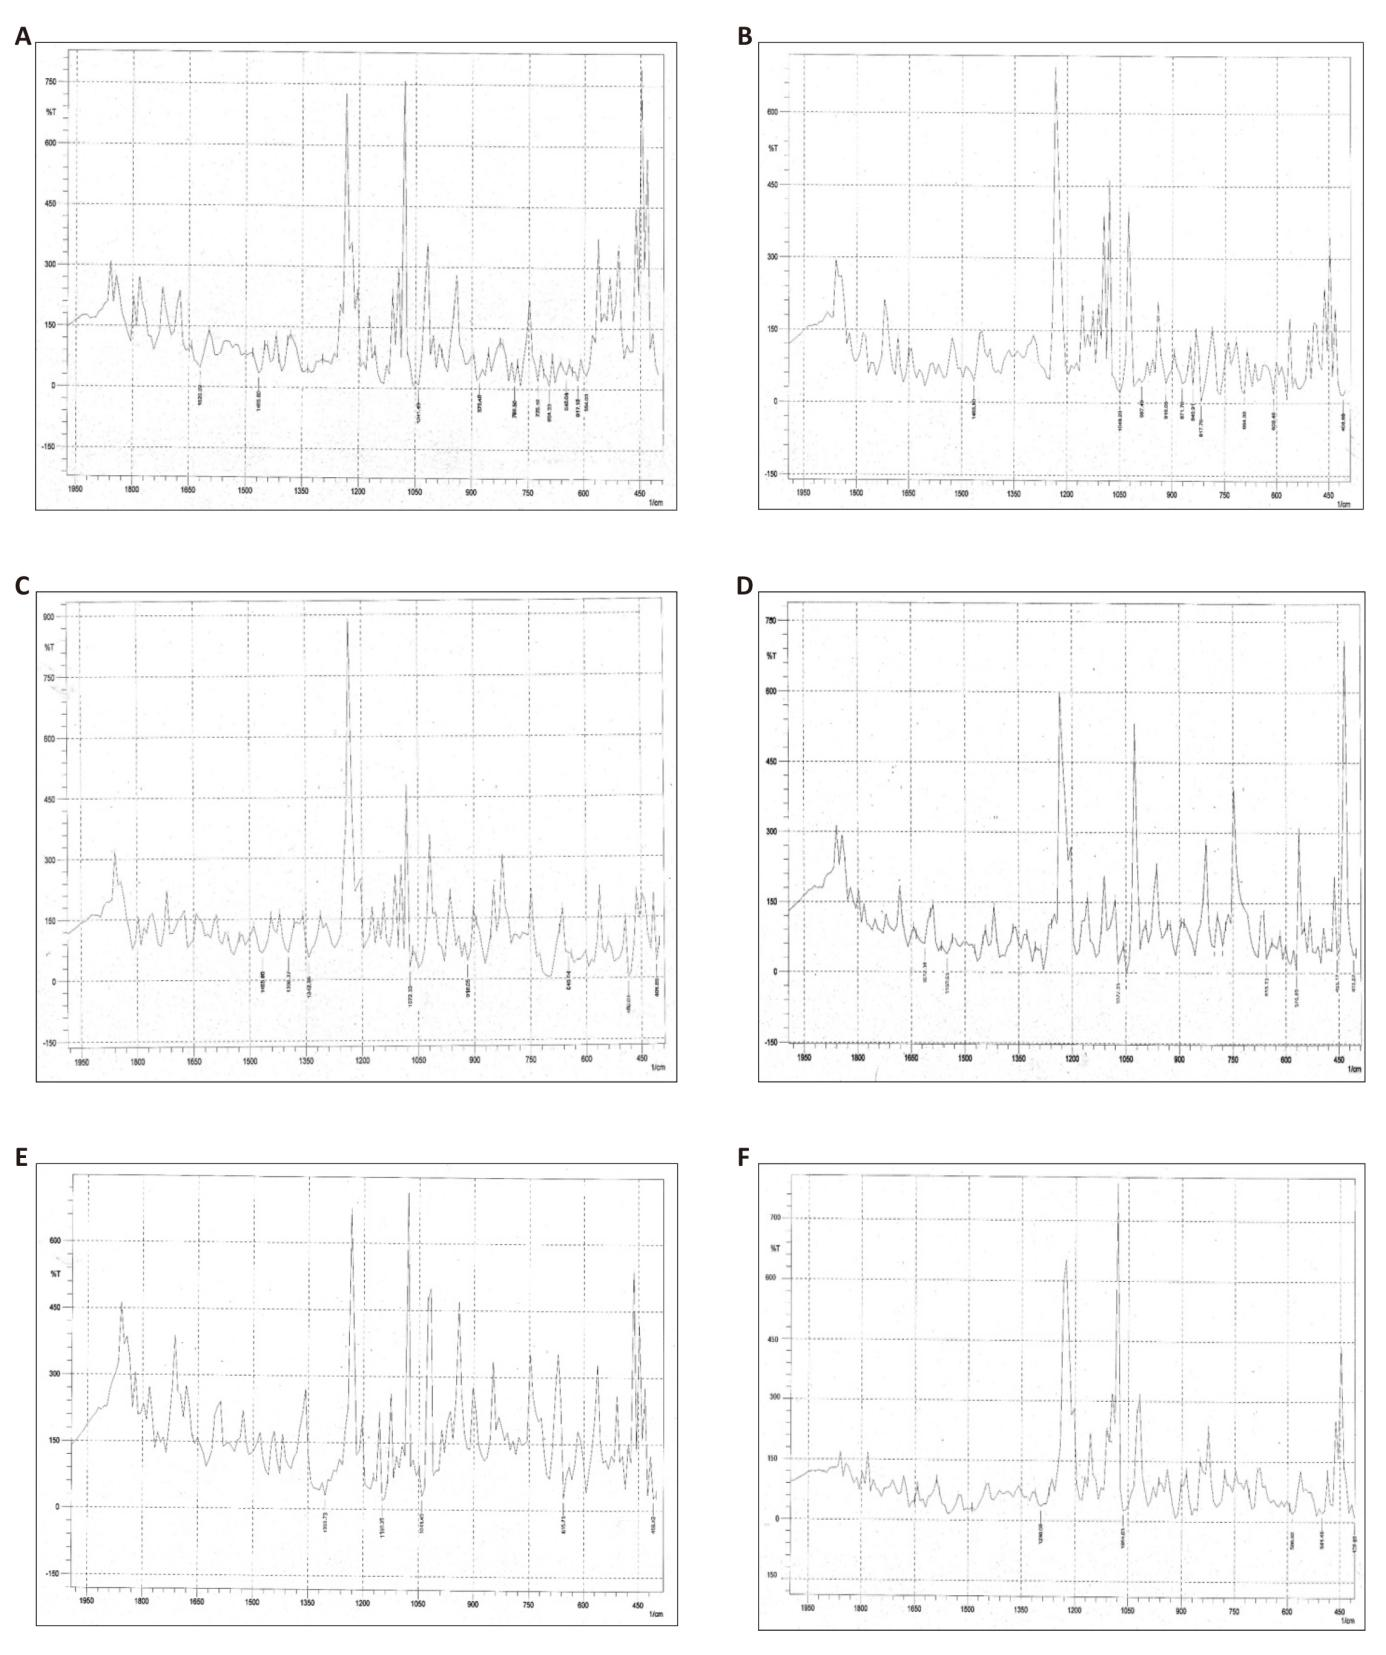
Figure 4. FTIR Spectrum of MgO QDs. A: FTIR spectrum of MgO QDs at 50mbar; B: FTIR spectrum of MgO QDs 100mbar; C:FTIR spectrum of MgO QDs 150mbar; D: FTIR spectrum of MgO QDs 200mbar; E: FTIR spectrum of MgO QDs 250mbar; F: FTIR spectrum of MgO QDs 300mbar.
4 CONCLUSIONS
The chemical bath deposition technique was proved to be an effective method for synthesizing MgO QDs. The pressure effect has been employed to investigate different structural and optical studies of MgO QDs. The Scherrer’s formula has been utilized to research structural properties that proved the MgO QDs has the highest peak (111). Different pressures; 50mbar, 100mbar, 150mbar, 200mbar, 250mbar and 300mbar were applied. The pressure, 200mbar has presented as evidence to indicate the ideal intensity for investigating referring to 4.3nm crystallite size. Many peaks corresponding to many planes were displayed in XRD pattern. All of these were supported by studying the optical properties of transmittance. The energy bandgap and FTIR were to confirm the fact that 5.01eV was close to NIR, the nature of bandgap was direct inter-band transition and attributed to non-stoichiometry of deposited layer, and the correlation between transmittance and pressure was directly. In addition, the transmittance was more than 80% at 200-300mbar. The FTIR spectra for MgO QDs at different pressures; 50-300mbar were recognized many phenomena of un-oxide sized, C-O stretching mode or chemical bonding of Mg-O production.
Acknowledgements
Not applicable.
Conflicts of Interest
The authors declared no conflict of interest.
Data Availability
All data generated or analyzed during this study are included in this published article.
Copyright Permissions
Copyright © 2024 The Author(s). Published by Innovation Forever Publishing Group Limited. This open-access article is licensed under a Creative Commons Attribution 4.0 International License (https://creativecommons.org/licenses/by/4.0), which permits unrestricted use, sharing, adaptation, distribution, and reproduction in any medium, provided the original work is properly cited.
Author Contribution
Al-Douri Y wrote, edited, and reviewed the original draft, while also copyrighting the figures and tables. Ameri M organized and validated the manuscript, and Bouhemadou A edited and reviewed the manuscript.
Abbreviation List
FTIR, Fourier transformation-infrared
FWHM, Full width at half maximum
MgO QDs, MgO quantum dots
MLs, Monolayers
NDR, Negative differential resistance
NIR, Near-infrared
QDs, Quantum dots
UV-vis, UV-visible
XRD, X-ray diffraction
References
[1] Raj S, Yun JH, Adilbish G et al. Formation of core@multi-shell CdSe@CdZnS-ZnS quantum dot heterostructure films by pulse electrophoresis deposition. Superlattice Microst, 2015; 83: 618-626.[DOI]
[2] Chandrakar RK, Baghel RN, Chandra VK et al. Synthesis, characterization and photoluminescence studies of Mn doped ZnS nanoparticles. Superlattice Microst, 2015; 86: 256-269.[DOI]
[3] Kuang WJ, Li Q, Sun Y et al. Near-band-edge emission characteristics of ZnO-MgO core-shell quantum-dots. Mater Lett, 2016; 178: 27-30.[DOI]
[4] Liu Y, Hua J, Zhang K et al. Effect of MgO shell on electron transfer from Cu doped ZnInS quantum dots to FePt nanoparticles. Mater Res Bull, 2018; 103: 242-246.[DOI]
[5] Chen S, Yang S, Chen L et al. MgO-Y2O3: Eu composite ceramics with high quantum yield and excellent thermal performance. J Eur Ceram Soc, 2023; 43: 3553-3562.[DOI]
[6] Zhang J, Chen J, Zhang T et al. Resonant tunneling light emitting diode based on rock-salt ZnO/MgO multiple quantum well. Opt Mater, 2022; 134: 113232.[DOI]
[7] Abdullah NR, Abdullah BJ, Azeez YH et al. Optical conductivity enhancement and thermal reduction of BN-codoped MgO nanosheet: Significant effects of B-N atomic interaction. Solid State Commun, 2023; 370: 115218.[DOI]
[8] Krishna MS, Singh S, Kaushik BK. Edge tailored MgO nanoribbon for negative differential resistance/nanointerconnect applications. Comp Mater Sci, 2024; 231: 112570.[DOI]
[9] Hazarika R, Kalita B. Site dependent strategy for B/C/N homo and heteroatom co-doping in governing the optoelectronic behavior of MgO monolayers. J Phys Chem Solids, 2024; 187: 111875.[DOI]
[10] Al-Douri Y, Khachai H, Khenata R. Chalcogenides-based quantum dots: Optical investigation using first-principles calculations. Mat Sci Semicon Proc, 2015; 39: 276-282.[DOI]
[11] Ramasamy V, Vijayalakshmi G. Effect of Zn doping on structural, optical and thermal properties of CeO2 nanoparticles. Superlattice Microst, 2015; 85: 510-521.[DOI]
[12] Jamal MdS, S. Singh, Dev AS et al. Atypical magnetism in Pt/MgO/FeCoB/Pt waveguide structure by exchanging the order of MgO and FeCoB layers. Acta Mater, 2023; 257: 119150.[DOI]
[13] Senapati S, Naik R. Multicolor emitting luminescent MgO nanocubes for implication in ratiometric optical thermometry. Surf Interfaces, 2023; 39: 102919.[DOI]
[14] Al-Gaashani R, Radiman S, Al-Douri Y et al. Investigation of the optical properties of Mg(OH)2 and MgO nanostructures obtained by microwave-assisted methods. J Alloy Compd, 2012; 521: 71.[DOI]
[15] Al-Douri Y, Hashim U, Khenata R et al. Ab initio method of optical investigations of CdS1-xTex alloys under quantum dots diameter effect. Sol Energy, 2015; 115: 33-39.[DOI]
[16] Al-Douri Y, Feng YP, Huan ACH. Optical investigations using ultra-soft pseudopotential calculations of Si0.5Ge0.5 alloy. Solid State Commun, 2008; 148: 521-524.[DOI]
[17] Al-Douri Y, Reshak AH, Baaziz H et al. An ab initio study of the electronic structure and optical properties of CdS1-xTex alloys. Sol Energy, 2010; 84: 1979-1984.[DOI]
[18] Ibraheam AS, Al-Douri Y, Hashim U et al. Cadmium effect on optical properties of Cu2Zn1-xCdxSnS4 quinternary alloys nanostructures. Sol Energy, 2015; 114: 39-50.[DOI]
[19] Wu WC, Juang YD. The optical properties of Mg-doped ZnO quantum dots. Solid State Commun, 2022; 350:14791.[DOI]
[20] Park SH, Hong WP, Kim JJ. Piezoelectric and spontaneous polarization effects on exciton binding energy and light emission properties of wurtzite ZnO/MgO quantum dots. Solid State Commun, 2017; 261: 21-25.[DOI]
[21] Mondal I, Saha Y, Halder P et al. Synchronization of theoretical and experimental studies on the enriched optical and dielectric properties of size modulated CoCr2O4 quantum dots. Solid State Sci, 2023; 146: 107342.[DOI]
[22] Karthikeyan N, Peter AJ, Lee CW. Induced electrostatic fields on optical gain in a polar quantum dot. Chem Phys Lett, 2020; 760: 138021.[DOI]
[23] Wang JX, Qu Y, Ban SL. Ternary mixed crystal effects on optical phonons in wurtzite ZnO quantum wells with asymmetric MgZnO barriers. Micro Nanostruct, 2023; 184: 207685.[DOI]
[24] Heo Y, Seo YS, Hong TE et al. Formation of optically-active disordered layers in (001) MgO single crystals. Curr Appl Phys, 2023; 46: 1-7.[DOI]
[25] Al-Qahtani SM, Abdullah AMA, Nishat MdRK et al. Diameter dependent polarization in ZnO/MgO disk-in-wire emitters: Multiscale modeling of optical quantum efficiency. Superlattice Microst, 2017; 103: 48-55.[DOI]
[26] Rabah M, Abbar B, Al-Douri Y et al. Calculation of structural, optical and electronic properties of ZnS, ZnSe, MgS, MgSe and their quaternary alloy Mg1-xZnxSySe1-y. Mater Sci Eng B, 2003; 100: 163-171.[DOI]
[27] Minimala NS, Peter AJ, Lee CW. Electric field induced nonlinear optical properties of a confined exciton in a ZnO/Zn1−xMgxO strained quantum dot. Physica E, 2013; 48: 133-139.[DOI]
[28] Fan X, Yang X, Kong X et al. Recent progresses on perovskite quantum dots patterning techniques for color conversion layer in micro-LED displays. Next Nanotechnol, 2024; 5: 100045.[DOI]
[29] Ikram M, Moeen S, Haider A et al. Experimental and computational study of annealed nickel sulfide quantum dots for catalytic and antibacterial activity, Nano Mater Sci 2023 [Epub ahead of print].[DOI]
[30] Cao W, Zhang W, Dong L et al. Progress on quantum dot photocatalysts for biomass valorization. Exploration, 2023; 3: 20220169.[DOI]
[31] Fan X, Wang S, Yang X et al. Brightened bicomponent perovskite nanocomposite based on förster resonance energy transfer for Micro-LED displays. Adv Mater, 2023; 35: 2300834.[DOI]
Brief of Corresponding Author(s)
Yarub Al-Douri He is a Professor of nanoscience and nanotechnology at American University of Iraq, Sulaimani, Adjunct Professor in Bahcesehir University, Turkey & University of Education, Pakistan. He has PhD in Materials Science. Al-Douri has initiated Nanotechnology Engineering MSc Program and Nano Computing Laboratory, the first in Malaysia and Southeast Asia, in addition to founding Applied Materials Laboratory in Algeria. Also, Head of Department of Nanomaterials and Department of International Networking and Collaboration, additionally to Secretary of Department of Physics. His research mainly focuses on nanotechnology, nanostructures, nanodevices, nanomaterials, renewable energy, modelling and simulation. He has more than 817 publications, 9,764 citations with an h-index of 61. |




 Copyright ©