
Development and Validation of a Predictive Model for Circadian Syndrome in Middle-aged and Elderly Adults
Qihui Ye1#, Tongxin Sun1#, Jiale Wang2, Xunliang Li3, Deguang Wang1,3*
1School of Nursing, Anhui Medical University, Hefei, Anhui Province, China
2The Fifth Clinical College of Anhui Medical University, Hefei, Anhui Province, China
3Department of Nephrology, the Second Affiliated Hospital of Anhui Medical University, Hefei, Anhui Province, China
#Both authors contributed equally to this manuscript.
*Correspondence to: Deguang Wang, MD, Professor, Department of Nephrology, the Second Affiliated Hospital of Anhui Medical University, No. 678 Frong Road, Hefei, 230601, Anhui Province, China; Email: wangdeguang@ahmu.edu.cn
DOI: 10.53964/cme.2025004
Abstract
Objective: To construct and verify a predictive model for circadian syndrome (CircS) among middle-aged and elderly adults.
Methods: A total of 5,977 individuals from the China Health and Retirement Longitudinal Study were enrolled. The least absolute shrinkage and selection operator method was used to identify potential features for multivariable logistic regression analyses. A nomogram was created utilizing the chosen predictors. The nomogram's discrimination, predictive performance, and clinical applicability were evaluated using the area under the curve (AUC), calibration curves, and decision curve analysis (DCA), respectively.
Results: The prevalence of CircS among middle-aged and elderly adults was 30.11%. The nomogram comprised 11 predictors: gender, age, triglycerides, high-density lipoproteins, glucose, uric acid, sleep duration, depression score, systolic blood pressure, waist circumference, and body mass index. The AUC values for the model were 0.922 and 0.930 in the training and validation sets, respectively, indicating excellent discriminatory capability. The calibration curve of the nomogram showed strong concordance between the predicted and actual probabilities. The DCA suggested that the nomogram has clinical utility for CircS in middle-aged and elderly individuals.
Conclusion: This study successfully developed a reliable nomogram model to predict CircS in middle-aged and elderly adults with high clinical predictive value. Clinicians can use it to identify high-risk populations and provide references for early prevention.
Keywords: circadian syndrome, middle-aged and elderly adults, nomogram, predictive model, China Health and Retirement Longitudinal Study
1 INTRODUCTION
Circadian rhythms are regulated by an internal system called the “circadian clock”, which maintains internal stability by sensing external stimuli[1]. These rhythms influence sleep-wake cycles, cognitive functions, and physiological processes like blood pressure, heart rate, and hormone levels, playing a vital role in human health[2]. Circadian rhythm disorders, represented by metabolic syndrome (MetS), have been linked to higher risks of diseases like type 2 diabetes, stroke and coronary heart disease[3]. Emerging evidence suggests that disturbances in circadian rhythms are associated not only with MetS but also with its comorbidities, including sleep disturbances, steatohepatitis, depression and cognitive dysfunction[4]. Consequently, scholars suggest that circadian disorder may be a crucial underlying etiological factor for MetS and propose renaming it as the “circadian syndrome” (CircS)[4]. CircS is defined by any four of the following: dyslipidemia, hypertension, centripetal obesity, diabetes mellitus, depression, and sleep deprivation[5].
A cohort study revealed that CircS affects 31.5% of middle-aged and elderly adults[6]. The aging population and the growing number of middle-aged and elderly individuals pose significant public health challenges[7]. Recent research has linked CircS to increased frailty, as well as a heightened risk of chronic kidney disease, kidney stones, cardiovascular disease, and cognitive impairment[5,8-11]. Furthermore, CircS has demonstrated greater predictive power for cardiovascular disease, cognitive dysfunction, and benign prostatic hyperplasia in comparison to MetS[5,12,13]. As individuals age and physical function declines, middle-aged and elderly adults become more susceptible to these health issues. Therefore, early recognition and prediction of CircS in this population are crucial, as timely interventions can help mitigate the risk of these severe conditions and enhance overall health outcomes.
Research has identified risk factors for CircS, such as the hypertriglyceridemia lumbar phenotype, mood, gender, age, and physical condition[6,14]. However, a systematic review of the literature reveals a limited understanding of the risk factors for CircS, and no predictive models have been developed for CircS. Given this gap, there is a clear need to construct a predictive model for CircS using easily accessible indicators and referencing relevant predictors of MetS.
A nomogram is a commonly employed method for data visualization technique to construct predictive models. It assigns scores to predictors and combines these scores to estimate an individual’s risk. This tool enhances the clarity and accuracy of risk assessment, aiding in precision medicine and personalized treatment[15].
In conclusion, the study aims to develop and validate a predictive tool for CircS among middle-aged and elderly adults using a nomogram. The model seeks to identify high-risk individuals promptly, enabling timely and precise interventions to mitigate adverse outcomes.
2 MATERIALS AND METHODS
2.1 Design of Research and Data Sources
This study employs cross-sectional data from the 2015 China Health And Retirement Longitudinal Study (CHARLS), a comprehensive nationwide survey in China, specifically targeting individuals aged 45 and above. Public access to CHARLS data is accessible via the official website (http://charls.pku.edu.cn/en).
The baseline survey for CHARLS commenced in 2011 employing a multi-stage probability sampling technique, encompassing 17,000 individuals from around 10,000 households in 150 counties and 450 villages. Follow-up visits have been conducted every 2 or 3y, focusing on collecting sociodemographic and healthcare information, assessing health status and functioning, and measuring blood biomarkers, which are generally considered highly authoritative. Participants aged 45y or older with complete measurements of variables related to CircS were included in this study. Those who refused to participate, were unable to complete the survey, or had more than 20% missing values for covariates were excluded. Based on these criteria, we analyzed data from 5,977 subjects. Participants were assigned in a random manner, with a ratio of 7:3, to either the training set or the validation set. The training set was used to create the risk prediction model. Figure 1 illustrates the participant selection process. The Biomedical Ethics Committee of Peking University (IRB00001052-11015) granted approval to CHARLS, and all participants provided informed consent.
|
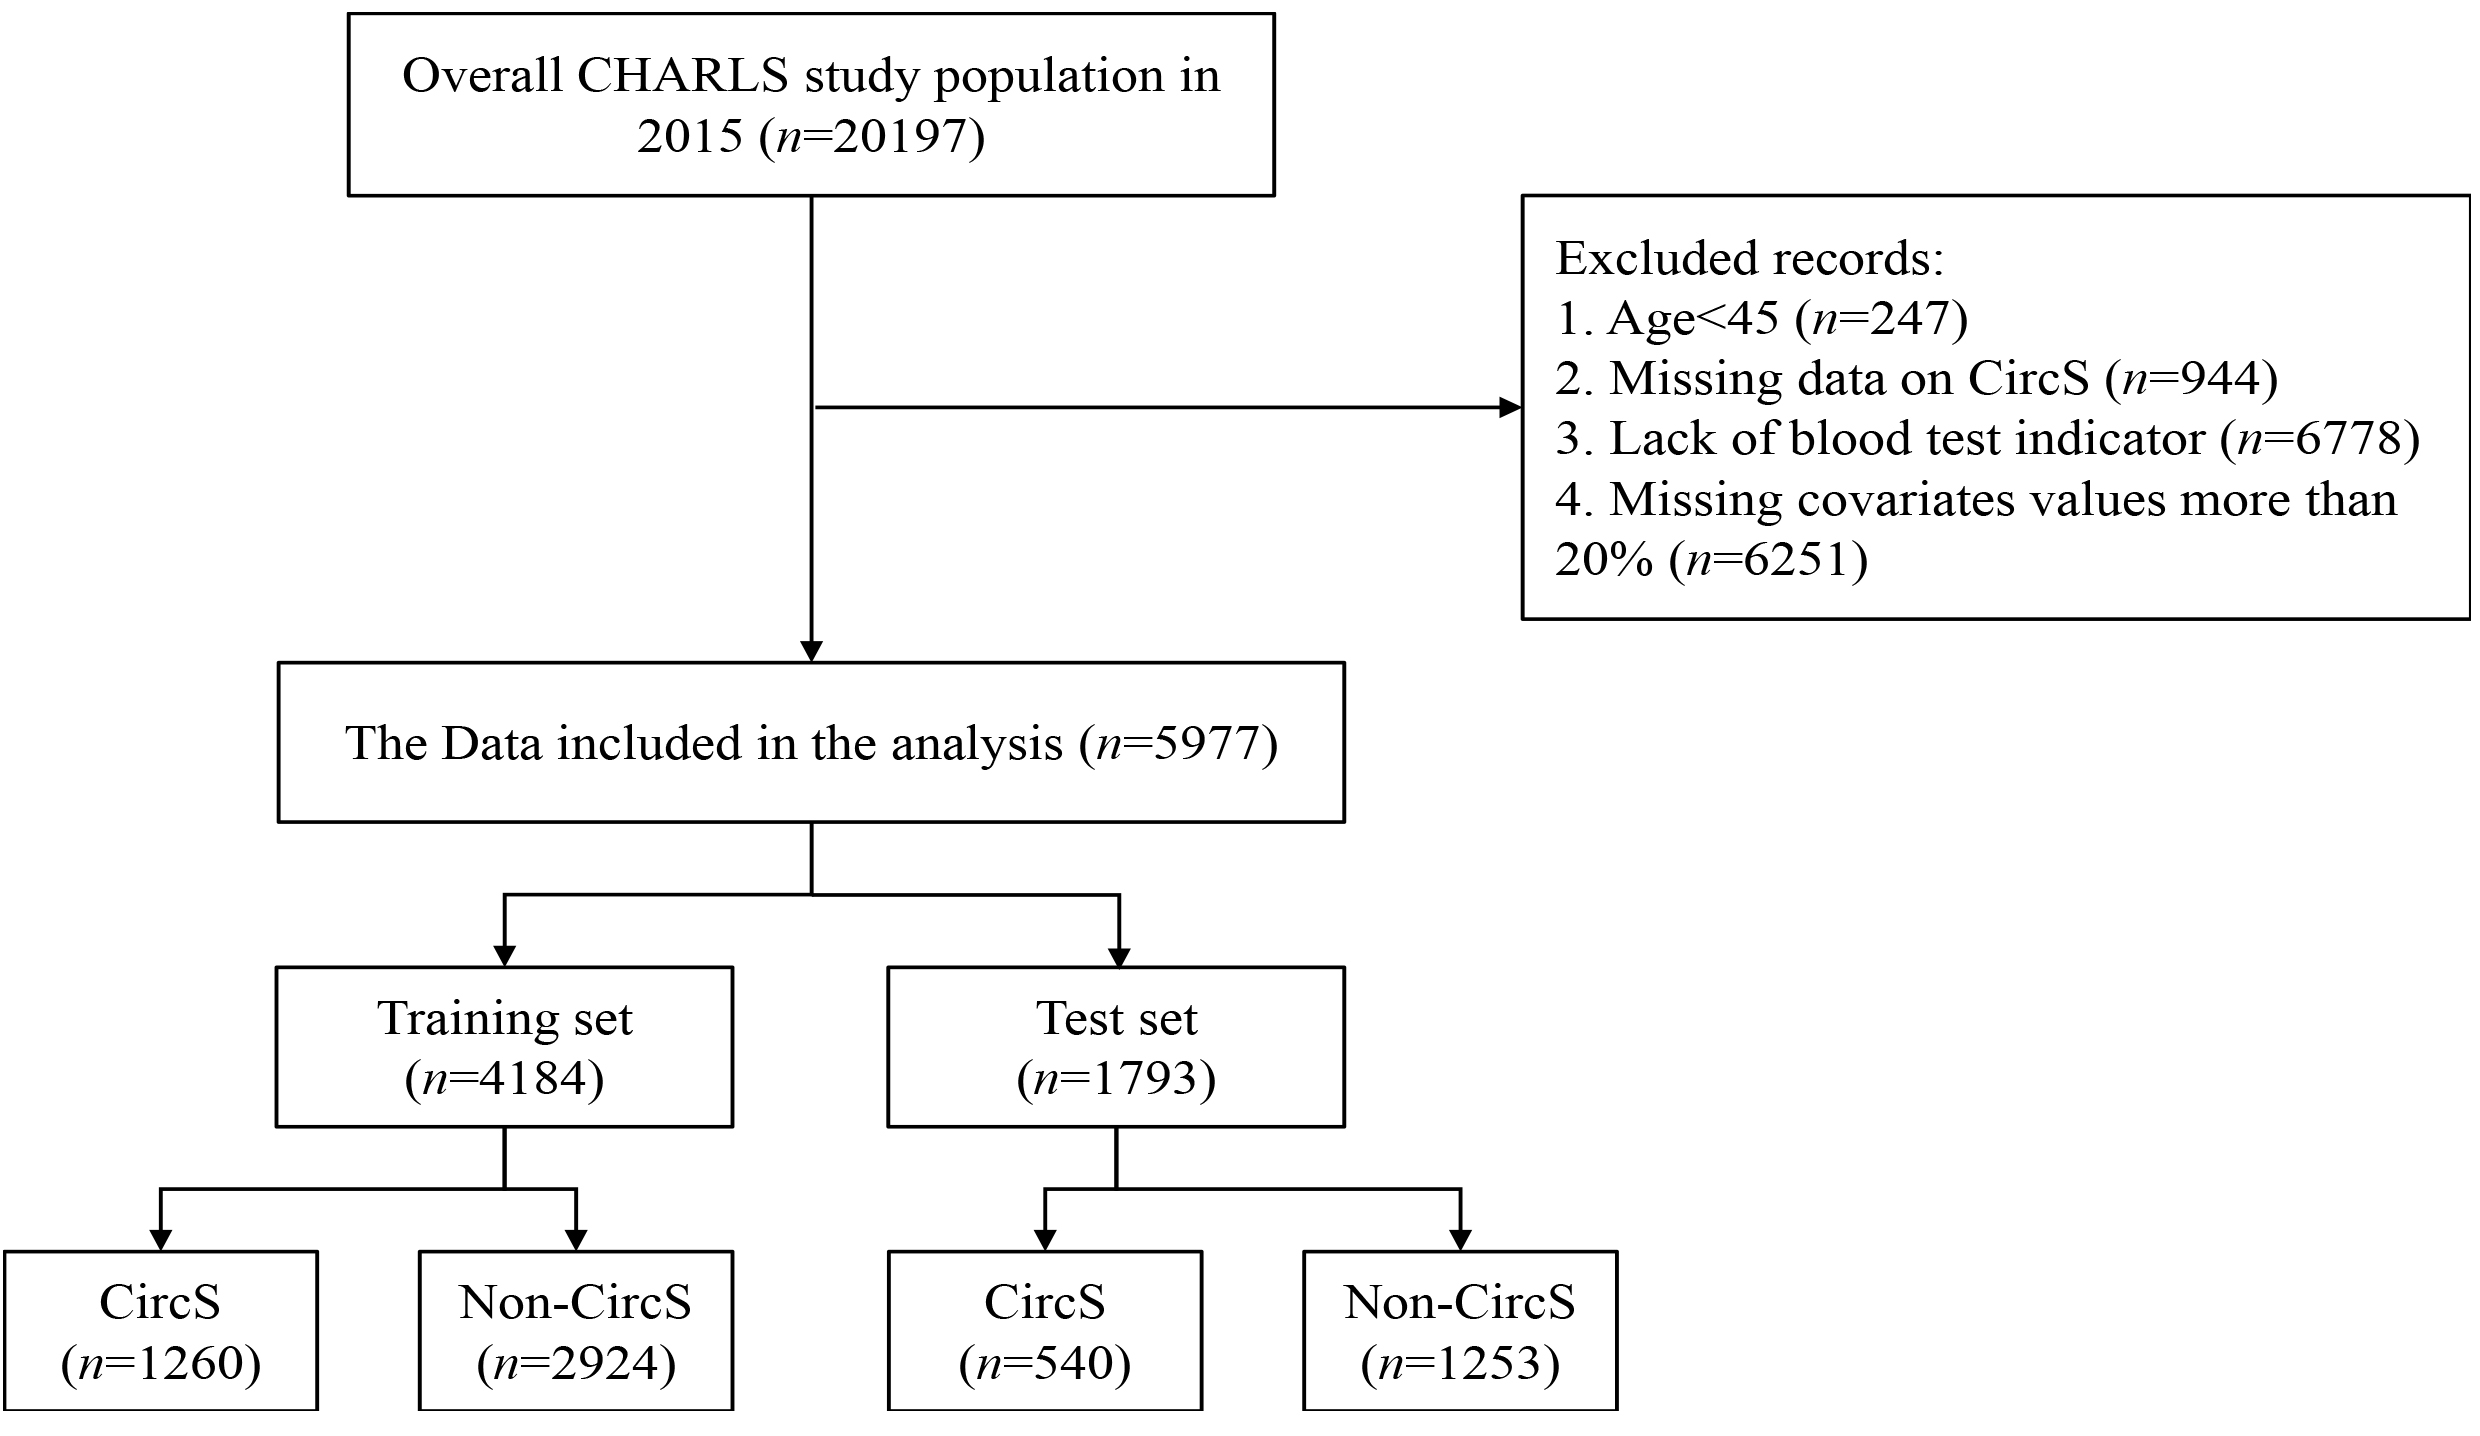
Figure 1. Participants Selection Flowchart.
This flowchart illustrates the sample selection process for the 2015 CHARLS study. A total sample of 20,197 individuals was initially considered. Exclusion criteria included: age under 45 years (n=247), missing CircS data (n=944), lack of blood test indicators (n=6,778), and covariate missing values exceeding 20% (n=6,251). The final analysis sample comprised 5,977 individuals, which was further divided into a training set (n=4,184) and a test set (n=1,793) with additional stratification by CircS status.
Though a literature review and considering variable accessibility, we collected a wide range of variables to assess various demographic, clinical, and lifestyle factors. The collected variables are categorized as follows:
Demographic Information: We gathered details on gender, age, place of residence, educational attainment, marital status, smoking and drinking habits, and disability status.
Biological Markers and Physical Measures: Fasting blood samples were taken to measure key biomarkers, including triglycerides (TG), total cholesterol (TC), low-density lipoprotein (LDL), high-density lipoprotein (HDL), glucose (GU), C-reactive protein (CRP), creatinine (CR), uric acid (UA), and blood urea nitrogen (BUN). In addition, we measured systolic and diastolic blood pressure (SBP and DBP), height, weight, and waist circumference (WC). Body mass index (BMI) was calculated based on height and weight.
Exercise Levels: The short version of the International Physical Activity Questionnaire (IPAQ) was used to assess participants’ exercise levels[16]. Participants were instructed to remember activities in which they engaged in physical exercise for a minimum of 10 minutes at a time. The activities were then classified into three categories based on their intensity: low exercise (such as walking within the home or workplace, as well as other recreational and leisurely walks), moderate exercise (activities that require slightly more effort than usual, such as carrying light objects, cycling at a regular pace, or cleaning the floor), and heavy exercise (activities that significantly increase breathing difficulty, such as lifting heavy weights, digging, plowing, aerobics, fast cycling, or cycling with a heavy load).
Sleep Duration: Sleep duration was assessed as the sum of naptime and total nighttime sleep. Participants were asked, “During the past month, how many hours of actual sleep did you get at night (average hours for one night)?” and "During the past month, how long did you take a nap after lunch?”
Depressive Symptoms: The 10-item Center for Epidemiologic Studies Depression Scale (CESD-10) was utilized to assess depressive symptoms. A score of 10 or higher indicates that the respondent is experiencing considerable depressive symptoms[17]. The CESD-10 is a widely used and validated tool in epidemiological research for assessing depressive symptoms across diverse populations, with a Cronbach's α of 0.86[18]. It has shown strong reliability and validity in both general and clinical populations and is frequently cited in studies investigating mental health outcomes.
2.2 Diagnostic Criteria for CircS
Diagnostic criteria for CircS have been developed and validated in CHARLS[5] and mandate the satisfaction of a minimum of four of the subsequent criteria: elevated waist circumference (≥85cm in men, ≥80cm in women); elevated triglycerides (≥150mg/dL); reduced HDL-C (<40mg/dL in men, <50mg/dL in women); elevated blood pressure or antihypertensive drug treatment (SBP ≥130 or DBP ≥85mmHg); elevated fasting glucose or drug treatment of elevated glucose (≥100mg/dL); short sleep (<6h/d); depressive symptoms (CESD-10 score ≥10).
2.3 Preprocessing of Data
All variables in this study had less than 20% missing values (Table S1). We utilized the R "mice" package to implement multiple imputation, effectively reducing bias caused by missing data and improving estimate accuracy.
2.4 Statistical Analysis
The median and interquartile range (IQR) were utilized for continuous variables, and t-tests or Mann-Whitney U-tests were employed for group comparisons. We compared percentages and ratios on categorical variables between groups using chi-square tests. There was a 7:3 split between the training and validation sets for the participants.
We utilized the least absolute shrinkage and selection operator (LASSO) regression analysis to identify the most relevant predictors within the training set for this research. These identified predictors were then subjected to multifactor logistic regression for further analysis. Predictors exhibiting two-tailed p-values less than 0.05 were selected to develop the nomogram.
In addition, we utilized the area under the curve (AUC) and concordance index (C-index) of receiver operating characteristic (ROC) curves to measure the ability of the nomogram to distinguish between different outcomes. The alignment between the anticipated probabilities and the observed results was evaluated by employing calibration curves and Hosmer-Lemeshow goodness of fit. Decision curve analysis (DCA) evaluated the nomogram's clinical applicability.
The data was analyzed and processed using the statistical software R version 4.3.3. A two-tailed p-value less than 0.05 was deemed statistically significant.
3 RESULTS
3.1 Baseline Characteristics
A total of 5,977 middle-aged and elderly adults were enrolled in the study, of whom 1,800 (30.11%) presented with CircS. The prevalence of CircS was higher in females, with 1,213 (67.4%) female patients compared to 587 (32.6%) male patients. In the CircS individuals, the median age was 61 years (IQR: 53.0, 67.0). The detection rates were 42.27% (2,523/5,977) for hypertension, 35.72% (2,135/5,977) for hyperglycemia, and 32.91% (1,967/5,977) for dyslipidemia. The median waist circumference was 92 cm (IQR: 86.8, 98.0), the median sleep duration was 6 hours (IQR: 5.0, 8.0), and the median depressive symptom score was 10 (IQR: 5.0, 15.0). Patients with CircS experienced shorter sleep duration, higher BMI, and more severe depressive symptoms compared to the population without CircS. Table 1 provides a comprehensive overview of the baseline characteristics of this dataset. Additionally, the baseline characteristics of training and validation groups are detailed in Table S2. The results revealed no statistically significant differences between the two groups.
Table 1. Baseline Characteristics of the Study Participants
Variables |
Total (n=5,977) |
Non-CircS (n=4,177) |
CircS (n=1,800) |
P |
Gender |
|
|
|
|
Male |
2,798 (46.81%) |
2,211 (52.93%) |
587 (32.61%) |
<0.001 |
Female |
3,179 (53.19%) |
1,966 (47.07%) |
1,213 (67.39%) |
|
Age |
60.0 [52.0, 66.0] |
60.0 [52.0, 66.0] |
61.0 [53.0, 67.0] |
<0.001 |
Education level |
|
|
|
<0.001 |
Primary and below |
4,247 (71.06%) |
2,904 (69.52%) |
1,343 (74.61%) |
|
Middle school |
1,140 (19.07%) |
841 (20.13%) |
299 (16.61%) |
|
High school and above |
590 (9.87%) |
432 (10.34%) |
158 (8.78%) |
|
Marital status |
|
|
|
0.0023 |
Yes |
5,260 (88.00%) |
3,711 (88.84%) |
1,549 (86.06%) |
|
No |
717 (12.00%) |
466 (11.16%) |
251 (13.94%) |
|
Residence |
|
|
|
<0.001 |
Yes |
2,263 (37.86%) |
1,477 (35.36%) |
786 (43.67%) |
|
No |
3,714 (62.14%) |
2,700 (64.64%) |
1,014 (56.33%) |
|
Drinking |
|
|
|
<0.001 |
Yes |
2,115 (35.39%) |
1,637 (39.19%) |
478 (26.56%) |
|
No |
3,862 (64.61%) |
2,540 (60.81%) |
1,322 (73.44%) |
|
Smoking |
|
|
|
<0.001 |
Yes |
1,673 (27.99%) |
1,349 (32.30%) |
324 (18.00%) |
|
No |
4,304 (72.01%) |
2,828 (67.70%) |
1,476 (82.00%) |
|
Heavy exercise |
|
|
|
<0.001 |
Yes |
2,187 (36.59%) |
1,668 (39.93%) |
519 (28.83%) |
|
No |
3,790 (63.41%) |
2,509 (60.07%) |
1,281 (71.17%) |
|
Moderate exercise |
|
|
|
<0.001 |
Yes |
3,445 (57.64%) |
2,466 (59.04%) |
979 (54.39%) |
|
No |
2,532 (42.36%) |
1,711 (40.96%) |
821 (45.61%) |
|
Low exercise |
|
|
|
0.013 |
Yes |
4,776 (79.91%) |
3,373 (80.75%) |
1,403 (77.94%) |
|
No |
1,201 (20.09%) |
804 (19.25%) |
397 (22.06%) |
|
Disability |
|
|
|
0.004 |
Yes |
454 (7.60%) |
290 (6.94%) |
164 (9.11%) |
|
No |
5,523 (92.40%) |
3,887 (93.06%) |
1,636 (90.09%) |
|
TG |
115.9 [83.2, 172.6] |
99.1 [76.1, 134.5] |
180.5 [132.7, 256.6] |
<0.001 |
HDL |
49.8 [43.2, 57.5] |
52.5 [45.6,59.8] |
45.2 [39.4, 50.6] |
<0.001 |
LDL |
100.4 [82.6, 119.7] |
100.0 [83.0, 118.9] |
101.4 [82.2, 121.6] |
0.204 |
TC |
181.5 [160.2,205.8] |
178.4 [157.9, 202.3] |
188.8 [165.9, 213.9] |
<0.001 |
GU |
95.5 [88.3, 106.3] |
91.9 [86.5, 99.1] |
104.5 [95.5, 122.5] |
<0.001 |
CRP |
1.4 [0.8, 2.6] |
1.2 [0.6, 2.2] |
2.1 [1.3, 3.6] |
<0.001 |
UA |
4.7 [3.9, 5.7] |
4.7 [3.9, 5.6] |
4.9 [4.1, 6.0] |
<0.001 |
CR |
0.8 [0.7, 0.9] |
0.8 [0.7, 0.9] |
0.7 [0.6, 0.9] |
<0.001 |
BUN |
14.8 [12.3, 17.9] |
14.8 [12.3, 18.2] |
14.6 [12.3, 17.9] |
0.039 |
Sleep Duration |
7.0 [6.0, 8.5] |
7.0 [6.0, 8.5] |
6.0 [5.0, 8.0] |
<0.001 |
CESD-10 |
6.0 [3.0, 12.0] |
6.0 [3.0, 10.0] |
10.0 [5.0, 15.0] |
<0.001 |
SBP |
126.0 [114.0, 140.7] |
122.7 [111.7, 135.7] |
135.3 [122.0, 147.3] |
<0.001 |
DBP |
75.0 [67.7, 82.7] |
73.7 [66.3, 80.7] |
78.3 [71.3, 86.3] |
<0.001 |
WC |
86.0 [79.0, 93.5] |
83.0 [76.6, 90.2] |
92.0 [86.8, 98.0] |
<0.001 |
BMI |
23.8 [21.3, 26.3] |
22.8 [20.6, 25.3] |
25.6 [23.7, 28.0] |
<0.001 |
3.2 Predictors of CircS In Middle-aged and Elder Adults
We determined that 0.014 (lambda.1se) was the optimal value for λ using a LASSO regression model and 10-fold cross-validation. Eleven predictors with non-zero coefficients were identified (Figure 2A and B). A nomogram was then created using multifactor logistic regression analysis based on these final eleven predictors (Figure 3). Results from the multifactor logistic regression showed that eleven variables could be considered independent predictors: gender (OR: 5.219, 95%CI: 4.281-6.386), age (OR: 1.019, 95%CI: 1.01-1.028), TG (OR: 1.011, 95%CI: 1.01-1.012), HDL (OR: 0.921, 95%CI: 0.912-0.93), GU (OR: 1.022, 95%CI: 1.019-1.025), UA (OR: 1.242, 95%CI: 1.164-1.326), sleep duration (OR: 0.744, 95%CI: 0.715-0.775), CESD-10 (OR: 1.143, 95%CI: 1.127-1.159), SBP (OR: 1.035, 95%CI: 1.03-1.039), WC (OR: 1.06, 95%CI: 1.049-1.072), and BMI (OR: 1.056, 95%CI: 1.024-1.089). More details is presented in Table 2.
|
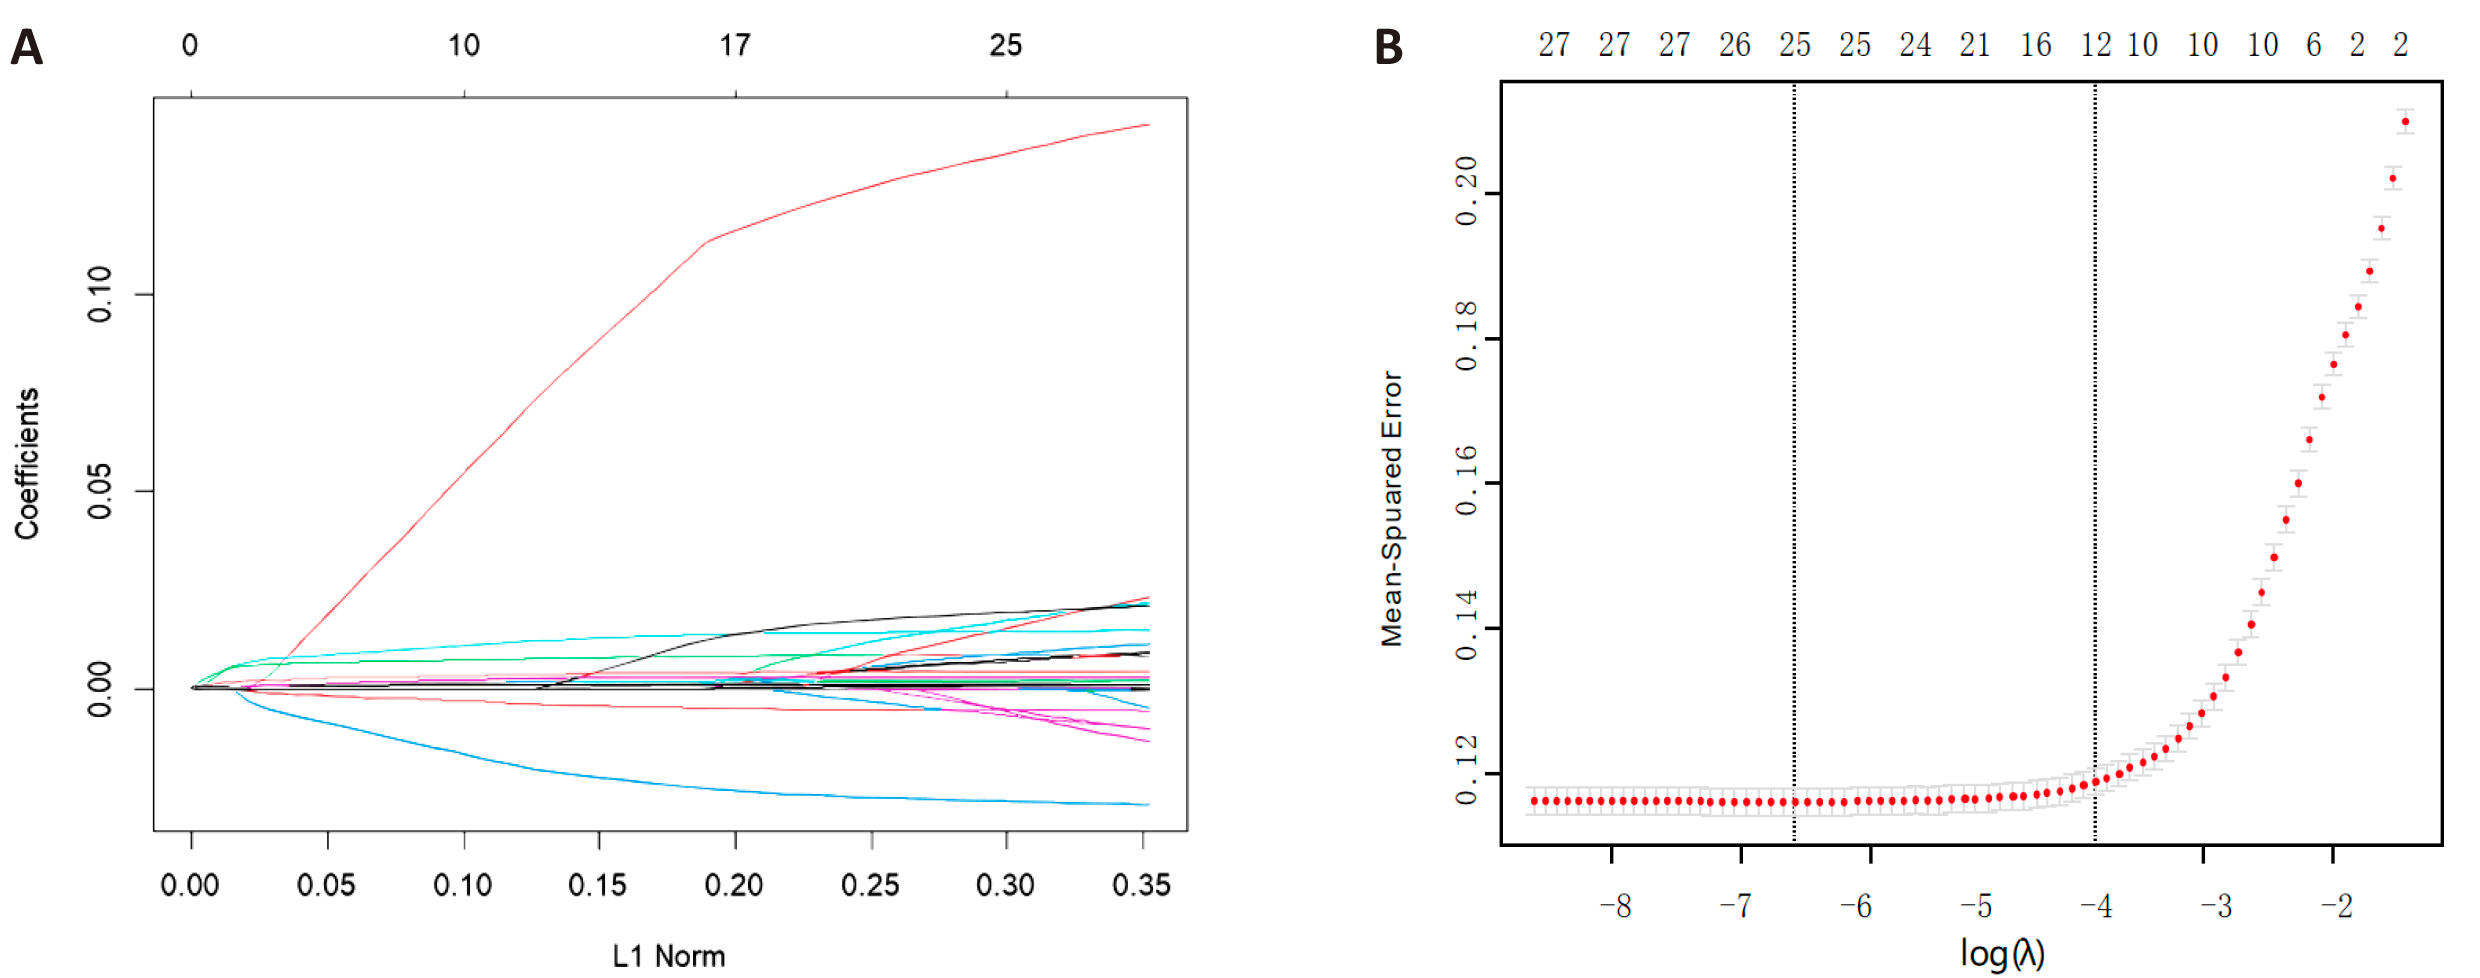
Figure 2. Demographic and Clinical Feature Selection Through the LASSO Regression Model. A: Regularization path for lasso coefficients, generating a distribution of coefficients based on a logarithmic (lambda) sequence with nonzero optimal coefficients. B: Utilizing a 10-fold cross-validation approach, the optimal parameter within the lasso model (lambda-1se) was selected, resulting in 11 non-zero coefficients corresponding to the right vertical dashed line.
Table 2. Section of Clinical Factors by Logistic Regression
Variables |
B |
SE |
Wald |
OR (95%CI) |
P Value |
Gender |
1.652 |
0.102 |
262.495 |
5.219 (4.281-6.386) |
<0.001 |
Age |
0.019 |
0.005 |
15.643 |
1.019 (1.010-1.028) |
<0.001 |
TG |
0.011 |
0.001 |
369.098 |
1.011 (1.010-1.012) |
<0.001 |
HDL |
-0.082 |
0.005 |
266.840 |
0.921 (0.912-0.930) |
<0.001 |
GU |
0.022 |
0.002 |
212.885 |
1.022 (1.019-1.025) |
<0.001 |
UA |
0.217 |
0.033 |
42.434 |
1.242 (1.164-1.326) |
<0.001 |
Sleep Duration |
-0.295 |
0.021 |
206.299 |
0.744 (0.715-0.775) |
<0.001 |
CESD-10 |
0.134 |
0.007 |
357.812 |
1.143 (1.127-1.159) |
<0.001 |
SBP |
0.034 |
0.002 |
224.480 |
1.035 (1.030-1.039) |
<0.001 |
WC |
0.059 |
0.005 |
116.381 |
1.060 (1.049-1.072) |
<0.001 |
BMI |
0.055 |
0.016 |
12.506 |
1.056 (1.024-1.089) |
<0.001 |
|
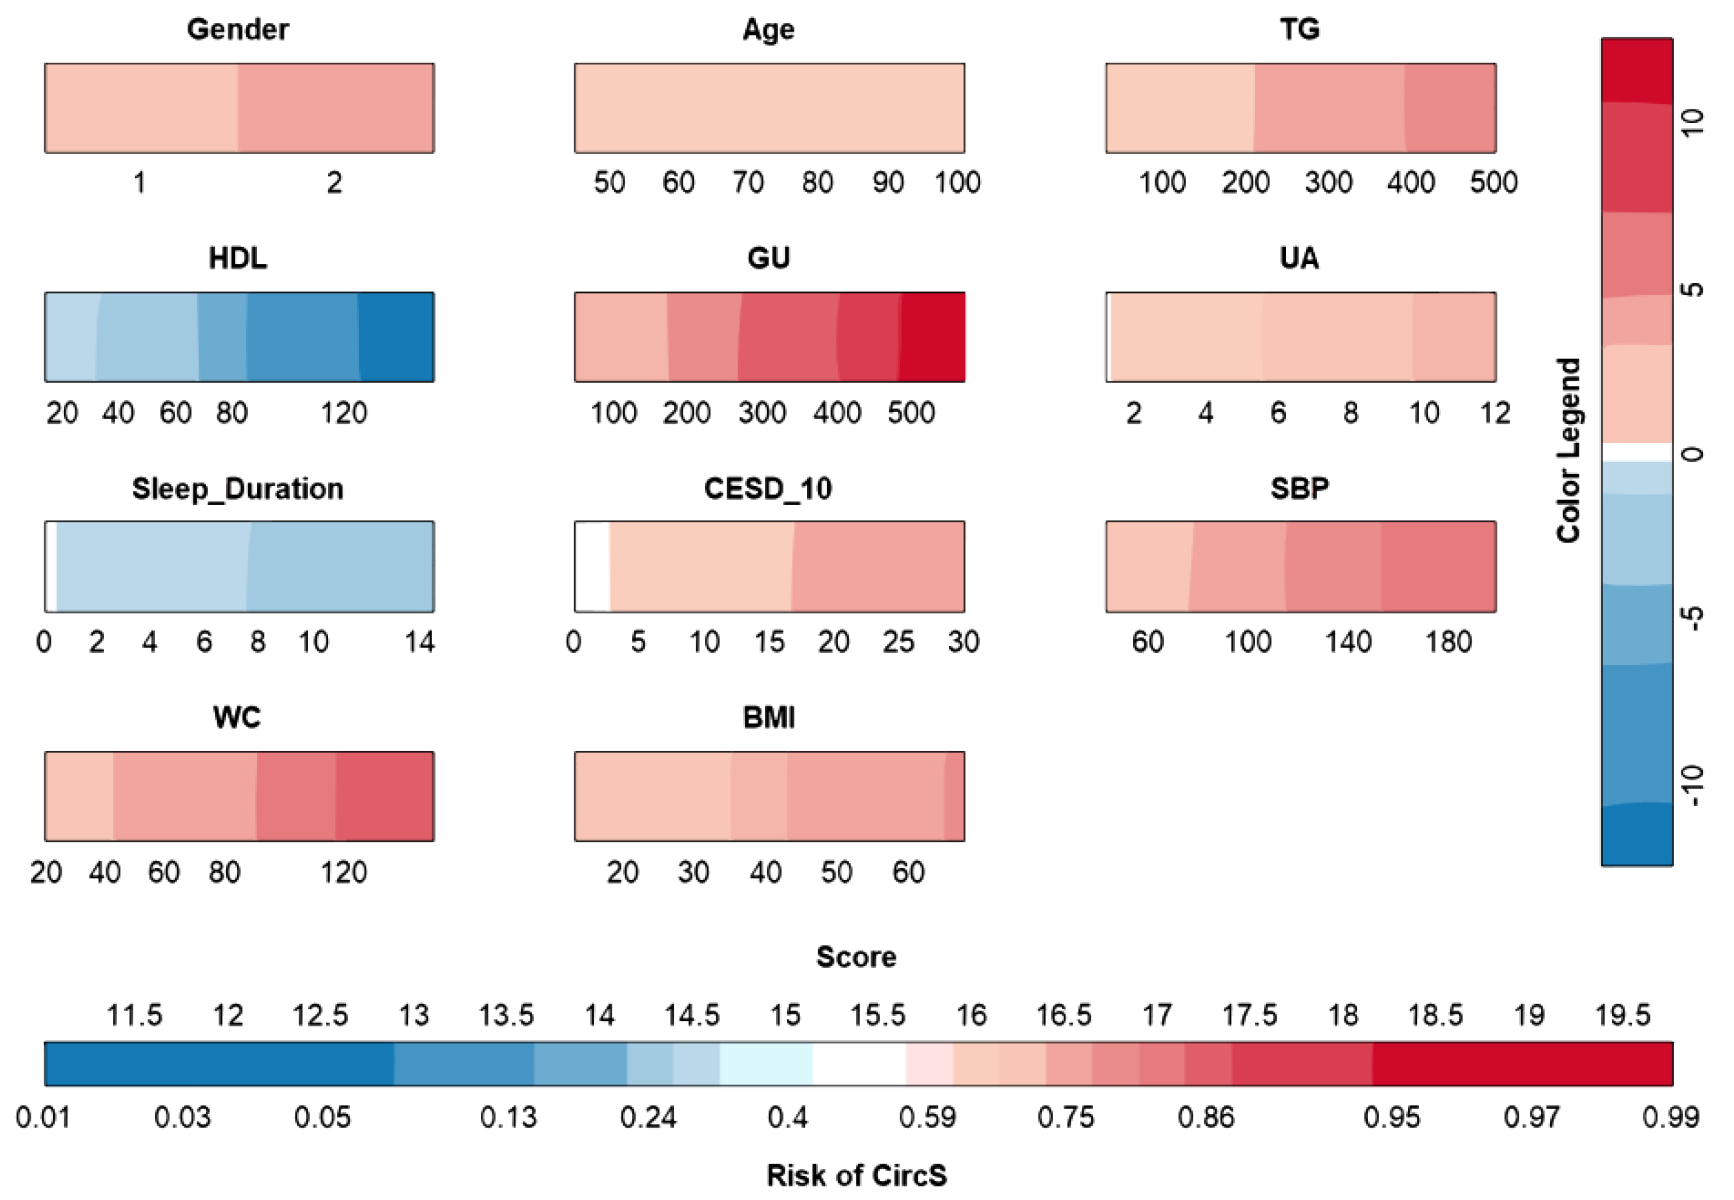
Figure 3. Nomogram to Estimate the Risk of CircS in Middle-aged and Elderly Adults. The risk of circadian rhythm syndrome was presented (e.g., gender, age, HDL, TG, GU, UA, SBP, etc.). Each color bar represents the range of a specific factor, with color intensity indicating the strength of association with CircS risk. The darker colors indicating higher risk levels.
3.3 Performance Evaluation of the Nomogram Model in both the Training and Validation Datasets
The discriminative ability of the nomogram model was assessed by examining the ROC curves for both the training and validation datasets. In the training set, the AUC was 0.922, with a 95% CI ranging from 0.913 to 0.930. In the validation set, the AUC was 0.930, with a 95% CI from 0.918 to 0.942. The findings indicate that the nomogram exhibits a high level of discriminatory ability (Figure 4A and B).
|
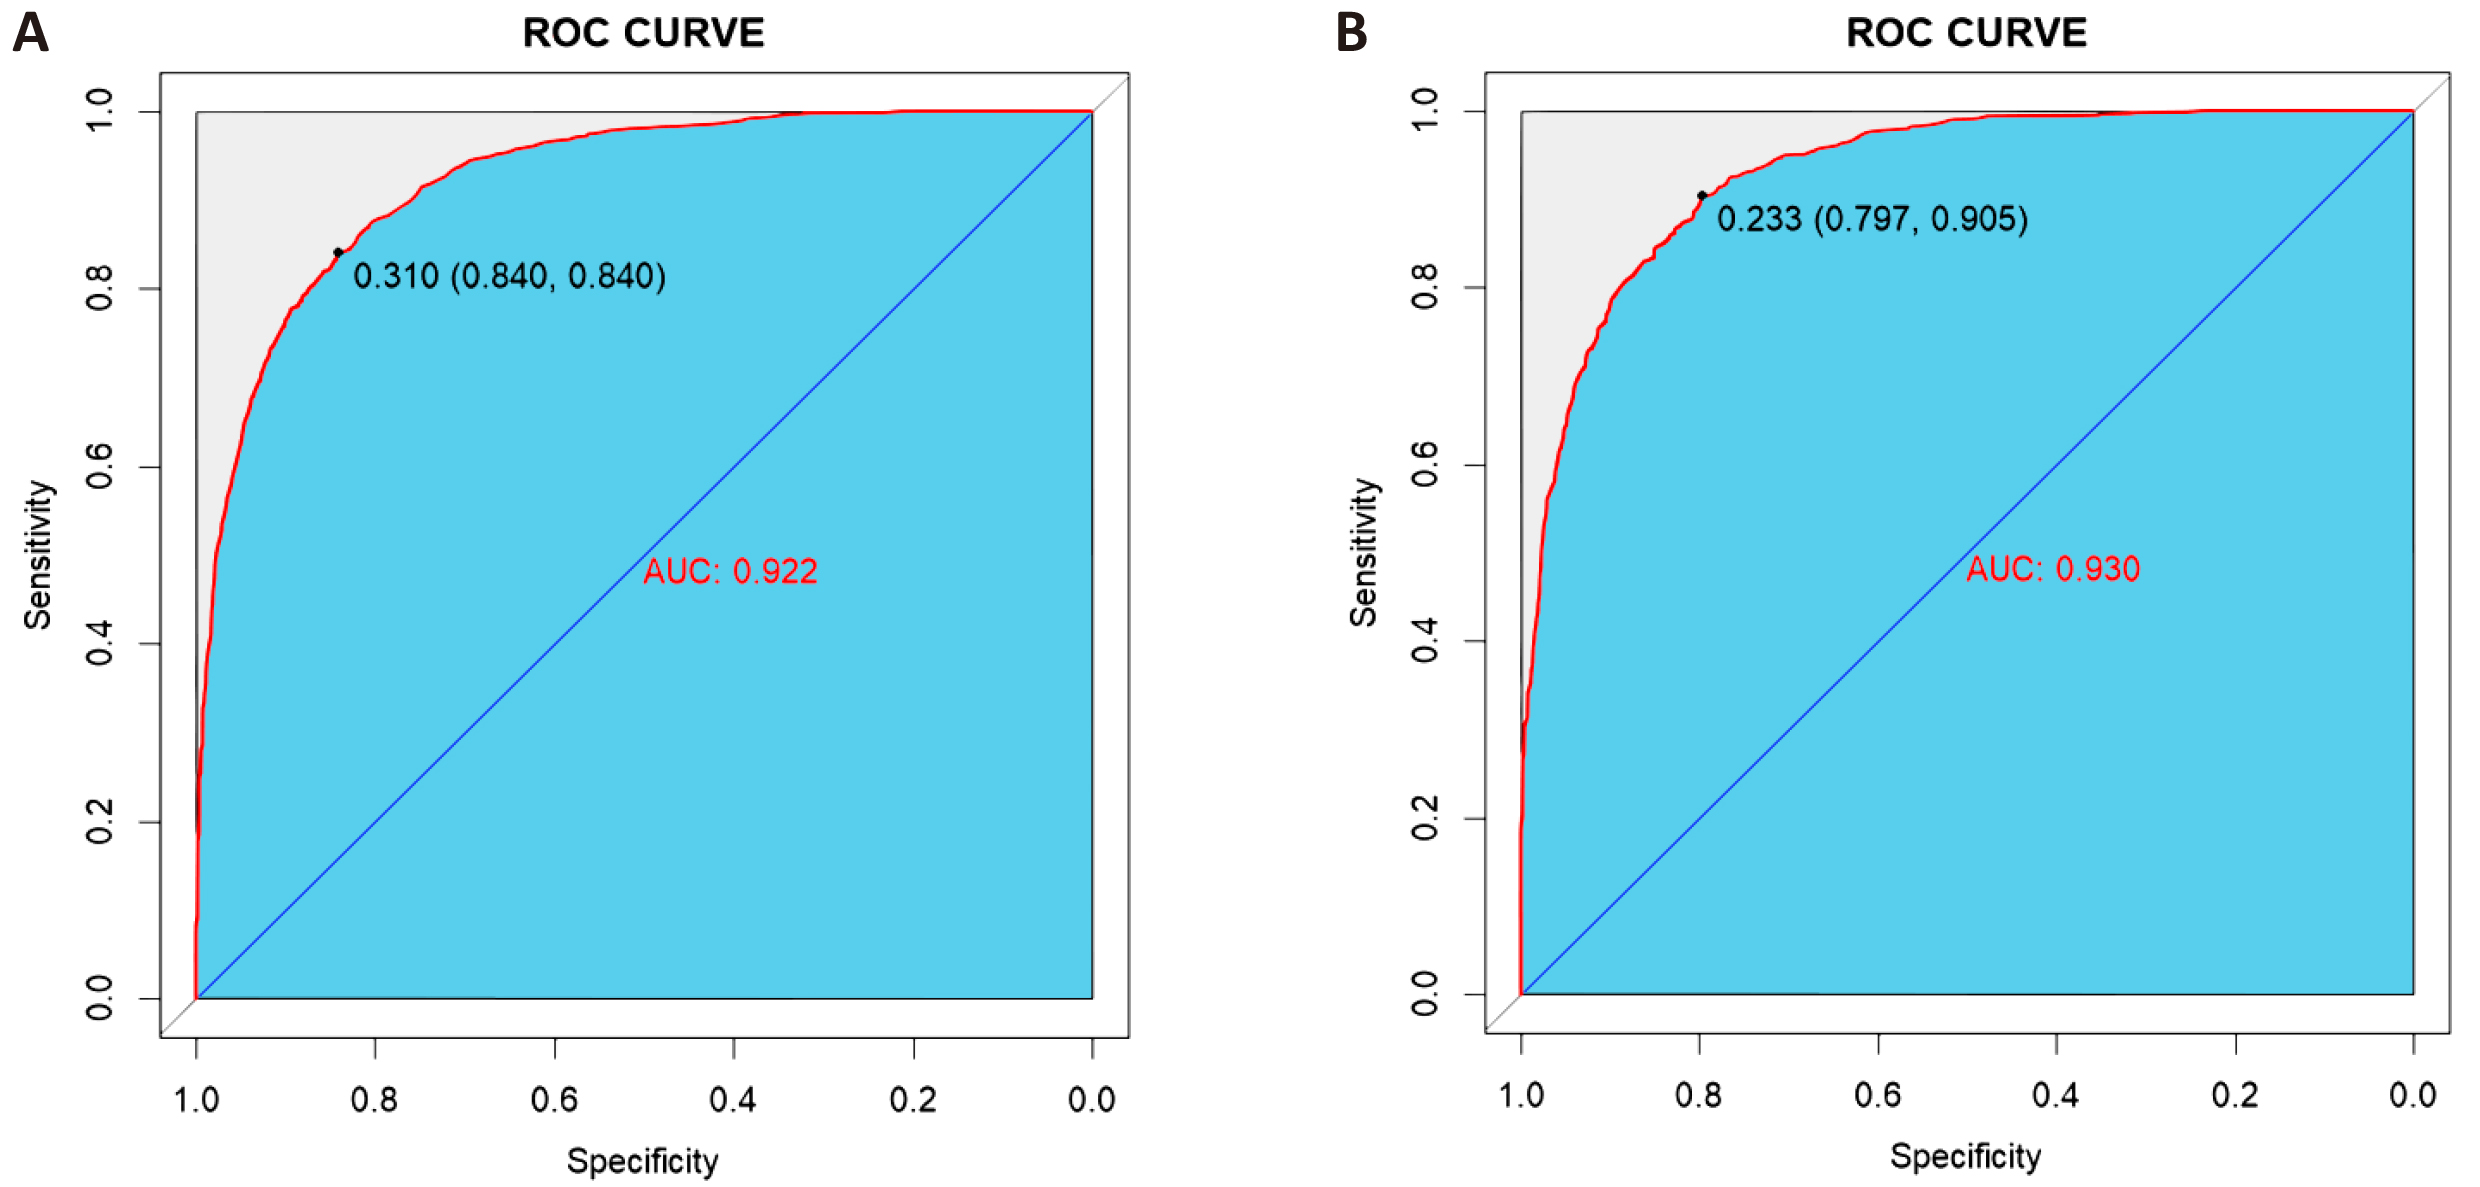
Figure 4. Receiver Operating Characteristic Curve of Nomogram. A: ROC curve for the training set: The ROC curve illustrates the model’s sensitivity and specificity in the training set, with an area under the curve (AUC) of 0.922. B: ROC curve for the test set: The ROC curve shows the model’s performance in the test set, with an AUC of 0.930, indicating robust model performance.
The nomogram model underwent further evaluation using calibration curves in both the training and validation sets, as depicted in Figure 5A and B. The Hosmer-Lemeshow test indicated that the predicted probabilities had p-values of 0.783 and 0.748 for the training and validation sets, respectively, when compared to the actual probabilities. These findings exhibit a robust correlation between the predicted and actual probabilities, affirming the model's accuracy in predicting the probability of CircS among middle-aged and elderly individuals.
|
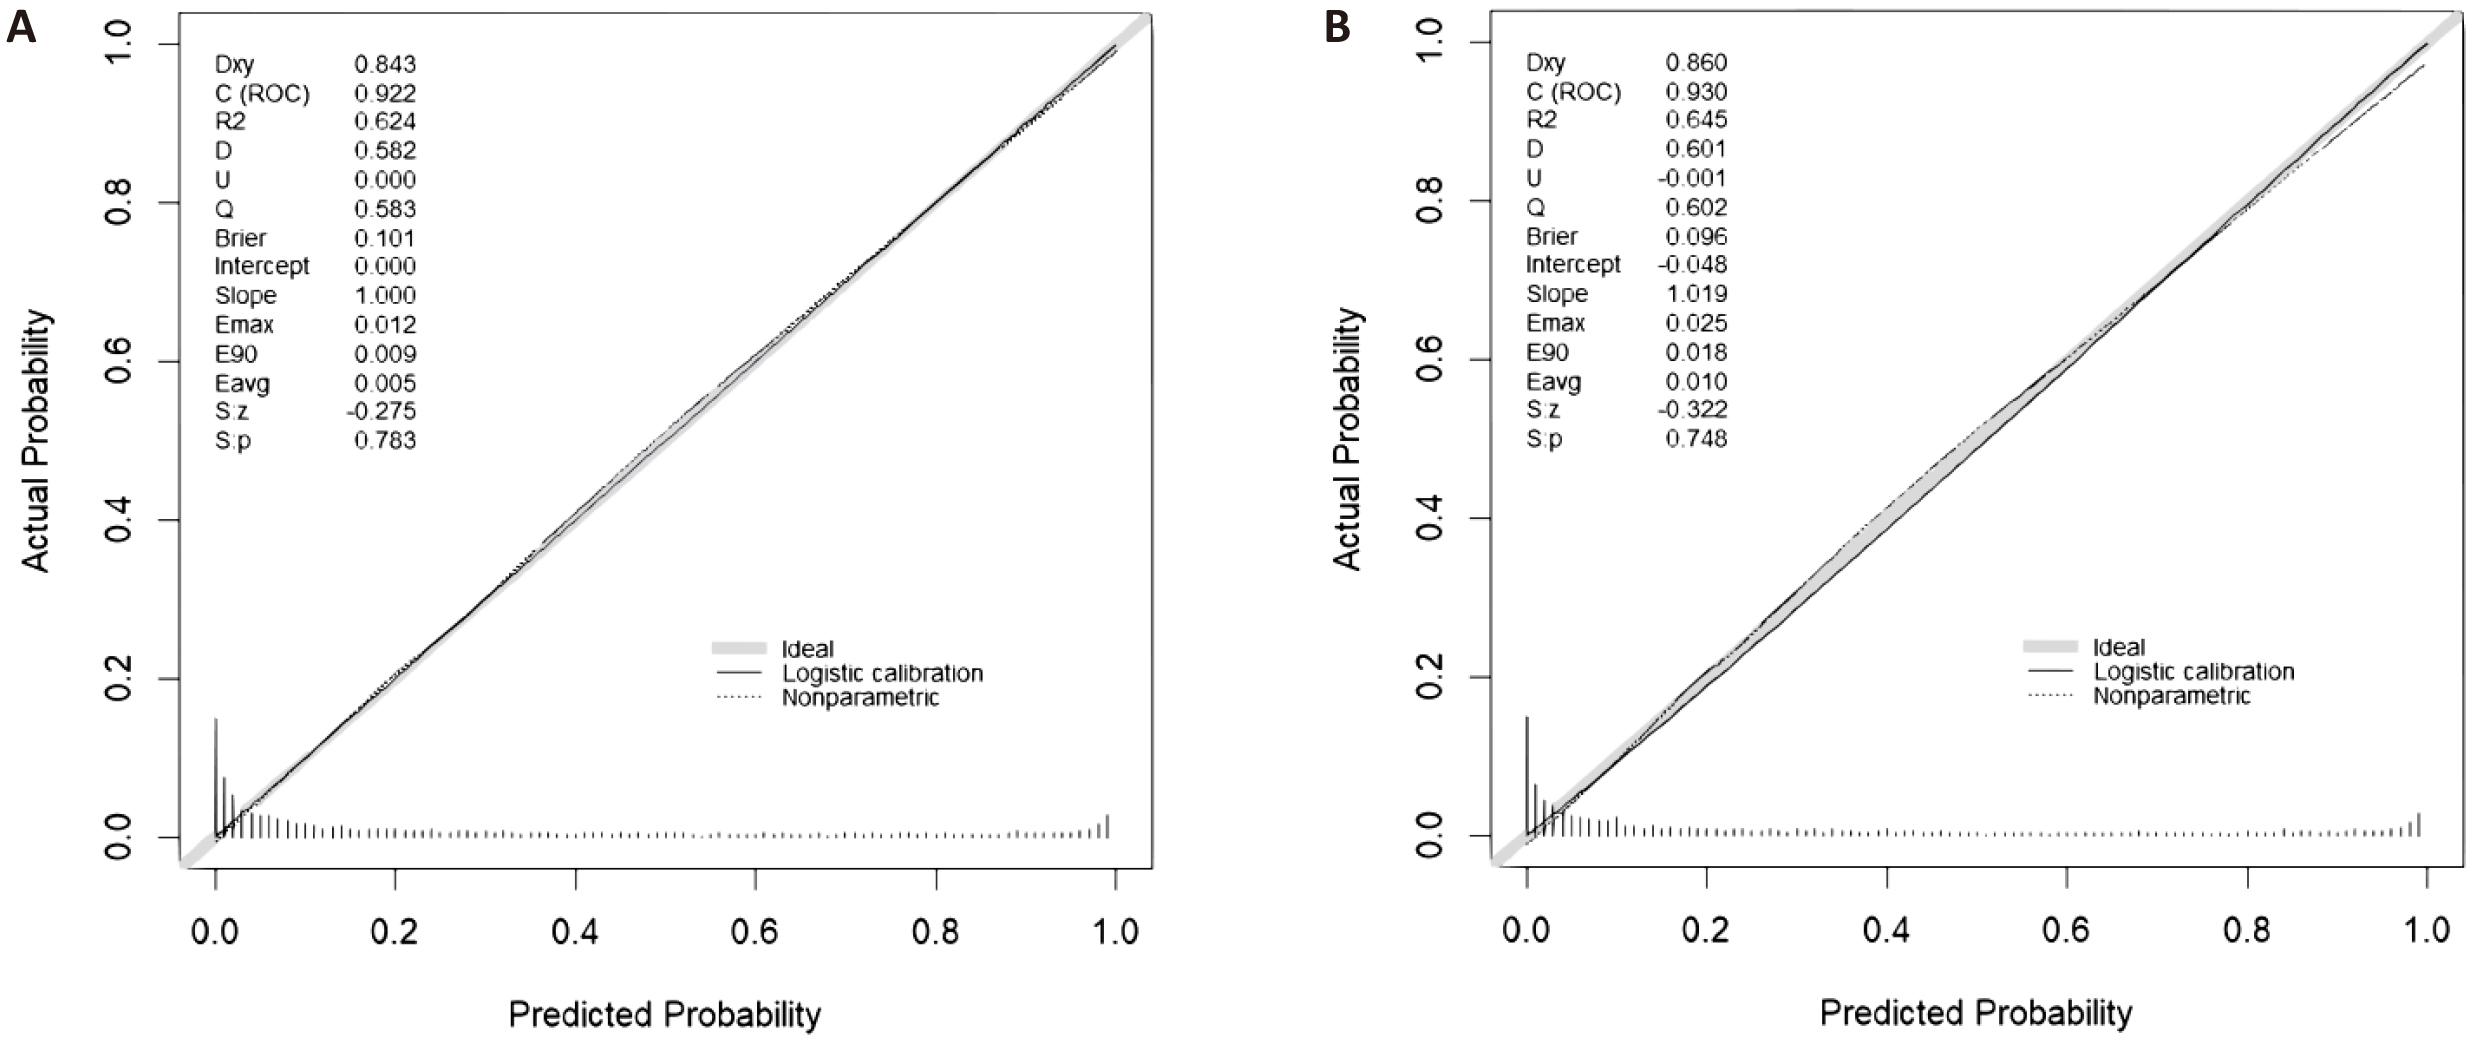
Figure 5. Calibration Curves of the Nomogram. A: Calibration plot for the training set: This plot assesses the agreement between predicted and actual probabilities in the training set, showing the logistic calibration curve (solid line) compared to the ideal 45-degree line. B: Calibration plot for the test set: This plot displays the comparison between predicted probabilities and actual outcomes in the test set, including logistic calibration (solid line) and nonparametric fit (dotted line).
We employed DCA to evaluate the nomogram model’s clinical utility (Figure 6A and B). The results indicated that the nomogram model offered superior net benefits across a range of individual threshold probabilities in both the training set (0 to 0.95) and the validation set (0 to 0.99), when compared to the two extreme approaches of treating all or none. This enhancement in predictive performance facilitates the early identification and diagnosis of CircS in middle-aged and older adults, thereby increasing its clinical applicability.
|
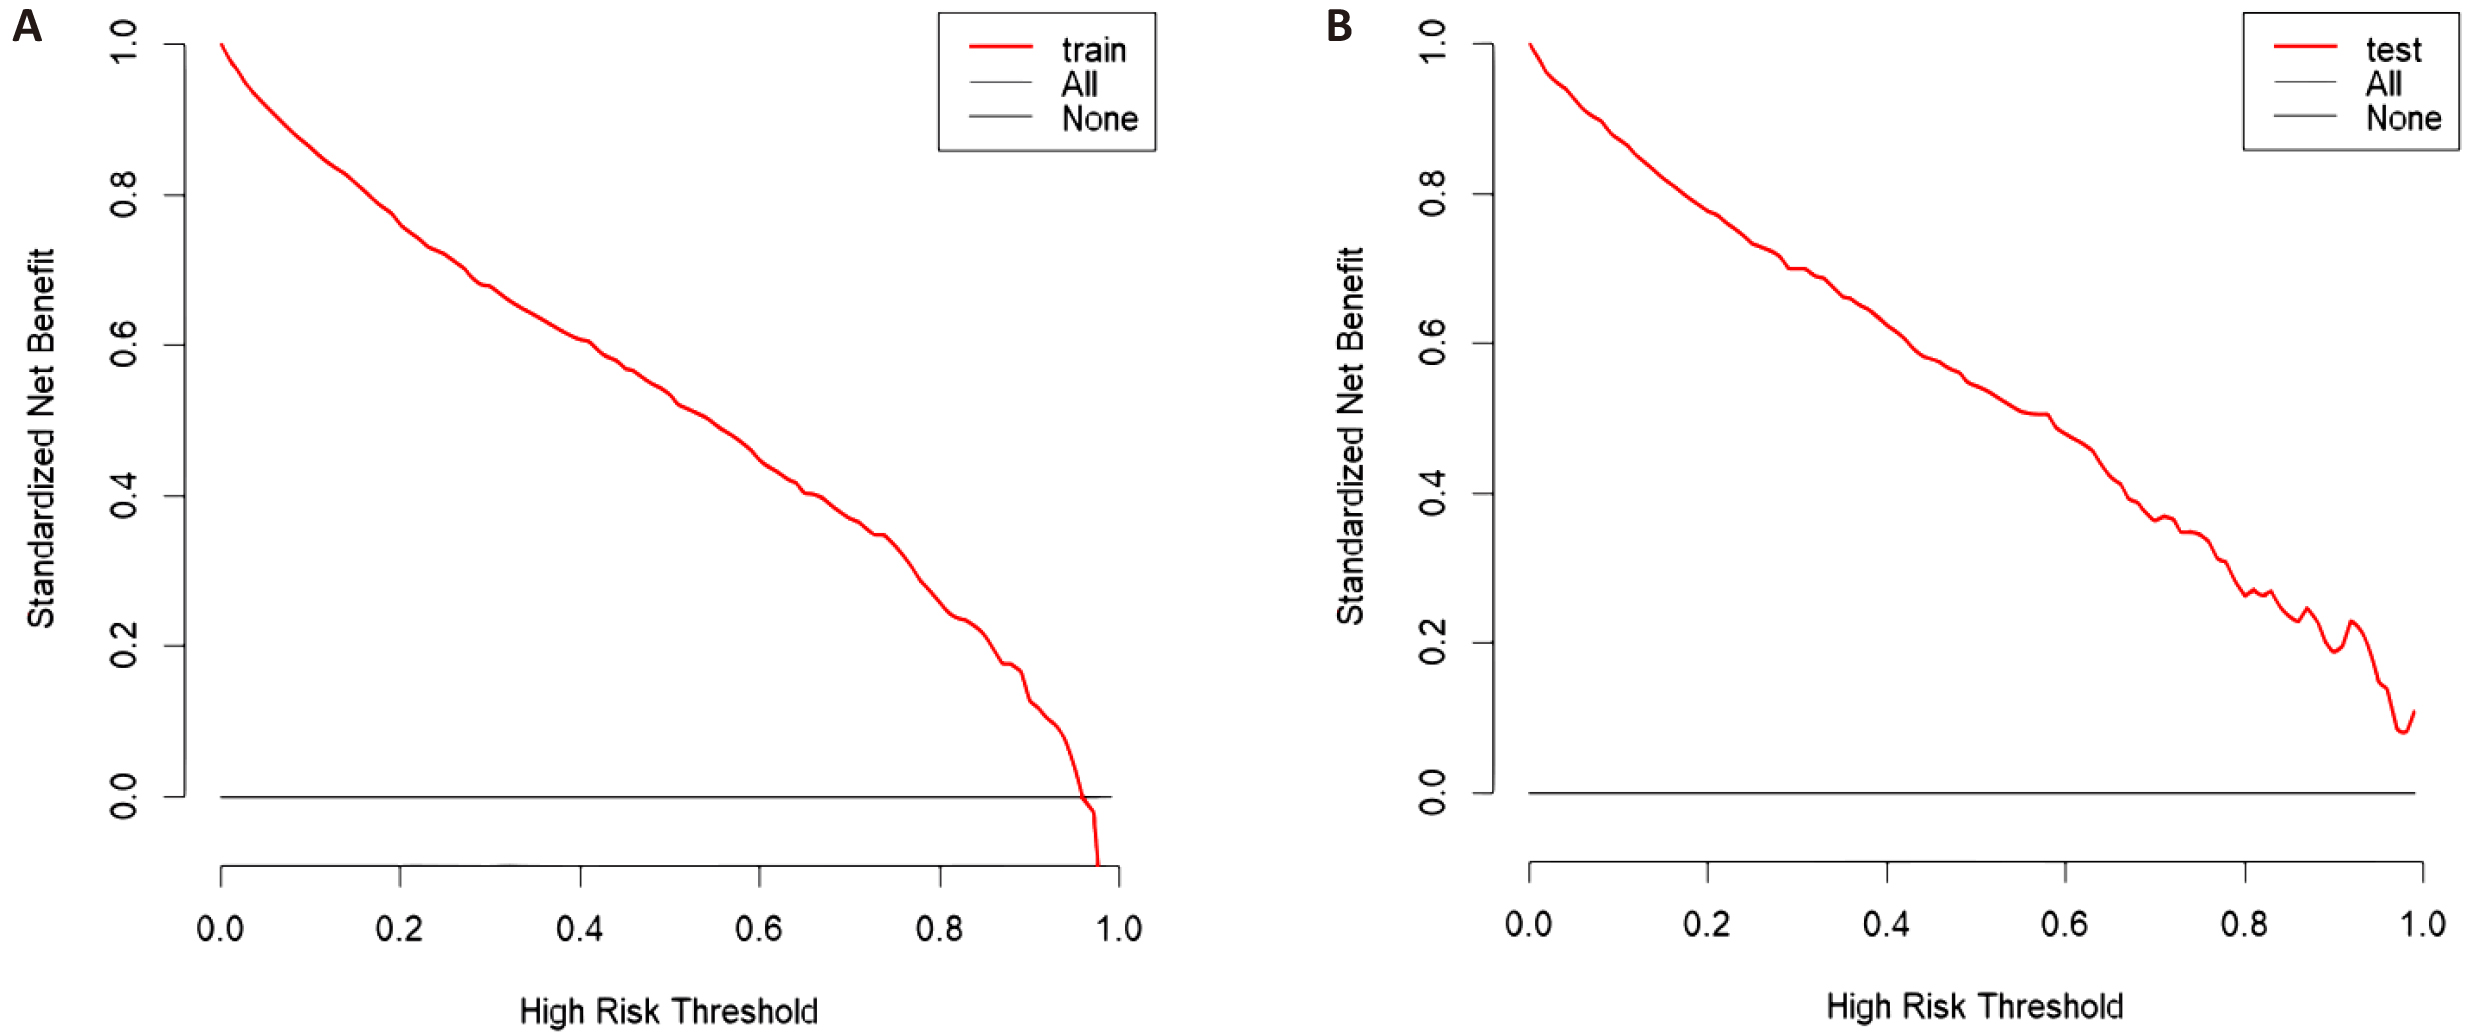
Figure 6. Calibration Curves of the Nomogram. A: Decision curve for the training set: The DCA for the training set shows the standardized net benefit across a range of high-risk thresholds, comparing the model with "All" and "None" scenarios. B: Decision curve for the test set: The DCA for the test set indicates the clinical net benefit at various high-risk thresholds, supporting the model’s applicability in a clinical setting.
4 DISCUSSION
In this study, We successfully developed and validate a reliable nomogram model. As far as we know, it is the first visualization tool can predict the risk of CircS among middle-aged and elderly adults. The model includes 11 key predictors: gender, age, TG, HDL, GU, UA, sleep duration, depression symptoms, SBP, WC and BMI.
The prevalence of CircS in the study was 30.11%, with a significantly higher prevalence in females compared to males, and the risk increasing with age. This discovery aligns with previous research. Liang et al.[6] found that CircS occurs in approximately 32.6% of community-dwelling middle-aged to older adults, with a higher prevalence in females than in males, and a positive association between age and CircS. Similarly, Shi et al.[5] demonstrated that CircS is more prevalent among Chinese adults, with women, particularly menopausal women, exhibiting a higher risk compared to men. Hormonal fluctuations, particularly in estrogen and progesterone, significantly affect circadian rhythms, which may explain the higher prevalence in women[19]. Additionally, traditional Chinese family roles often place more family responsibilities and social roles on women, potentially reducing sleep duration and quality[20]. Women are also more likely to experience psychological stress and depression, further contributing to circadian rhythm disruption[21]. Furthermore, with increasing age, physiological aging and the increased prevalence of chronic diseases affect the circadian system[19,22]. Changes in sleep architecture, such as decreased deep sleep and increased sleep fragmentation, also exacerbate circadian rhythm syndromes[5]. These findings indicate that it is necessary to allocate more focus and consideration towards women and older age groups in clinical practice, and future studies could develop interventions to improve CircS for different gender and age groups.
Our findings indicate that TG, HDL, GU, UA, sleep duration, depression score, systolic blood pressure, waist circumference, and BMI can predict circadian rhythm syndrome. While these factors have been shown to predict MetS in previous studies[23-25], their predictive role in CircS is demonstrated here for the first time. These variables affect the stability of the biological clock through various mechanisms, significantly impacting human circadian rhythms. Literature reviews reveal a bidirectional association between lipid metabolism and circadian rhythms. A disrupted biological clock may lead to abnormal lipid metabolism, while dyslipidemia affects the expression of biological clock genes, further disrupting circadian rhythms[26,27]. Abnormal levels of triglycerides and HDL affect the expression of biological clock genes, disrupting circadian rhythms[27]. These metabolic abnormalities can further disrupt circadian rhythms through inflammatory responses[28,29]. Inflammatory factors can cross the blood-brain barrier, affecting circadian gene expression in the central nervous system and leading to circadian rhythm dysregulation[30]. Depressive symptoms and high uric acid levels can increase inflammatory markers, further disrupting the biological clock. Previous studies have found circadian fluctuations in both blood glucose and blood pressure, with abnormal levels disrupting body metabolism through chronic inflammatory responses[31,32] and insulin resistance[33,34]. Abdominal obesity, represented by increased waist circumference and BMI, is a key component of MetS, playing an important role in type 2 diabetes, insulin sensitivity, and cardiovascular disease development[4]. Sleep deprivation disrupts the sleep-wake cycle and affects insulin sensitivity and glucose metabolism, increasing the risk of obesity and diabetes, creating a vicious cycle that disrupts circadian rhythms[35,36]. In summary, blood pressure, glucose, lipids, obesity, sleep deprivation, and depressive symptoms can trigger or exacerbate circadian syndromes by affecting the biological clock through metabolic, inflammatory, or neuromodulatory pathways. Managing these indicators is critical to maintaining normal circadian rhythms.
In this study, we constructed a nomogram model to predict CircS among the middle-aged and elderly adults using LASSO regression and multifactor logistic regression analysis. The AUC values of the model in the training and validation sets were 0.922 and 0.930, respectively, demonstrating strong discriminative ability. The calibration curve and Hosmer-Lemeshow test results showed that the model's expected probabilities are highly consistent with the actual probabilities. DCA further demonstrated the model's clinical efficiency. These results suggest that the nomogram model provides a reliable tool for the early identification of CircS in middle-aged and elderly adults, with significant clinical applications.
To our knowledge, this study presents the first accurate and reliable visualization tool capable of predicting CircS risk among middle-aged and elderly adults. However, the study still have some limitations. The nomogram model was developed in a specific population in China and has only been internally validated. Therefore, its generalizability and external validity have not been confirmed, necessitating further external validation in independent cohorts from other regions or countries. Besides, sleep duration and depressive symptoms data are obtained by self-report and inevitably receive the effects of recall bias. Additionally, the cross-sectional design could not draw any conclusions about cause and effect. Future studies should utilize longitudinal datasets to strengthen the model's predictive validity and explore causal links between variables.
5 CONCLUSION
We constructed a predictive tool for CircS in middle-aged and elderly adults by utilizing data from CHARLS. Through internal validation, we found that the model is reliable and efficient, with significant clinical application value. Clinicians can use this tool to accurately screen high-risk groups, providing the possibility of early intervention and laying the foundation for addressing this problem.
Acknowledgments
We would like to thank the China Health and Retirement Longitudinal Study for their data and those who participated in the CHARLS for their contributions to this work.
Conflicts of Interest
The authors declared no conflict of interest.
Ethics Approval
This study employs data from the China Health and Retirement Longitudinal Study (CHARLS), which was approved by the Peking University Institutional Review Board. Written informed consent was obtained from all participants or their proxies. All personal information was anonymized and stored securely to ensure the privacy and confidentiality of participants. The study adheres to the Declaration of Helsinki and all relevant ethical guidelines.
Data Availability
All data generated or analyzed during this study are included in this published article and its supplementary information files.
Copyright Permission
Copyright © 2025 The Author(s). Published by Innovation Forever Publishing Group Limited. This open-access article is licensed under a Creative Commons Attribution 4.0 International License (https://creativecommons.org/licenses/by/4.0), which permits unrestricted use, sharing, adaptation, distribution, and reproduction in any medium, provided the original work is properly cited.
Author Contribution
Ye Q and Sun T performed data analysis and wrote the manuscript. Wang J and Li X provided critical revisions. Wang D contributed to supervised, reviewed, revised the manuscript.
Abbreviation List
AUC, Area under the curve
BMI, Body mass index
CESD-10, 10-item Center for Epidemiologic Studies Depression Scale
CHARLS, China Health and Retirement Longitudinal Study
CircS, Circadian syndrome
C-index, Concordance index
DCA, Decision curve analysis
GU, Glucose
HDL, High-density lipoproteins
IQR, Interquartile range
IPAQ, International Physical Activity Questionnaire
LASSO, Least absolute shrinkage and selection operator
MetS, Metabolic syndrome
ROC, Receiver operating characteristic curves
SBP, Systolic blood pressure
TG, Triglycerides
UA, Uric acid
WC, Waist circumference
References
[1] Fagiani F, Di Marino D, Romagnoli A et al. Molecular regulations of circadian rhythm and implications for physiology and diseases. Signal Transduct Target Ther, 2022; 7: 41.[DOI]
[2] Allada R, Bass J. Circadian Mechanisms in Medicine. N Engl J Med, 2021; 384: 550-561.[DOI]
[3] Saklayen MG. The Global Epidemic of the Metabolic Syndrome. Curr Hypertens Rep, 2018; 20: 12.[DOI]
[4] Zimmet P, Alberti K, Stern N et al. The Circadian Syndrome: is the Metabolic Syndrome and much more! J Intern Med, 2019; 286: 181-191.[DOI]
[5] Shi Z, Tuomilehto J, Kronfeld-Schor N et al. The circadian syndrome predicts cardiovascular disease better than metabolic syndrome in Chinese adults. J Intern Med, 2021; 289: 851-860.[DOI]
[6] Liang H, Zheng J, Sun Y. Prevalence and risk factors associated with circadian syndrome in community-dwelling middle-aged to older adults: Based on health ecology model. Sleep Med, 2024; 119: 210-213.[DOI]
[7] World Health Organization. Ageing and health. Available at:[Web]
[8] Zhu X, Ding L, Zhang X et al. Association between physical frailty, circadian syndrome and cardiovascular disease among middle-aged and older adults: a longitudinal study. BMC Geriatr, 2024; 24: 199.[DOI]
[9] Xiong Y, Zhong Q, Zhang Y et al. The association between circadian syndrome and chronic kidney disease in an aging population: a 4-year follow-up study. Front Endocrinol, 2024; 15: 1338110.[DOI]
[10] Xiao Y, Yin S, Bai Y et al. Association between circadian syndrome and the prevalence of kidney stones in overweight adults: a cross-sectional analysis of NHANES 2007-2018. BMC Public Health, 2023; 23: 960.[DOI]
[11] Liu Y, Zang B, Shao J et al. Predictor of cognitive impairment: metabolic syndrome or circadian syndrome. BMC Geriatr, 2023; 23: 408.[DOI]
[12] Shi Z, Stern N, Liu J et al. The circadian syndrome is a predictor for cognition impairment in middle-aged adults: Comparison with the metabolic syndrome. Diabetes Metab Res Rev, 2024; 40: e3827.[DOI]
[13] Xiong Y, Zhang F, Wu C et al. The Circadian Syndrome Predicts Lower Urinary Tract Symptoms Suggestive of Benign Prostatic Hyperplasia Better Than Metabolic Syndrome in Aging Males: A 4-Year Follow-Up Study. Front Med, 2021; 8: 715830.[DOI]
[14] Hu LK, Liu YH, Yang K et al. Association between hypertriglyceridemic-waist phenotype and circadian syndrome risk: a longitudinal cohort study. Hormones (Athens), 2023; 22: 457-466.[DOI]
[15] Ohori Tatsuo G, Riu Hamada M, Gondo T et al. [Nomogram as predictive model in clinical practice]. Gan To Kagaku Ryoho, 2009; 36: 901-906.
[16] Lee PH, Macfarlane DJ, Lam TH et al. Validity of the International Physical Activity Questionnaire Short Form (IPAQ-SF): a systematic review. Int J Behav Nutr Phys Act, 2011; 8: 115.[DOI]
[17] Fu H, Si L, Guo R. What Is the Optimal Cut-Off Point of the 10-Item Center for Epidemiologic Studies Depression Scale for Screening Depression Among Chinese Individuals Aged 45 and Over? An Exploration Using Latent Profile Analysis. Front Psychiatry, 2022; 13: 820777.[DOI]
[18] Williams MW, Li CY, Hay CC. Validation of the 10-item Center for Epidemiologic Studies Depression Scale Post Stroke. J Stroke Cerebrovasc Dis, 2020; 29: 105334.[DOI]
[19] Nicolaides NC, Chrousos GP. Sex differences in circadian endocrine rhythms: Clinical implications. Eur J Neurosci, 2020; 52: 2575-2585.[DOI]
[20] Glen Pyle W, Martino TA. Circadian rhythms influence cardiovascular disease differently in males and females: role of sex and gender. Curr Opin Physiol, 2018; 5: 30-37.[DOI]
[21] Sun SY, Chen GH. Treatment of Circadian Rhythm Sleep-Wake Disorders. Curr Neuropharmacol, 2022; 20: 1022-1034.[DOI]
[22] Duffy JF, Cain SW, Chang AM et al. Sex difference in the near-24-hour intrinsic period of the human circadian timing system. Proc Natl Acad Sci USA, 2011; 108 Suppl 3: 15602-15608.[DOI]
[23] Ibrahim MS, Pang D, Randhawa G et al. Development and Validation of a Simple Risk Model for Predicting Metabolic Syndrome (MetS) in Midlife: A Cohort Study. Diabetes Metab Syndr Obes, 2022; 15: 1051-1075.[DOI]
[24] Liu W, Tang X, Cui T et al. Development and visualization of a risk prediction model for metabolic syndrome: a longitudinal cohort study based on health check-up data in China. Front Nutr, 2023; 10: 1286654.[DOI]
[25] Shin H, Shim S, Oh S. Machine learning-based predictive model for prevention of metabolic syndrome. PLoS One, 2023; 18: e0286635.[DOI]
[26] Petrenko V, Sinturel F, Riezman H et al. Lipid metabolism around the body clocks. Prog Lipid Res, 2023; 91: 101235.[DOI]
[27] Huang W, Ramsey KM, Marcheva B et al. Circadian rhythms, sleep, and metabolism. J Clin Invest, 2011; 121: 2133-2141.[DOI]
[28] Fatima N, Sonkar GK, Singh S. Circadian mechanism disruption is associated with dysregulation of inflammatory and immune responses: a systematic review. Beni Suef Univ J Basic Appl Sci, 2022; 11: 107.[DOI]
[29] Welty FK. How do elevated triglycerides and low HDL-cholesterol affect inflammation and atherothrombosis? Curr Cardiol Rep, 2013; 15: 400.[DOI]
[30] Yamakawa GR, Brady RD, Sun M et al. The interaction of the circadian and immune system: Desynchrony as a pathological outcome to traumatic brain injury. Neurobiol Sleep Circadian Rhythms, 2020; 9: 100058.[DOI]
[31] Mucci F, Marazziti D, Della Vecchia A et al. Inflammatory and metabolic markers in patients with mood disorders. World J Biol Psychiatry, 2021; 22: 228-235.[DOI]
[32] Kimura Y, Tsukui D, Kono H. Uric Acid in Inflammation and the Pathogenesis of Atherosclerosis. Int J Mol Sci, 2021; 22.[DOI]
[33] Eid S, Sas KM, Abcouwer SF et al. New insights into the mechanisms of diabetic complications: role of lipids and lipid metabolism. Diabetologia, 2019; 62: 1539-1549.[DOI]
[34] Jia G, Sowers JR. Hypertension in Diabetes: An Update of Basic Mechanisms and Clinical Disease. Hypertension, 2021; 78: 1197-1205.[DOI]
[35] Mensah GA, Roth GA, Fuster V. The Global Burden of Cardiovascular Diseases and Risk Factors: 2020 and Beyond. J Am Coll Cardiol, 2019; 74: 2529-2532.[DOI]
[36] Seixas AA, Robbins R, Chung A et al. Chapter 17 - Sleep health and diabetes: The role of sleep duration, subjective sleep, sleep disorders, and circadian rhythms on diabetes. In: Grandner MA (ed). Sleep and Health. Academic Press, 2019: 213-225.[DOI]



 Copyright ©