Causal Effects of Sarcopenia-related Traits on Ischemic Stroke: A Two-sample Mendelian Randomization Study
Yonghao Chen1,2, Jiaxin Wu1,2, Yingguo Yang3, Mengfei Xiong1,2, Xinghao Yu1,2, Shufeng Lei1,2,4*
1Center for Genetic Epidemiology and Genomics, School of Public Health, Collaborative Innovation Center for Bone and Immunology between Sihong Hospital and Soochow University, Suzhou Medical College of Soochow University, Suzhou, Jiangsu Province, China
2Jiangsu Key Laboratory of Preventive and Translational Medicine for Major Chronic Non-communicable Diseases, Soochow University, Suzhou, Jiangsu Province, China
3Department of Orthopedics, Collaborative Innovation Center for Bone and Immunology between Sihong Hospital and Soochow University, Sihong Hospital, Suqian, Jiangsu Province, China
4Changzhou Geriatric Hospital Affiliated, Soochow University, Changzhou, Jiangsu Province, China
*Correspondence to: Shufeng Lei, PhD, Professor, Center for Genetic Epidemiology and Genomics, School of Public Health, Suzhou Medical College of Soochow University, Suzhou, 215123, Jiangsu Province, China. E-mail: leisf@suda.edu.cn
DOI: 10.53964/cme.2024009
Abstract
Objective: The stroke itself can cause sarcopenia, loss of muscle, and weaker strength is commonly experienced in some patients after ischemic stroke. However, the causal effect of sarcopenia on stroke is unclear, and previous studies focusing on ischemic stroke, particularly in its types were rare.
Methods: We propose that sarcopenia is a risk factor for stroke, suggesting that maintaining skeletal muscle mass may help prevent stroke. Using a two-sample Mendelian randomization (MR) approach, we analyzed sarcopenia-related traits and their impact on ischemic stroke. This analysis utilized summary-level data from publicly available genome-wide association studies (GWAS) focusing on European populations.
Results: In the results, inverse variance weighted analysis showed that sarcopenia-related traits were significant with ischemic stroke: whole body fat-free mass may increase risk for cardioembolic stroke (OR: 1.28 per SD increase in genetically determined left handgrip strength, 95% CI: 1.11-1.49, P=1.14×10⁻³) and reduce risk for large-artery atherosclerosis and small vessel stroke (OR: 0.76, 95% CI: 0.61-0.95, P=0.014, OR: 0.79, 95% CI: 0.65-0.97, P=0.026, respectively), and handgrip strength may reduce risk for small vessel stroke (OR: 0.60, 95% CI: 0.41-0.87, P=7.29×10⁻³; OR: 0.57, 95% CI: 0.40-0.82, P=2.30×10⁻³, left handgrip strength and right handgrip strength respectively).
Conclusion: We concluded that there was an overall inverse association of sarcopenia-related traits with large-artery atherosclerosis and small-vessel stroke and a positive association with cardiogenic embolism.
Keywords: Sarcopenia, whole body fat-free mass, grip strength, ischemic strokes, Mendelian randomization
1 INTRODUCTION
Sarcopenia is a progressive skeletal muscle disease primarily characterized by the loss of muscle mass and function due to aging[1]. This condition is linked to adverse outcomes such as falls, functional decline, frailty, and mortality[2]. According to the European Working Group on Sarcopenia in Older People (EWGSOP), the incidence of sarcopenia was 1.6% in the European Male Ageing Study[3], In a study of 4,000 Chinese community-dwelling older adults aged 65 and above, the average annual incidence over four years was 3.1% using EWGSOP criteria[4]. stroke is characterized by the sudden onset of a focal neurological deficit due to a disruption in the blood supply to the brain. Globally, stroke is a primary disease that causes death and disability, and stroke patients are rapidly aging in recent years. In Japan, which has the world's largest aging population, the average age of onset of stroke has increased over the past 20 years[5]. Strokes can either be ischemic (an occlusion of a blood vessel) or hemorrhagic (a rupture of a blood vessel)[6]. Ischemic strokes (IS) have been further categorized into subtypes according to the mechanism of injury. These subtypes include cardioembolic stroke (CES), large-artery atherosclerosis stroke(LAS), small vessel occlusive disease (small vessel stroke, SVS), stroke of other determined cause, and stroke of undetermined cause[7].
The stroke itself can cause sarcopenia. Increasing evidence suggests that patients with stroke are susceptible to promoting sarcopenia[8]. However, it's not entirely clear what the effects of muscle mass and muscle strength are in having a stroke. The study shows that individuals with sarcopenia are more likely to develop new CVDs than their peers without sarcopenia, according to a survey of a Chinese population[9]. In a similar Mendelian randomized (MR) analysis of body composition and cardiovascular disease, fat-free mass (FFM) index was briefly described as negatively correlated with the incidence of ischemic stroke, but no further correlation analysis was made for the subtypes of ischemic stroke[10]. Faced with the heavy social burden and such high mortality of ischemic stroke[6], reducing the risk of stroke by improving the muscle status of susceptible populations may be an effective and economical approach. We have aimed at the idea that sarcopenia is the risk factor for stroke to amount of skeletal muscle may be a preventive factor for stroke.
The associations between sarcopenia and stroke detected from observational studies have not been inferred in the causal effects. An alternative strategy to investigate potential causal relationships between an exposure and an outcome, especially when randomized control trials are not feasible, practical, or ethical, is Mendelian randomization analysis[11]. Previous studies have evaluated that fat free mass and handgrip strength was associated with several diseases (e.g. coronary artery disease and type 2 diabetes)[12,13], but have not yet been evaluated for ischemic disease. We therefore implemented the single-variable as well as multivariable two-sample MR design to assess the association of genetic predisposition to sarcopenia-related traits including FFM and handgrip strength (left handgrip strength (GSL); right handgrip strength (GSR)) with ischemic stroke and its main subtypes.
MR analysis as an instrumental variable (IV) analysis with genetic instruments, has been widely used to explore causal effects between disease and environmental factors, and is immune to confounders mixed in observational studies. All MR studies rely on 3 basic assumptions (Figure 1): the genetic instrument (i) should be reliably associated with the exposure, (ii) should be associated with the outcome only through the exposure, and (iii) should not be associated with other factors that affect the outcome[14]. Mendelian To our knowledge, we are the first study to use MR analysis to explore the causal link between the disease status of sarcopenia and IS.
|
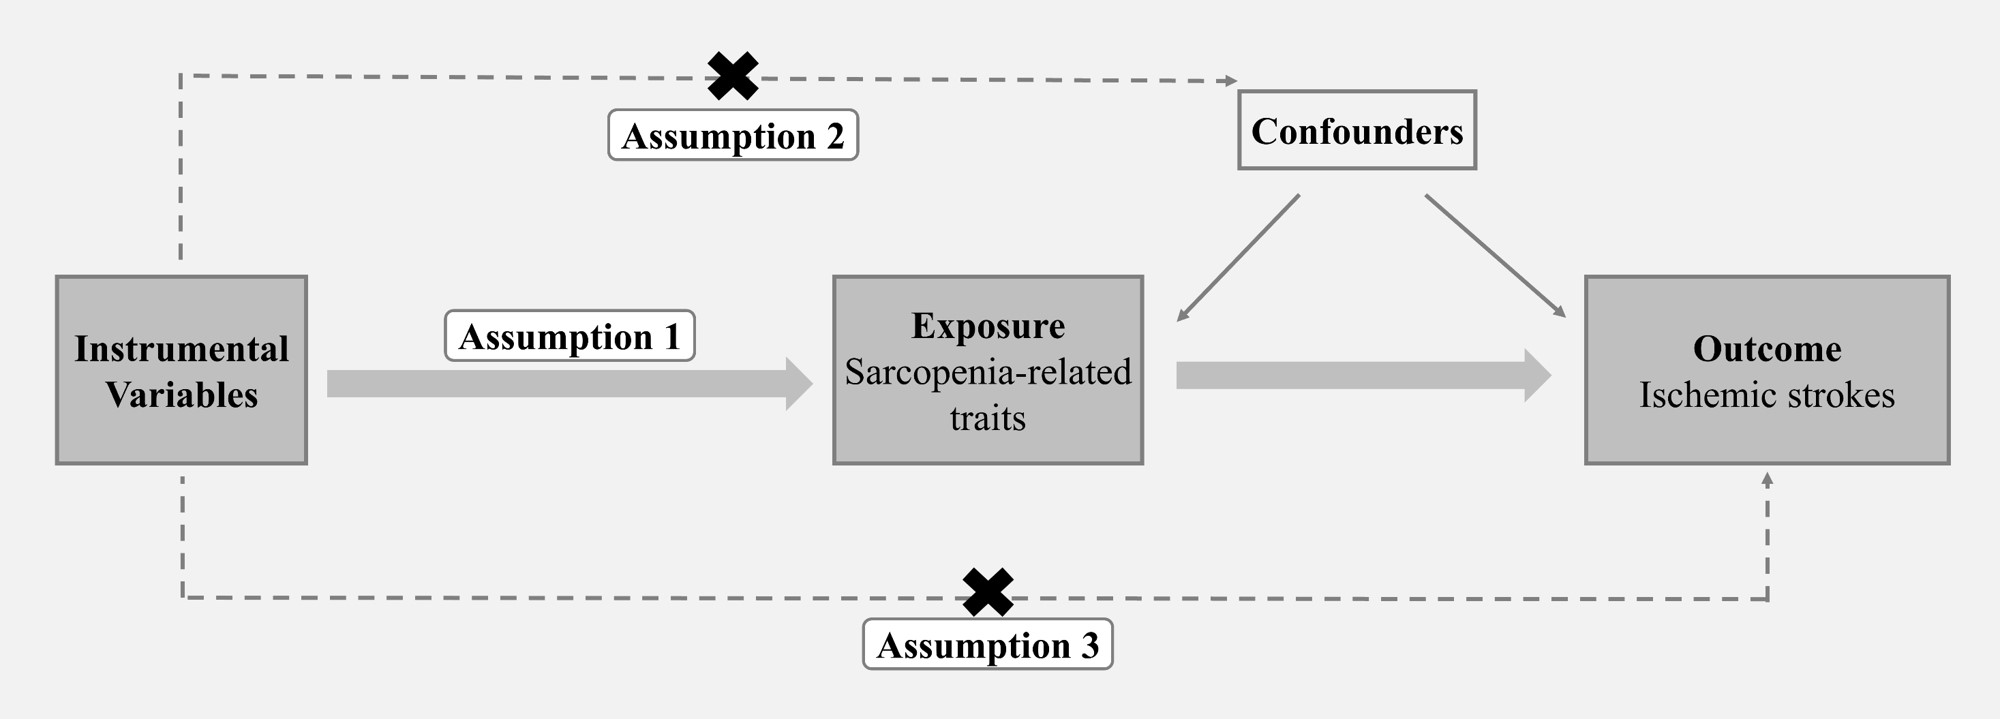
Figure 1. Overview of studies in MR analysis. Assumption 1: The genetic instrument should be reliably associated with the exposure; Assumption 2: The genetic instrument should be associated with the outcome only through the exposure; Assumption 3: The genetic instrument should not be associated with other factors that affect the outcome.
2 MATERIALS AND METHODS
Whole body FFM is the weight of other body components other than fat, including muscle mass body water, protein, glycerol, and soft tissue mineral mass[15]. Muscles are a major part of FFM, hence it is also known as lean body mass. Bioelectrical impedance analysis is used to measure FFM and has been widely recognized as a reliable way to measure muscle mass in the body[16].
There is no single method to evaluate sarcopenia and weakness, but because grip strength is relatively simple and straightforward to measure, it has been widely used to measure the overall muscle health of patients with sarcopenia[17]. Grip strength is measured by calibrating the hand size of the hydraulic hand dynamometer[18]. Because absolute grip strength may be more correlated with muscle strength than relative grip strength, absolute grip strength is used instead of relative grip strength (absolute grip/weight) to reflect muscle strength[19].
2.2 GWAS Data Sources
GWAS summary statistics of grip strength and whole body FFM were obtained from the UKB study, in which the sample size of whole body FFM was 331,291, the left grip strength was 461,089 and the right grip strength was 461,026[18]. IS are based on publicly available aggregated statistical data on the genetic association of IS and their subtypes from the MEGASTROKE Consortium, and the sample consisted of 446,696 people of European descent, including any ischemic stroke (AIS) patients regardless of subtype (n=34,217), and ischemic stroke subtypes (CES, n=7,193; SVS, n=5,386, LAS, n=4,373)[20]. The MEGASTROKE project received funding from sources specified at http://www.megastroke.org/acknowledgments.html. The information on genome-wide association study (GWAS) summary data sets used in our research was summarized in Table S1.
2.3 Selection of Genetic Predictors
First, we selected independent SNPs (linkage disequilibrium r2<0.001 with a clumping window of 1Mb) that were strongly associated with the exposure P<5×10⁻⁸) to satisfy the key assumptions of MR[21]. We then obtained the corresponding effect estimates of these SNPs from outcome GWAS summary statistics. For SNPs unavailable in the outcome data, we used proxy SNPs highly correlated (r2>0.8) with the original SNPs. Palindromic SNPs (allele pairs coded as A/T or C/G) were aligned based on allele and effect allele frequency. The F statistic for SNPs on exposures was computed to validate the strength of the selected instrumental variables (IVs). Additionally, we applied MR-Egger regression to examine the horizontal pleiotropy effects of selected IVs[22], and the intercept that deviates from the origin may provide evidence for potential pleiotropic effects across the IVs. We also performed MR-PRESSO to remove pleiotropic IVs[23] and detect pleiotropy by assessing outliers among the selected IVs.
2.4 MR Analysis
We performed MR analysis to examine the causal effect of sarcopenia-related traits on ischemic stroke outcome. The principal analysis was conducted using the inverse-variance weighted (IVW) method, which was calculated as the SNP-outcome association effect size divided by the SNP-exposure association effect size. This regression is weighted by the inverse-variance of SNP-stroke association, and the regression line is fixed to zero[24]. And the IVW fixed model was considered if there was insignificance in the heterogeneity test among the selected IVs.
In addition, to exclude the potential pleiotropic effects, the IVW analysis was repeated after removing some SNPs included in the analysis according to the following criteria: a) remove the proxy SNPs used in these types of strokes that failed to match; b) remove the SNPs associated with these types of strokes(P<5×10⁻⁸); c) remove the SNPs associated with body fat-related traits.
2.5 Sensitivity Analyses
Multiple sensitivity analyses were conducted to test the reliability of the analysis results. We used MR-Egger, weighted median, and maximum likelihood methods to calculate estimates for comparison with the IVW estimates. MR-Egger allows some SNPs to affect the outcome through mechanisms other than modification of the exposure and provides a formal test for directional pleiotropy through its intercept. The weighted median estimate tends to give valid estimates when at least 50% of the information comes from valid IVs[25]. The maximum likelihood method, which uses the maximum likelihood function to estimate probability distribution parameters, is a traditional method known for its low standard error[26]. Additionally, we used the MR-PRESSO outlier test to identify outlier SNPs that could have pleiotropic effects. This method regresses SNP-outcome on SNP-exposure and uses the square of the residuals to identify outliers[23].
The overview of our analysis was presented in Figure 1. The analyses were performed using R statistical software (Version 4.2.0) with the R packages “TwoSampleMR” version 0.5.6 and “MRPRESSO” version 0.6.0.
3 RESULT
In total, we obtained 418, 157, and 176 linkage disequilibrium-independent SNPs that achieved genome-wide significance level (P<5×10⁻⁸) from body FFM, left handgrip strength, and right handgrip strength, respectively. The F statistics for individual selected SNPs were all larger than 10, and those SNPs explained 8.8%, 1.6%, and 1.7% of the phenotypic variation in FFM, left handgrip strength and right handgrip strength respectively. The summary information of selected SNPs was shown in Tables S2-S7.
The associations between each genetically predicted risk factor and ischemic stroke using IVW method are shown in the Table 1 and Figures 2-4. IVW analysis showed that whole body FFM may increase the risk of CES and reduce the risk of large-artery atherosclerosis and small vessel occlusive disease, but handgrip strength may reduce risk of small vessel occlusive disease. The odds ratio of CES, SVS and LAS per 1 SD increase in genetically predicted whole body FFM were 1.28 (95% CI=1.10-1.49, P=1.14×10⁻³), 0.79 (95% CI=0.65-0.97, P=0.03) and 0.76 (95% CI=0.61-0.95, P=0.01) respectively. And left handgrip strength and right handgrip strength increase per unit in log odds, the OR of SVS was 0.60 (95% CI=0.41-0.87, P=7.29×10⁻³) and 0.57 (95% CI=0.40-0.82, P=2.30×10⁻³) respectively. In repeated IVW analysis, for the significant causal pairs, the direction of association was consistent, i.e., the FFM was significantly and positively with CES but was inversely associated with large artery stroke and small vessel stroke.
Table 1. Associations Between Sarcopenia-related Traits and Stroke
Exposure |
Outcome |
All IVs-IVW |
Removed IVs-IVW |
||||
SNPs |
OR (95% CI) |
P Value |
SNPs |
OR (95% CI) |
P Value |
||
FFM |
AIS |
401 |
0.976 (0.883, 1.078) |
0.628 |
378 |
0.996 (0.902, 1.099) |
0.930 |
CES |
401 |
1.283 (1.104, 1.491) |
0.001 |
380 |
1.293 (1.102, 1.516) |
0.002 |
|
SVS |
404 |
0.792 (0.645, 0.973) |
0.026 |
382 |
0.765 (0.618, 0.946) |
0.014 |
|
LAS |
402 |
0.761 (0.611, 0.947) |
0.014 |
379 |
0.759 (0.605, 0.952) |
0.017 |
|
GSL |
AIS |
153 |
0.924 (0.785, 1.088) |
0.343 |
148 |
0.940 (0.796, 1.109) |
0.461 |
CES |
153 |
1.091 (0.798, 1.492) |
0.584 |
148 |
1.059 (0.771, 1.454) |
0.723 |
|
SVS |
152 |
0.598 (0.411, 0.871) |
0.007 |
147 |
0.617 (0.412, 0.924) |
0.019 |
|
LAS |
153 |
0.669 (0.447, 1.000) |
0.050 |
148 |
0.693 (0.453, 1.060) |
0.091 |
|
GSR |
AIS |
165 |
0.997 (0.852, 1.166) |
0.967 |
163 |
0.999 (0.842, 1.185) |
0.990 |
CES |
165 |
1.167 (0.863, 1.577) |
0.316 |
163 |
1.160 (0.853, 1.577) |
0.345 |
|
SVS |
164 |
0.570 (0.398, 0.818) |
0.002 |
162 |
0.574 (0.394, 0.837) |
0.004 |
|
LAS |
165 |
0.792 (0.537, 1.167) |
0.238 |
163 |
0.806 (0.533, 1.218) |
0.306 |
|
|
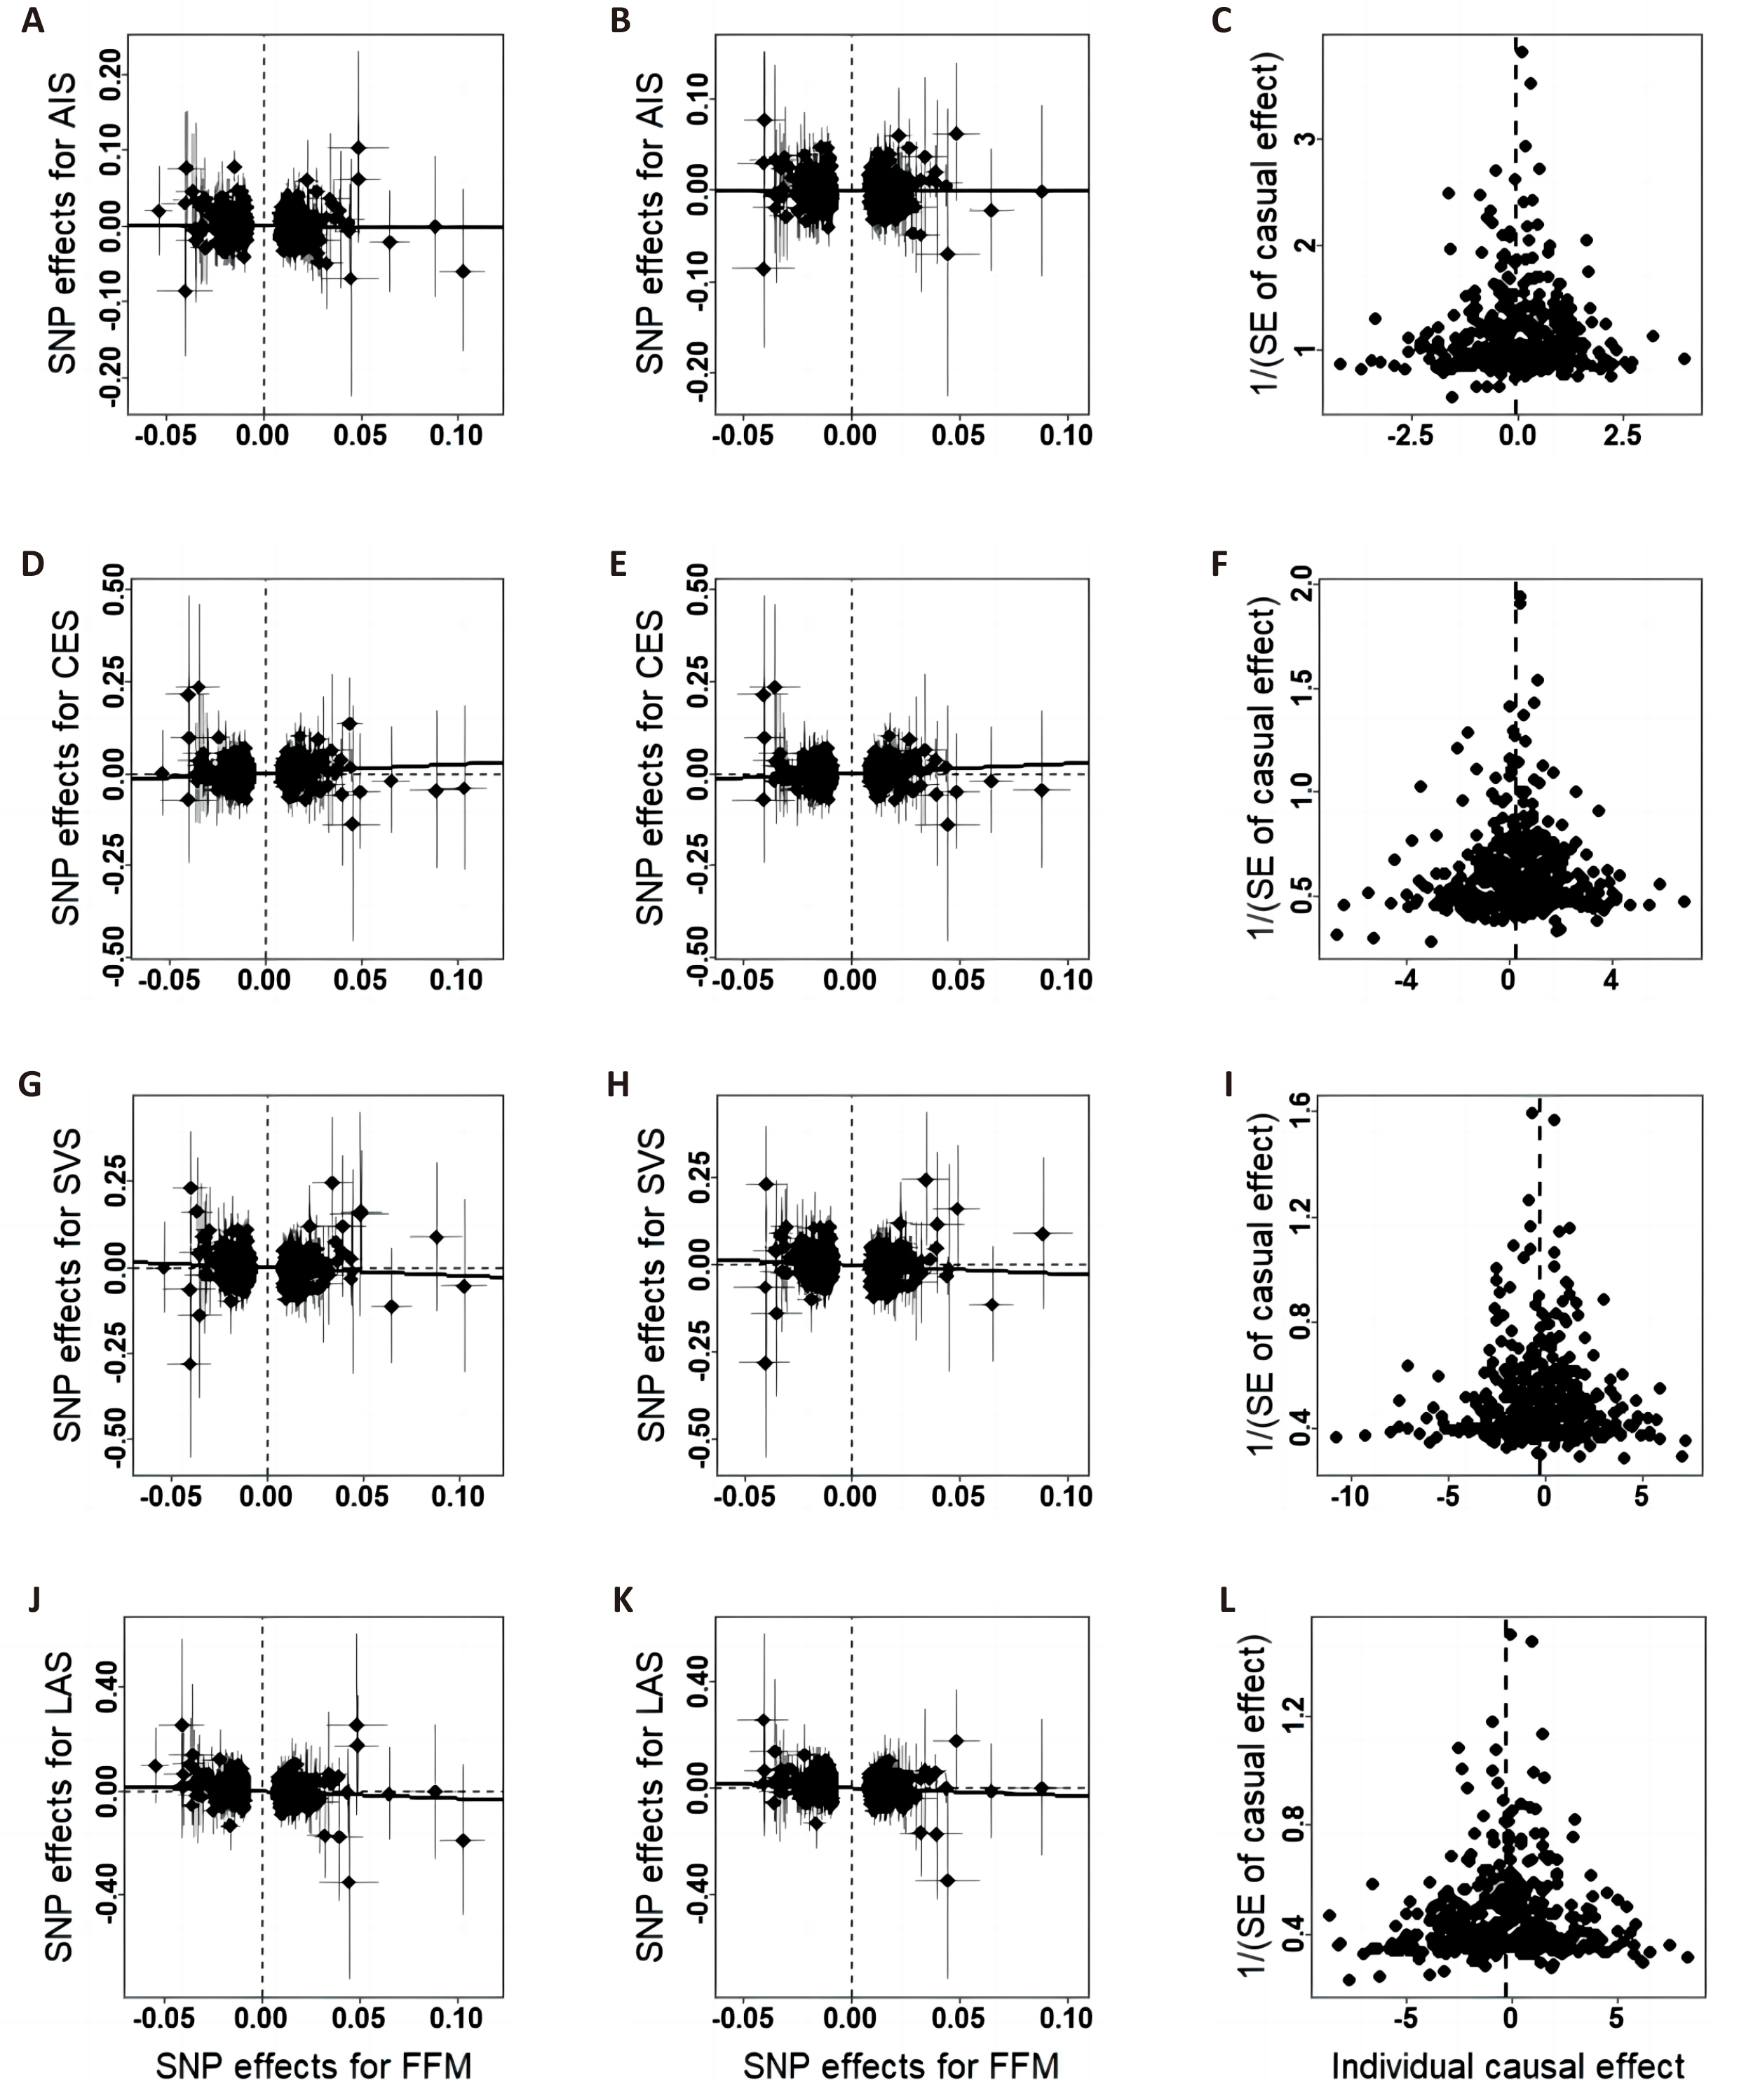
Figure 2. Scatter plots and funnel plots of the relationship between whole body FFM and IS. A/D/G/J, scatter plots of effects estimated by the crude IVW method; B/E/H/K, scatter plots of effects estimated by the repeated IVW method; C/F/I/L, funnel plots of effects estimated by the repeated IVW method.
|
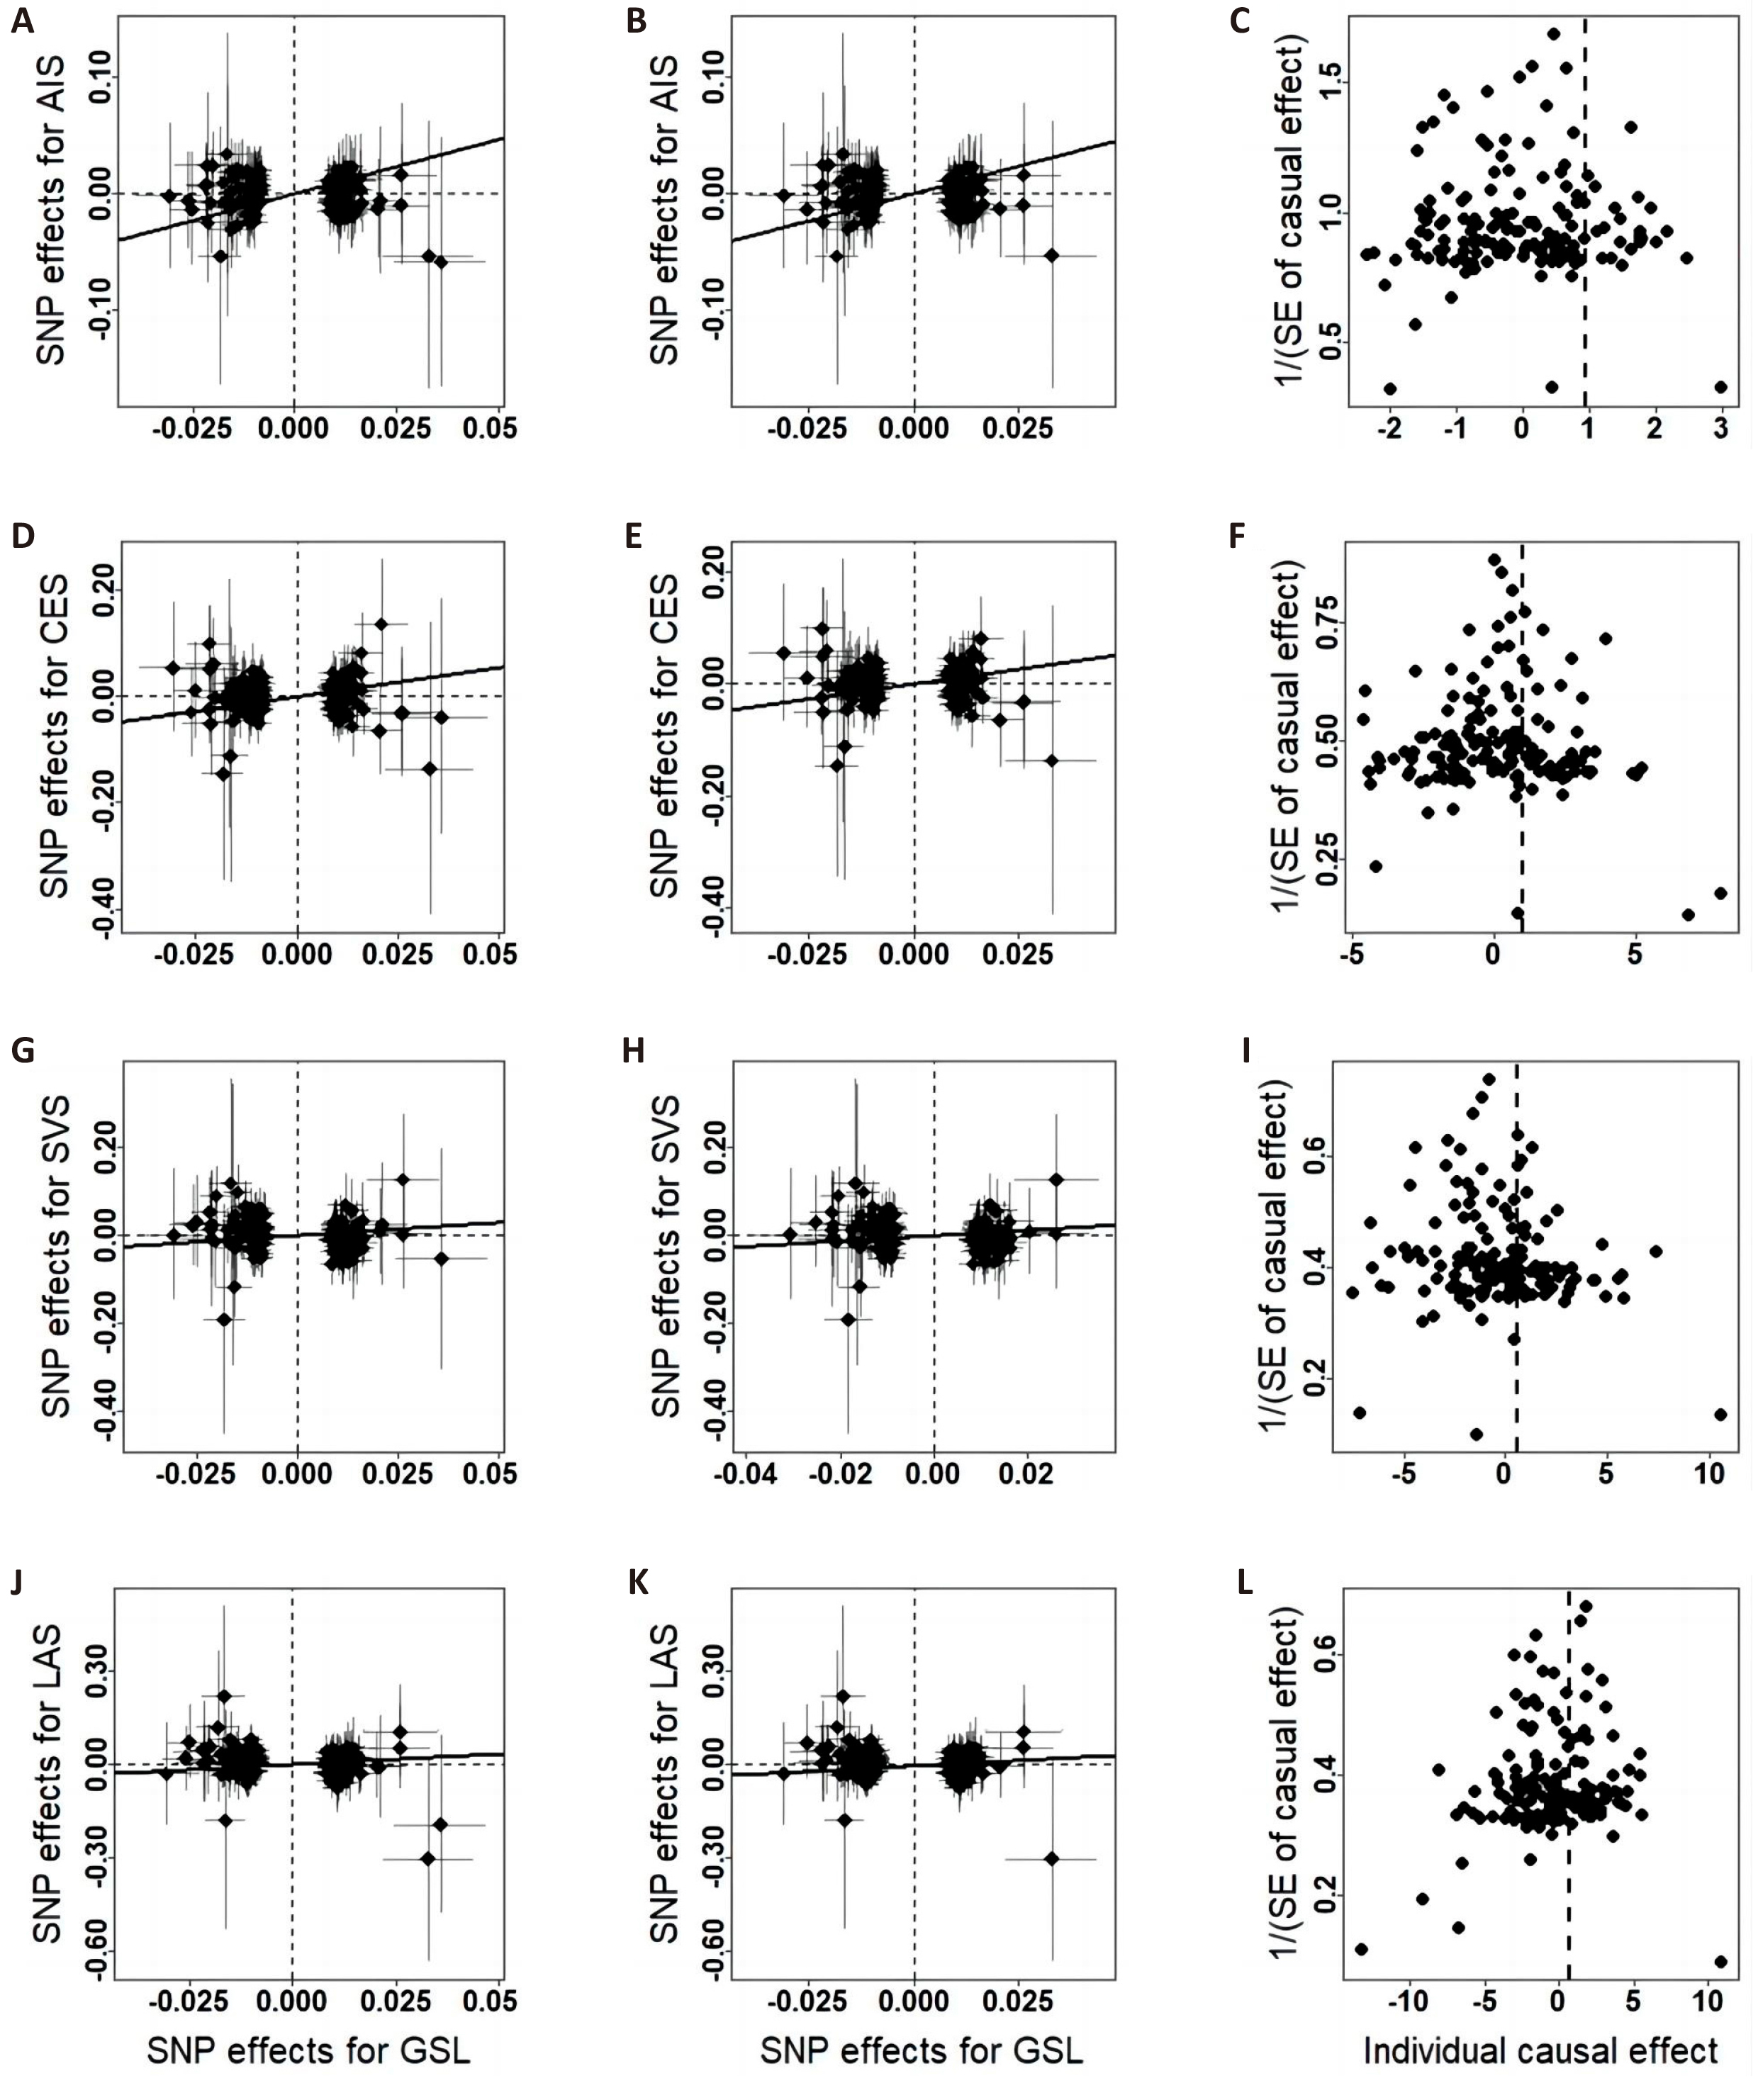
Figure 3. Scatter plots and funnel plots of the relationship between hand GSL and IS. A/D/G/J, scatter plots of effects estimated by the crude IVW method; B/E/H/K, scatter plots of effects estimated by the repeated IVW method; C/F/I/L, funnel plots of effects estimated by the repeated IVW method.
|
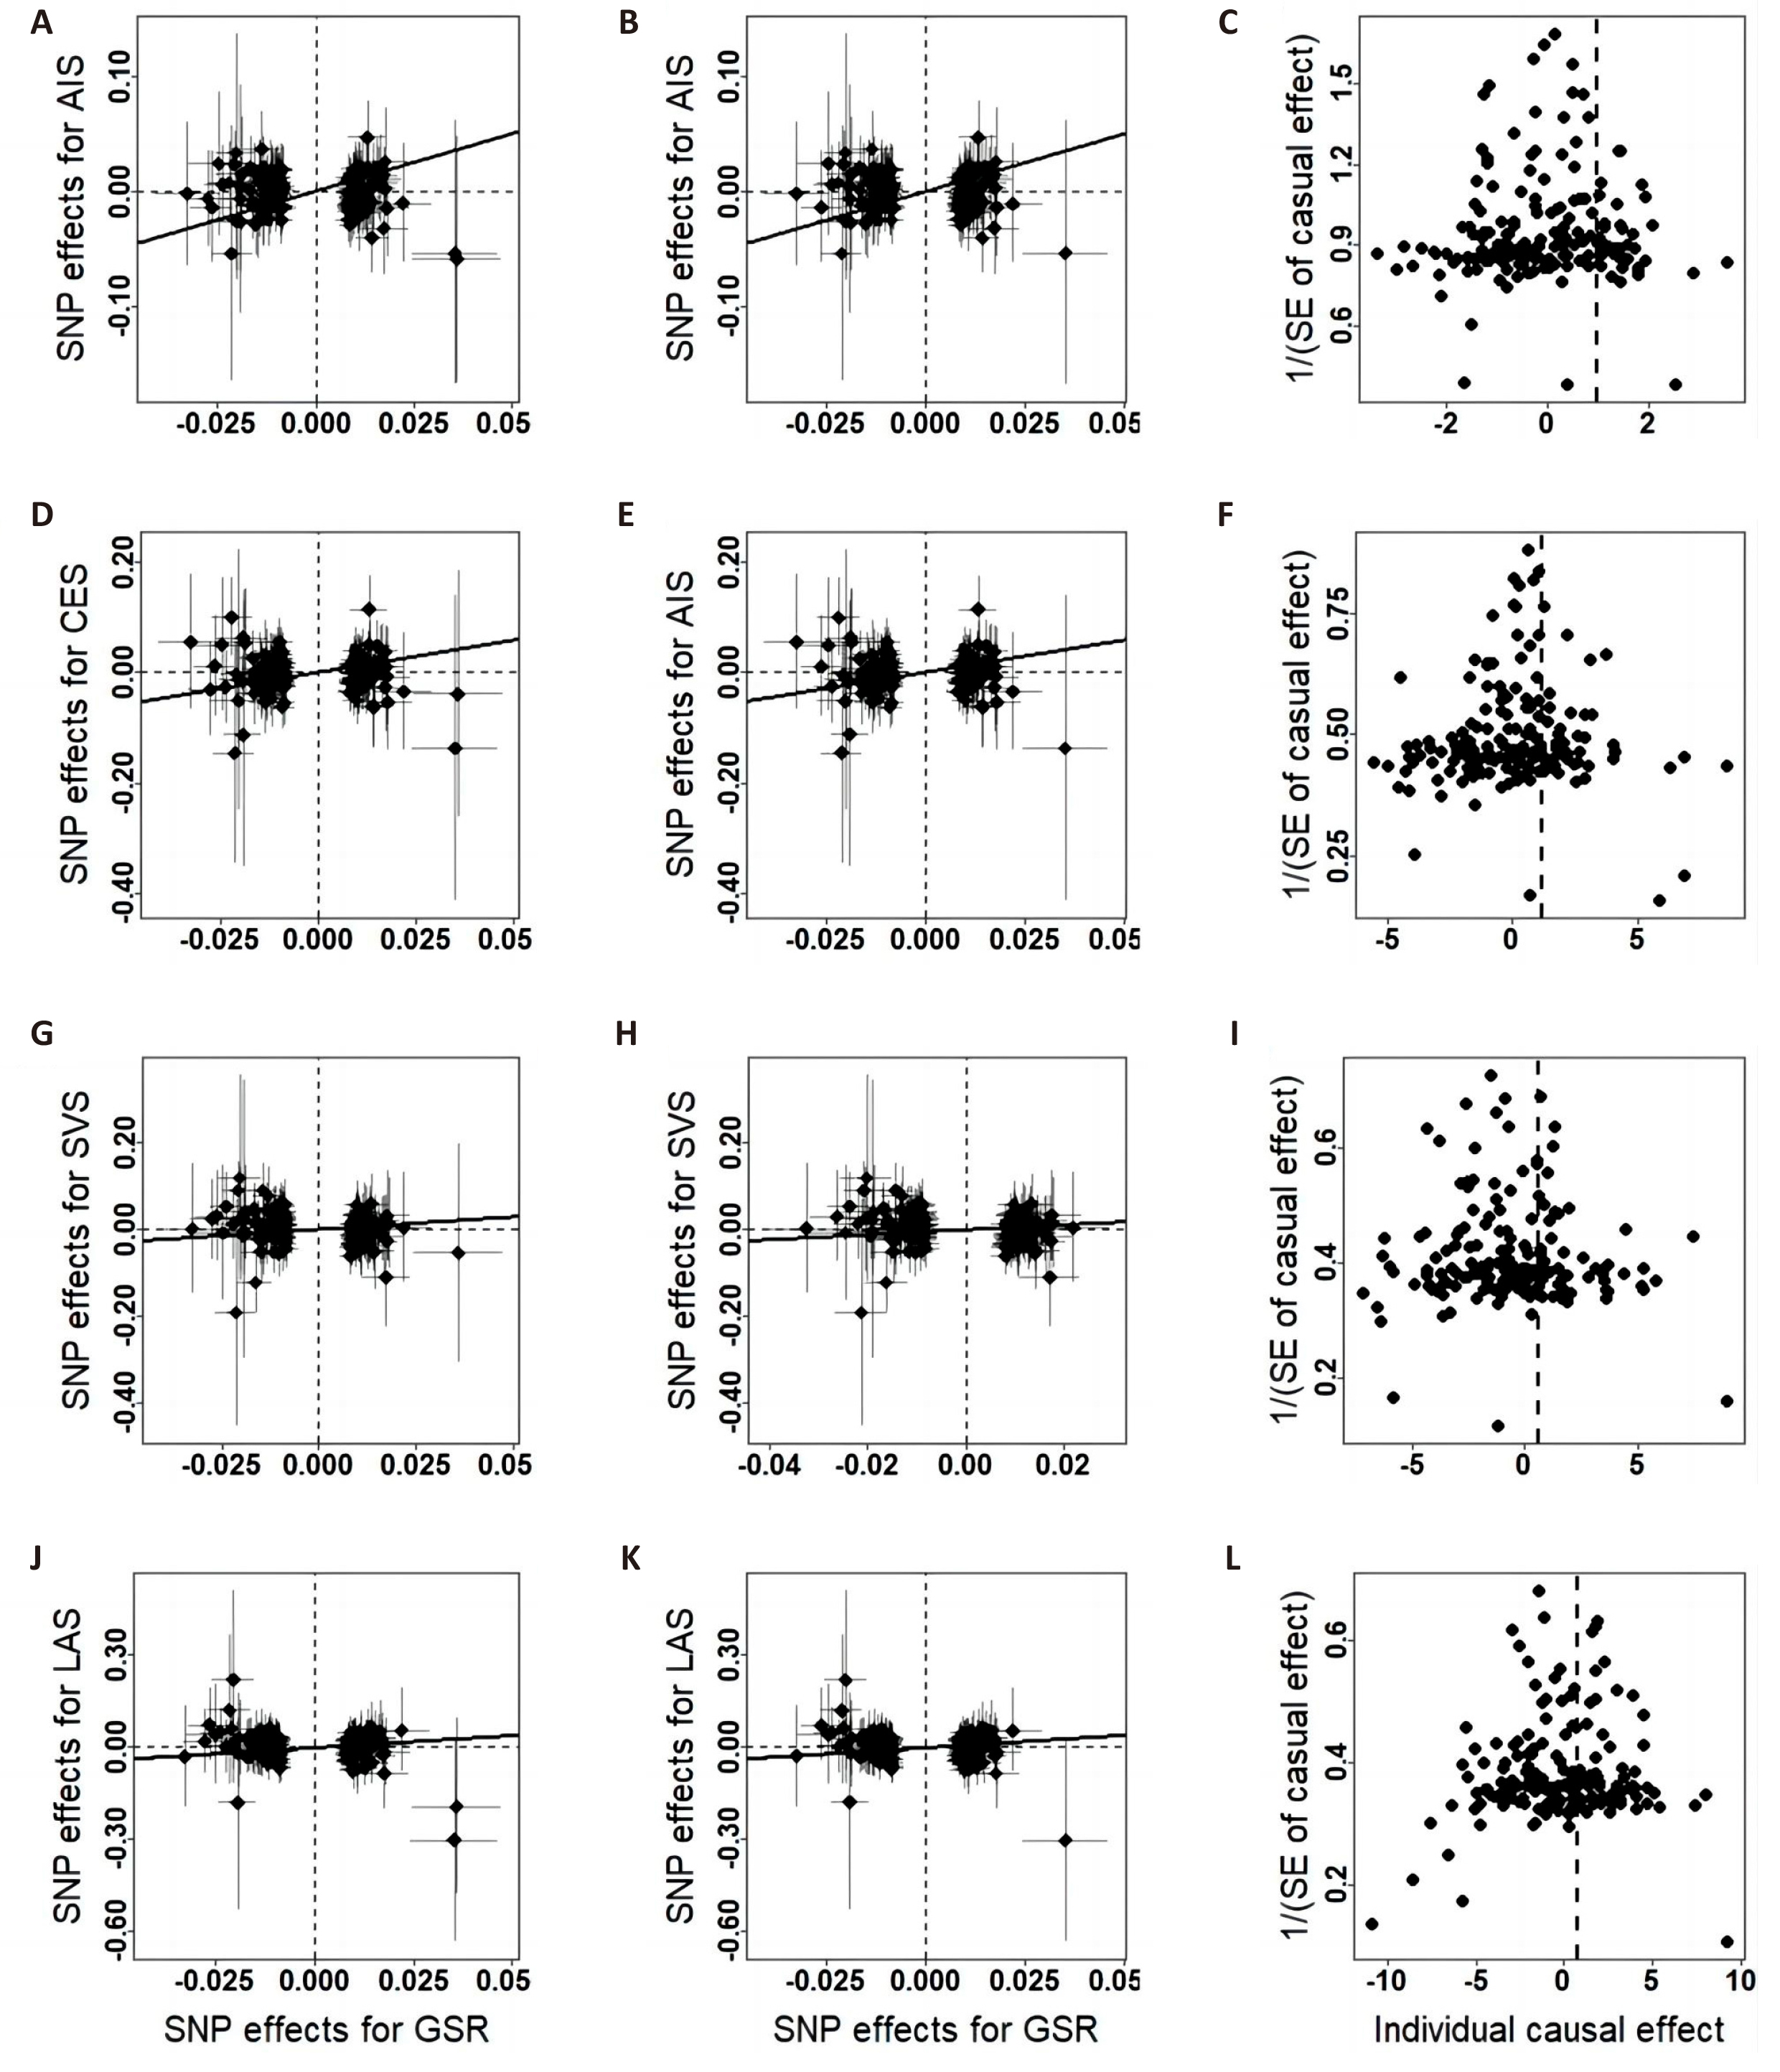
Figure 4. Scatter plots and funnel plots of the relationship between hand GSR and IS. A/D/G/J, scatter plots of effects estimated by the crude IVW method; B/E/H/K, scatter plots of effects estimated by the repeated IVW method; C/F/I/L, funnel plots of effects estimated by the repeated IVW method.
Results were similar in a sensitivity analysis based on MR-Egger, weighted median, and maximum likelihood methods as shown in the Table 2. Some outlier SNPs were identified after performed MR-PRESSO, and the exclusion of the outliers did not essentially change the results for sarcopenia-related traits and ischemic stroke (Table 3). There was no evidence of directional pleiotropy (all P values for MR-Egger intercept > 0.1) among the selected IVs.
Table 2. Sensitivity Analysis for Genetic Associations Between Sarcopenia-related Traits and Strokes
Method |
|
AIS |
CES |
SVS |
LAS |
||||
OR (95% CI) |
P value |
OR (95% CI) |
P value |
OR (95% CI) |
P value |
OR (95% CI) |
P value |
||
MR-Egger |
FFM |
0.977 (0.754, 1.267) |
0.862 |
1.217 (0.81, 1.827) |
0.345 |
0.842 (0.492, 1.441) |
0.531 |
0.912 (0.514, 1.620) |
0.755 |
Weighted median |
1.095 (0.963, 1.244) |
0.164 |
1.403 (1.103, 1.786) |
0.006 |
0.873 (0.653, 1.166) |
0.358 |
0.869 (0.639, 1.183) |
0.373 |
|
Maximum likelihood |
0.976 (0.902, 1.056) |
0.541 |
1.288 (1.107, 1.498) |
0.001 |
0.793 (0.662, 0.949) |
0.012 |
0.761 (0.626, 0.925) |
0.006 |
|
MR-Egger |
GSL |
1.190 (0.620, 2.287) |
0.602 |
1.204 (0.338, 4.290) |
0.775 |
0.301 (0.059, 1.521) |
0.148 |
0.891 (0.167, 4.765) |
0.893 |
Weighted median |
0.949 (0.737, 1.222) |
0.683 |
1.165 (0.736, 1.841) |
0.515 |
0.530 (0.302, 0.930) |
0.027 |
0.708 (0.380, 1.316) |
0.275 |
|
Maximum likelihood |
0.924 (0.784, 1.090) |
0.349 |
1.094 (0.797, 1.501) |
0.578 |
0.598 (0.409, 0.875) |
0.008 |
0.671 (0.446, 1.009) |
0.055 |
|
MR-Egger |
GSR |
1.086 (0.552, 2.137) |
0.811 |
1.109 (0.325, 3.787) |
0.869 |
0.425 (0.095, 1.903) |
0.265 |
0.417 (0.081, 2.160) |
0.299 |
Weighted median |
1.058 (0.837, 1.338) |
0.635 |
1.212 (0.774, 1.897) |
0.401 |
0.511 (0.3, 0.87) |
0.013 |
0.825 (0.462, 1.475) |
0.516 |
|
Maximum likelihood |
0.997 (0.85, 1.168) |
0.968 |
1.171 (0.863, 1.588) |
0.311 |
0.568 (0.394, 0.819) |
0.002 |
0.795 (0.537, 1.177) |
0.251 |
|
Table 3. MR-PRESSO Analysis for Genetic Associations Between Sarcopenia-related Traits and Strokes
Outcome |
Outcome |
OR (95% CI) |
Estimate |
SD |
P value |
Global Test-P Value |
Outliers |
FFM |
AIS |
1.026 (0.938, 1.123) |
0.026 |
0.046 |
0.571 |
<0.01 |
rs11065979, rs3843751, rs42044, rs4341996, rs57635800 |
CES |
|
|
|
|
0.198 |
* |
|
SVS |
0.844 (0.694, 1.026) |
-0.170 |
0.100 |
0.089 |
<0.01 |
rs10958683, rs11065979, rs4980067 |
|
LAS |
0.784 (0.632, 0.973) |
-0.243 |
0.110 |
0.028 |
<0.01 |
rs58857770 |
|
GSL |
AIS |
|
|
|
|
0.662 |
* |
CES |
|
|
|
|
0.506 |
* |
|
SVS |
|
|
|
|
0.093 |
* |
|
LAS |
|
|
|
|
0.241 |
* |
|
GSR |
AIS |
|
|
|
|
0.036 |
* |
CES |
|
|
|
|
0.360 |
* |
|
SVS |
|
|
|
|
0.180 |
* |
|
LAS |
|
|
|
|
0.107 |
* |
Notes: * Means no significant outliers.
4 DISCUSSION
Few studies have evaluated the effect of sarcopenia-related symptoms as an independent risk factor on the occurrence and development of stroke. This study showed an overall inverse association of genetically predicted sarcopenia-related traits with LAS and SVS and a positive association of genetically with CES, despite the P value is not significant in the causal association between grip strength and LAS. We found no causal association between IS and these related traits before being categorized into subtypes. Less muscle mass and weaker muscle strength may increase stroke risk through affected inflammatory signaling pathways[27] and hypertension[28].
Skeletal muscle contraction releases myokines, which can block inflammatory signaling pathways triggered by chronically elevated levels of pro-inflammatory adipokines[27]. Muscle mass can be increased through exercise training, and long-term exercise can reduce cardiovascular risk by secreting various anti-inflammatory myokines in skeletal muscle[29]. Muscle-secreted irisin can protect neurons by inhibiting the ROS-NLRP3 inflammatory signaling pathway[30]. Minn YK's findings suggest that increased skeletal muscle mass may have a protective effect against brain white matter changes and silent infarctions in community-dwelling men without stroke or dementia[31]. However, it is unfortunate that their study did not measure inflammatory cytokines such as IL-6 and IL-10.
Hypertension was a significant risk factor for ischemic stroke[32]. FFM could be the be a determinant of blood pressure levels[33], and a previous studies consisting of 2,671 children showed that for every 1% increase in FFM, the risk of developing high blood pressure was reduced by 9%[34]. Four population-based cohort studies from Germany found significant positive associations between changes in FFM and incident hypertension, as well as significant inverse associations with the normalization of blood pressure[35]. We suspect that gaining FFM reduces the risk of ischemic stroke, in part by preventing hypertension.
The training exercise is often accompanied by an increase in muscle strength. Grip strength is widely used to measure overall muscle strength in patients with weakness or sarcopenia. Low grip strength is a component of weakness that predicts negative health outcomes, and is associated with an increased risk of mortality in many studies[36-38]. Grip strength is a strong predictor of cardiovascular mortality and a moderately strong predictor of incident cardiovascular disease[39]. A linear relationship was found between grip strength and all-cause mortality, cardiovascular disease, coronary heart disease and stroke in a certain range[40]. Results from a study of three prospective cohorts support grip strength as an independent predictor of stroke in middle-aged and elderly European, American, and Chinese populations[41].
Notably, FFM appears to be a risk factor for CES in our study. Cardiogenic embolism is recognized to account for about 15% to 20% of all IS in clinical search. The most common underlying cause of CES is atrial fibrillation (AF), which increases the risk of ischemic stroke by 3 to 5 times. It is estimated that AF accounts for 15% of all strokes worldwide[42]. A few epidemiologic studies have assessed body composition and suggested that FFM, and not just fat mass, may be responsible for the increased AF risk[43,44]. Therefore, we hypothesized why FFM could positively affect AF and thus increase the risk of cardiogenic embolism, this also may explain that FFM-associated SNPs were not statistically significantly associated with AIS before being categorized into subtypes.
This study has some potential limitations to be noted. Firstly, we performed the sensitivity analysis combined with complementary MR methods aimed to minimize the risk of confounding and pleiotropy, but it is still the present possibility to bias the results. For example, the included SNPs in the whole body FFM instrument may impact ischemic stroke risk through other pathways. Secondly, we used body FFM rather than appendicular lean mass to measure muscle mass, which may not be entirely appropriate as this measurement could be biased by the inclusion of other non-fat soft tissues, such as the lungs, liver, and other organs. Additionally, relative muscle mass (appendicular lean mass/height2) may be a more appropriate measure of muscle mass compared to absolute muscle mass[2]. Thirdly, our research was primarily based on participants of European ancestry and may not be generalizable to other populations. However, we believe the causal effects of grip strength and lean mass are likely similar across different populations, though they may have greater relevance in certain groups. Fourthly, because the MR analyses used summary statistics, we could not obtain the original individual indicators, meaning differences in quality control and selection criteria of GWAS at the individual level may affect our results. Lastly, we cannot determine the clinical significance of the results since MR should be interpreted as testing for causation rather than indicating the size of any causal effect. Even if the effect size is small and not clinically significant, it may still be important for population health.
Acknowledgements
The study was supported by Natural Science Foundation of China (No.82173529, No.82173598, No.82103922 and No.82373587). We would like to thank MR-base dataset for providing relevant publicly available summary statistics. We thank all the Neale Lab and MRC-IEU consortium studies for making the summary association statistics data publicly available and we are grateful of all the investigators and participants in UK Biobank for the public individual-level data sets and their contribution to those studies.
Conflicts of Interest
The authors declared no conflict of interest.
Author Contribution
The authors made contributions to the conception and interpretation of the study and were involved in revising the manuscript. Lei S and Chen Y designed the study and interpreted the data, and Chen Y and Wu J drafted the manuscript. Chen Y, Yang Y, Xiong M, Yu X and Chen Y made a substantial contribution to the acquisition and analysis of the data. Lei S revised the manuscript critically for important intellectual content. All authors approved the final version of the manuscript.
Abbreviation List
AIS, Any ischemic stroke
CES, Cardioembolic stroke
EWGSOP, European Working Group on Sarcopenia in Older People
FFM, Fat-free mass
GWAS, Genome-wide association studies
GSL, Hand grip strength (left)
GSR, Hand grip strength (right)
IS, Ischemic strokes
IV, Instrumental variable
IVW, Inverse-variance weighted
LAS, large-artery atherosclerosis stroke
MR, Mendelian randomization
SVS, Small vessel stroke
References
[1] Cruz-Jentoft AJ, Sayer AA. Sarcopenia. Lancet, 2019; 393: 2636-2646.[DOI]
[2] Cruz-Jentoft AJ, Bahat G, Bauer J et al. Sarcopenia: revised European consensus on definition and diagnosis. Age Ageing, 2019; 48: 16-31.[DOI]
[3] Gielen E, O'Neill TW, Pye SR et al. Endocrine determinants of incident sarcopenia in middle-aged and elderly European men. J Cachexia Sarcopeni, 2015; 6: 242-252.[DOI]
[4] Yu R, Wong M, Leung J et al. Incidence, reversibility, risk factors and the protective effect of high body mass index against sarcopenia in community-dwelling older Chinese adults. Geriatr Gerontol Int, 2014; 14: 15-28.[DOI]
[5] Inoue T, Ueshima J, Kawase F et al. Trajectories of the Prevalence of Sarcopenia in the Pre- and Post-Stroke Periods: A Systematic Review. Nutrients, 2022; 15: 113.[DOI]
[6] Grysiewicz RA, Thomas K, Pandey DK. Epidemiology of ischemic and hemorrhagic stroke: incidence, prevalence, mortality, and risk factors. Neurol Clin, 2008; 26: 871-895.[DOI]
[7] Adams HP, Bendixen BH, Kappelle LJ et al. Classification of subtype of acute ischemic stroke. Definitions for use in a multicenter clinical trial. TOAST. Trial of Org 10172 in Acute Stroke Treatment. Stroke, 1993; 24: 35-41.[DOI]
[8] Li S, Yan H, Pan Y et al. Association of the sarcopenia index with cognitive impairment in a middle-aged to older patients with acute ischemic stroke or transient ischemic attack: A multicenter cohort study. J Nutr Health Aging, 2024; 28: 100241.[DOI]
[9] Gao K, Cao LF, Ma WZ et al. Association between sarcopenia and cardiovascular disease among middle-aged and older adults: Findings from the China health and retirement longitudinal study. EClinicalMedicine, 2022; 44: 101264.[DOI]
[10] Larsson SC, Back M, Rees JMB et al. Body mass index and body composition in relation to 14 cardiovascular conditions in UK Biobank: a Mendelian randomization study. Eur Heart J, 2020; 41: 221-226.[DOI]
[11] Smith GD, Ebrahim S. 'Mendelian randomization': can genetic epidemiology contribute to understanding environmental determinants of disease? Int J Epidemiol, 2003; 32: 1-22.[DOI]
[12] Wang N, Sun Y, Zhang H et al. Total and regional fat-to-muscle mass ratio measured by bioelectrical impedance and risk of incident type 2 diabetes. J Cachexia Sarcopeni, 2021; 12: 2154-2162.[DOI]
[13] He J, Huang M, Li N et al. Genetic Association and Potential Mediators between Sarcopenia and Coronary Heart Disease: A Bidirectional Two-Sample, Two-Step Mendelian Randomization Study. Nutrients, 2023; 15: 3013.[DOI]
[14] Ni JJ, Yang XL, Zhang H et al. Assessing causal relationship from gut microbiota to heel bone mineral density. Bone, 2021; 143: 115652.[DOI]
[15] Zillikens MC, Demissie S, Hsu YH et al. Large meta-analysis of genome-wide association studies identifies five loci for lean body mass. Nat Commun, 2017; 8: 80.[DOI]
[16] Visser M, Fuerst T, Lang T et al. Validity of fan-beam dual-energy X-ray absorptiometry for measuring fat-free mass and leg muscle mass. Health, Aging, and Body Composition Study--Dual-Energy X-ray Absorptiometry and Body Composition Working Group. J Appl Physiol, 1999; 87: 1513-1520.[DOI]
[17] Yi Y, Shim JS, Oh BM et al. Grip Strength on the Unaffected Side as an Independent Predictor of Functional Improvement After Stroke. Am J Phys Med Rehabil, 2017; 96: 616-620.[DOI]
[18] Sudlow C, Gallacher J, Allen N et al. UK biobank: an open access resource for identifying the causes of a wide range of complex diseases of middle and old age. PLoS Med, 2015; 12: e1001779.[DOI]
[19] Wind AE, Takken T, Helders PJ et al. Is grip strength a predictor for total muscle strength in healthy children, adolescents, and young adults? Eur J Pediatr, 2010; 169: 281-287.[DOI]
[20] Malik R, Chauhan G, Traylor M et al. Multiancestry genome-wide association study of 520,000 subjects identifies 32 loci associated with stroke and stroke subtypes. Nat Genet, 2018; 50: 524-537.[DOI]
[21] Purcell S, Neale B, Todd-Brown K et al. PLINK: a tool set for whole-genome association and population-based linkage analyses. Am J Hum Genet, 2007; 81: 559-575.[DOI]
[22] Bowden J, Davey Smith G, Burgess S. Mendelian randomization with invalid instruments: effect estimation and bias detection through Egger regression. Int J Epidemiol, 2015; 44: 512-525.[DOI]
[23] Verbanck M, Chen CY, Neale B et al. Detection of widespread horizontal pleiotropy in causal relationships inferred from Mendelian randomization between complex traits and diseases. Nat Genet, 2018; 50: 693-698.[DOI]
[24] Burgess S, Butterworth A, Thompson SG. Mendelian randomization analysis with multiple genetic variants using summarized data. Genet Epidemiol, 2013; 37: 658-665.[DOI]
[25] Bowden J, Davey Smith G, Haycock PC et al. Consistent Estimation in Mendelian Randomization with Some Invalid Instruments Using a Weighted Median Estimator. Genet Epidemiol, 2016; 40: 304-314.[DOI]
[26] Milligan BG. Maximum-likelihood estimation of relatedness. Genetics, 2003; 163: 1153-1167.[DOI]
[27] Morettini M, Storm F, Sacchetti M et al. Effects of walking on low-grade inflammation and their implications for Type 2 Diabetes. Prev Med Rep, 2015; 2: 538-547.[DOI]
[28] Brown IAM, Diederich L, Good ME et al. Vascular Smooth Muscle Remodeling in Conductive and Resistance Arteries in Hypertension. Arterioscler Thromb Vas, 2018; 38: 1969-1985.[DOI]
[29] Benatti FB, Pedersen BK. Exercise as an anti-inflammatory therapy for rheumatic diseases-myokine regulation. Nat Rev Rheumatol, 2015; 11: 86-97.[DOI]
[30] Zhang H, Wu X, Liang J et al. Irisin, an exercise-induced bioactive peptide beneficial for health promotion during aging process. Ageing res rev, 2022; 80: 101680.[DOI]
[31] Minn YK, Suk SH. Higher skeletal muscle mass may protect against ischemic stroke in community-dwelling adults without stroke and dementia: The PRESENT project. Bmc Geriatr, 2017; 17: 45.[DOI]
[32] O'Donnell MJ, Xavier D, Liu L et al. Risk factors for ischaemic and intracerebral haemorrhagic stroke in 22 countries (the INTERSTROKE study): a case-control study. Lancet, 2010; 376: 112-123.[DOI]
[33] Sidoti A, Nigrelli S, Rosati A et al. Body mass index, fat free mass, uric acid, and renal function as blood pressure levels determinants in young adults. Nephrol, 2017; 22: 279-285.[DOI]
[34] Xu R, Zhang X, Zhou Y et al. Percentage of free fat mass is associated with elevated blood pressure in healthy Chinese children. Hypertens Res, 2019; 42: 95-104.[DOI]
[35] Ittermann T, Werner N, Lieb W et al. Changes in fat mass and fat-free-mass are associated with incident hypertension in four population-based studies from Germany. Int J Cardiol, 2019; 274: 372-377.[DOI]
[36] Lopez-Jaramillo P, Cohen DD, Gomez-Arbelaez D et al. Association of handgrip strength to cardiovascular mortality in pre-diabetic and diabetic patients: a subanalysis of the ORIGIN trial. Int J Cardiol, 2014; 174: 458-461.[DOI]
[37] Gale CR, Martyn CN, Cooper C et al. Grip strength, body composition, and mortality. Int J Epidemiol, 2007; 36: 228-235.[DOI]
[38] Celis-Morales CA, Lyall DM, Anderson J et al. The association between physical activity and risk of mortality is modulated by grip strength and cardiorespiratory fitness: evidence from 498 135 UK-Biobank participants. Eur Heart J, 2017; 38: 116-122.[DOI]
[39] Welsh CE, Celis-Morales CA, Ho FK et al. Grip Strength and Walking Pace and Cardiovascular Disease Risk Prediction in 406,834 UK Biobank Participants. Mayo Clinic proc, 2020; 95: 879-888.[DOI]
[40] Wu Y, Wang W, Liu T et al. Association of Grip Strength With Risk of All-Cause Mortality, Cardiovascular Diseases, and Cancer in Community-Dwelling Populations: A Meta-analysis of Prospective Cohort Studies. J Am Med Dir Assoc, 2017; 18: 551.e17-551.e35.[DOI]
[41] Li G, Lu Y, Shao L et al. Handgrip strength is associated with risks of new-onset stroke and heart disease: results from 3 prospective cohorts. BMC geriatrics, 2023; 23: 268.[DOI]
[42] Escudero-Martínez I, Morales-Caba L, Segura T. Atrial fibrillation and stroke: A review and new insights. Trends Cardiovas Med, 2023; 33: 23-29.[DOI]
[43] Carbone S, Lavie CJ, Nattel S. Editorial Commentary: Obesity, body composition and atrial fibrillation. Trends Cardiovasc Med, 2020; 30: 212-214.[DOI]
[44] Fenger-Gron M, Vinter N, Frost L. Body mass and atrial fibrillation risk: Status of the epidemiology concerning the influence of fat versus lean body mass. Trends Cardiovasc Med, 2020; 30: 205-211.[DOI]
Copyright © 2024 The Author(s). This open-access article is licensed under a Creative Commons Attribution 4.0 International License (https://creativecommons.org/licenses/by/4.0), which permits unrestricted use, sharing, adaptation, distribution, and reproduction in any medium, provided the original work is properly cited.


