Platelet Parameters Were Associated with Osteoporosis among Elderly Chinese Populations
Lili Sun1,2, Wenhui Wang1,2, Jiahui He1,2, Hongbo Gu3, Hui Tang1,2, Kan Zhu4, Pei He1,2, Guoping Gui5, Xingbo Mo1,2, Xin Lu1,2, Feiyan Deng1,2, Shufeng Lei1,2*
1Center for Genetic Epidemiology and Genomics, School of Public Health, Medical College of Soochow University, Suzhou, Jiangsu Province, China
2Jiangsu Key Laboratory of Preventive and Translational Medicine for Geriatric Diseases, Soochow University, Suzhou, Jiangsu Province, China
3Shishan Community Health Service Center, Suzhou High Tech Zone, Suzhou, Jiangsu Province, China
4Loujiang Community Health Service Center, Gusu District, Suzhou, Jiangsu Province, China
5Disease Prevention and Control Center of Suzhou High Tech Zone, Suzhou, Jiangsu Province, China
*Correspondence to: Shu-Feng Lei, PhD, Professor, Director, Center for Genetic Epidemiology and Genomics, School of Public Health, Medical College of Soochow University, Suzhou, 215123, Jiangsu Province, China; Email: leisf@suda.edu.cn
DOI: 10.53964/cme.2024005
Abstract
Objective: Hematological changes related to osteoporosis in elderly people are largely unknown. Our aim was to systemically evaluate the associations between platelet parameters and osteoporosis in two large elderly Chinese populations.
Methods: This cross-sectional study included 1,982 (Sample 1) and 3,675 (Sample 2) participants selected from our ongoing cohort study: Osteoporosis Preventive Project (OPP). The platelet parameters were measured by a Mindray automatic blood cell analyzer. Platelet parameters include platelet count (PLT), mean platelet volume (MPV), platelet distribution width (PDW), and plateletcrit (PCT). Bone mineral density (BMD) was measured by dual-energy X-ray absorptiometry with Hologic densitometers (Hologic Inc., USA). We performed the chi-squared test, the Kruskal–Wallis rank test, Spearman correlation analysis, and partial correlation analysis to detect the associations between platelet parameters and bone mineral density. All statistical analyses were performed using SPSS software (version 25.0), with a significance level set at P<0.05.
Results: Among the three groups categorized by lumber spine (LS) BMD, PLT, PDW, and PCT were significantly different among the three groups. These results were consistent and replicated in the two samples (P<0.05). Similarly, significant differences only for PLT (P=0.003) and PCT (P=0.004) were observed in Sample 2 among the three groups categorized by femoral neck (FN) BMD. Further in-depth intergroup difference tests also found the differences still existed among the subgroups. The associations are negative for PLT and PCT, but positive for PDW with LS BMD and FN BMD (P<0.01) in both samples when unadjusted.
Conclusion: The results suggest that three parameters (PLT, PDW and PCT) have significant correlations with BMD. This study increased our understanding of their relationship and probably provides a valuable reference for future studies on the pathogenesis and pathophysiology of osteoporosis.
Keywords: platelet parameters, osteoporosis, bone mineral density
1 INTRODUCTION
Osteoporosis is a serious bone health problem in the elderly, whose main characteristics are low bone mineral density (BMD) and destruction of the microarchitecture, which lead to an increased risk of osteoporotic fracture[1]. It is estimated that the number of people suffering from osteoporosis will increase sharply from 83.9 million in 1997 to 212 million in 2050[2]. In the elderly, osteoporosis shows an increased degree of imbalance of bone resorption and formation. Bone resorption is mediated primarily by osteoclasts derived from hematopoietic stem cells in the bone marrow. In addition, the abundant bone mass may also support hematopoiesis, as bone trabeculae, known as endothelial niches, are the most efficient and preferred habitat for hematopoietic stem cells[3]. Platelets, as derivatives of bone marrow megakaryocytes (MGKs), play a key role in bone metabolism by releasing growth factors such as platelet-derived growth factor (PDGF) and transforming growth factor-β (TGF-β)[4,5]. These factors not only promote the proliferation and differentiation of osteoblasts to enhance bone formation but also inhibit the development of osteoclasts, thereby maintaining stable bone mass. In addition, platelet quality and quantity are directly influenced by MGKs[6], and platelet-derived PDGF-BB specifically promotes the differentiation of mesenchymal stem cells (MSCs) to osteoblasts in osteoporotic bone and enhances osteoclast formation and precursor cell chemotaxis[7]. Patients with osteoporosis typically have low levels of vitamin D receptors, which play an important role in platelet function, further revealing a strong link between platelets and osteoporosis[8]. These findings suggest that platelets may play a role in the pathogenesis of osteoporosis through multiple pathways.
A recent systematic review highlighted the strong correlation between platelet parameters and bone mineralization, finding a correlation between changes in platelet size, distribution width, and volume, and low bone mineral density (BMD)[9]. Subsequently, the link between platelet count (PLT) and osteoporosis status has been further emphasized, with a high PLT count found to be associated with low BMD[10]. Another independent population-based study confirms this finding[11]. For mean platelet volume (MPV) and platelet distribution width (PDW), it was shown that both MPV and PDW levels were increased in patients with osteoporosis and that PDW was independently and positively correlated with bone mineralization[12,13]. Similarly, although the above study showed a negative correlation between PLT and BMD[10,11], however, some studies have shown a positive correlation between PLT and BMD[14]. The differences in ethnicity and study design may be responsible for the inconsistent results, among which a small sample size would be a very important influencing factor (e.g., only 410 and 320 in Li’s and Akbal’s studies, respectively). In addition, the role of platelets in inflammatory and reparative processes, as well as the effects of the growth factors and cytokines they release on bone formation, raises the possibility that platelets may be involved in the development of osteoporosis through multiple mechanisms[15].
Although studies have examined the association between platelet parameters and osteoporosis, systematic studies on the relationship between PLT, platelet specific capacity (PCT), and indicators of platelet activation status (e.g., MPV and PDW) and BMD are still lacking. The relationship between these parameters and osteoporosis, especially in large healthy populations, has not been fully elucidated. This study aimed to investigate the association between platelet parameters and osteoporosis by analyzing them in two large independent Chinese populations (9,301 subjects in total). Our study is not only based on a large sample size but also employs strict subject selection criteria to ensure the reliability of the findings. With this study, we expect to provide new perspectives for understanding the role of platelets in the development of osteoporosis and perhaps provide valuable references for future studies on the pathogenesis and pathophysiology of osteoporosis.
2 MATERIALS AND METHODS
2.1 Study Design and Participants
This is a cross-sectional study. The subjects were selected from our ongoing cohort study: the OPP. All subjects were recruited from community health centers in Suzhou, Jiangsu Province in southeastern China. Two initial independent large populations consisted of 3,324 (Sample 1) and 5,977 (Sample 2). Figure 1 shows the detailed process of subject selection. Subjects with the following conditions will be excluded: diabetes mellitus, thyroid disease, cancer, gastrectomy/duodenectomy, renal insufficiency, anemia, stroke, coronary artery disease, corticosteroid use. Based on the initial 3,324 (Sample 1) and 5,977 (Sample 2) subjects, we excluded 1,342 (Sample 1) and 2,302 (Sample 2) subjects with known diseases or incomplete data. Finally, a total of 1,982 (Sample 1) and 3,675 (Sample 2) subjects were used in the following analyses. Detailed information, such as age, disease history, and medical history, was collected by trained professionals through the face-to-face questionnaire. Basic anthropometric parameters, e.g., height (m), weight (kg), and body mass index (BMI), were measured and calculated. Each subject provided written informed consent. This study was approved by the Institutional Research Ethics Board at Soochow University.
|
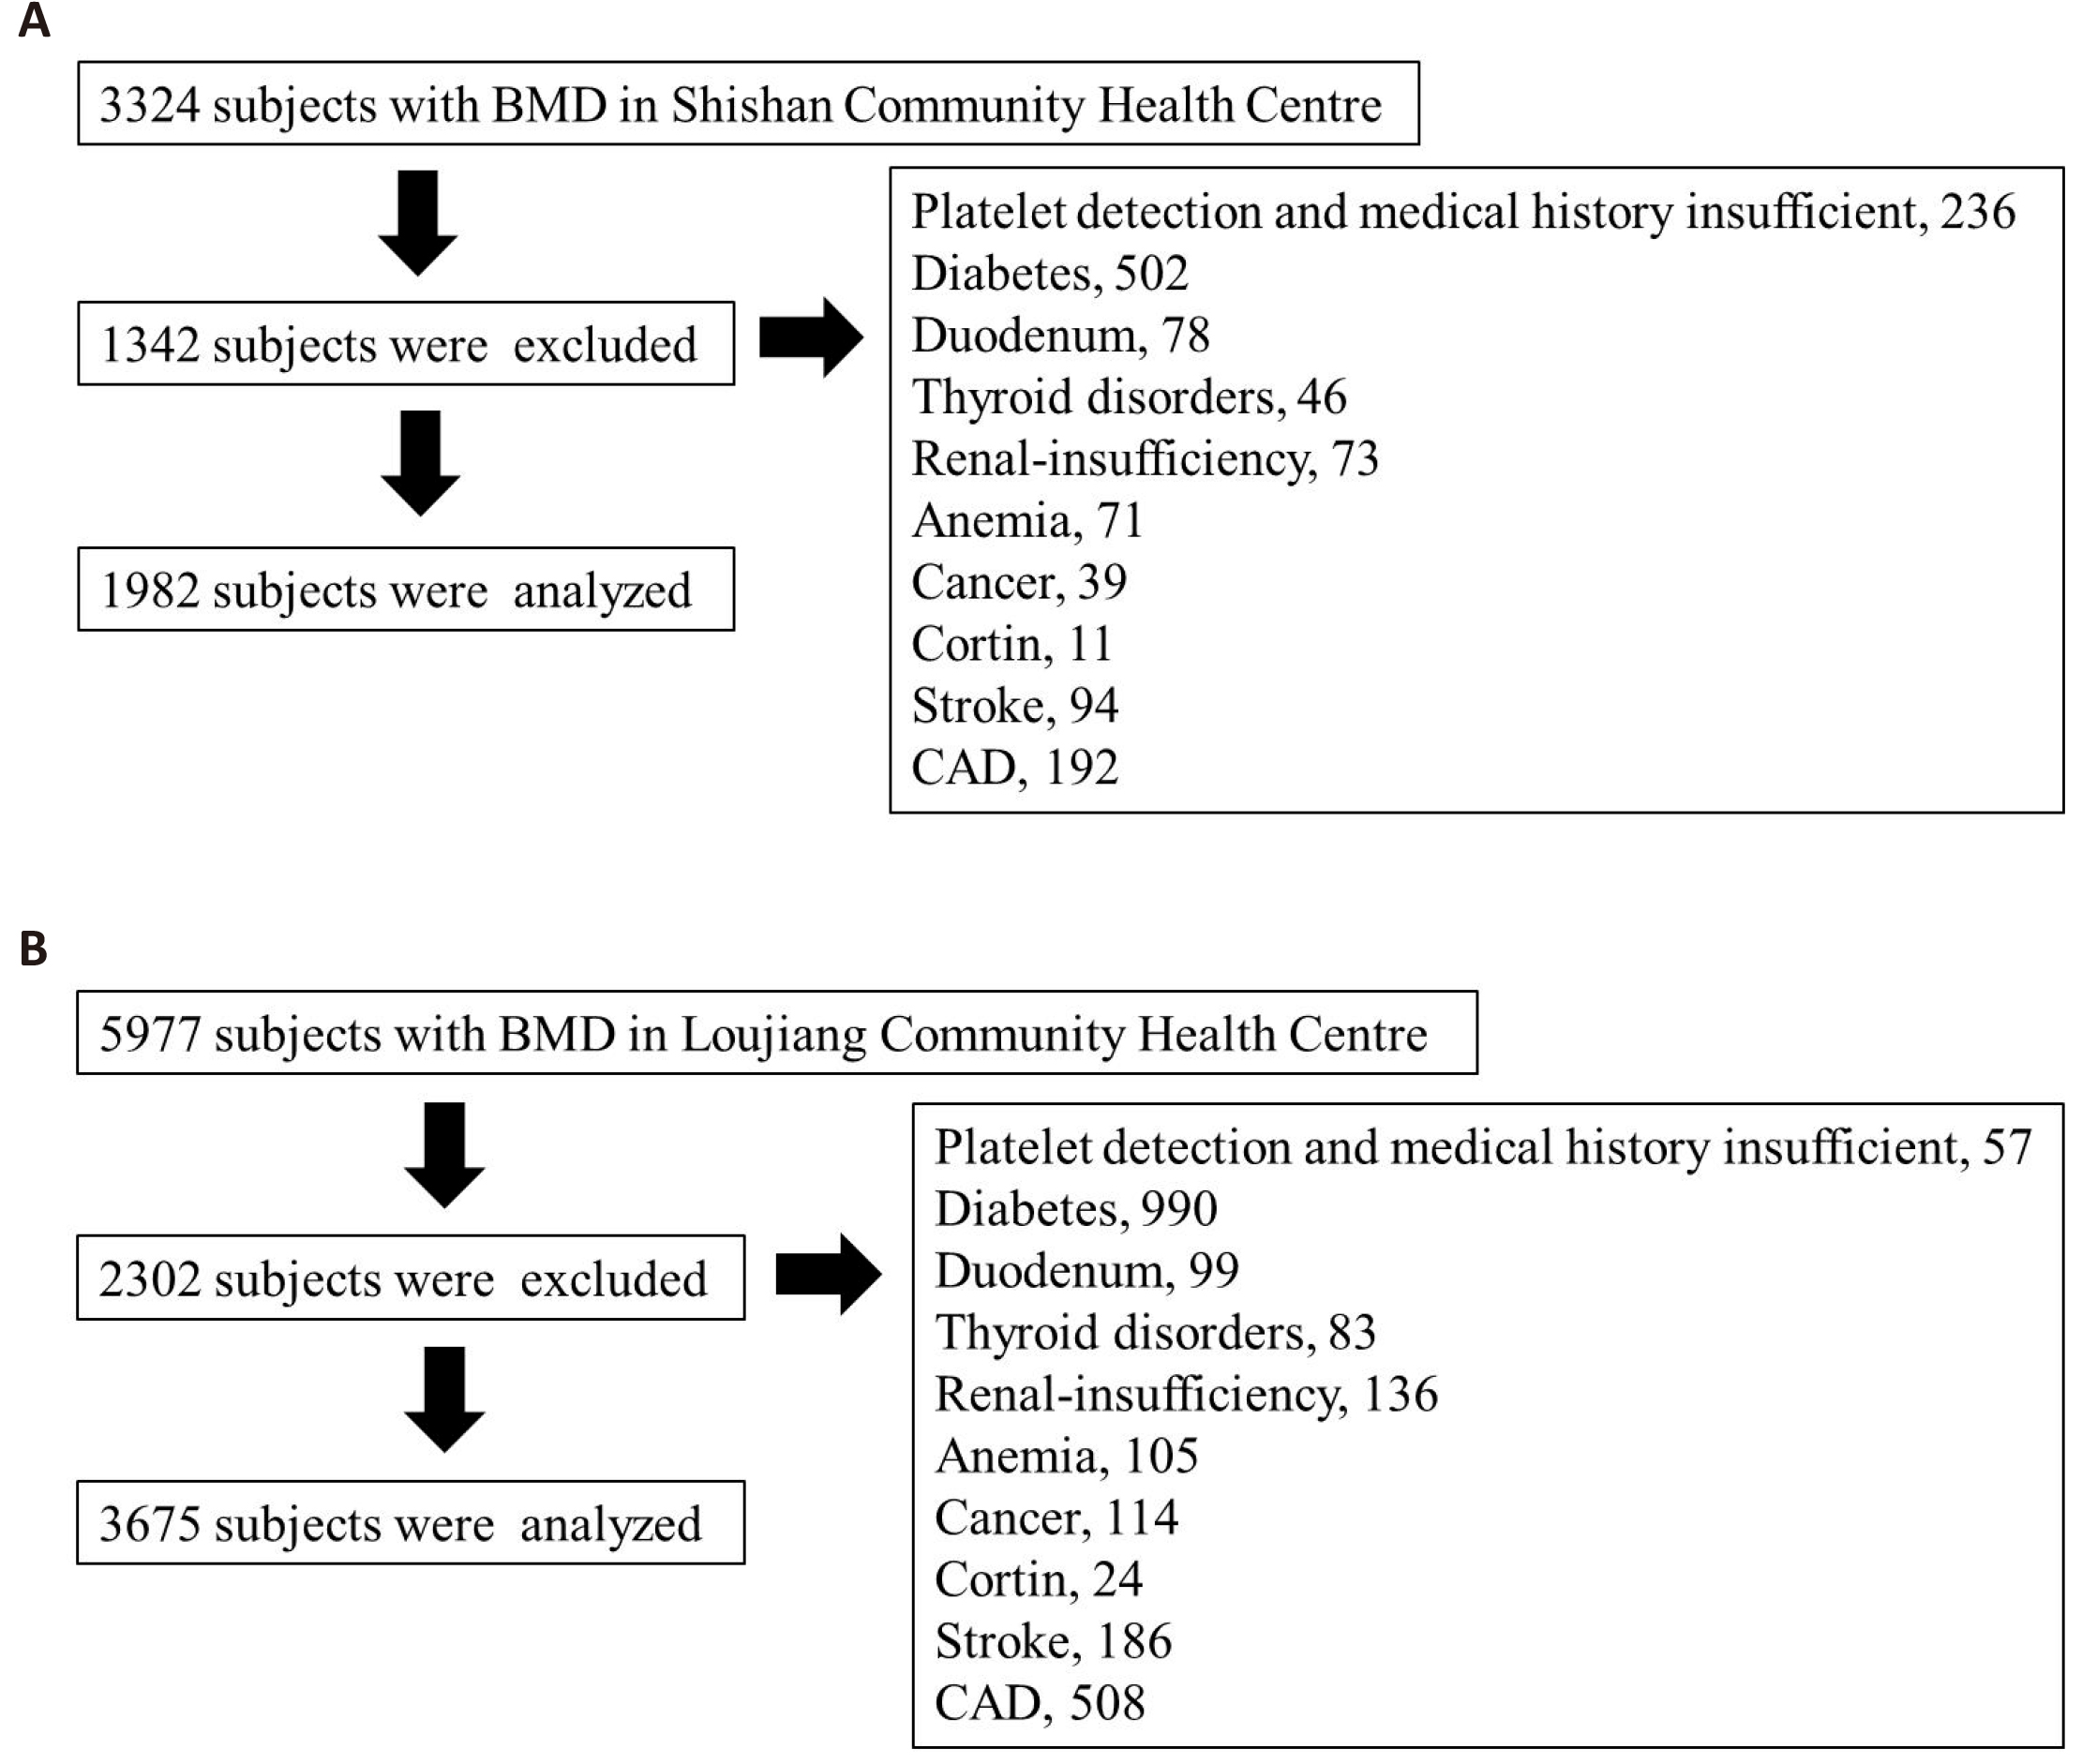
Figure 1. The process of subject selection in the two samples. A: Sample 1. B: Sample 2.
2.2 Data Collection Instruments
Fasting peripheral blood was collected in sodium-citrate anticoagulant tubes. Four platelet parameters, PLT, MPV, PDW, and PCT, were measured by the Mindray BC-5800 automatic five-class blood cell analyzer (Shenzhen, China) for Sample 1 and by the Mindray BC-2600 automatic three-class blood cell analyzer (Shenzhen, China) for Sample 2.
BMD (g/cm2) was measured by dual-energy X-ray absorptiometry densitometers (Hologic Inc., USA) at the lumbar spine (LS, vertebrae L1-L4) and femoral neck (FN). T-scores were automatically calculated by software as the number of standard deviations below the average for young adults at peak bone density. Subjects were categorized into three groups: the osteoporosis group (T-scores≤-2.5); the osteopenia group (-1<T-scores<-2.5); and the normal group (T-scores≥-1).
2.3 Statistical Analysis
Statistical analysis was performed using SPSS 22.0 and SAS 9.4 statistical software. The quantitative data were described by the median (P25, P75), which all showed a nonnormal distribution by normality test. The chi-squared test was performed for qualitative data. For quantitative data, the Kruskal–Wallis rank test of the multisampling comparison in a completely random design was used to compare the differences between the three groups. Correlations between the platelet parameters and BMD were tested by Spearman correlation analysis groups were performed using the Bonferroni test, and P<0.016 was considered statistically significant, and further by partial correlation analysis with sex, age, and BMI adjustment. Statistical significance was defined as P<0.05 (two-tailed). Pairwise comparisons between three.
3 RESULTS
According to LS BMD, subjects were divided into three groups. Age and BMI were significantly different (Kruskal–Wallis rank test) among the three groups in the two samples (P<0.05). For the four platelet parameters, in addition to the MPV, the other three parameters (PLT, PDW, and PCT) were significantly different among the three groups. These results were consistent and replicated in the two samples (P<0.05) (Table 1).
Table 1. The Basic Characteristics of The Study Subjects Categorized by LS BMD
Variables |
Sample 1 |
Sample 2 |
||||||
Osteoporosis |
Osteopenia |
Normal |
P |
Osteoporosis |
Osteopenia |
Normal |
P |
|
Total, n (%) |
723 (36.48) |
715 (36.07) |
544 (27.45) |
|
1,176 (32.00) |
1,369 (37.25) |
1,130 (30.75) |
|
Age (year) |
70 (67, 75) |
69 (67, 73) |
69 (67, 74) |
0.006 |
71 (67, 76) |
70 (67, 74) |
71 (67, 76) |
<0.001 |
BMI (kg/m2) |
23.44 (21.25, 25.63) |
24.45 (22.19, 26.44) |
25.44 (23.57, 27.48) |
<0.001 |
22.83 (20.76, 24.97) |
24.34 (22.15, 26.44) |
25.15 (23.34, 27.58) |
<0.001 |
PLT (109/L) |
187 (154, 220) |
186 (153, 221) |
179 (151.25, 211) |
0.013 |
195 (165, 230) |
195 (164, 233) |
189 (159, 224) |
0.003 |
MPV (fL) |
8.7 (8.1, 9.4) |
8.6 (8, 9.3) |
8.7 (8.1, 9.5) |
0.107 |
9.9 (9.4, 10.5) |
9.9 (9.4, 10.5) |
9.9 (9.4, 10.5) |
0.698 |
PDW (%) |
16.4 (16, 16.7) |
16.4 (16, 16.7) |
16.5 (16.1, 16.8) |
0.001 |
14.9 (14.7, 15.4) |
14.9 (14.7, 15.5) |
14.9 (14.7, 15.7) |
0.02 |
PCT (%) |
0.163 (0.139, 0.188) |
0.161 (0.134, 0.188) |
0.155 (0.135, 0.181) |
0.008 |
0.195 (0.166, 0.223) |
0.194 (0.164, 0.228) |
0.187 (0.159, 0.22) |
0.001 |
LS BMD (g/cm2) |
0.696 (0.635,0.744) |
0.863 (0.823, 0.908) |
1.068 (1.004, 1.148) |
<0.001 |
0.700 (0.648, 0.742) |
0.868 (0.827, 0.913) |
1.083 (1.016, 1.176) |
<0.001 |
Notes: The quantitative data were described by median (P25, P75), which all showed non-normal distribution by normality test. The Kruskal-Wallis rank test was used for comparison between multiple groups. Sample 1 from Shishan Community Health Center; Sample 2 from Loujiang Community Health Center.
Similarly, according to FN BMD, subjects were divided into three groups. Age and BMI were significantly different (Kruskal–Wallis rank test) among the three groups in the two samples (P<0.05). However, for the four platelet parameters, significant differences only for PLT (P=0.003) and PCT (P=0.004) were observed in Sample 2 (Table 2).
Table 2. The Basic Characteristics of The Study Subjects Categorized by FN BMD
Variables |
Sample 1 |
Sample 2 |
||||||
Osteoporosis |
Osteopenia |
Normal |
P |
Osteoporosis |
Osteopenia |
Normal |
P |
|
Total, n (%) |
520 (26.24) |
1,141 (57.57) |
321 (16.19) |
|
959 (26.09) |
2,098 (57.09) |
618 (16.82) |
|
Age (year) |
72 (68, 78) |
69 (67, 73) |
69 (66, 72) |
<0.001 |
73 (68, 79) |
70 (67, 74) |
69 (66, 73.73) |
<0.001 |
BMI (kg/m2) |
23.07 (21.14, 25.38) |
24.61 (22.32, 26.49) |
25.69 (23.73, 27.83) |
<0.001 |
22.83 (20.70, 24.97) |
24.31 (22.23, 26.49) |
25.4 (23.77, 27.68) |
<0.001 |
PLT (109/L) |
187 (153.25, 219) |
185 (153, 220) |
180 (153, 210) |
0.094 |
196 (167, 232) |
193 (162, 230) |
188 (157, 224) |
0.003 |
MPV (fL) |
8.6 (8, 9.3) |
8.7 (8.1, 9.4) |
8.8 (8.1, 9.5) |
0.201 |
9.9 (9.4, 10.5) |
9.9 (9.4, 10.5) |
9.9 (9.4, 10.5) |
0.916 |
PDW (%) |
16.3 (16.025, 16.7) |
16.4 (16.1, 16.7) |
16.4 (16.1, 16.8) |
0.086 |
14.9 (14.7, 15.4) |
14.9 (14.7, 15.6) |
14.9 (14.7, 15.7) |
0.06 |
PCT (%) |
0.162 (0.136, 0.188) |
0.16 (0.136, 0.187) |
0.156 (0.136, 0.18) |
0.171 |
0.195 (0.167, 0.226) |
0.192 (0.163, 0.225) |
0.187 (0.158, 0.22) |
0.004 |
FN BMD (g/cm2) |
0.524 (0.480, 0.555) |
0.662 (0.619, 0.716) |
0.837 (0.801, 0.894) |
<0.001 |
0.524 (0.489, 0.555) |
0.663 (0.622, 0.709) |
0.840 (0.805, 0.896) |
<0.001 |
Notes: The quantitative data were described by median (P25, P75), which all showed non-normal distribution by normality test. The Kruskal-Wallis rank test was used for comparison between multiple groups. Sample 1 from Shishan Community Health Center; Sample 2 from Loujiang Community Health Center.
Furthermore, in-depth difference tests were performed for the significant parameters to detect the intergroup differences. Among the groups categorized by LS BMD, PLT levels in the osteoporosis group and osteopenia group were both different from those in the normal group in two samples; PDW levels in the osteoporosis group and osteopenia group were both different from those in the normal group in Sample 1 and PDW levels in osteoporosis group were different from those in the normal group in Sample 2; PCT levels in osteoporosis group were different from those in the normal group in sample 1 and PCT levels in osteoporosis group and osteopenia group were both different from those in the normal group in sample 2 (all P<0.016) (Figure 2). When subjects were categorized by FN BMD, PLT and PCT levels in the osteoporosis group and osteopenia group were both different from those in the normal group in sample 2 (both P<0.016) (Figure 3).
|

Figure 2. The intergroup differences in PLT, PDW, and PCT levels among the three groups were categorized by LS BMD. A: PLT, PDW, PCT in sample 1. B: PLT, PDW, PCT in sample 2.
|
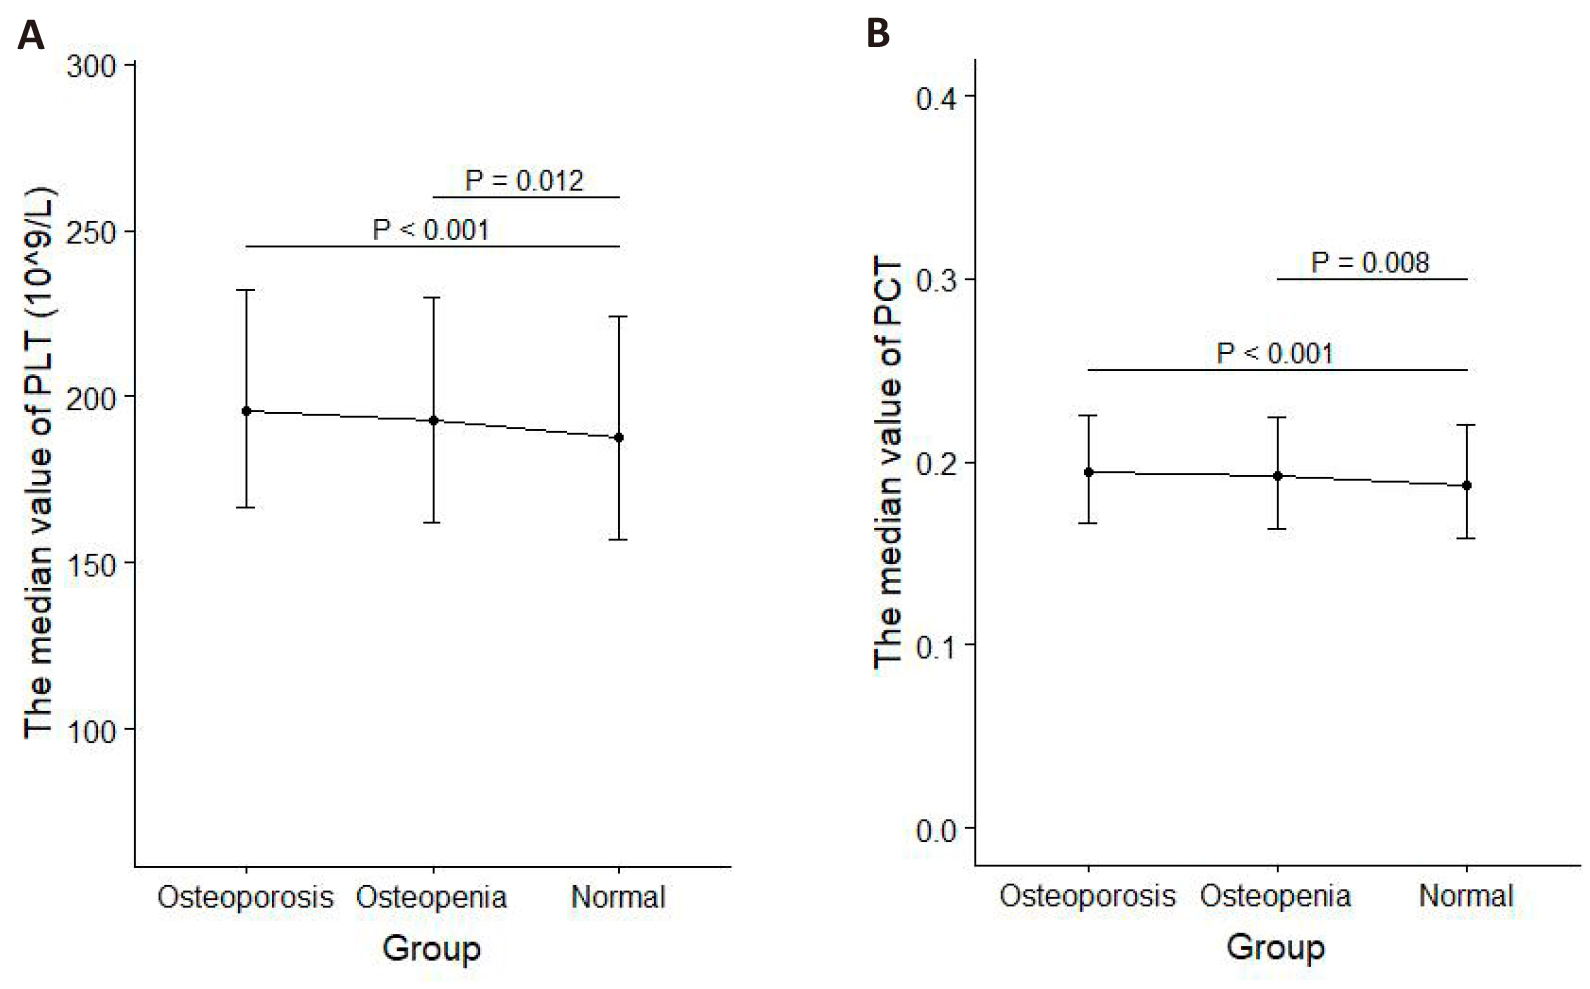
Figure 3. The intergroup differences in PLT and PCT levels among the three groups were categorized by FN BMD. A: PLT in Sample 2. B: PCT in Sample 2.
Spearman correlation analyses demonstrated that PLT and PCT were negatively correlated with LS BMD and FN BMD (P<0.01) in both samples when unadjusted, but after adjustment for sex, age, and BMI, the correlations were changed, with only two significantly negative pairs (PLT and FN BMD and PCT and FN BMD in Sample 2). However, MPV showed no significant correlations with LS BMD or FN BMD in either sample under unadjusted or adjusted (all P>0.05). Contrary to PLT and PCT, PDW was positively associated with LS BMD and FN BMD when unadjusted in both samples (p < 0.01). However, significantly positive correlations were only observed in Sample 2 after adjustment for sex, age, and BMI (Table 3).
Table 3. Correlation Analysis of the Platelet Parameters and LS / FN BMD (Correlation Coefficient r)
|
Variables (g/cm2) |
PLT (109/L) |
MPV (fL) |
PDW (%) |
PCT (%) |
||||
Sample 1 |
LS BMD |
-0.063** |
0.031 |
0.004 |
0.006 |
0.077** |
0.032 |
-0.074** |
0.035 |
FN BMD |
-0.077** |
-0.035 |
0.027 |
0.033 |
0.067** |
0.03 |
-0.080** |
-0.023 |
|
Sample 2 |
LS BMD |
-0.062** |
-0.009 |
-0.009 |
0 |
0.055** |
0.077** |
-0.068** |
-0.009 |
FN BMD |
-0.076** |
-0.052** |
0.002 |
0.025 |
0.045** |
0.044** |
-0.077** |
-0.047** |
|
Notes: The non-italic values were Spearman correlation coefficient r; the italic values were partial correlation coefficient r when sex, age, and BMI were adjusted (**P<0.01).
4 DISCUSSION
The present study systemically evaluated the complex relationship between platelet parameters and osteoporosis in two large independent elderly Chinese samples. Our study repeatedly detected negative correlations between PLT/PCT and BMD and positive correlations between PDW and BMD at both the LS and FN. Such correlations would be changeable after adjustment for sex, age, and BMI. The correlations between PLT/PCT/PDW and FN BMD in Sample 2 were always significant before and after adjustment.
PLT was negatively correlated with BMD in our study. Similar results have also been reported in three other Chinese populations[14,16-17]. And negative associations between PLT and LS BMD and FN BMD were also observed in two other studies of more than 8,000 adults in Korea[11,18]. However, the findings of Ma et al.[14] differ from ours in that they found a positive correlation between PLT and LS BMD. This inconsistency may be related to gender differences in the study population. For example, Ma et al.[14] conducted research on postmenopausal women and found a negative correlation between platelet count (PLT) and bone mineral density (BMD) in the hip region. While Kristjansdottir et al.[10] observed the opposite result in older men. In the MrOS Sweden cohort study[10], researchers sought to more accurately assess the relationship between platelet activity and BMD by adjusting for estradiol levels as a confounding factor. All of these studies further support the idea that gender may be an important factor influencing the relationship between PLT and BMD. Notably, the study by Kikuchi et al.[15] provides a new perspective by finding a significant negative correlation between megakaryocyte derived RANKL and BMD (r=-0.502, P=0.034) and by suggesting that platelet counts may indirectly reflect MGK activity and thus influencing BMD.
PDW is a parameter that reflects the variability of platelet volume within the blood that reflects the diversity of platelets in terms of maturation and function. High PDW values usually indicate that there are platelets at different stages of maturation in the circulation, which may mean that the platelet population contains both large platelets that are active and rich in growth factors, as well as smaller platelets. These large platelets may play an active role in bone formation because they can release factors that promote bone growth[7]. In our study, PDW was positively correlated with LS BMD and FN BMD. This relationship persisted after adjusting for sex, age, and BMI. Two current studies[12,13] also suggested that PDW levels were lower in osteoporosis patients than in normal people, and PDW was an independent factor influencing BMD. These findings suggest that the activation state and function of platelets may play an important role in the maintenance of BMD. Platelets release an abundance of growth factors beneficial to bone growth when activated. Vascular endothelial growth factor (VEGF) is essential for nutrient supply and oxygen delivery to bone tissue and helps osteoblasts obtain the necessary nutrients to support bone formation and maintenance19. PDGF and TGF-β help to accelerate the repair and regeneration of bone tissues by stimulating osteoblasts' activity[20].
Our study found no correlation between MPV and BMD. However, Li et al.[21] thought that MPV increase was an important factor in the reduction of BMD, and later Akbal et al[12] proposed that Li’s study did not rule out factors that may affect MPV levels, such as cardiovascular disease and diabetes. Akbal’s study excluded these patients and eventually found that MPV levels were not associated with BMD, and regression analysis did not show its effect on BMD measurements. Our study also excluded these factors and concluded that MPV was not an associated factor with BMD. Only 80 people were finally analyzed in Akbal's study, but our study was based on two large samples of 1,982 and 3,675. We further confirmed that MPV levels had no impact on osteoporosis.
PCT indicates the proportion of platelets in the blood, PCT=MPV×PLT. Only one previous study investigated the relationship between PCT and osteoporosis and concluded that PCT had no association with BMD[17]. However, we found that PCT was negatively related to LS BMD and FN BMD. The small sample size (126 subjects) in a previous study may be an important factor for the detection of no association. The negative correlation results we derived may imply some physiological or pathological response (higher relative concentration) of platelets at the local or systemic level in individuals with lower BMD.
Generally, the detected significant correlations are relatively small (from r=0.045 to =0.080). Moreover, the correlations were not perfectly consistent between two samples or between two skeletal sites (LS and FN). Compared with previous studies, our sample size is quite large. Our study has two large independent samples, which have high power to detect associations with small or moderate effects. However, the sample sizes for Sample 1 (n=1,982) and Sample 2 (n=3,675) are different, so the inconsistent correlations between samples are understandable. Additionally, the different components at the skeletal sites (main cancellous bone for LS and main cortical bone for FN) may be an important underlying factor for the inconsistency across sites. In the lumbar spine, PLT and PCT were no longer correlated with BMD after adjustment, which indicates that their correlations were affected by sex, age, or BMI confounding factors. However, the correlation between FN BMD and platelet parameters (PLT, PDW, PCT) existed both before and after adjustment. This shows that they are independently related and are not affected by confounding factors.
Our study has two obvious advantages. First, as discussed above, our large independent samples have high power to detect associations with small or moderate effects. Second, we adopted strict exclusion criteria to select “healthy” subjects to detect the normal relationship between platelet parameters and BMD, which would provide an important reference for future studies on their relationship.
To our knowledge, this study represents our first efforts to systemically investigate the relationship between platelet parameters and osteoporosis in large and healthy Chinese populations. Three parameters (PLT, PDW, and PCT) had significant correlations with BMD, but MPV had no associations with BMD. Our results indicated the involvement of platelets in the development of osteoporosis. This study increased our understanding of their relationship and probably provides a valuable reference for future studies on the pathogenesis and pathophysiology of osteoporosis.
5 CONCLUSION
The results suggest that three parameters PLT, PDW, and PCT have significant correlations with BMD. This study increased our understanding of their relationship and probably provides a valuable reference for future studies on the pathogenesis and pathophysiology of osteoporosis.
Acknowledgements
The study was supported by the Natural Science Foundation of China (No.82373587, No.82173529, No.82173598, and No.82103922)
Ethical Approval Statement
This study was approved by the Institutional Research Ethics Board at Soochow University. Each subject provided written informed consent.
Conflicts of Interest
The authors declare no conflict of interest.
Author Contribution
Sun L was responsible for writing the original draft. Sun L, Wang W, He J, Gu H, Tang H, Zhu K, He P, Gui G, Mo X, Lu X, Deng F, and Lei S were responsible for reviewing and editing the manuscript. He P, Gui G, Mo X, Lu X, Deng F, and Lei S were responsible for designing the methodology. He J, Tang H, and Zhu K were responsible for data curation. Sun L, Wang W, and Gu H were responsible for formal analysis. Deng F and Lei S were responsible for funding acquisition. Lei S was responsible for conceptualization and supervision.
Abbreviation List
BMD, Bone mineral density
BMI, Body mass index
FN, Femoral neck
LS, Lumbar spine
MGK, Megakaryocyte
MPV, Mean platelet volume
MSCs, Mesenchymal stem cells
OPP, Osteoporosis preventive project
PCT, Plateletcrit
PDGF-BB, Platelet-derived growth factor-BB
PDGF, Platelet-derived growth factor
PDW, Platelet distribution width
PLT, Platelet count
TGF-β, Transforming growth factor-β
VEGF, Vascular endothelial growth factor
References
[1] Kanis JA. Assessment of Fracture Risk and Its Application to Screening for Postmenopausal Osteoporosis: Synopsis of a WHO Report. Osteoporos Int, 1994; 4: 368-381.[DOI]
[2] Liu ZH, Zhao YL, Ding GZ et al. Epidemiology of Primary Osteoporosis in China. Osteoporos Int, 1997; 7: S84-87.[DOI]
[3] Ciovacco WA, Cheng YH, Horowitz MC et al. Immature and Mature Megakaryocytes Enhance Osteoblast Proliferation and Inhibit Osteoclast Formation. J Cell Biochem, 2010; 109: 774-781.[DOI]
[4] Beeton CA, Bord S, Ireland D et al. Osteoclast Formation and Bone Resorption are Inhibited by Megakaryocytes. Bone, 2006; 39: 985-990.[DOI]
[5] Kacena MA, Nelson T, Clough ME et al. Megakaryocyte-Mediated Inhibition of Osteoclast Development. Bone, 2006; 39: 991-999.[DOI]
[6] Sim X, Poncz M, Gadue P et al. Understanding Platelet Generation from Megakaryocytes: Implications for In Vitro-Derived Platelets. Blood, 2016; 127: 1227-1233.[DOI]
[7] Li DQ, Wan QL, Pathak JL et al. Platelet-Derived Growth Factor BB Enhances Osteoclast Formation and Osteoclast Precursor Cell Chemotaxis. J Bone Miner Metab, 2017; 35: 355-365.[DOI]
[8] Vural M, Mert M, Erhan B et al. Is There Any Relationship Between Mean Platelet Volume, Bone Mineral Density and Vitamin D in Postmenopausal Women? Acta Medica Mediterr, 2017; 33: 443.[DOI]
[9] Salamanna F, Maglio M, Sartori M et al. Platelet Features and Derivatives in Osteoporosis: A Rational and Systematic Review on the Best Evidence. Int J Mol Sci, 2020; 21. [DOI]
[10] Kristjansdottir HL, Mellstrom D, Johansson P et al. High Platelet Count is Associated with Low Bone Mineral Density: The MrOS Sweden Cohort. Osteoporos Int, 2021; 32: 865-871.[DOI]
[11] Kim J, Kim HS, Lee HS et al. The Relationship Between Platelet Count and Bone Mineral Density: Results from Two Independent Population-Based Studies. Arch Osteoporos, 2020; 15: 43.[DOI]
[12] Akbal A, Gokmen F, Gencer M et al. Mean Platelet Volume and Platelet Distribution Width Can Be Related to Bone Mineralization. Osteoporos Int, 2014; 25: 2291-2295.[DOI]
[13] Ou-Yang J, Zhang J, Tan X et al. Risk Interval of Complete Blood Counts May be Closely Associated with Bone Mineral Density in the Elderly Chinese Population. Clin Lab, 2020; 66.[DOI]
[14] Ma W, Cheng Y, Lee W et al. Circulating Platelet Concentration is Associated with Bone Mineral Density in Women. Arch Osteoporos, 2022; 17: 44.[DOI]
[15] Kikuchi S, Wada A, Kamihara Y et al. A Novel Mechanism for Bone Loss: Platelet Count Negatively Correlates with Bone Mineral Density via Megakaryocyte-Derived RANKL. Int J Mol Sci, 2023; 24: 121150.[DOI]
[16] Li L, Ge J, Chen J et al. Association of Bone Mineral Density with Peripheral Blood Cell Counts and Hemoglobin in Chinese Postmenopausal Women: A Retrospective Study. Medicine (Baltimore), 2020; 99: e20906.[DOI]
[17] Huang C, Tang R, Li J. Preliminary Study on the Relationship between Platelet Parameters and Osteoporosis in Postmenopausal Women. Chin J Osteoporos, 2016; 22: 5.[DOI]
[18] Kim HL, Cho HY, Park IY et al. The Positive Association between Peripheral Blood Cell Counts and Bone Mineral Density in Postmenopausal Women. Yonsei Med J, 2011; 52: 739-745.[DOI]
[19] Santos MI, Reis RL. Vascularization in Bone Tissue Engineering: Physiology, Current Strategies, Major Hurdles and Future Challenges. Macromol Biosci, 2010; 10: 12-27.[DOI]
[20] Kim J, Ha Y, Kang NH. Effects of Growth Factors From Platelet-Rich Fibrin on the Bone Regeneration. J Craniofac Surg, 2017; 28: 860-865.[DOI]
[21] Li X, Zhang J, Meng S et al. Mean Platelet Volume is Negatively Associated with Bone Mineral Density in Postmenopausal Women. J Bone Miner Metab, 2012; 30: 660-665.[DOI]
Copyright © 2024 The Author(s). This open-access article is licensed under a Creative Commons Attribution 4.0 International License (https://creativecommons.org/licenses/by/4.0), which permits unrestricted use, sharing, adaptation, distribution, and reproduction in any medium, provided the original work is properly cited.


